Perirenal adipose tissue contains a subpopulation of cold-inducible adipocytes derived from brown-to-white conversion
- Chinese Institute for Brain Research, Zhongguancun Life Science Park, China
- Peking University Academy for Advanced Interdisciplinary Studies, China
- Peking University School of Life Sciences, Peking-Tsinghua Center for Life Sciences, China
- PKU-IDG/McGovern Institute for Brain Research, China
- Department of Neuroscience, Karolinska Institute, Sweden
- Peking University School of Psychological and Cognitive Sciences, Beijing Key Laboratory of Behavior and Mental Health, China
- Department of Biosciences and Nutrition, Karolinska Institute, Sweden
Figures
Figure 1 with 2 supplements
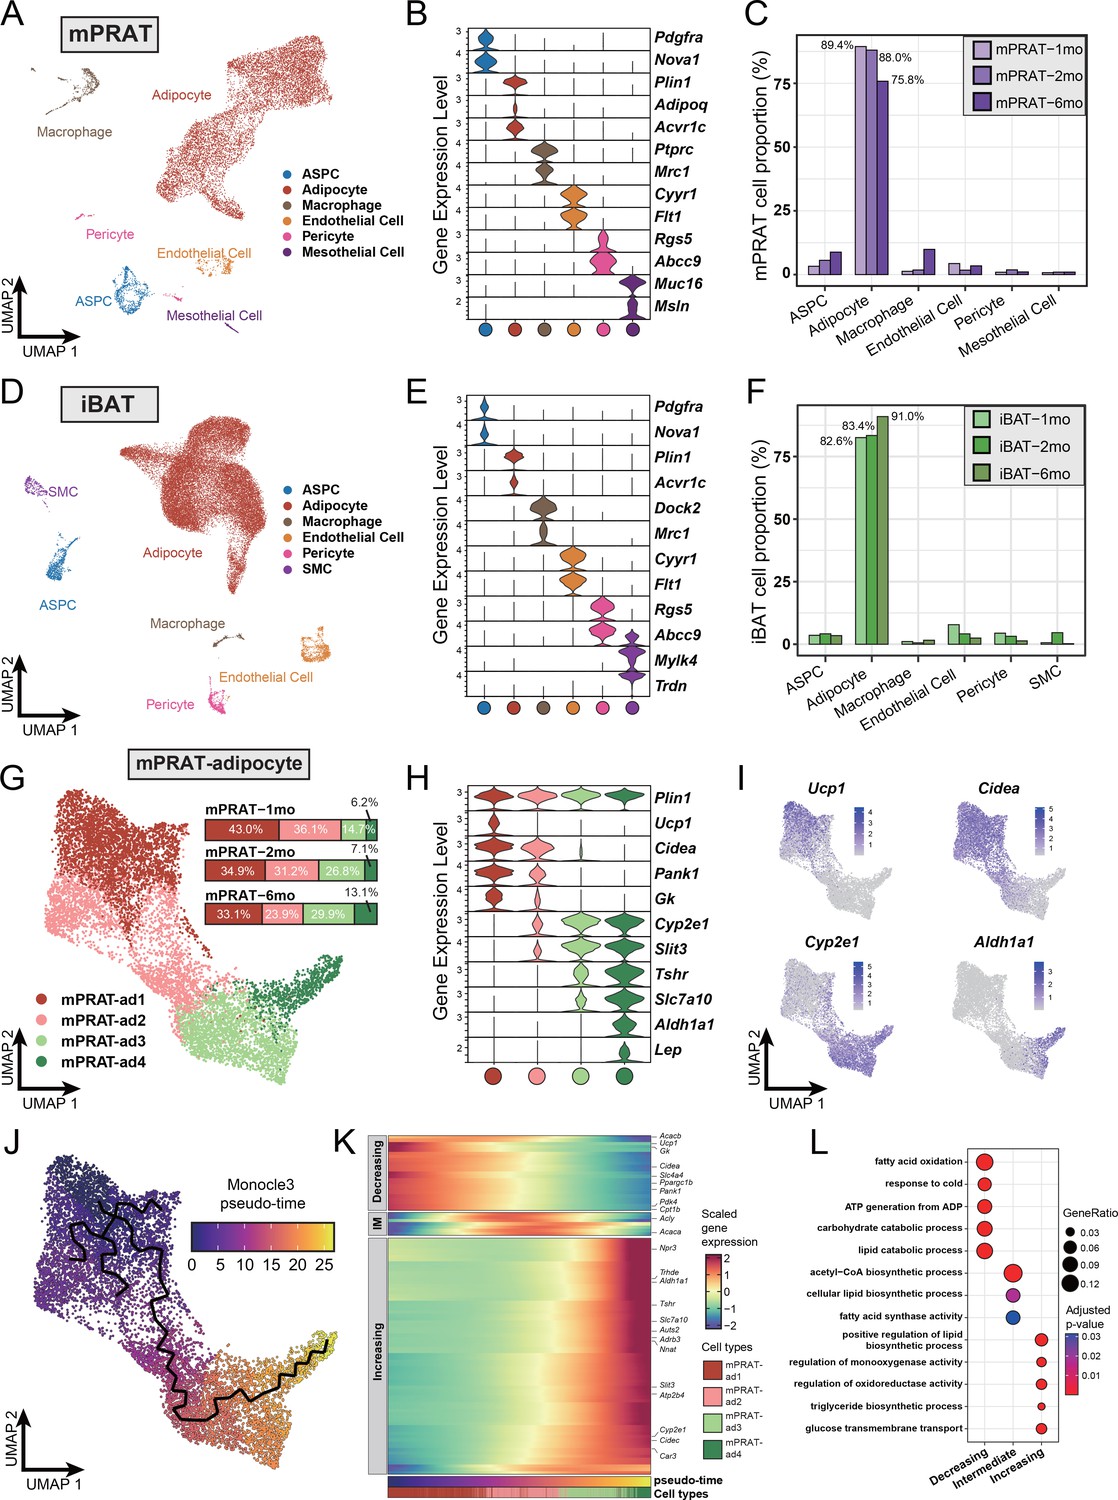
Single-nucleus RNA sequencing (snRNA-seq) reveals a unique adipocyte subpopulation and delineates a brown-to-white transition process in the medial region of perirenal adipose tissue (mPRAT) during postnatal development.
(A) Uniform Manifold Approximation and Projection (UMAP) of all cell types in mPRAT from 1-, 2-, and 6-month-old C57BL/6J male mice. A total of 11,708 nuclei were integrated, including 3342, 3608, and 4758 nuclei from 15, 12, and 8 animals for the three time points, respectively. (B) Violin plot of the marker gene expression levels of all the identified cell types in mPRAT. Expression level was log normalized for all the violin plots in the study. Cell types are represented by circles following the same color scheme in corresponding UMAP. (C) Histogram illustrating the percentage of each cell type in mPRAT relative to the total number of analyzed nuclei. (D) UMAP of all cell types in interscapular brown adipose tissue (iBAT) from 1-, 2-, and 6-month-old C57BL/6J male mice. A total of 31,079 nuclei were integrated, including 6468, 8323, and 16,288 nuclei from the same mice littler as that in mPRAT for the three time points, respectively. SMC, smooth muscle cell. (E) Violin plot of the marker gene expression levels of all the identified cell types in iBAT. (F) Histogram illustrating the percentage of each cell type in iBAT relative to the total number of analyzed nuclei. (G) UMAP and cellular composition of the adipocyte subpopulations in mPRAT from three time points. (H) Violin plot of the marker gene expression levels of each mPRAT adipocyte subpopulation. (I) Ucp1, Cidea, Cyp2e1, and Aldh1a1 expression pattern in the mPRAT adipocyte subpopulations. Scale bar represents log normalized gene expression levels. (J) Monocle 3 trajectory map of the mPRAT adipocyte subpopulations. (K) Heat map of differentially expressed genes (DEGs) along the pseudo-time trajectory in (J). Genes were selected by Moran’s I test in Monocle 3 with a threshold larger than 0.2. Representative genes were highlighted. Adipocytes were aligned along the increasing pseudo-timeline and plotted using Z-scaled gene expression. Gene module patterns, including decreasing, intermediate (IM), and increasing, were determined using k-means clustering (k = 3). (L) Gene ontology (GO) analysis of DEGs from each module in (K). Color and size of each circle represent the adjusted p-value by Benjamini and Hochberg method and the gene ratio within each module, respectively.
Figure 1—figure supplement 1
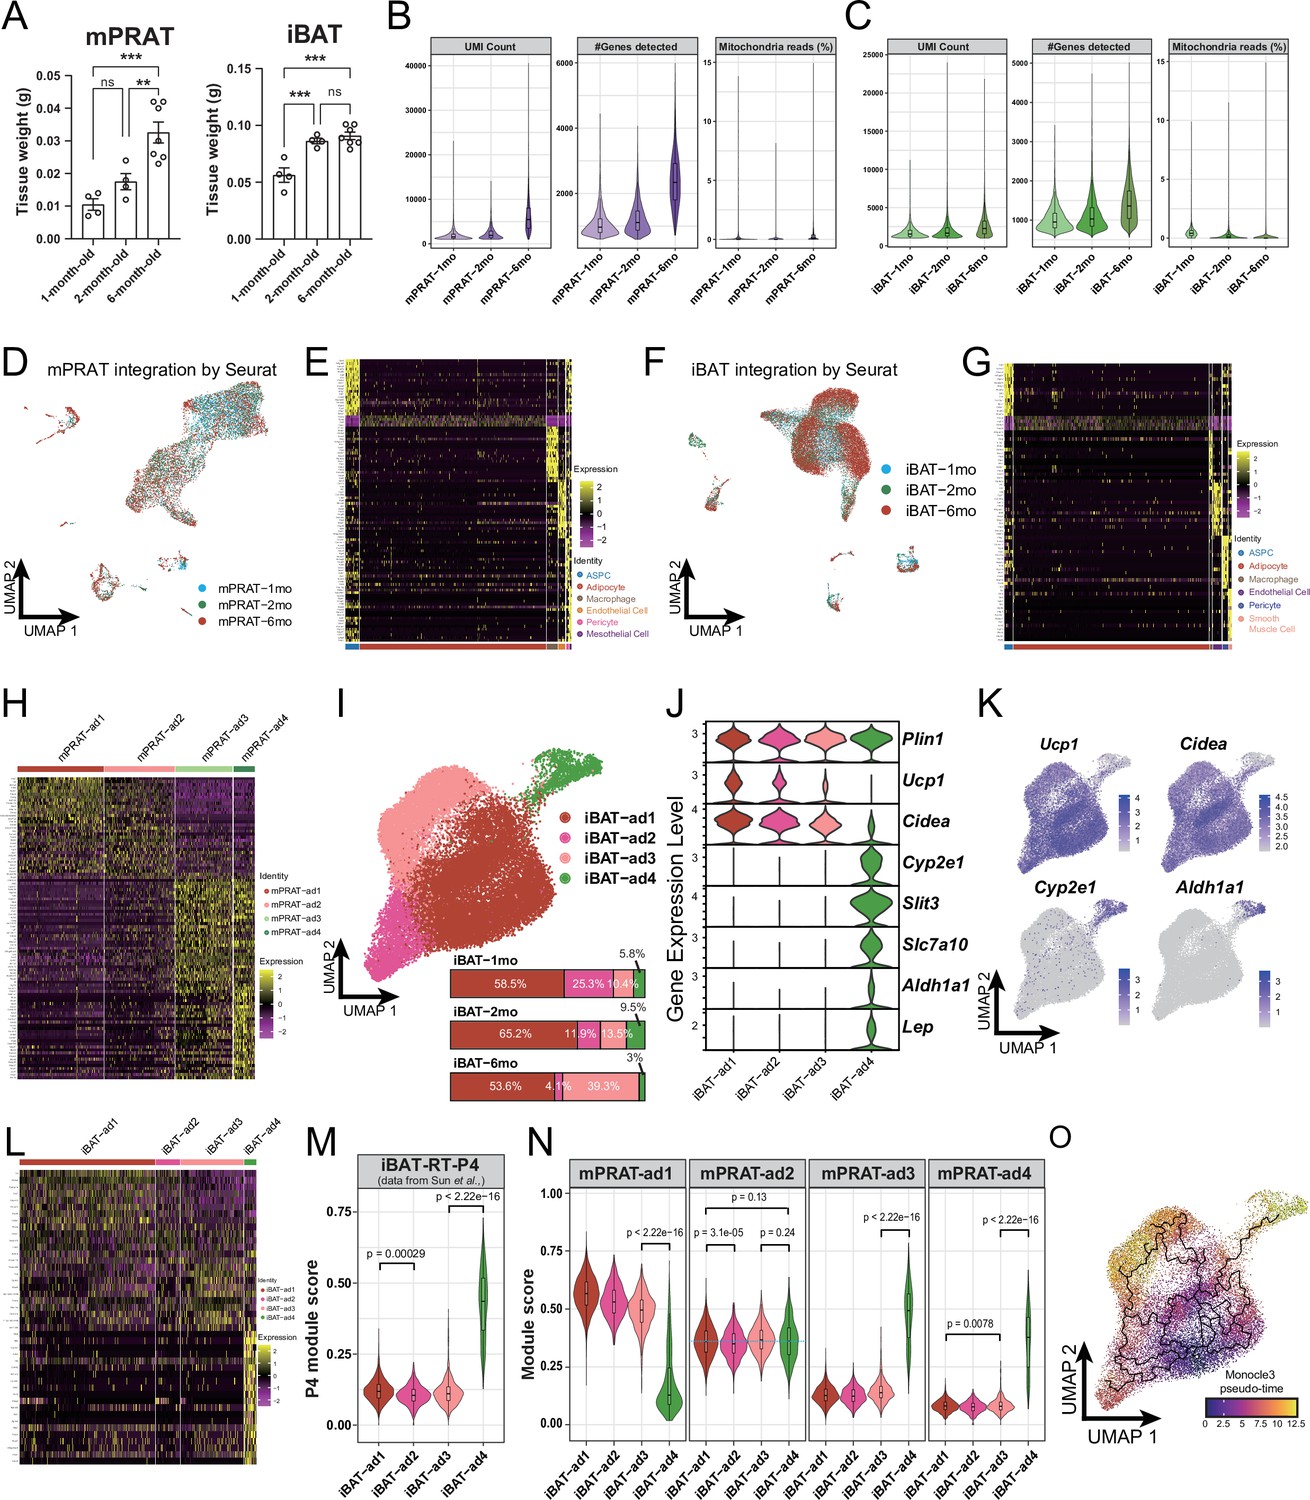
Tissue weight, quality control, and additional analysis on the single-nucleus RNA sequencing (snRNA-seq) data obtained from the medial region of perirenal adipose tissue (mPRAT) and interscapular brown adipose tissue (iBAT) of 1-, 2-, and 6-month-old C57BL/6J male mice.
(A) mPRAT and iBAT weight at 1, 2, and 6 months old. n = 4–7 mice per time point, represented by a dot in the graph. ns, nonsignificant; **p<0.01; ***p<0.001 by one-way ANOVA. (B, C) Quality metrices showing UMI counts, number of detected genes, and percentage of sequencing reads from mitochondria of the mPRAT (B) and iBAT (C) datasets. (D, F) Uniform Manifold Approximation and Projection (UMAP) of integrated mPRAT (D) and iBAT (F) datasets. Same landscapes as in Figure 1A for mPRAT and Figure 1D for iBAT were used. Cells were colored based on different time points to indicate the overall unbiased integration by Seurat v4. (E, G, H, L) Heat map of the top 20 marker gene expression levels of all cell types in mPRAT (E), iBAT (G), mPRAT adipocytes (H), and iBAT adipocytes (L). (I) UMAP and cellular composition of the adipocyte subpopulations in iBAT of 1-, 2-, and 6-month-old C57BL/6J male mice. (J) Violin plot of the marker gene expression levels of each iBAT adipocyte subpopulation. (K) Ucp1, Cidea, Cyp2e1, and Aldh1a1 expression pattern in the iBAT adipocyte subpopulations. (M, N) Cell identity comparison by gene module analysis between iBAT-ad4 and the P4 subpopulation identified in Sun et al., 2020 (M), and the mPRAT and iBAT adipocyte subpopulations (N). Top 50 marker genes from each reference cell type were selected as a module to calculate the module score of each target cell. Statistical differences in gene module scores were determined by one-way ANOVA and the corresponding p-values are presented in the graph. (O) Monocle 3 trajectory map of the iBAT adipocyte subpopulations.
Figure 1—figure supplement 2
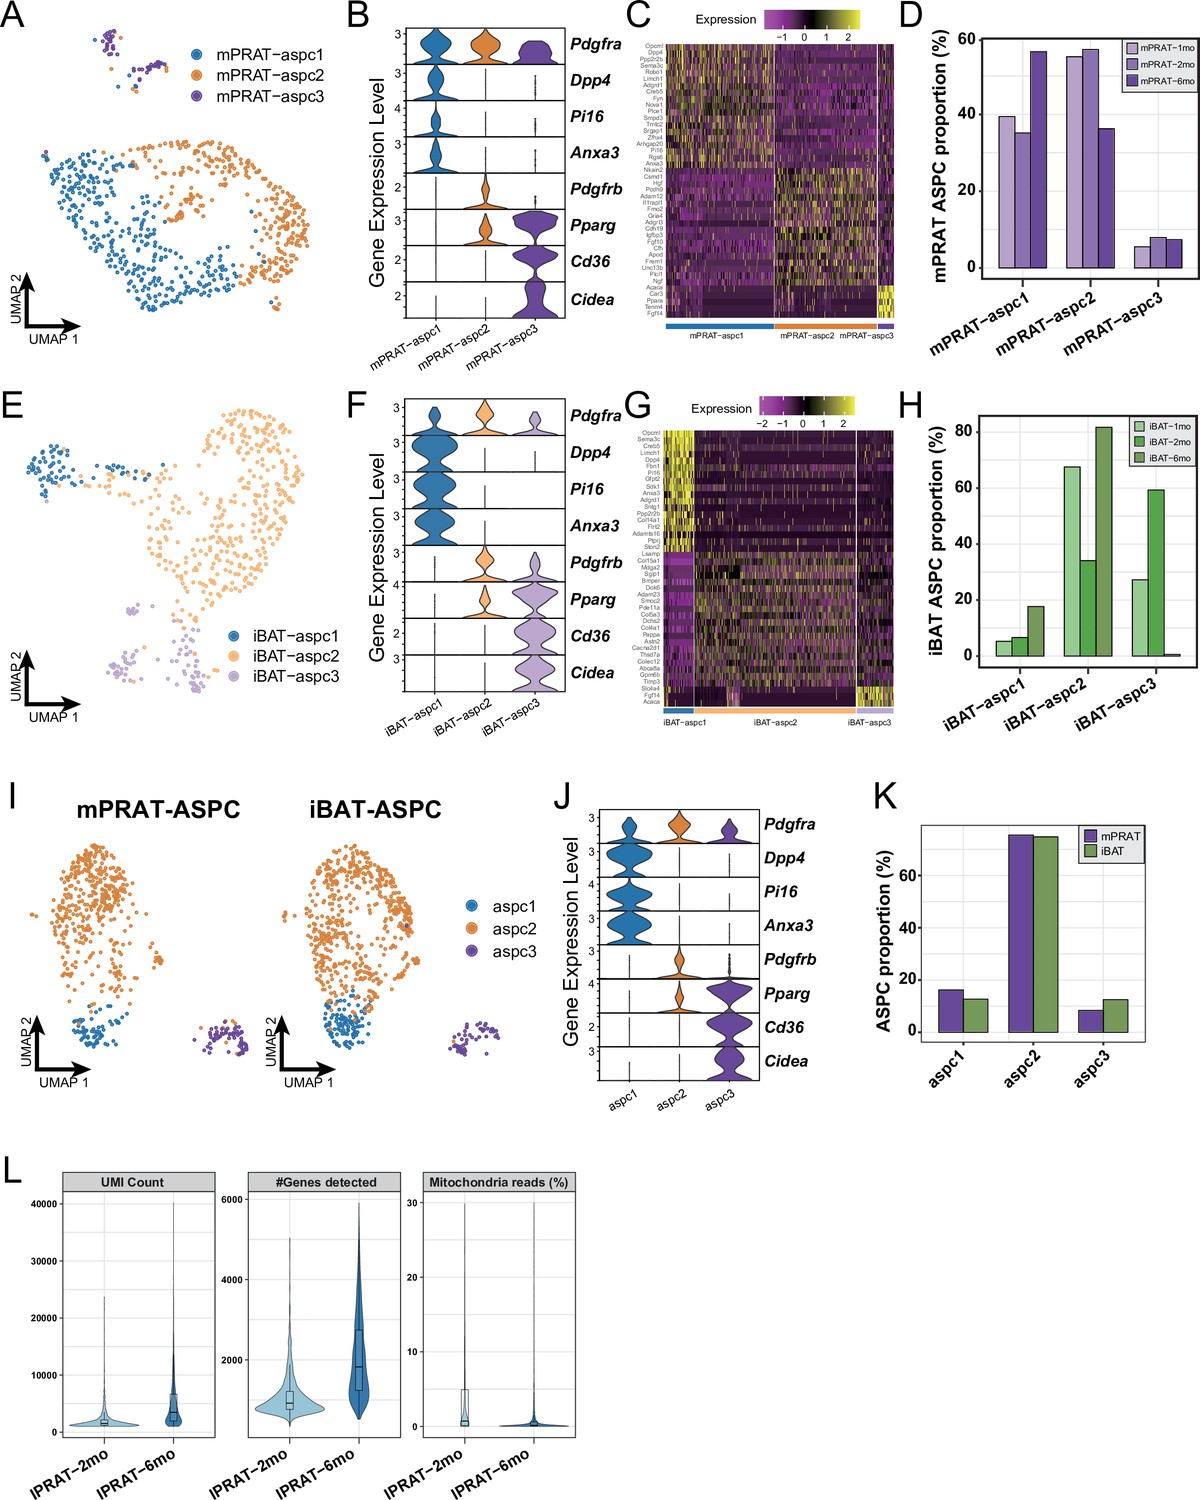
Analysis on the adipose stem and progenitor cell (ASPC) population of the medial region of perirenal adipose tissue (mPRAT) and interscapular brown adipose tissue (iBAT) and quality control of the lateral region of PRAT (lPRAT) datasets.
(A, E) Uniform Manifold Approximation and Projection (UMAP) of the ASPC subpopulations in mPRAT (A) and iBAT (E) of 1-, 2-, and 6-month-old C57BL/6J male mice. (B, F) Violin plot of the marker gene expression levels of each ASPC subpopulation in mPRAT (B) and iBAT (F). (C, G) Heat map of the top 20 marker gene expression levels of each ASPC subpopulation in mPRAT (C) and iBAT (G). (D, H) Histogram illustrating the percentage of each ASPC subpopulation in mPRAT (D) and iBAT (H) relative to the total ASPC number. (I) Merged clusters of mPRAT and iBAT ASPC populations. (J) Violin plot of the marker gene expression levels of each ASPC subpopulation in merged mPRAT and iBAT ASPC populations. (K) Histogram illustrating the percentage of each ASPC subpopulation in merged mPRAT and iBAT ASPC populations. (L) Quality metrices showing UMI counts, number of detected genes, and percentage of sequencing reads from mitochondria of the lPRAT datasets.
Figure 2
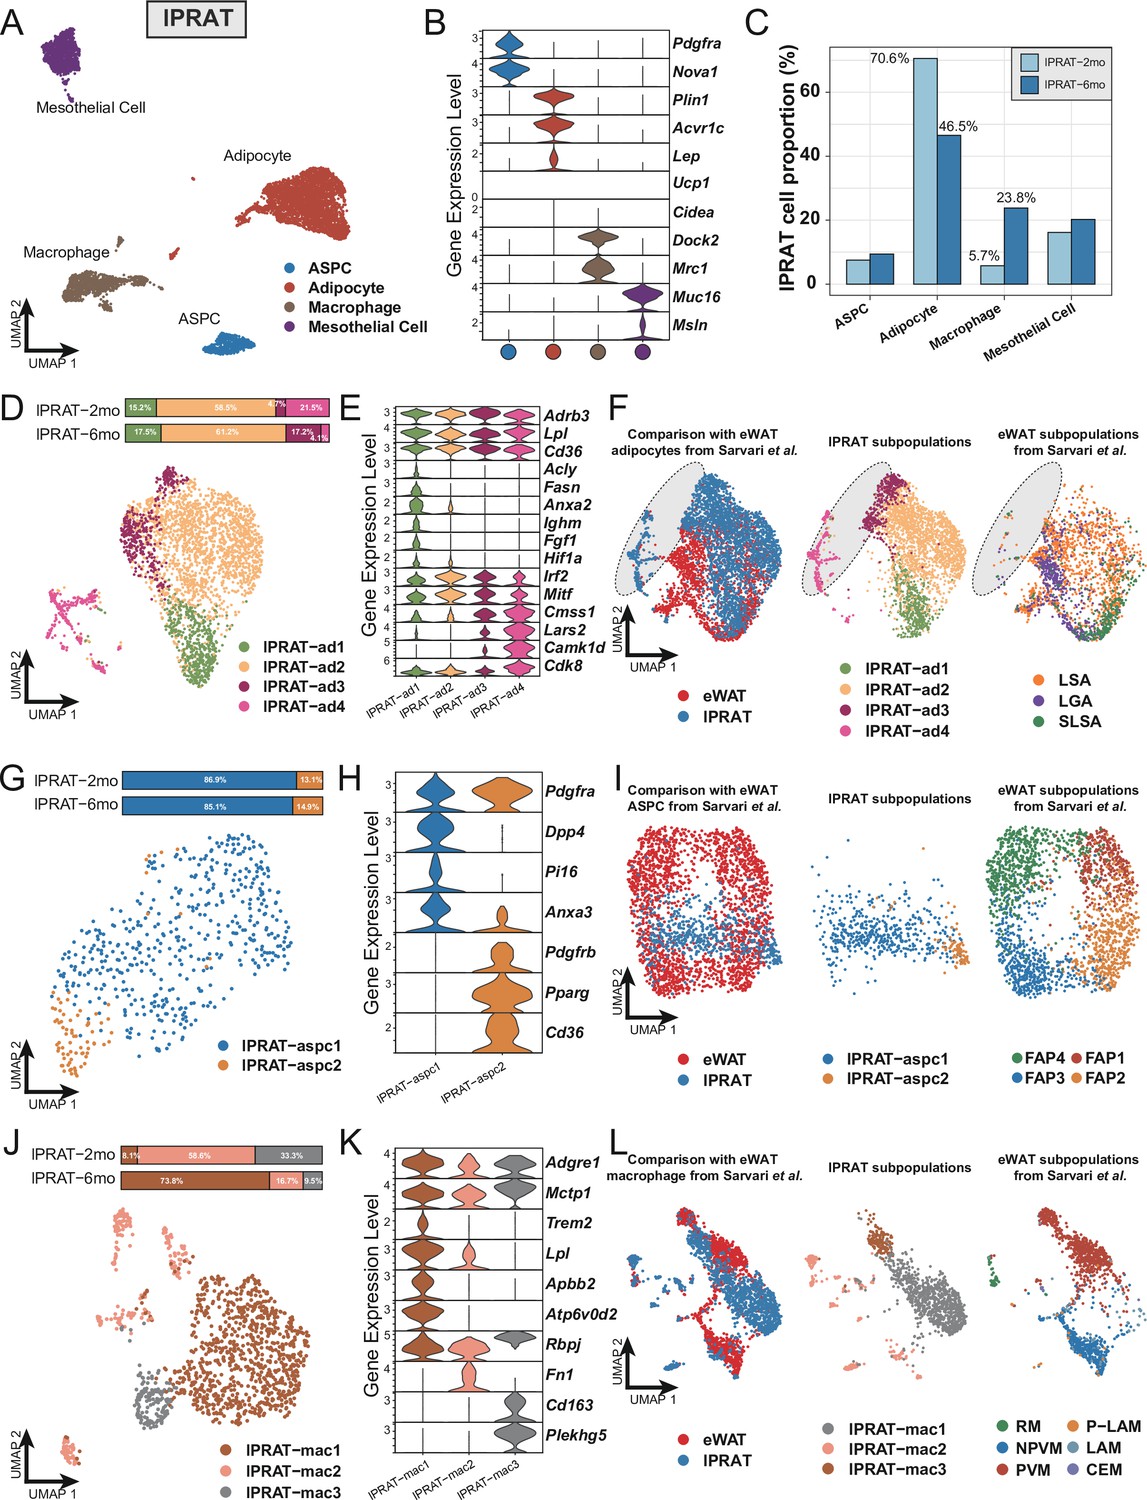
Lateral region of perirenal adipose tissue (lPRAT) has distinct cellular composition compared with epididymal white adipose tissue (eWAT).
(A) Uniform Manifold Approximation and Projection (UMAP) of all cell types in lPRAT from 2- and 6-month-old C57BL/6J male mice. A total of 6048 nuclei were analyzed, including 1428 and 4620 nuclei for the two time points, respectively. (B) Violin plot of the marker gene expression levels of all cell types in lPRAT. (C) Histogram illustrating the percentage of each cell type in lPRAT relative to the total number of analyzed nuclei. (D, G, J) UMAP and cellular composition of the adipocyte (D), adipose stem and progenitor cell (ASPC) (G), and macrophage (J) subpopulations in lPRAT. (E, H, K) Violin plot of the marker gene expression levels of each adipocyte (E), ASPC (H), and macrophage (K) subpopulation in lPRAT. (F, I, L) Merged clusters of lPRAT adipocytes (F), ASPCs (I), and macrophages (L) with the corresponding clusters in Sárvári et al., 2021. Gray oval shape in (F) highlights the unique adipocyte subpopulation in lPRAT. LSA, lipid-scavenging adipocyte; LGA, lipogenic adipocyte; SLSA, stressed lipid-scavenging adipocyte. RM, regulatory macrophage; NPVM, non-perivascular macrophage; PVM, perivascular macrophage; LAM, lipid-associated macrophage; P-LAM, proliferating LAM; CEM, collagen-expressing macrophage.
Figure 3 with 1 supplement
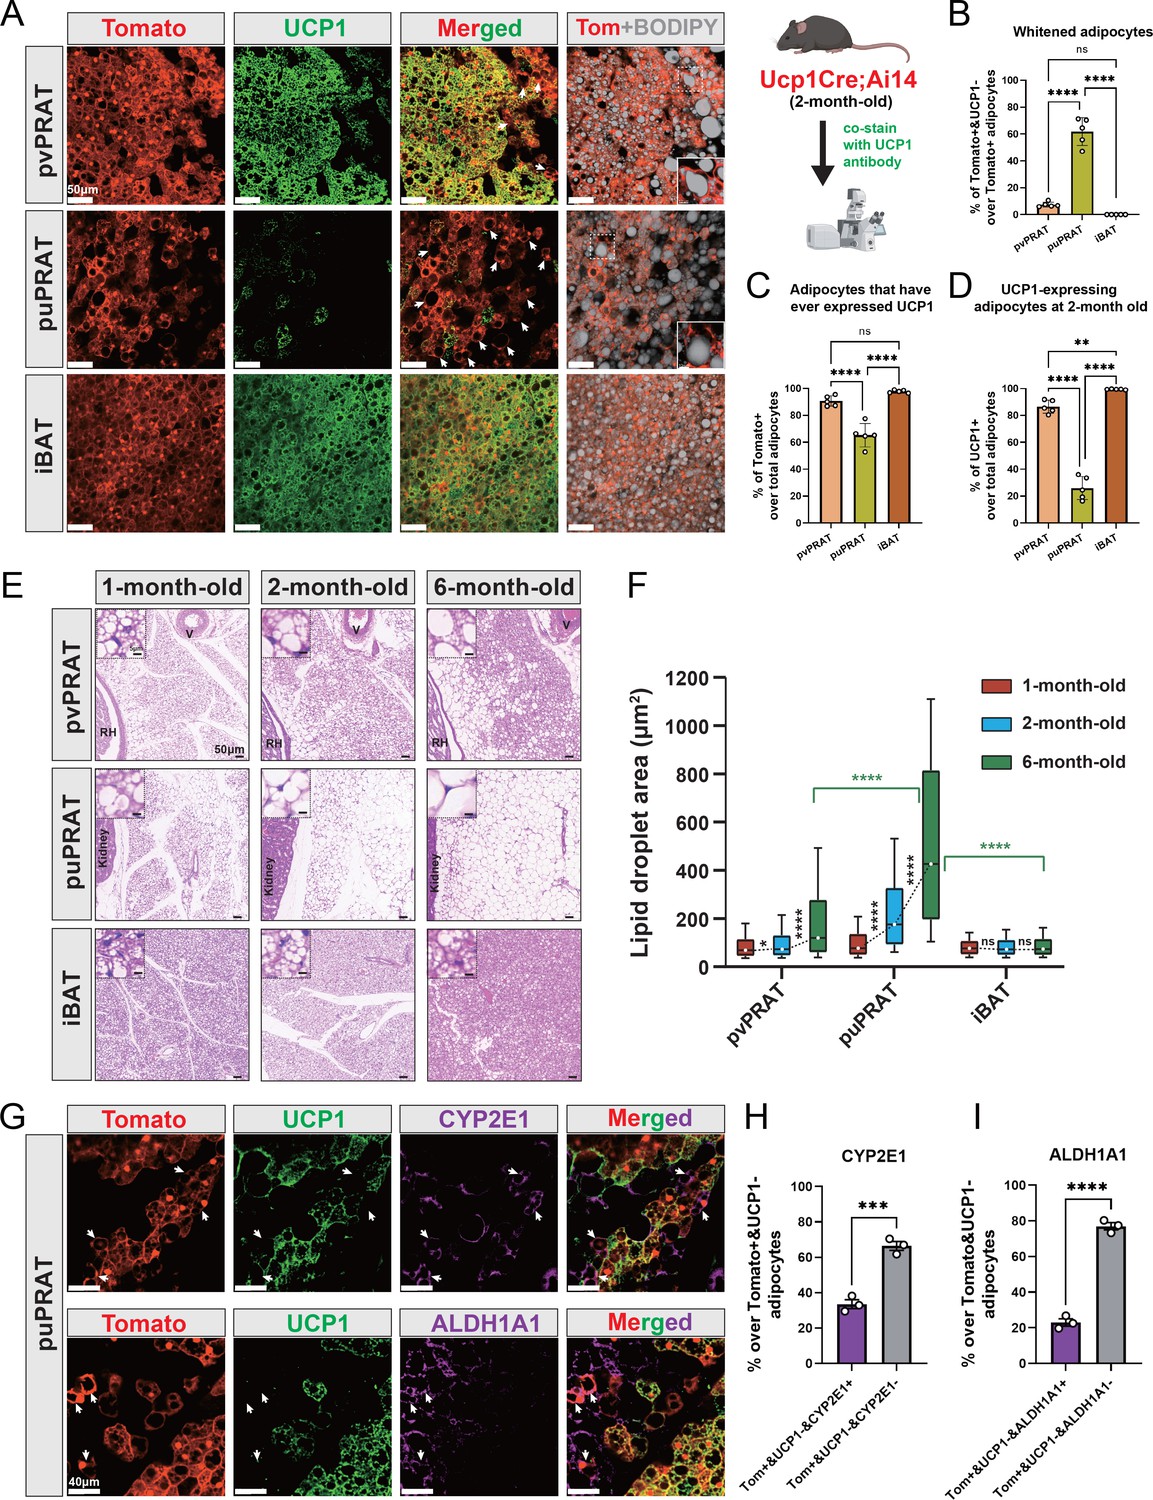
Periureter perirenal adipose tissue (puPRAT) contains majority of the whitened brown adipocytes (BAs).
(A) Representative immunofluorescence images of tdTomato (red) and UCP1 (green) expression in perivascular PRAT (pvPRAT) , puPRAT, and interscapular brown adipose tissue (iBAT) of 2-month-old Ucp1Cre;Ai14 male mice. Whitened adipocytes are marked with Tomato expression, but not UCP1 (white arrows). Lipid droplets were stained with BODIPY (gray). Insets highlight the whitened adipocytes with relatively large lipid droplet size. Scale bar, 50 µm. (B–D) Quantification of the percentage of Tomato+&UCP1- (B), Tomato+ (C), and UCP1+ (D) cells in (A). n = 5 mice for each tissue, represented by a dot in the graph. Three tissue slices were quantified for each mouse for all analysis in the study. Bars represent mean± SD for all analysis in the study. **p<0.01; ****p<0.0001 by one-way ANOVA. (E) Representative hematoxylin and eosin (HE) images of pvPRAT, puPRAT, and iBAT of 1-, 2-, and 6-month-old C57BL/6J male mice. Scale bar, 50 µm. V, blood vessel; RH, renal hilum. (F) Quantification of the lipid droplet size in (E). A total of 3082–4857 adipocytes from 4 to 6 mice were quantified for each tissue. Boxplot shows the area distribution of all lipid droplets where the whiskers show the 10–90 percentile. *p<0.05; ****p<0.0001 by two-way ANOVA. (G) Representative immunofluorescence images of tdTomato (red), UCP1 (green), and CYP2E1/ALDH1A1 (magenta) expression in puPRAT of 2-month-old Ucp1Cre;Ai14 male mice. Tomato+&UCP1-&CYP2E1+ and Tomato+&UCP1-&ALDH1A1+ cells represent the whitened adipocytes that became mPRAT-ad3 and 4 adipocytes (white arrows). Scale bar, 40 µm. (H and I) Quantification of the percentage of Tomato+&UCP1-&CYP2E1+ (H) and Tomato+&UCP1-&ALDH1A1+ cells (I) in (G). n = 3 mice for each tissue, represented by a dot in the graph. Bars represent mean ± SD. ***p<0.001; ****p<0.0001 by unpaired t-test.
Figure 3—figure supplement 1
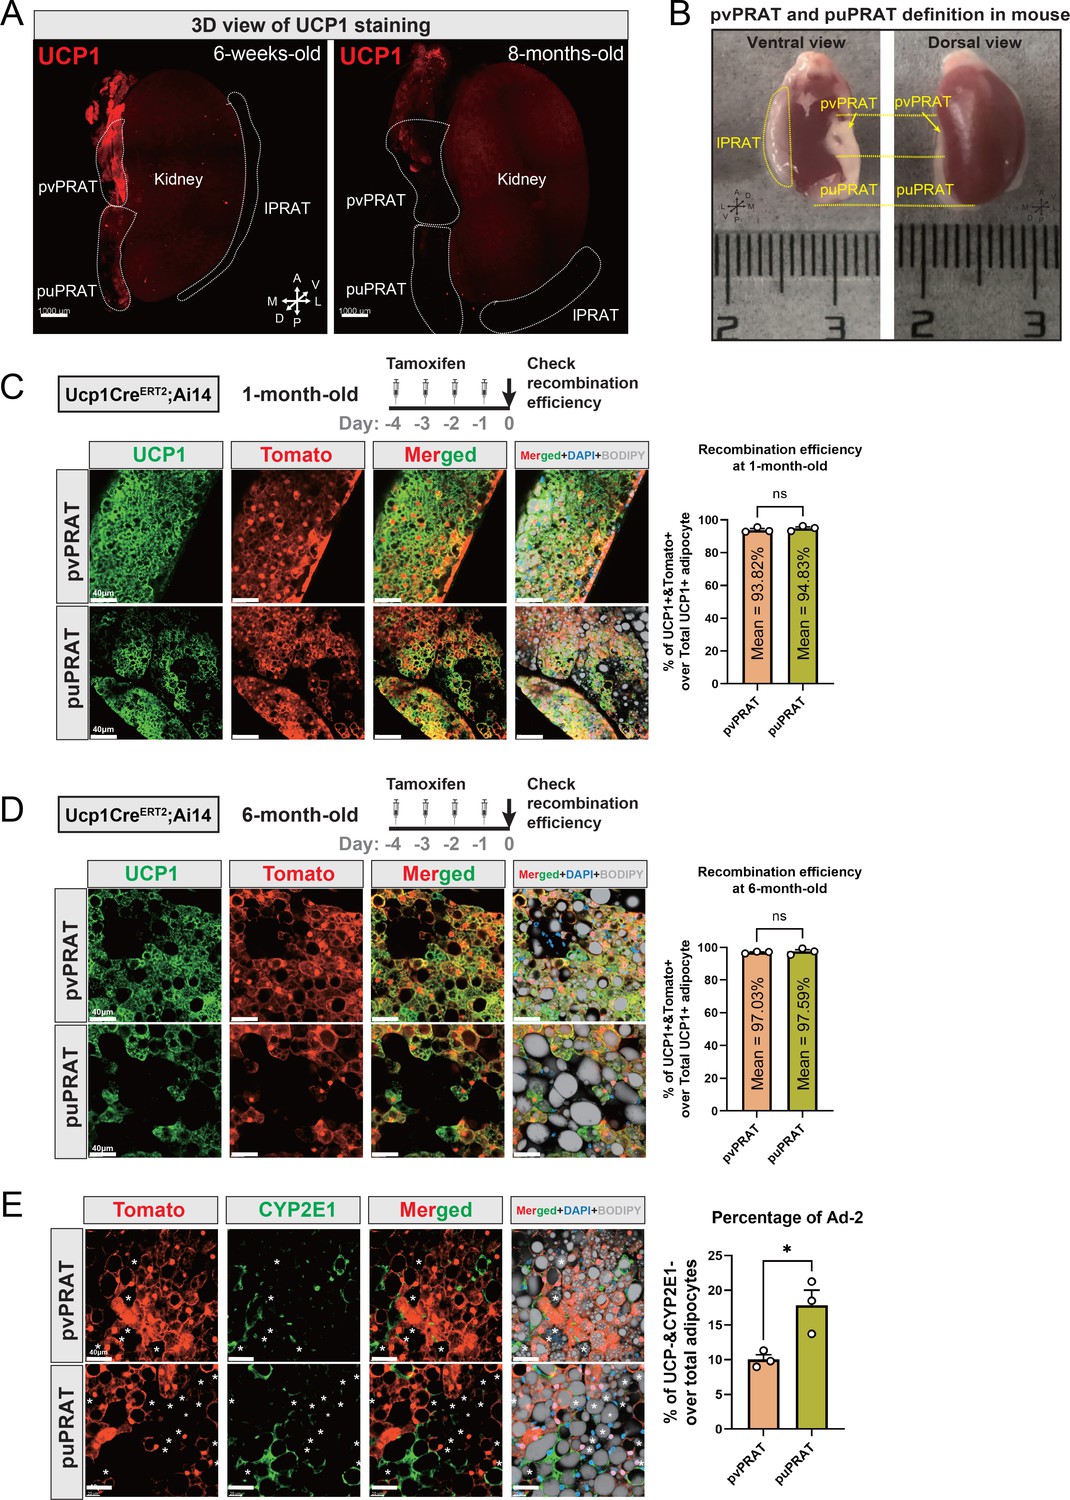
Difference in adipocyte composition between perivascular perirenal adipose tissue (pvPRAT) and periureter PRAT (puPRAT).
(A) Whole-tissue immunostaining of UCP1 in PRAT of 6-week-old and 8-month-old C57BL/6J male mice using the ImmuView method. Scale bar, 1000 µm. A, anterior; P, posterior; D, dorsal; V, ventral; L, lateral; M, medial. (B) Illustration photos of the definition of pvPRAT and puPRAT. (C, D) Ucp1CreERT2 labeled over 90% of the brown adipocytes in pvPRAT and puPRAT of 1- and 6-month-old mice. Tissues were collected 1 d after the last tamoxifen injection and all Tomato+ cells were stained by UCP1 antibody. n = 3 mice, represented by a dot in the graph. Scale bar, 40 µm. (E) puPRAT had higher proportion of mPRAT-ad2 cells than pvPRAT. The Tomato-&CYP2E1-&BODIPY+ mPRAT-ad2 cells are highlighted by asterisks. n = 3 mice, represented by a dot in the graph. Scale bar, 40 µm.
Figure 4 with 1 supplement
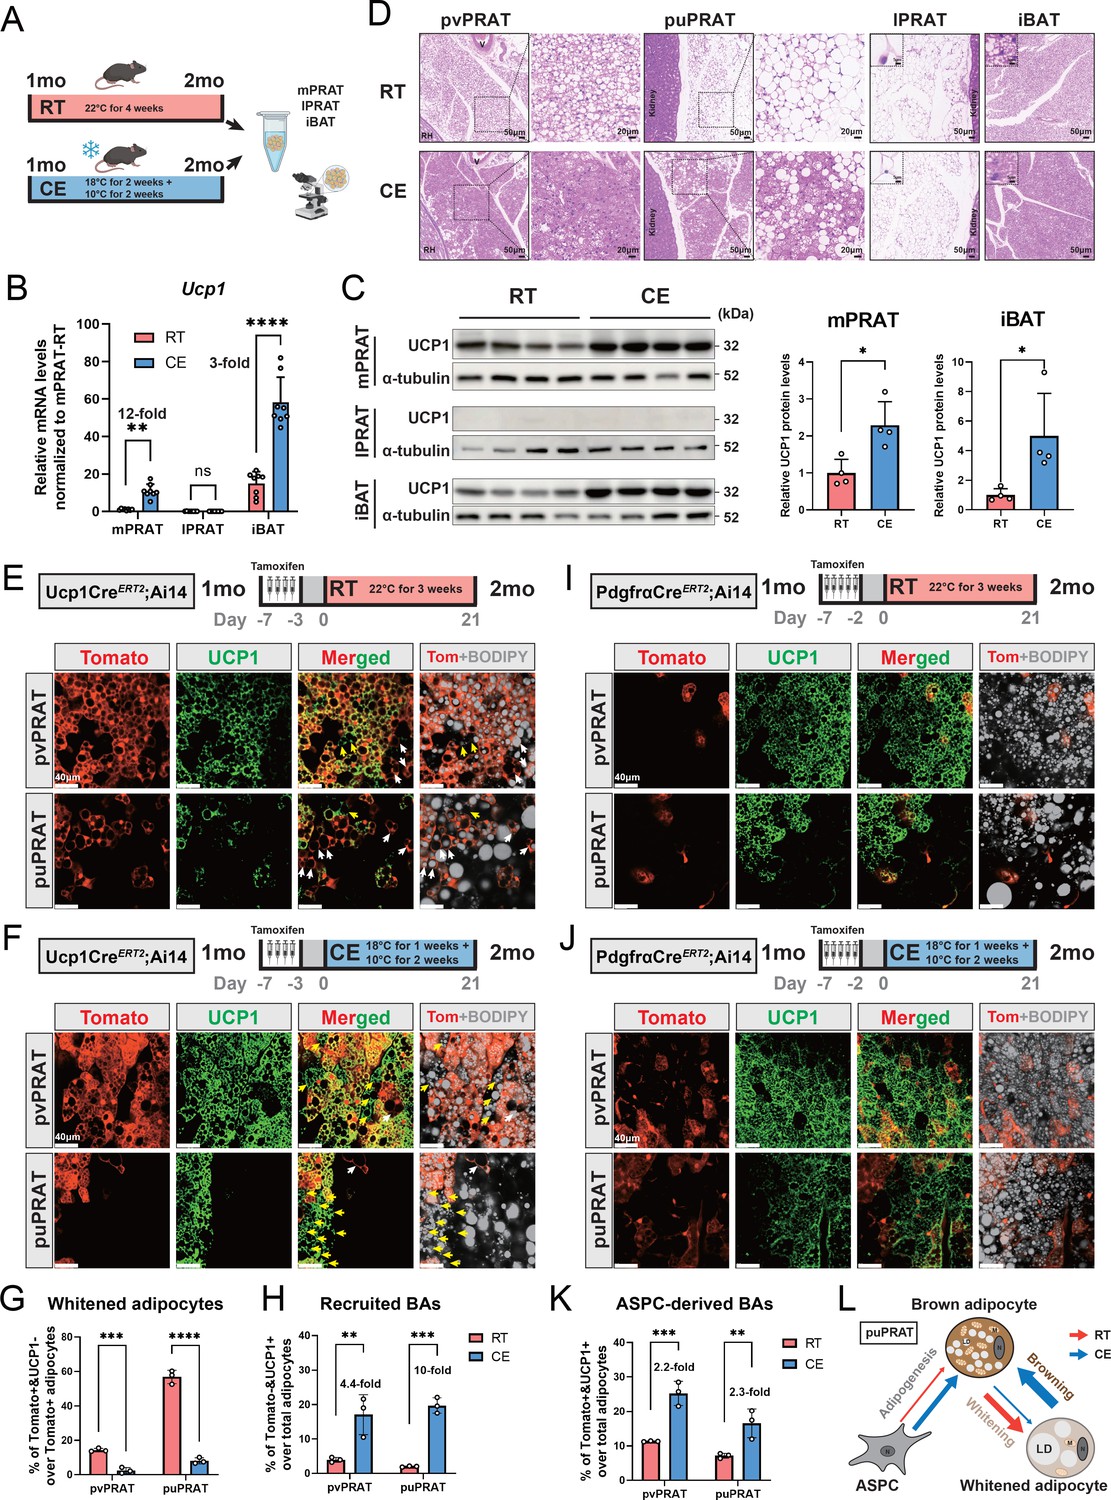
Cold exposure inhibits brown adipocyte (BA) whitening and restores UCP1 expression in UCP1- adipocytes of the medial region of perirenal adipose tissue (mPRAT).
(A) Illustration of the cold exposure (CE) experimental design. (B) qPCR analysis of Ucp1 mRNA level in mPRAT, lateral region of PRAT (lPRAT), and interscapular brown adipose tissue (iBAT) of 2-month-old C57BL/6J male mice in (A). n = 8 mice for each condition, represented by a dot in the graph. **p<0.01; ****p<0.0001 by one-way ANOVA. (C) Western blot and quantification of UCP1 protein level in mPRAT and iBAT of 2-month-old C57BL/6J male mice in (A). n = 4 mice for each condition, represented by a dot in the graph. *p<0.05 by unpaired t-test. (D) Representative HE images of perivascular PRAT (pvPRAT), periureter PRAT (puPRAT), lPRAT, and iBAT of 2-month-old C57BL/6J male mice in (A). Insets highlight the changes in lipid droplet size. Scale bar, 50 µm. (E, F) Representative immunofluorescence images of tdTomato (red) and UCP1 (green) expression in pvPRAT and puPRAT of 2-month-old Ucp1CreERT2;Ai14 male mice kept under room temperature (RT) (E) or CE (F) condition. Tamoxifen was injected at 1-month-old to trace the UCP1-expressing cells. Tomato+&UCP1- cells represent the population that is whitened during the 1- to 2-month-old tracing period (white arrows). Tomato-&UCP1+ cells represent the recruited BAs (yellow arrows). Scale bar, 40 µm. (G, H) Quantification of the percentage of whitened adipocytes (Tomato+&UCP1-) (G) and recruited BAs (Tomato-&UCP1+) (H) in (E, F). n = 3 mice for each tissue, represented by a dot in the graph. **p<0.01; ***p<0.001; ****p<0.0001 by two-way ANOVA. (I, J) Representative immunofluorescence images of tdTomato (red) and UCP1 (green) expression in pvPRAT and puPRAT of 2-month-old PdgfraCreERT2;Ai14 male mice kept under RT (I) or CE (J) condition. Tamoxifen was injected at 1-month-old to trace the Pdgfra-expressing cells. Scale bar, 40 µm. (K) Quantification of the percentage of adipose stem and progenitor cell (ASPC)-derived BAs (Tomato+&UCP1+) in (I, J). n = 3 mice for each tissue, represented by a dot in the graph. **p<0.01; ***p<0.001 by two-way ANOVA. (L) Illustration of the differential cellular contributions to the cold-recruited adipocytes in puPRAT. CE activated ASPC-derived BA adipogenesis and browning of whitened adipocytes, while preventing BA whitening. N, nucleus; M, mitochondria; LD, lipid droplet.
-
Figure 4—source data 1
Original files of the full raw unedited blots of Figure 4C.
- https://cdn.elifesciences.org/articles/93151/elife-93151-fig4-data1-v1.zip
-
Figure 4—source data 2
Figures with the uncropped blots of Figure 4C.
- https://cdn.elifesciences.org/articles/93151/elife-93151-fig4-data2-v1.zip
Figure 4—figure supplement 1
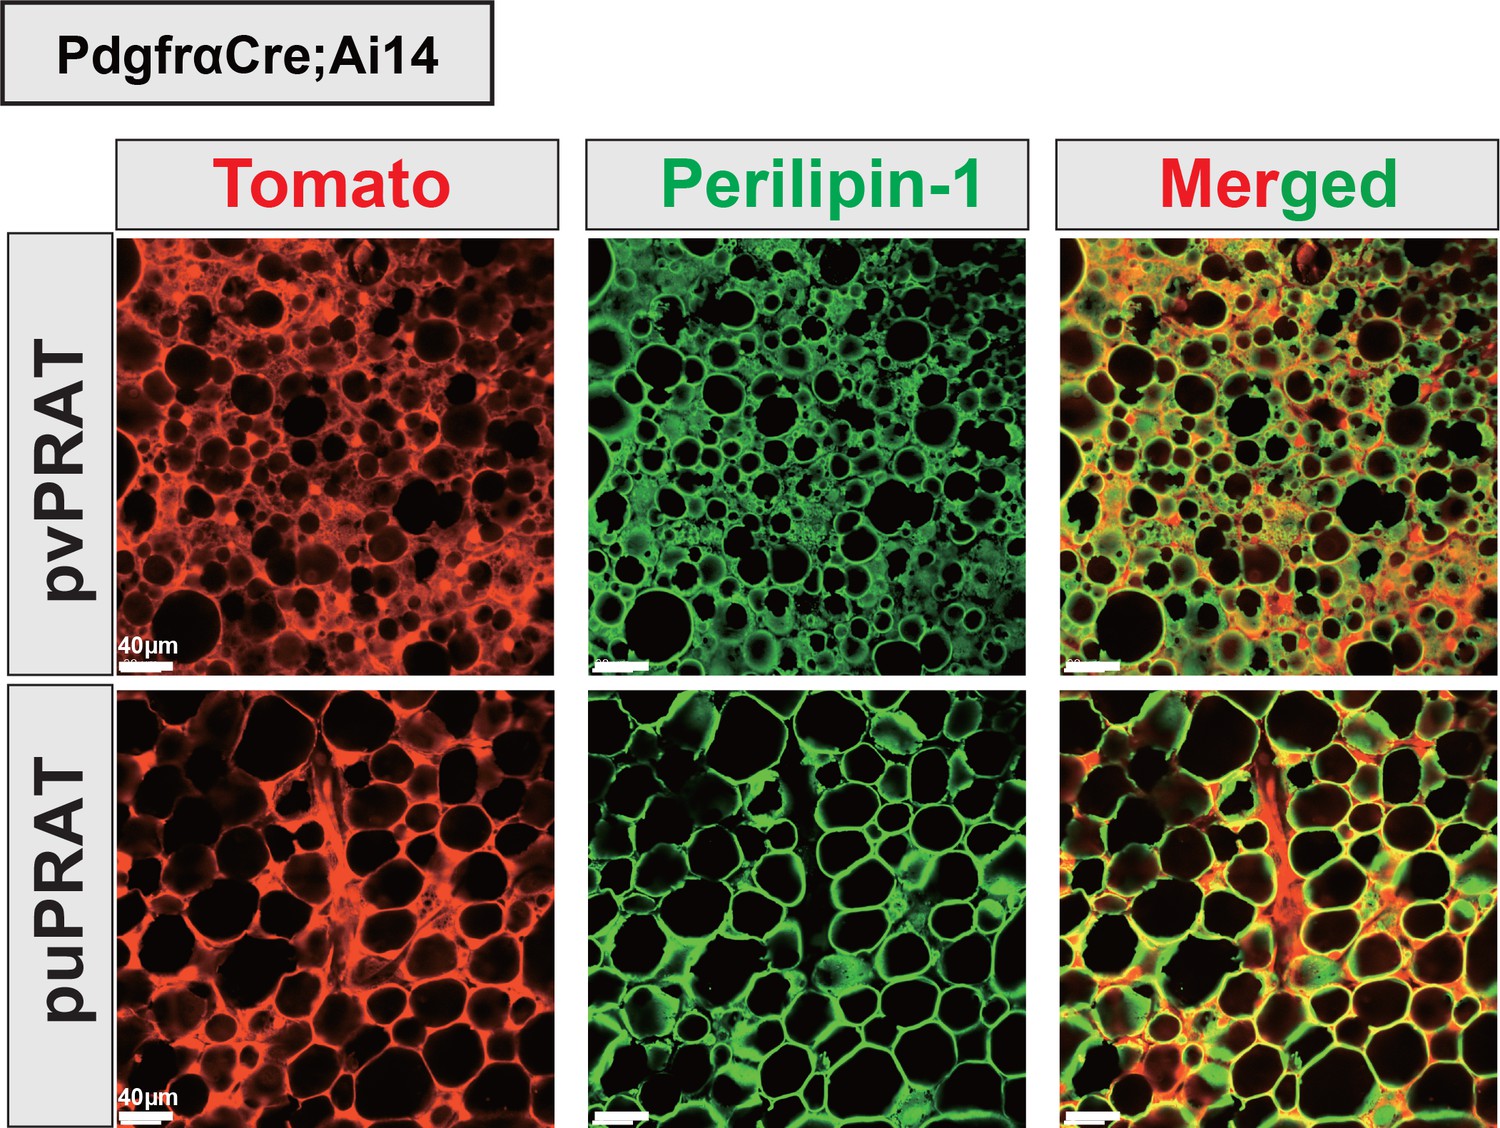
Medial region of perirenal adipose tissue (mPRAT) adipocytes are entirely derived from Pdgfra-expressing cells.
Perivascular PRAT (pvPRAT) and periureter PRAT (puPRAT) of the PdgfraCre;Ai14 mice showed 100% overlap between tdTomato signal and PLIN1 staining. A total of 832 and 628 adipocytes in pvPRAT and puPRAT of two animals were examined. Scale bar, 40 µm.
Figure 5 with 1 supplement
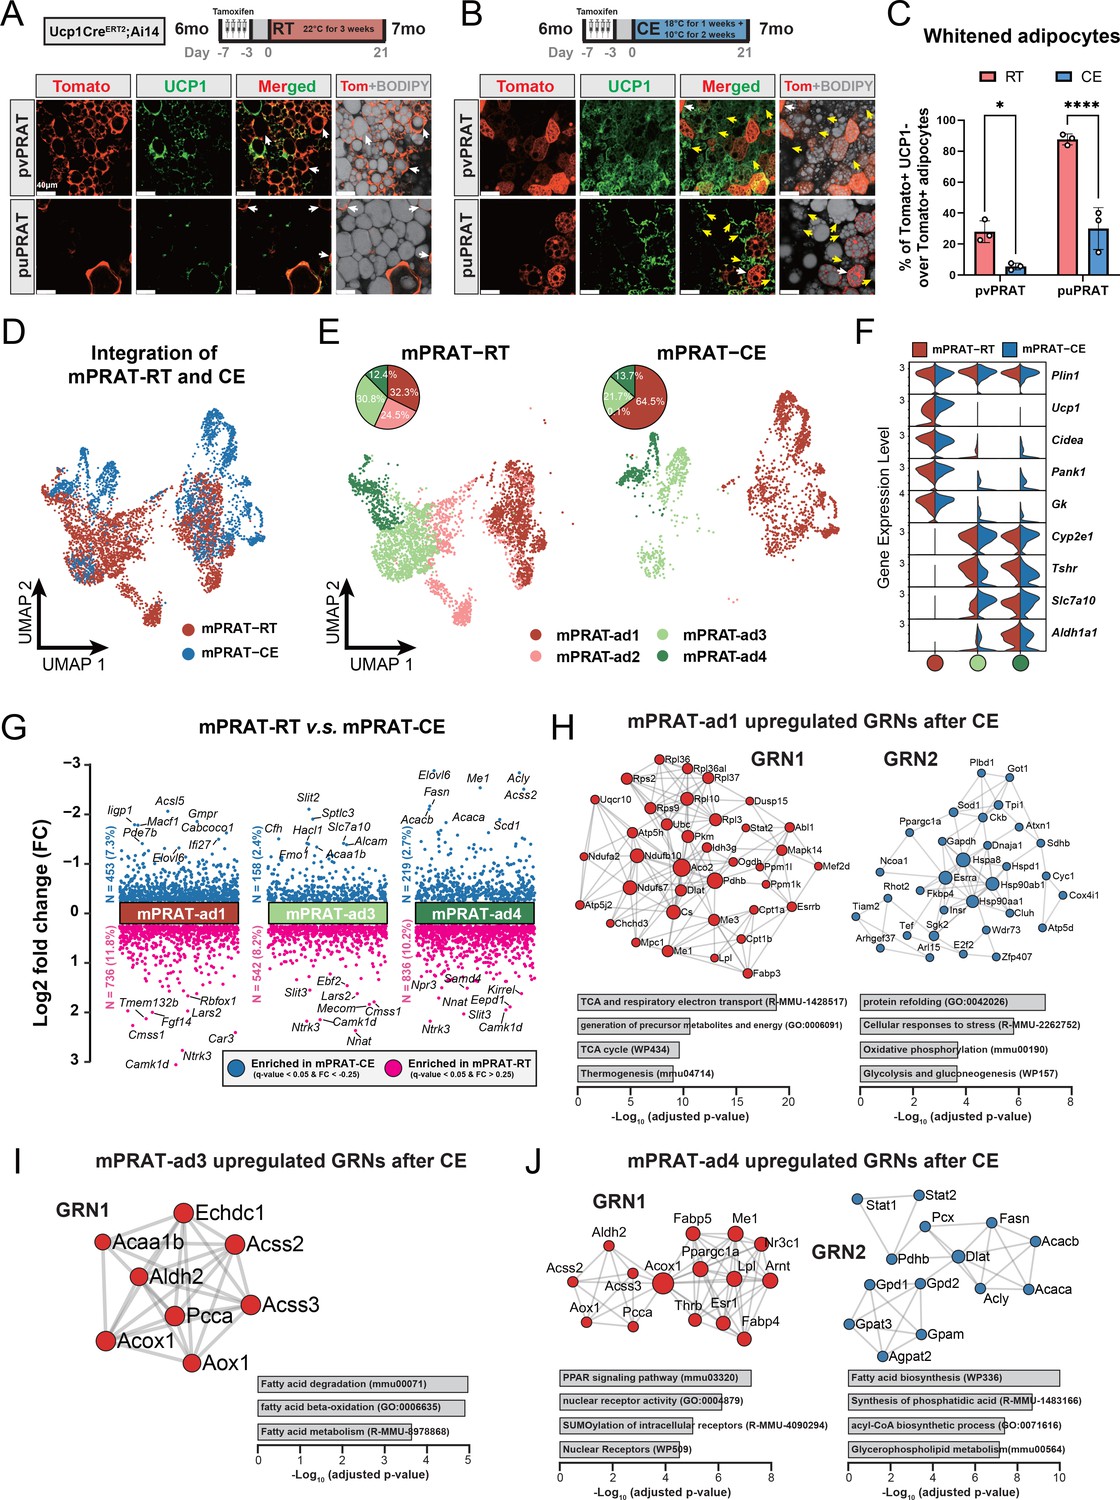
mPRAT-ad2 is the major cold-recruitable adipocyte in the medial region of perirenal adipose tissue (mPRAT).
(A, B) Representative immunofluorescence images of tdTomato (red) and UCP1 (green) expression in perivascular PRAT (pvPRAT) and periureter PRAT (puPRAT) of 7-month-old Ucp1CreERT2;Ai14 male mice. Tamoxifen was injected at 6 months old to trace the UCP1-expressing cells. Tomato+&UCP1- cells represent the population that is whitened during the 6- to 7-month-old tracing period (white arrows). Tomato-&UCP1+ cells represent the recruited brown adipocytes (BAs) (yellow arrows). Scale bar, 40 µm. (C) Quantification of the percentage of whitened BAs (Tomato+&UCP1-) in (A, B). n = 3 mice for each tissue, represented by a dot in the graph. *p<0.05; ****p<0.0001 by two-way ANOVA. (D, E) Integrated (D) and separated (E) Uniform Manifold Approximation and Projection (UMAP) of all cell types in mPRAT of 6-month-old C57BL/6J male mice kept under room temperature (RT) or cold exposure (CE) condition. A total of 5636 nuclei were integrated, including 3618 and 2018 nuclei from eight and eight animals for the two conditions, respectively. (F) Violin plot of the marker gene expression levels of each mPRAT adipocyte subpopulation under RT or CE condition. (G) Differentially expressed genes (DEGs) of each adipocyte subpopulation under RT or CE condition. The top eight genes with the highest fold change (FC) are labeled. (H–J) Gene regulatory network (GRN) and functional pathway enrichment comparison between RT and CE conditions within each of the mPRAT-ad1, mPRAT-ad2, and mPRAT-ad3 subpopulations. Bar graphs illustrate the most enriched functional pathways according to the GO, KEGG, Reactome, and WikiPathways databases.
Figure 5—figure supplement 1
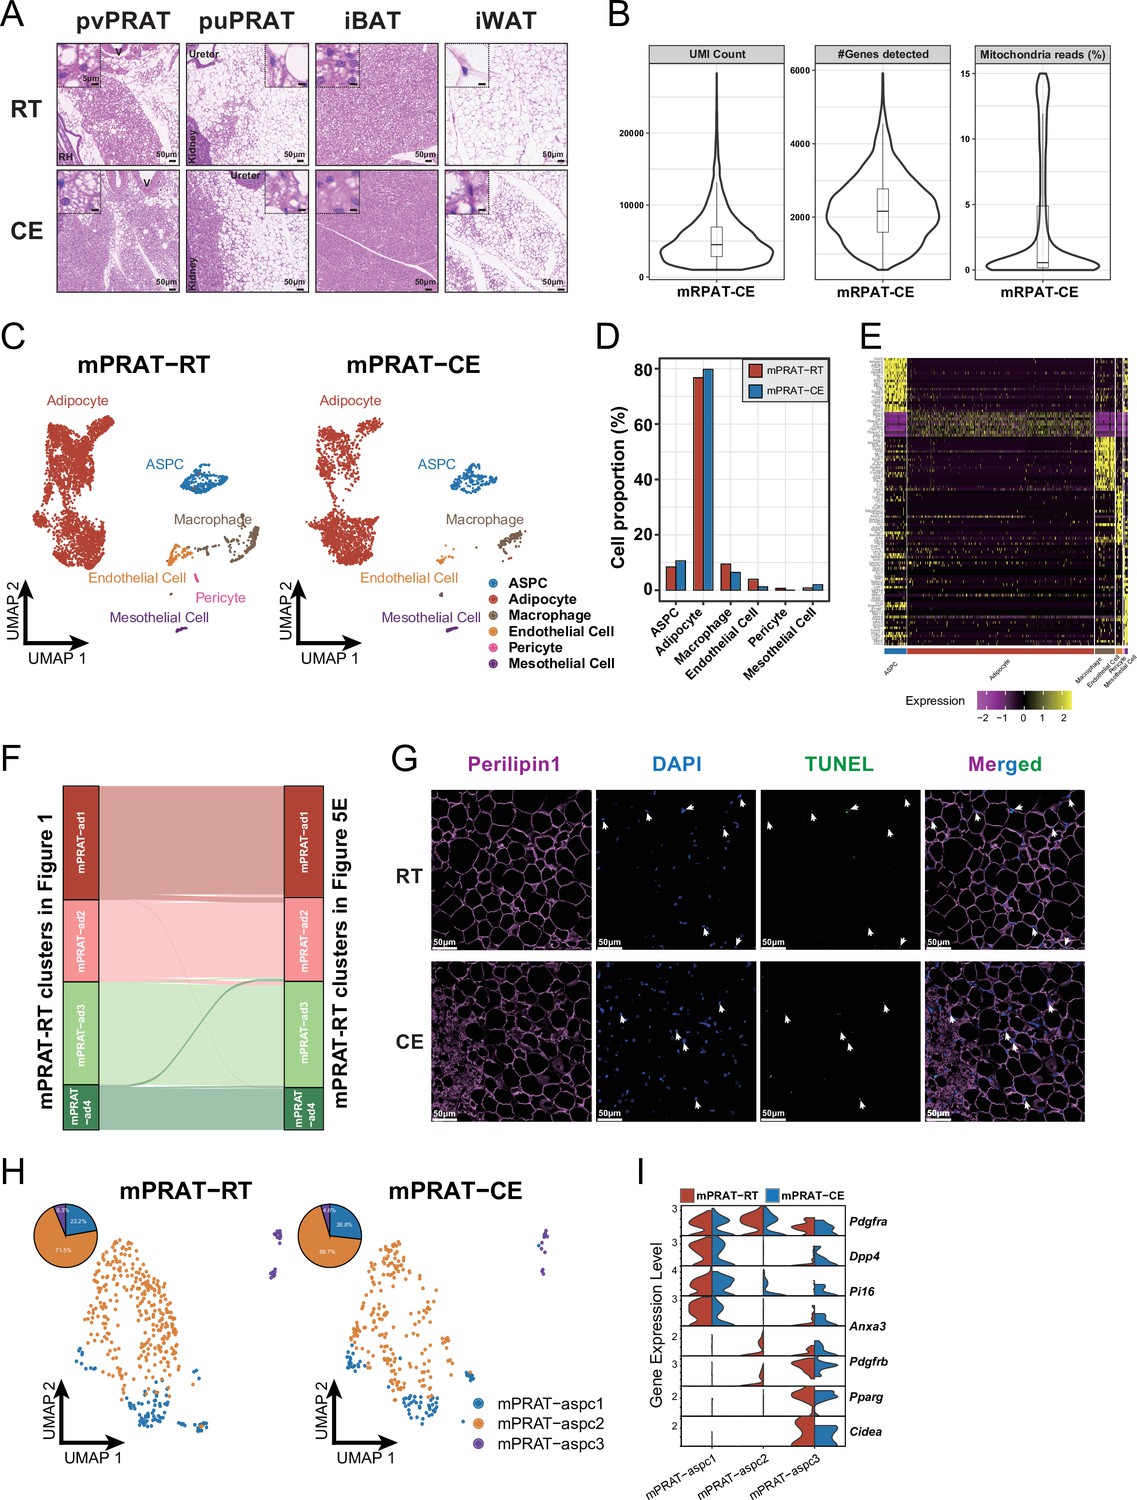
Additional analysis on the medial region of perirenal adipose tissue (mPRAT) under room temperature (RT) and cold exposure (CE) conditions.
(A) Representative HE images illustrating the changes in lipid droplet size in perivascular PRAT (pvPRAT), periureter PRAT (puPRAT), interscapular brown adipose tissue (iBAT), and inguinal white adipose tissue (iWAT) of 6-month-old C57BL/6J male mice under RT and CE conditions. Scale bar, 50 µm, 5 µm. (B) Quality metrices showing UMI counts, number of detected genes, and percentage of sequencing reads from mitochondria of the mPRAT CE dataset. (C) Uniform Manifold Approximation and Projection (UMAP) of all cell types in mPRAT of 6-month-old C57BL/6J male mice under RT or CE condition. A total of 7387 nuclei were integrated, including 4731 and 2656 nuclei from eight and eight animals for the two conditions, respectively. (D) Cellular composition of each cell type in (C) relative to the total number of analyzed nuclei. (E) Heat map of the top 20 marker gene expression levels of all cell types of mPRAT under RT and CE conditions. (F) Cell identity comparison between mPRAT adipocyte subpopulations identified under the RT condition of Figures 5E and 1G. (G) Representative images of Tunel, Plin1, and DAPI staining of pvPRAT and puPRAT under RT or CE condition. n = 3 mice for each condition. (H) UMAP and cellular composition of the adipose stem and progenitor cell (ASPC) subpopulations of mPRAT under RT and CE conditions. (I) Violin plot of the marker gene expression levels of each ASPC subpopulation of mPRAT under RT and CE conditions.
Figure 6 with 2 supplements
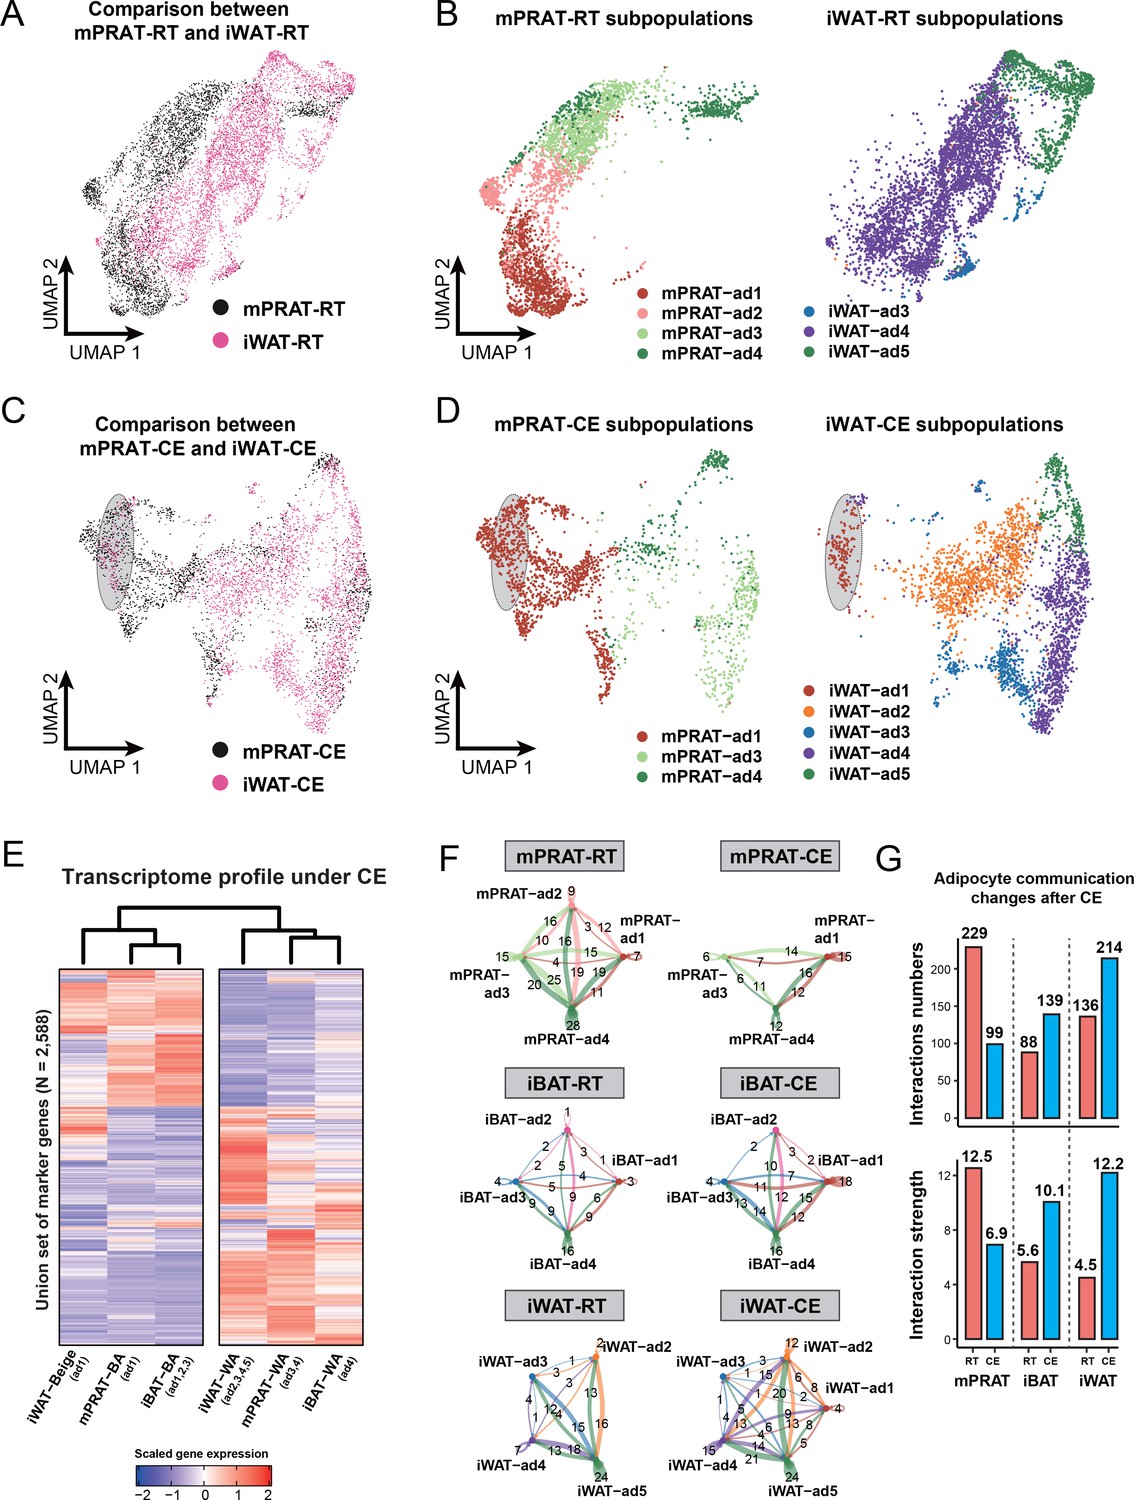
mPRAT-ad2 adipocytes have different transcriptomes from inguinal white adipose tissue (iWAT) beige adipocytes (BeAs).
Integrated (A) and separated (B) Uniform Manifold Approximation and Projection (UMAP) of the adipocytes in the medial region of perirenal adipose tissue (mPRAT) and iWAT of 6-month-old C57BL/6J male mice kept under room temperature condition. Integrated (C) and separated (D) UMAP of the adipocytes in mPRAT and iWAT of 6-month-old C57BL/6J male mice kept under cold exposure condition. The gray-shaded oval was determined by the distribution of iWAT-ad1 population in (D). (E) Heat map illustrating the transcriptome of the brown adipocytes (BAs), BeAs, and white adipocytes (WAs) of mPRAT, interscapular brown adipose tissue (iBAT), and iWAT under cold exposure condition. Overall similarity comparison was illustrated by hierarchical clustering. (F, G) Cell–cell communication analysis by CellChat in each adipocyte population of mPRAT, iBAT, and iWAT under room temperature or cold exposure condition. The interaction number is labeled on the corresponding linked lines in (F). The communication numbers and strength are shown as bar graphs in (G).
Figure 6—figure supplement 1

Single-nucleus RNA sequencing (snRNA-seq) data analysis of interscapular brown adipose tissue (iBAT) under room temperature (RT) and cold exposure (CE) conditions.
(A) Quality metrices showing UMI counts, number of detected genes, and percentage of sequencing reads from mitochondria of the iBAT CE datasets of 6-month-old C57BL/6J male mice. (B) Uniform Manifold Approximation and Projection (UMAP) of all cell types in iBAT under RT and CE conditions. A total of 27,717 nuclei were integrated, including 16,293 and 11,424 nuclei from eight and eight animals for the two conditions, respectively. (C) Violin plot of the marker gene expression levels of all cell types in (B). (D) Cellular composition of each cell type in (B) relative to the total number of analyzed nuclei. (E, H) UMAP and cellular composition of the adipocyte (E) and adipose stem and progenitor cell (ASPC) (H) subpopulations in (B). (F, I) Violin plot of the marker gene expression levels of the adipocyte (F) and ASPC (I) subpopulations in (B). (G) Cell identity comparison between iBAT adipocyte subpopulations identified in the RT condition of (E) and Figure 1—figure supplement 1I.
Figure 6—figure supplement 2
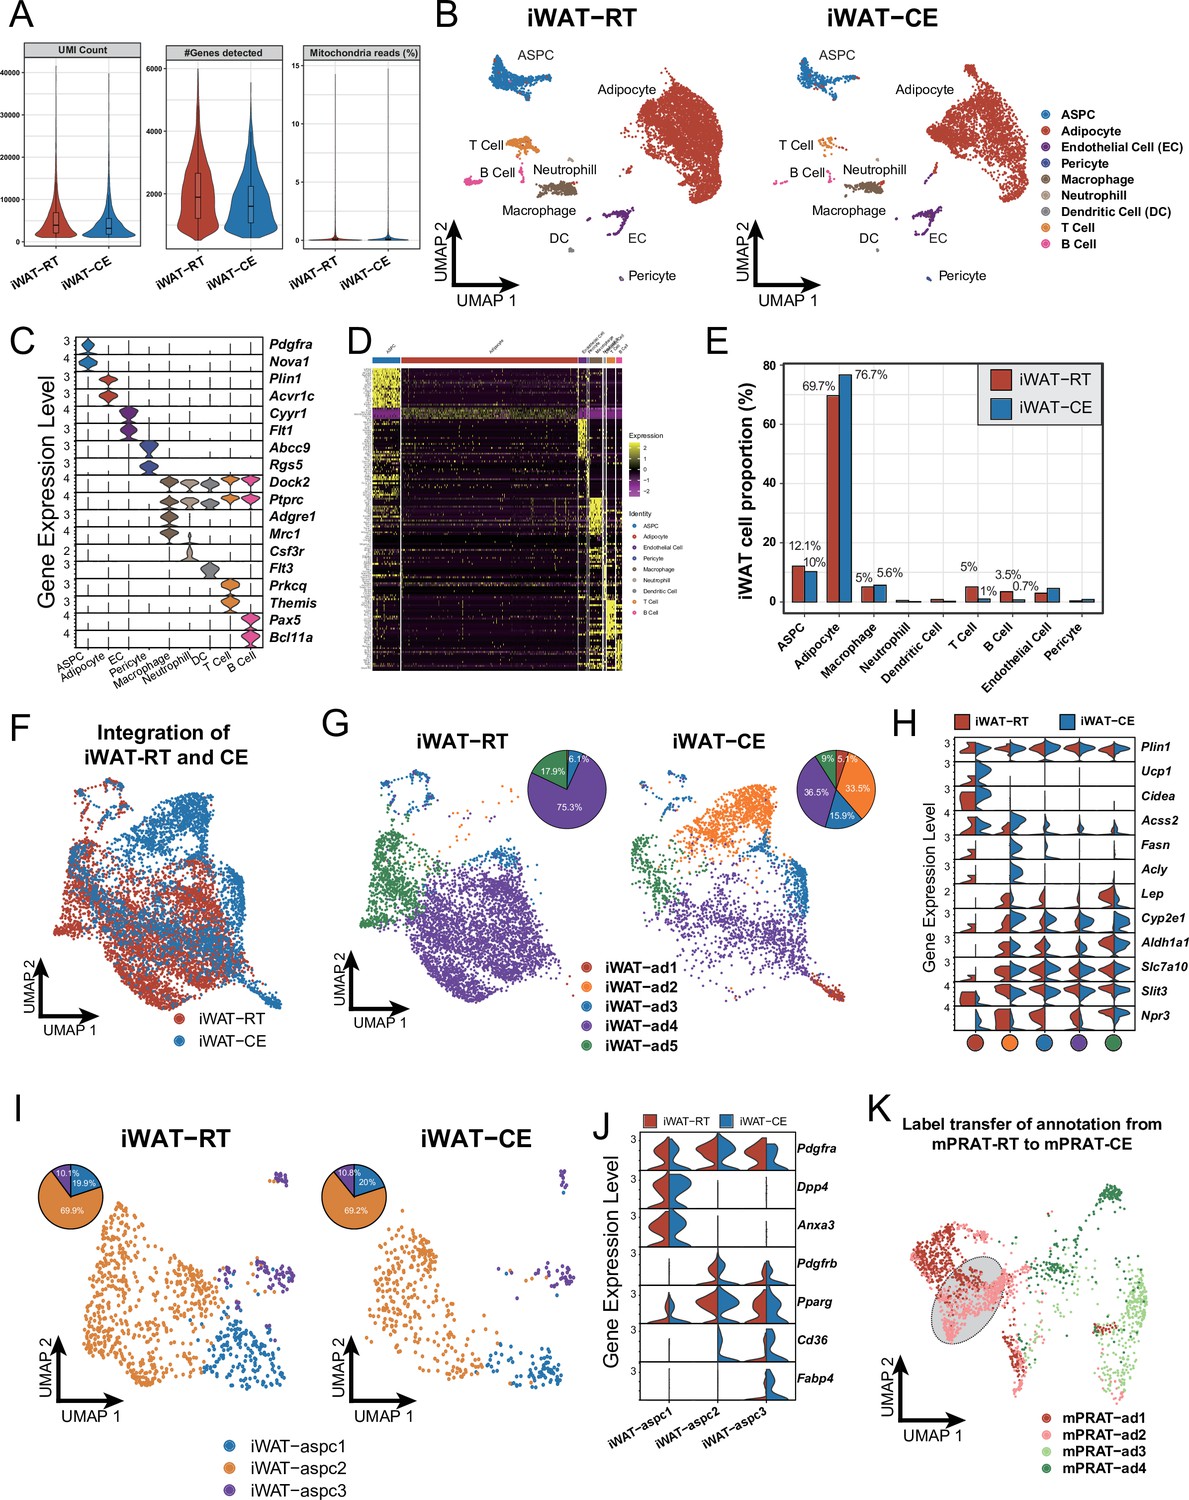
Single-nucleus RNA sequencing (snRNA-seq) data analysis of inguinal white adipose tissue (iWAT) under room temperature and cold exposure conditions.
(A) Quality metrices showing UMI counts, number of detected genes, and percentage of sequencing reads from mitochondria of the iWAT room temperature and cold exposure datasets of 6-month-old C57BL/6J male mice. (B) Uniform Manifold Approximation and Projection (UMAP) of all cell types in iWAT under room temperature and cold exposure conditions. A total of 11,486 nuclei were integrated, including 7342 and 4144 nuclei from six and six animals for the two conditions, respectively. (C) Violin plot of the marker gene expression levels of all cell types in (B). (D) Heat map of the top 20 marker gene expression levels of all cell types of iWAT under room temperature and cold exposure conditions. (E) Cellular composition of each cell type in (B) relative to the total number of analyzed nuclei. (F, G, I) UMAP and cellular composition of the adipocyte (F, G) and adipose stem and progenitor cell (ASPC) (I) subpopulations in (B). (H, J) Violin plot of the marker gene expression levels of the adipocyte (H) and ASPC (J) subpopulations in (B). (K) Label transferred annotation of mPRAT-CE adipocytes from the 6-month-old mPRAT-RT dataset in Figure 1G.
Additional files
-
MDAR checklist
- https://cdn.elifesciences.org/articles/93151/elife-93151-mdarchecklist1-v1.pdf
-
Supplementary file 1
Marker gene lists for all datasets.
- https://cdn.elifesciences.org/articles/93151/elife-93151-supp1-v1.xlsx
Download links
A two-part list of links to download the article, or parts of the article, in various formats.
Downloads (link to download the article as PDF)
Open citations (links to open the citations from this article in various online reference manager services)
Cite this article (links to download the citations from this article in formats compatible with various reference manager tools)
Perirenal adipose tissue contains a subpopulation of cold-inducible adipocytes derived from brown-to-white conversion
eLife 13:RP93151.
https://doi.org/10.7554/eLife.93151.3


