Multicellular factor analysis of single-cell data for a tissue-centric understanding of disease
- Heidelberg University, Faculty of Medicine, and Heidelberg University Hospital, Institute for Computational Biomedicine, BioQuant, Germany
- Heidelberg University, Centre for Organismal Studies, Centre for Scientific Computing, Germany
Figures
Figure 1
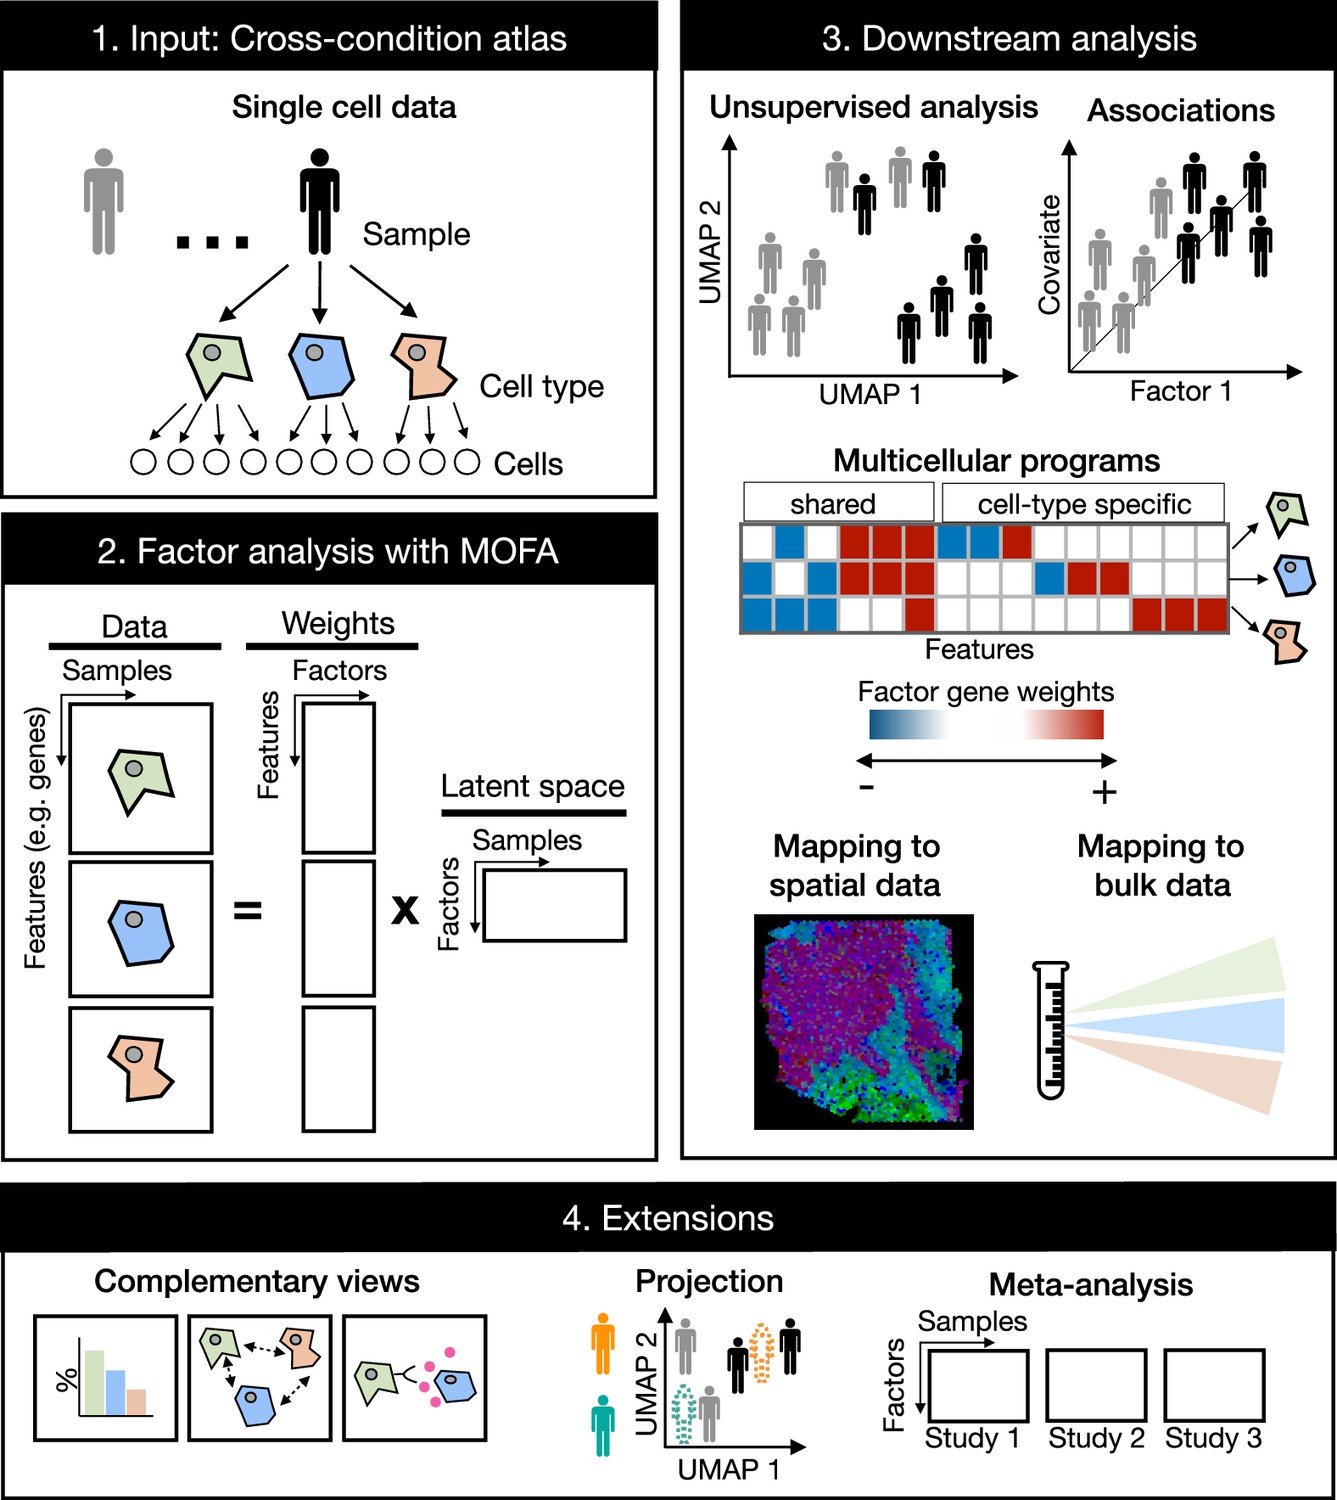
Multicellular factor analysis on cross-condition single-cell data.
Cross-condition single-cell omics data sample the variability of cells across cell types, patients, and conditions. The information of these datasets can be summarized as a multi-view representation, i.e., a collection of matrices containing cell-type features across samples. Multicellular factor analysis repurposes multi-omics factor analysis (MOFA) to simultaneously decompose the variability of multiple cell types and create a latent space that recovers multicellular transcriptional programs. Throughout this manuscript, several applications are presented to show how this analysis can be used for an unsupervised analysis of single-cell data of multiple samples and conditions, for the identification of multicellular disease processes using the inferred latent space, and for a combined analysis of multiple studies across technologies, such as bulk or spatial transcriptomics. Multicellular factor analysis allows for the inclusion of structural or communication tissue-level views in the inference of multicellular programs, and the joint modeling of independent studies. Moreover, projection of new samples into an inferred multicellular space is also possible.
Figure 2 with 1 supplement
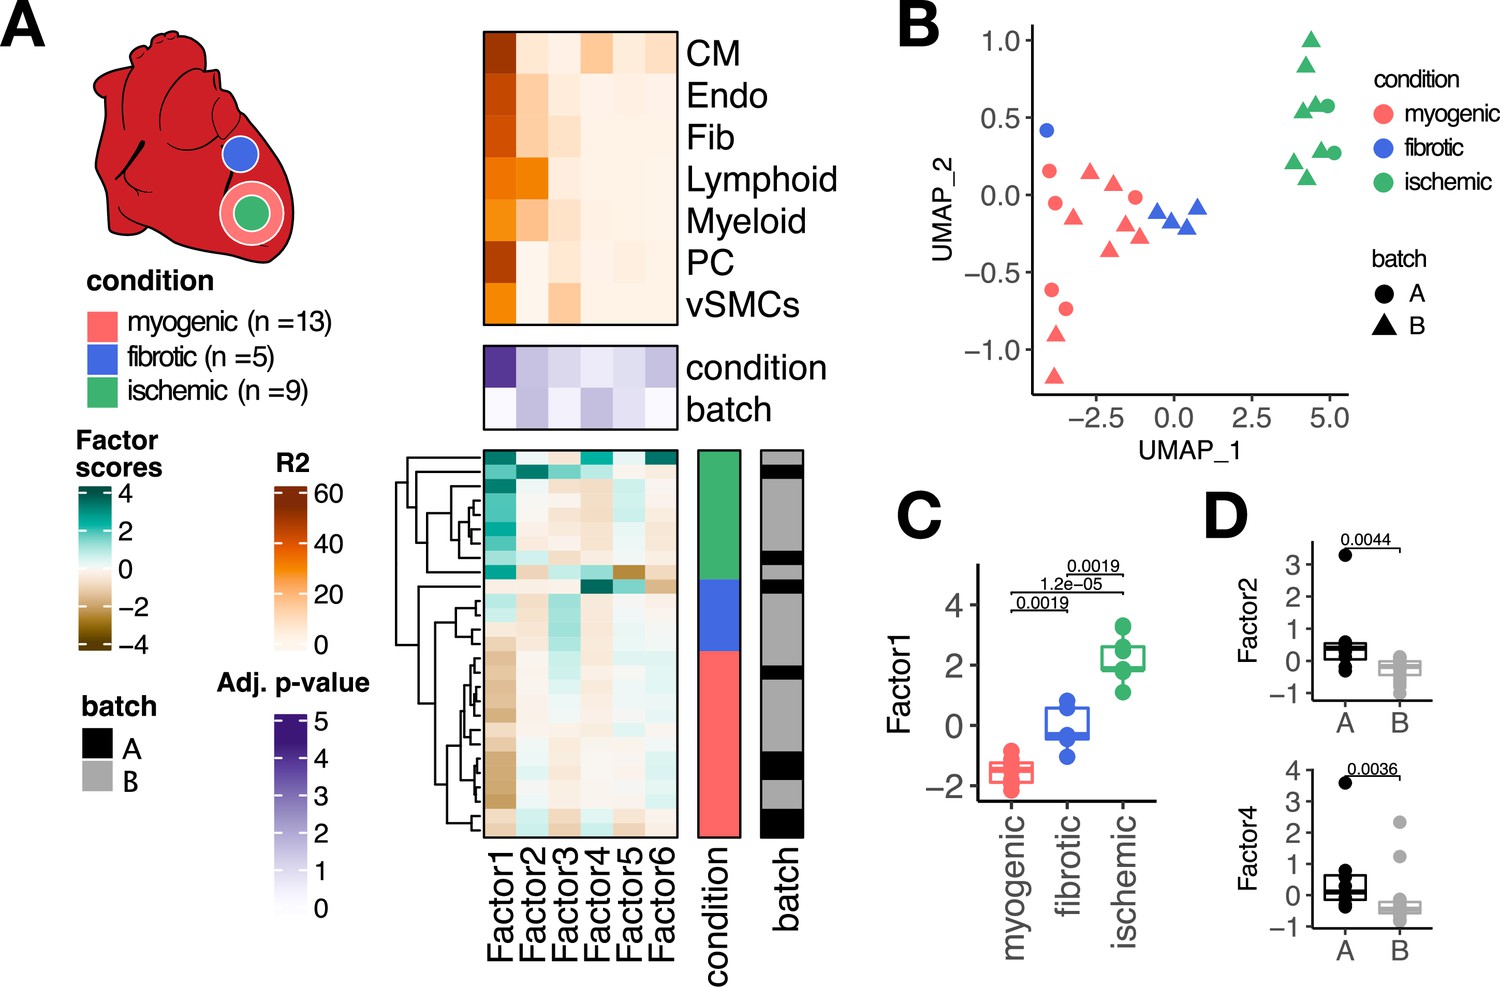
Multicellular factor analysis of a single-cell atlas of myocardial infarction.
(A) Simplified experimental design of a single-cell atlas of acute heart failure following myocardial infarction from Kuppe et al., 2022a. The lower panel shows the factor scores of the 27 samples inferred by the model. The condition and technical batch label of each sample are indicated next to each row. Samples are sorted based on hierarchical clustering. The middle panel shows the -log10 (adj. p-values, Kruskal-Wallis test) of testing for associations between the factor scores and the condition (myogenic: n = 13, ischemic: n = 9, fibrotic: n = 5) or batch label. The upper panel shows the percentage of explained variance of each cell-type expression matrix recovered by the factor. (B) Uniform Manifold Approximation and Projection (UMAP) embedding of the factor scores of each sample in the acute heart failure atlas. (C) Distribution of the scores of Factor 1 across different conditions. (D) Distribution of the scores of Factors 2 and 4 across different technical batches. Data information: In (A–C), myogenic: n = 13, ischemic: n = 9, fibrotic: n = 5. In (A, D), A: n=8, B: n=19. In (C, D) data is presented as box plots where the middle line corresponds to the median, the lower and upper hinges correspond to the first and third quartiles, and the whiskers extend no further than 1.5× interquartile range (IQR). Adjusted p-values from Wilcoxon test.
Figure 2—figure supplement 1
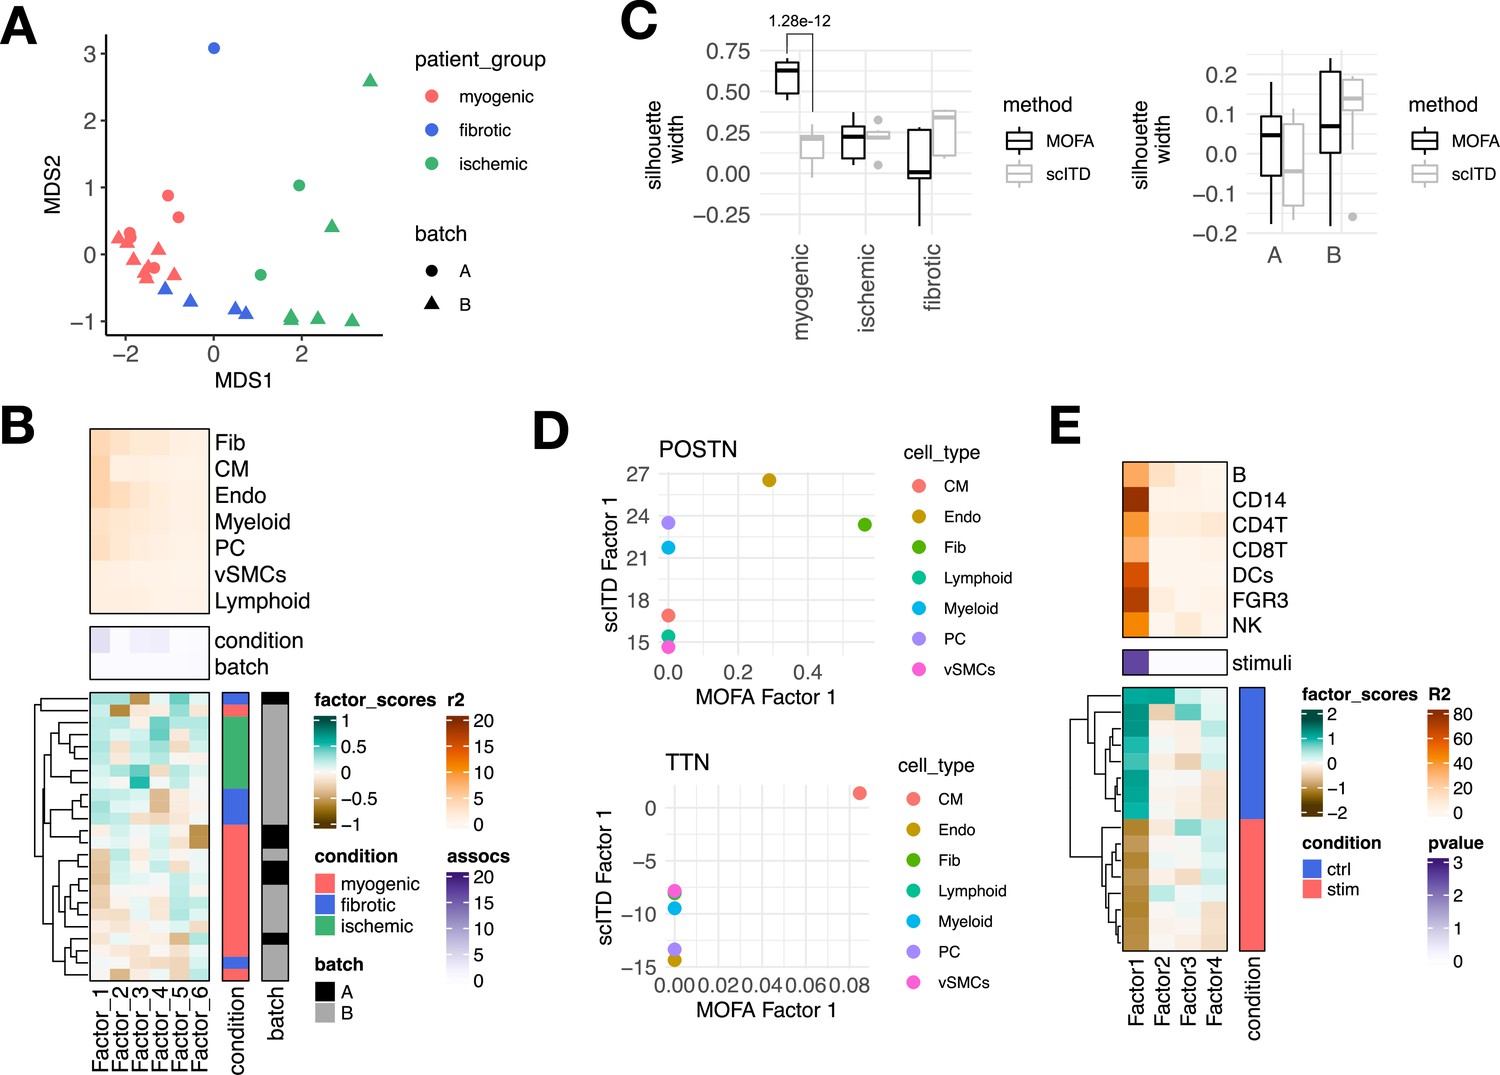
Estimation of a multicellular latent space of acute heart failure using multicellular factor analysis and scITD, and application of multicellular factor analysis for lupus samples.
(A) Multidimensional scaling (MDS) embedding of the multicellular factor scores of each sample in the acute heart failure atlas. (B) scITD Tucker decomposition of the acute heart failure atlas. The lower panel shows the factor scores of the 24 samples inferred by the scITD model. The condition (myogenic: n=13, ischemic: n=6, fibrotic: n=5) and technical batch labels (A: n=6, B: n=18) of each sample are indicated next to each row. Samples are sorted based on hierarchical clustering. The middle panel shows the -log10 (adj. p-values) testing for associations between the factor scores and the condition or batch label (analysis of variance - ANOVA). The upper panel shows the percentage of explained variance of each cell-type expression matrix recovered by the factor. (C) Distribution of silhouette widths of each sample modeled by multicellular factor analysis and scITD grouped by their condition or their technical label. Adjusted p-values <0.05 of Wilcoxon tests are shown. Number of samples across models and sample labels as in Figure 2—figure supplement 1B and Figure 2A. (D) Loading scores of multicellular factor analysis’ Factor 1 and scITD’s Factor 1 for POSTN and TTN across cell types. (E) Multicellular factor analysis of peripheral blood mononuclear cells from patient lupus samples, each before (n=8) and after interferon (IFN)-beta stimulation (n=8.) The lower panel shows the factor scores of the 16 samples inferred with multicellular factor analysis. The stimulation labels of each sample are indicated next to each row. Samples are sorted based on hierarchical clustering. The middle panel shows the -log10(adj. p-values, Kruskal-Wallis test) of testing for associations between the factor scores and the stimulation. The upper panel shows the percentage of explained variance of each cell-type expression matrix recovered by the factor. Data information: In C data is presented as box plots where the middle line corresponds to the median, the lower and upper hinges correspond to the first and third quartiles, and the whiskers extend no further than 1.5× interquartile range (IQR). Adjusted p-values from Wilcoxon test.
Figure 3 with 3 supplements
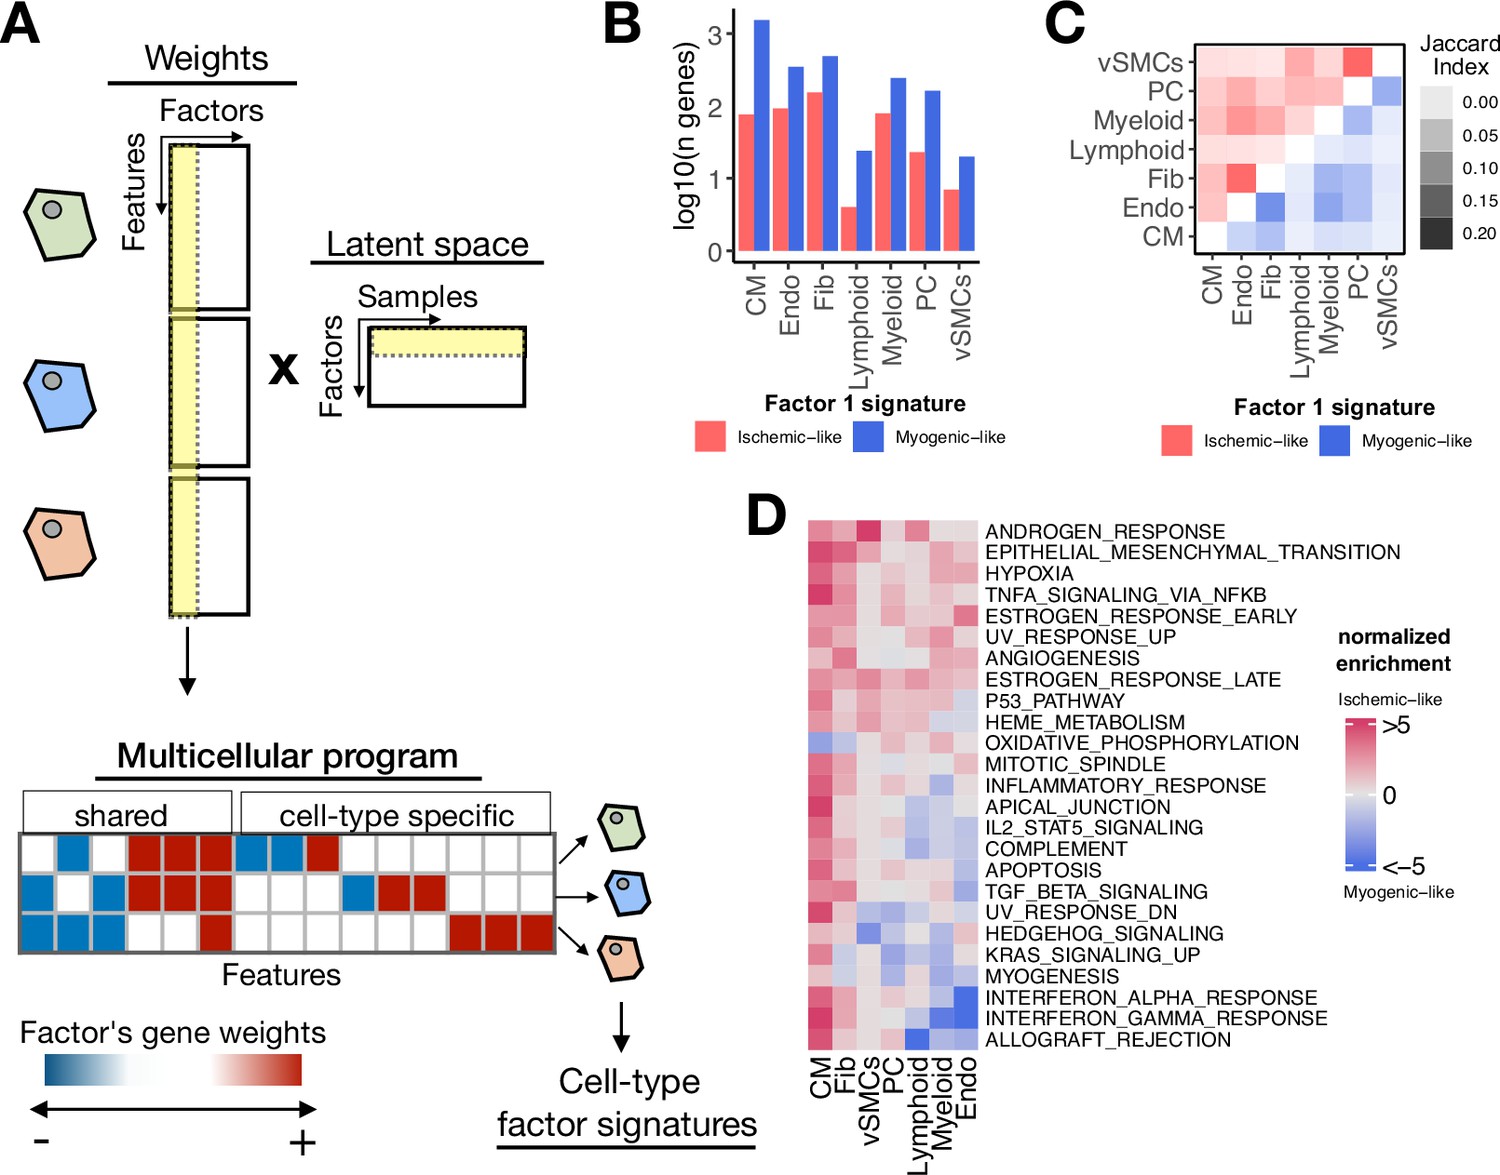
Multicellular programs associated with myocardial remodeling.
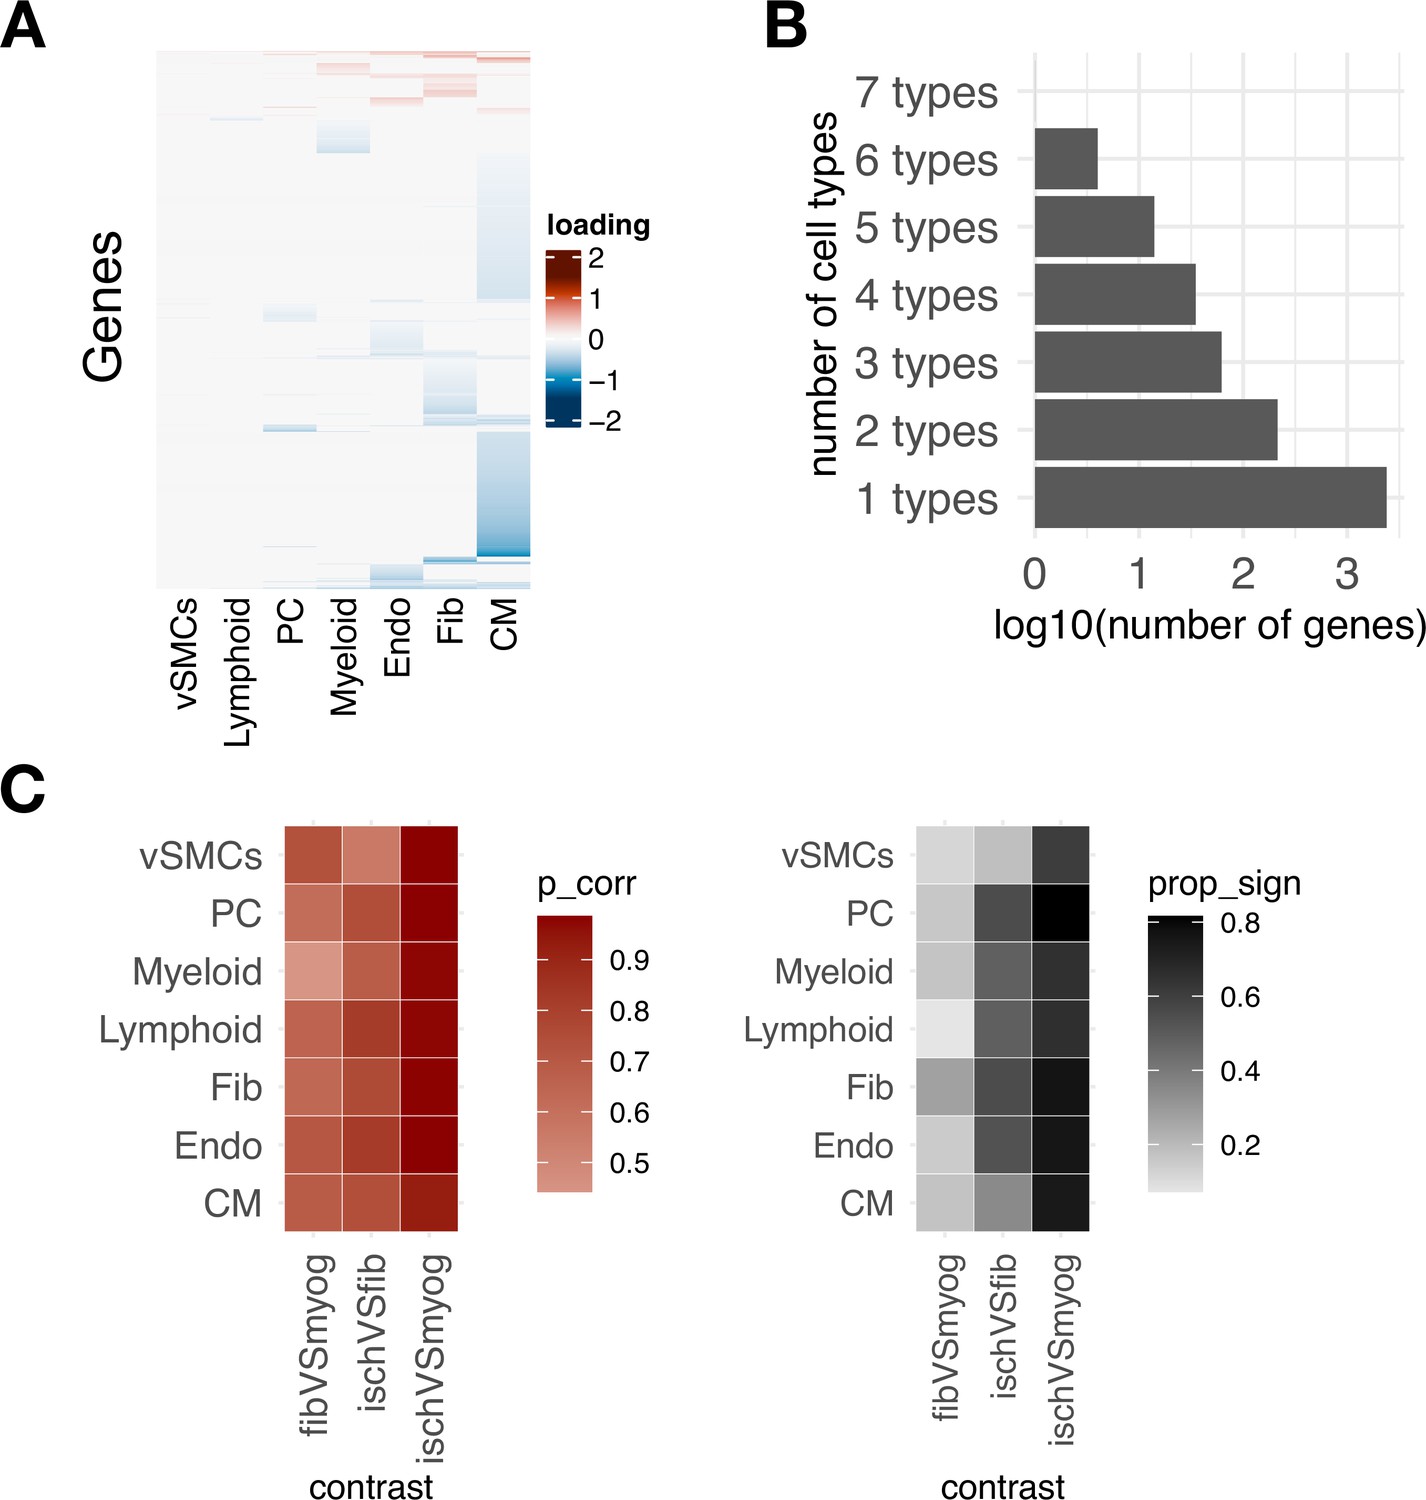
(A) Each factor forming the latent space reconstructed by multicellular factor analysis when applied to single-cell data can be interpreted as a higher-level representation of coordinated molecular processes across cell types, here referred to as multicellular programs. The specific cell-type signatures from these programs can be recovered from the feature weights across cell types, where the expression changes of one cell type relate to the other. Moreover, since each multicellular program associates with the variability of samples (e.g. differentially active across conditions), cell-type signatures can also be interpreted in the same context. (B) Log10(number of genes) for each cell-type Factor 1 signature associated with the sample conditions of the human myocardial infarction data. Signatures were divided into ischemic-like or myogenic-like signatures based on the weight of each gene. (C) Jaccard index across myogenic-like (upper triangle) and ischemic-like (lower triangle) cell-type factor signatures associated with the sample conditions of the human myocardial infarction data. (D) Functional enrichment of MSigDB’s hallmarks in cell-type signatures. Enrichment is quantified as normalized weighted means, using the gene weights of each cell-type signature. Top 25 pathways based on mean absolute enrichment score are shown.
Figure 3—figure supplement 1
Coordinated transcriptional programs across cell types in myocardial remodeling inferred with multicellular factor analysis and differential expression analysis.
(A) Gene weights of Factor 1 estimated from the human myocardial infarction single-cell dataset across cell types, representing the multicellular program associated with myocardial remodeling.
(B) Log10 number of genes belonging to distinct cell-type-specific factor signatures. (C) Similarity of gene weights of Factor 1 to traditional differential expression analysis. Left panel shows the correlation between log fold changes of differential expression testing of three contrasts with the gene weights of Factor 1. Right panel shows the proportion of differentially expressed genes with a false discovery rate ≤ 0.05 for each cell type and contrast from the genes used in the multicellular factor analysis model.
Figure 3—figure supplement 2
Cell-state-dependent and -independent transcriptional deregulations upon myocardial infarction.
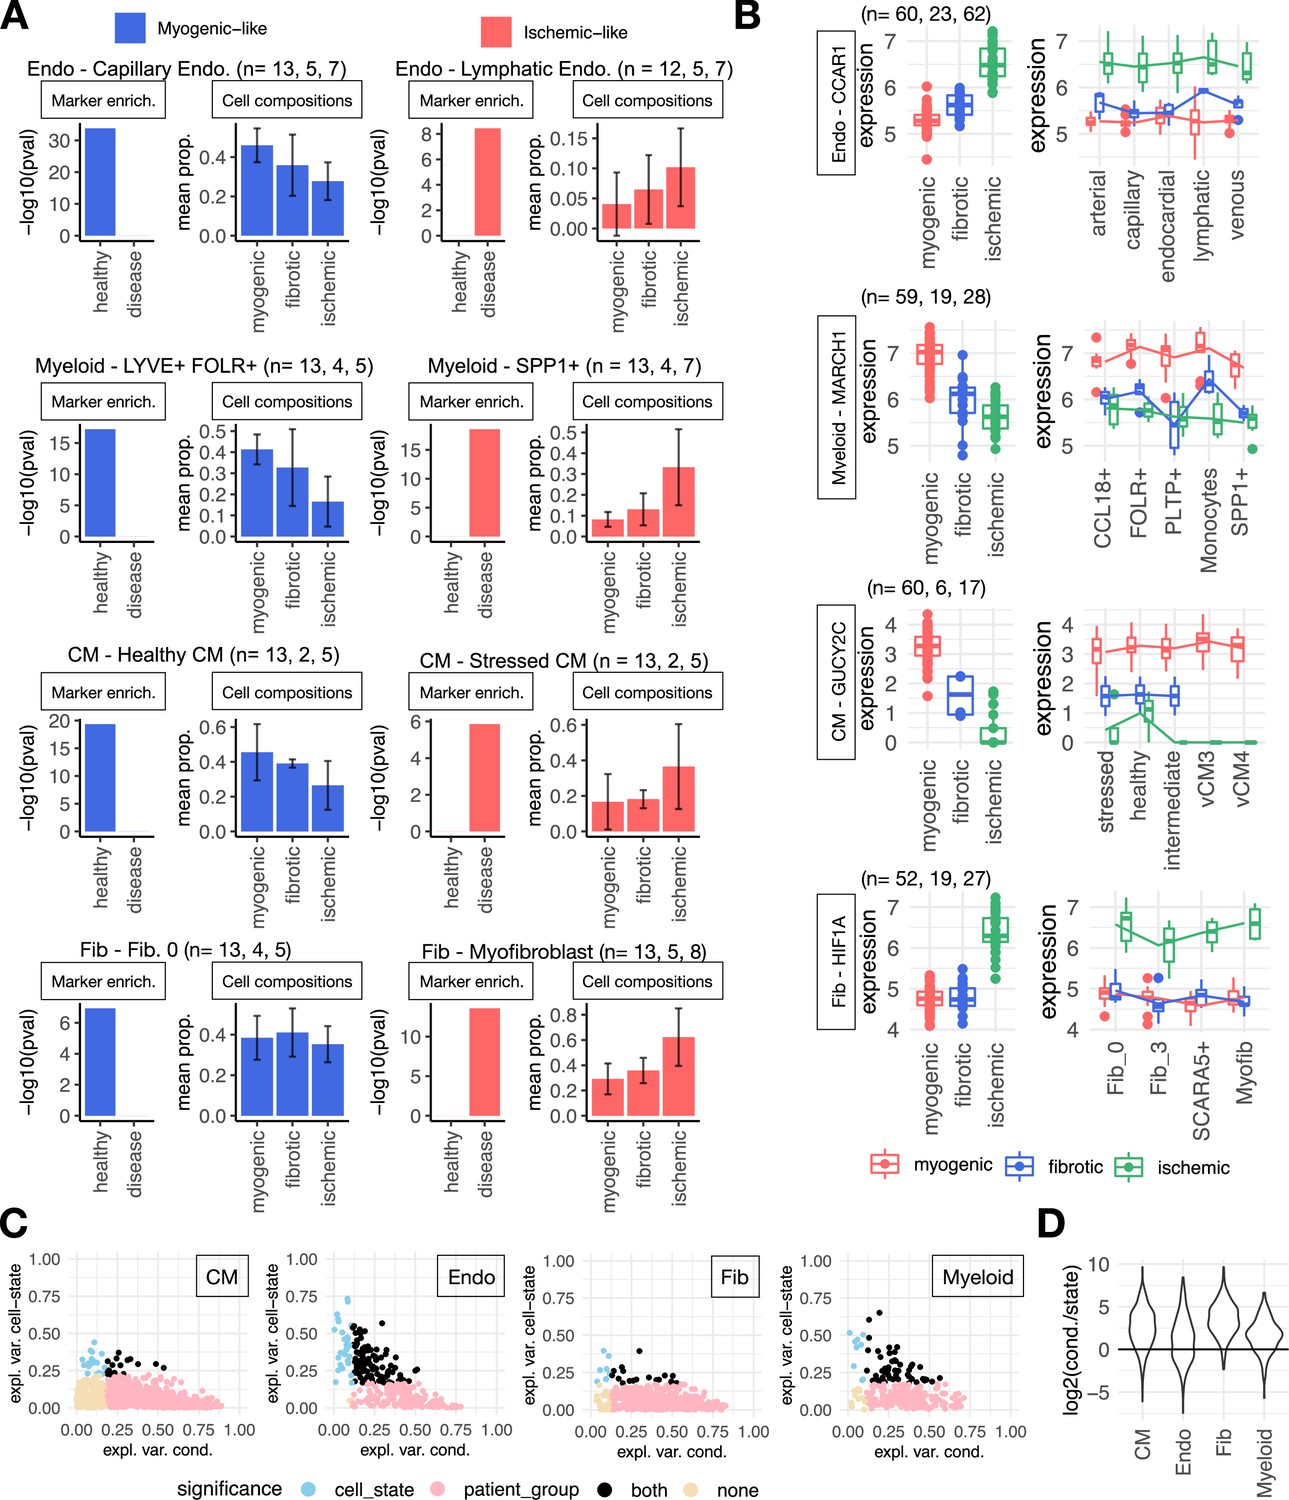
(A) Cell-state markers captured in cell-type Factor 1 signatures of endothelial (Endos) and myeloid cells, cardiomyocytes (CMs), and fibroblasts (Fibs). In each panel is shown the adj. p-value of the enrichment of cell state markers of the indicated state in cell-type-specific factor signatures (left) and the group’s mean proportion of cell states across patient groups calculated from single-cell data (right). The most overrepresented state in myogenic (left column) and ischemic (right column) samples is shown per cell type. Sample size per patient group is shown in the figure. (B) Distribution of log-normalized gene expression across samples of the human myocardial infarction atlas of CCAR1, MARCH1, GUCY2C, and HIF1A from pseudobulk profiles of Endo and myeloid cells, CMs, and Fibs, respectively. The left column is the pseudobulk expression of the gene in a cell type for each sample, while the right column comes from the pseudobulk expression of the gene in a cell state. Sample size per patient group is shown in the figure. (C) Proportion of variance (eta-squared) of gene expression of genes belonging to the Factor 1 signatures of CM, Endo, Fib, and myeloid cells explained by the patient’s conditions or cell states. Colors represent significance of the association of pseudobulk expression variability to patient’s conditions or cell states (ANOVA adj. p-value <0.05). (D) Distribution of the log2 ratios across cell types between the proportion of variance explained by the patient condition and cell states. Each point in each distribution is the ratio of a gene of the cell-type Factor 1 signature (see C). CM, n=1234, Endo, n=279, Fib, n=584, myeloid, n=230. Data information: In A, composition bar plots, error bars show one standard deviation from the mean. In B data is presented as box plots where the middle line corresponds to the median, the lower and upper hinges correspond to the first and third quartiles, and the whiskers extend no further than 1.5× interquartile range (IQR).
Figure 3—figure supplement 3
Spatial mapping of multicellular programs associated with myocardial remodeling.
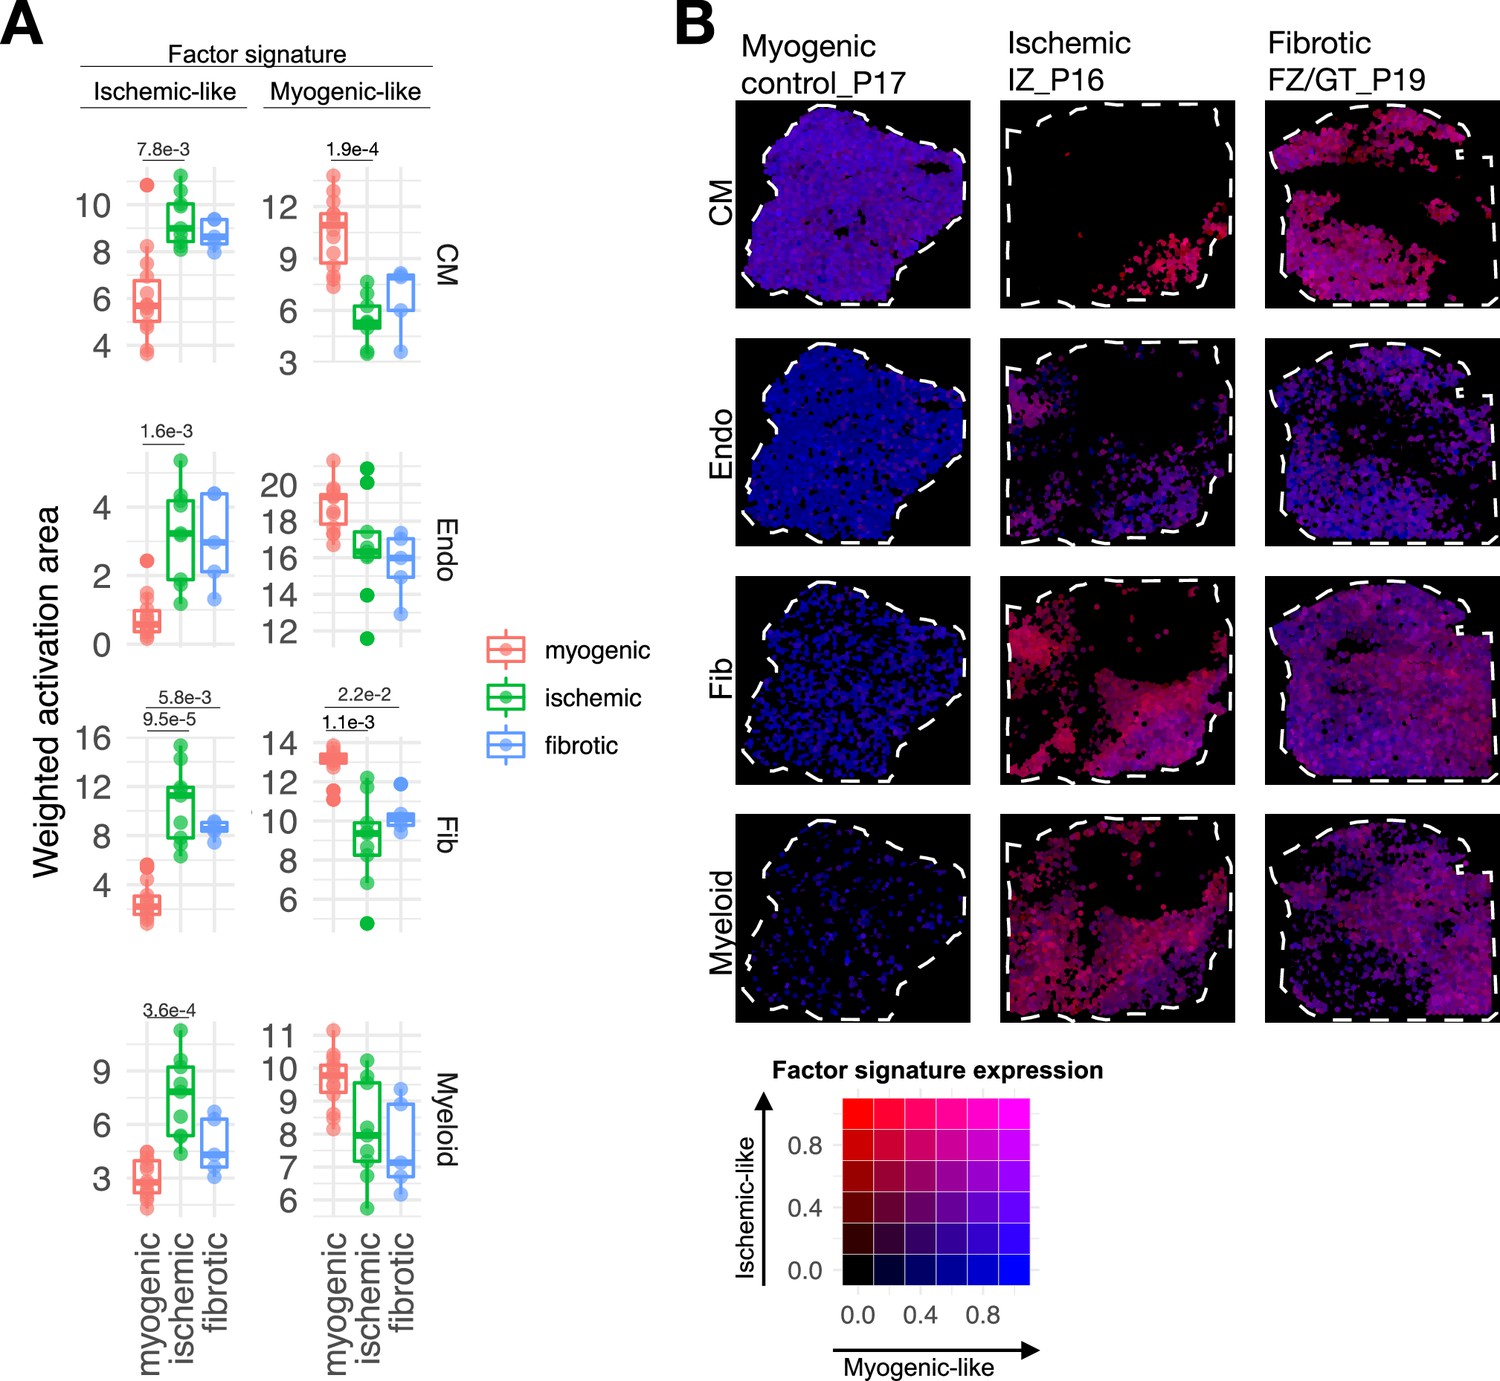
(A) Quantification of the relative area of the expression of cell-type-specific Factor 1 signatures separated by their gene weights in spatial transcriptomics data of human myocardial infarction for cardiomyocytes (CMs), endothelial cells (Endos), fibroblasts (Fibs), and myeloid cells. Adjusted p-values of Wilcoxon tests between conditions are shown for differences where the value was lower than 0.05 (n=28). Myogenic, n=14, fibrotic, n=5, ischemic, n=9. (B) Spatial mapping of the activation of CM, Fib, Endo, and myeloid cell-type Factor 1 signatures in representative examples of myogenic, ischemic, and fibrotic samples. The color of each spot represents the combination of the expression of myogenic and ischemic-like programs mapped to the red-green-blue color space (red = ischemic like, blue = myogenic like). Patient identifiers as in Kuppe et al., 2022a, are indicated in the slide header.
Figure 4
Extensions of multicellular factor analysis to model tissue-level molecular and structural features.
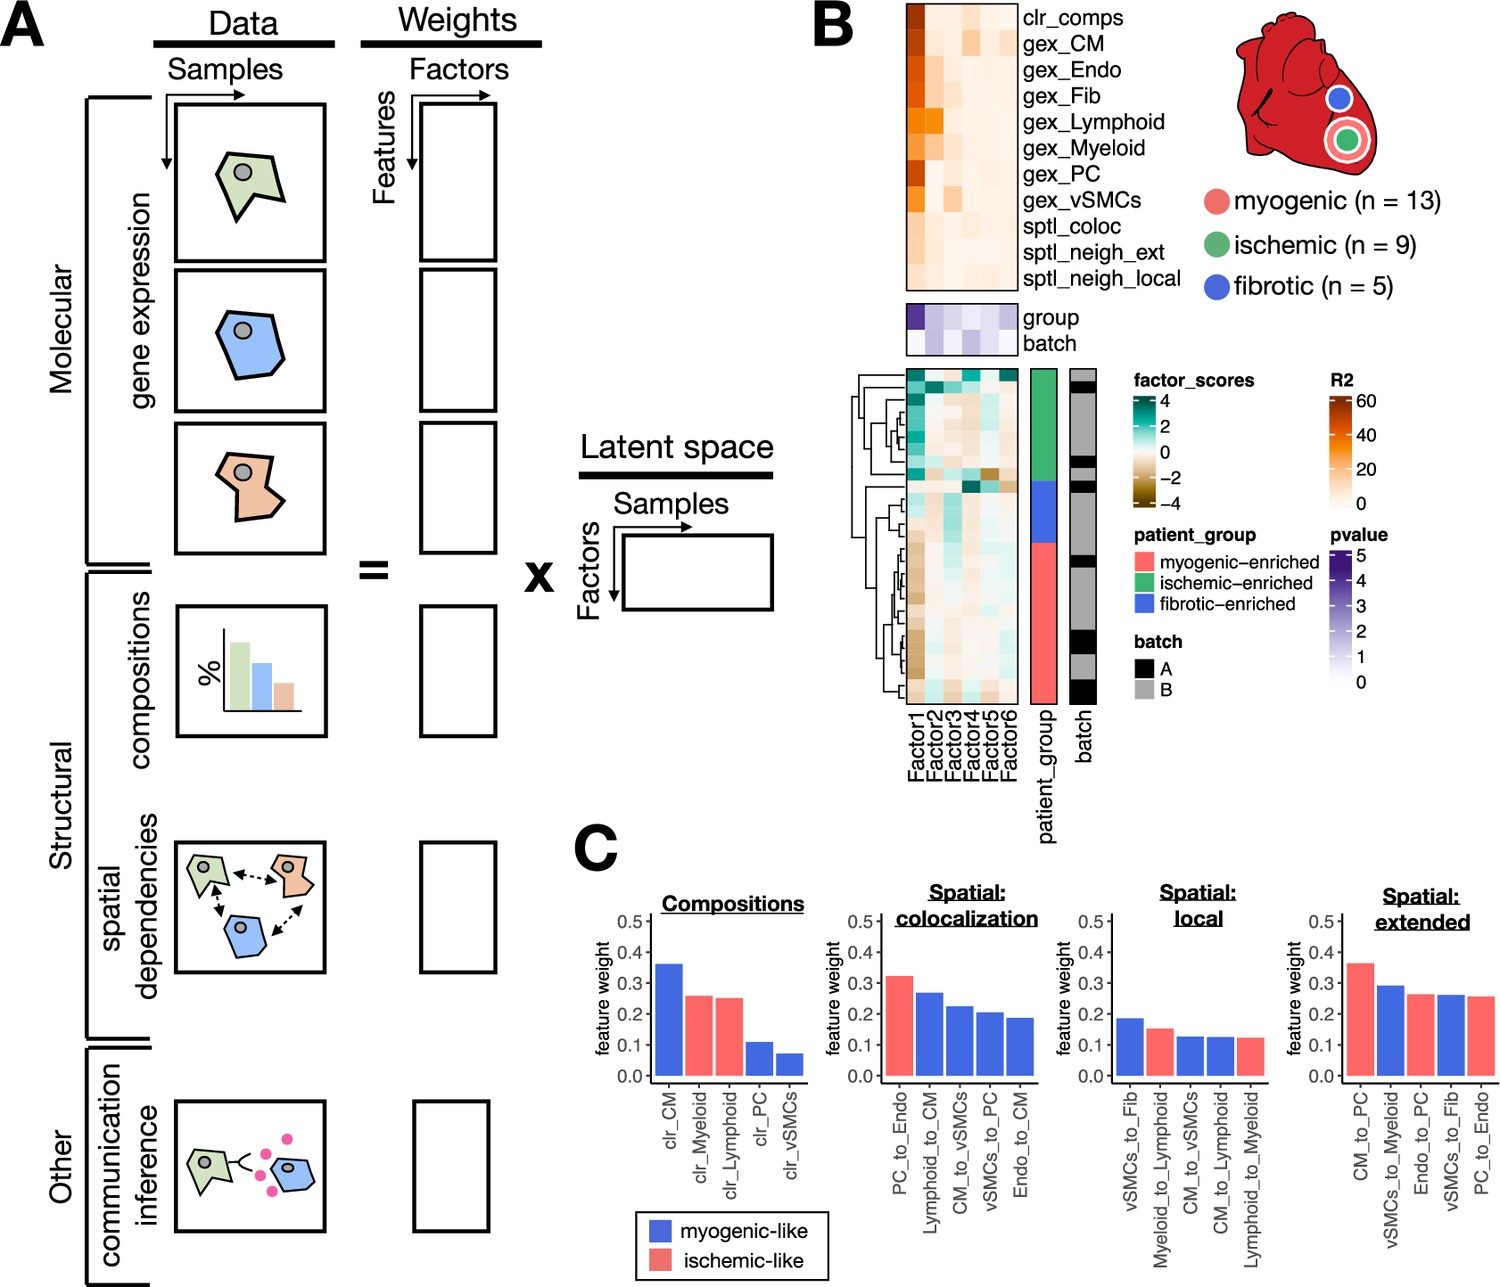
(A) Additionally to molecular views that summarize gene expression across cell types, multicellular factor analysis can model complementary tissue-level features simultaneously, such as cell-type compositions, spatial relationships across cell types, and other functional descriptions such as the co-expression of ligand and receptors between pairs of cells. (B) Simplified experimental design of a single-cell atlas of acute heart failure following myocardial infarction from Kuppe et al., 2022a. The lower panel shows the factor scores of the 27 samples inferred by the model. The condition and technical batch label of each sample are indicated next to each row. Samples are sorted based on hierarchical clustering. The middle panel shows the -log10(adj. p-values, Kruskal-Wallis test) of testing for associations between the factor scores and the condition (myogenic: n = 13, ischemic: n = 9, fibrotic: n = 5) or batch label. The upper panel shows the percentage of explained variance of each cell-type expression matrix and structural views recovered by the factor. (C) Top five feature weights of Factor 1 of the four additional structural views added to the model. Bars are colored based on their weight sign and association with patient groups.
Figure 5 with 1 supplement
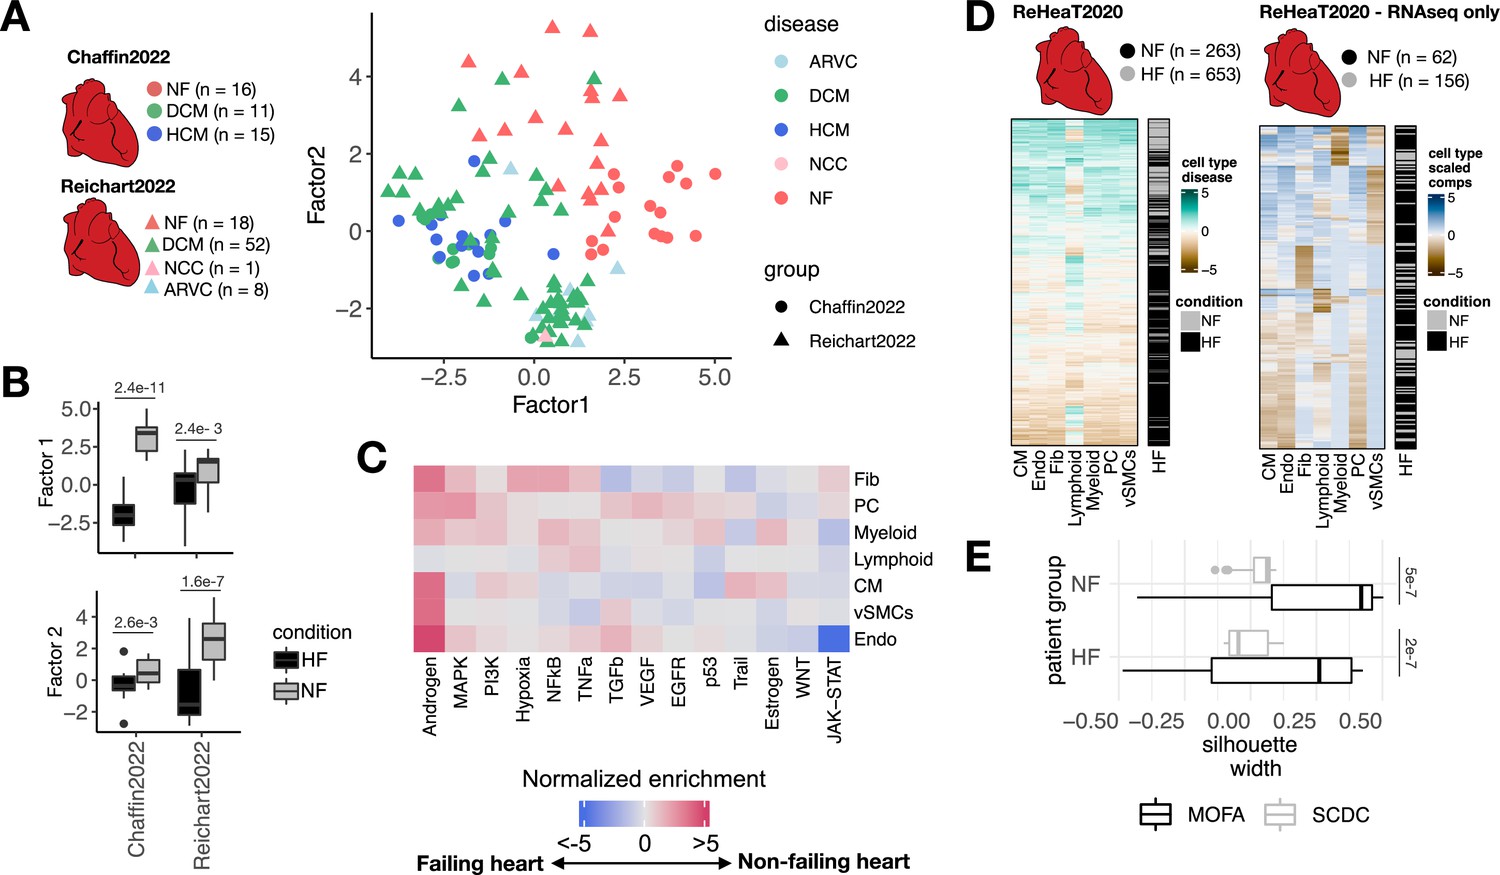
Multicellular factor analysis for the meta-analysis of patient cohorts across technologies.
(A) Distribution of patient samples of two single-cell chronic heart failure studies, Chaffin2022 and Reichart2022, based on the first two factors estimated by a grouped multicellular factor analysis model. (B) Distribution of the patient samples of Chaffin2022 and Reichart2022 across the group multicellular Factor 1, separated by their heart failure condition: failing (HF, Chaffin2022: n=26, Reichart2022: n=61) and non-failing (NF, Chaffin2022: n=16, Reichart2022: n=18) hearts. Adjusted p-values from Wilcoxon tests are shown. (C) Pathway activities estimated from the gene weight matrices of the group multicellular Factor 1 using PROGENy. CMs = cardiomyocytes, Fibs = fibroblasts, Endos = endothelial cells, vSMCs = vascular smooth muscle cells, PCs = pericytes. (D) Hierarchical clustering of bulk transcriptomic samples from ReHeaT using scaled cell-type Factor 1 signatures (left) or scaled cell-type compositions (center-log-ratio transformed) as estimated by SCDC (right). Heart failure status is indicated for each row: failing (HF) and non-failing (NF). (E) Distribution of silhouette widths of each RNA-seq sample from ReHeaT grouped by their heart failure. Silhouette widths were calculated either by cell-type Factor 1 signatures (MOFA) or scaled cell-type compositions (center-log-ratio transformed) (SCDC). Adjusted p-values of Wilcoxon tests are shown. HF: n=156, NF: n=62. Data information: In B,E data is presented as box plots where the middle line corresponds to the median, the lower and upper hinges correspond to the first and third quartiles, and the whiskers extend no further than 1.5× interquartile range (IQR).
Figure 5—figure supplement 1
Multicellular factor analysis to integrate multiple single-cell cohorts and to deconvolute disease signals from bulk transcriptomics.
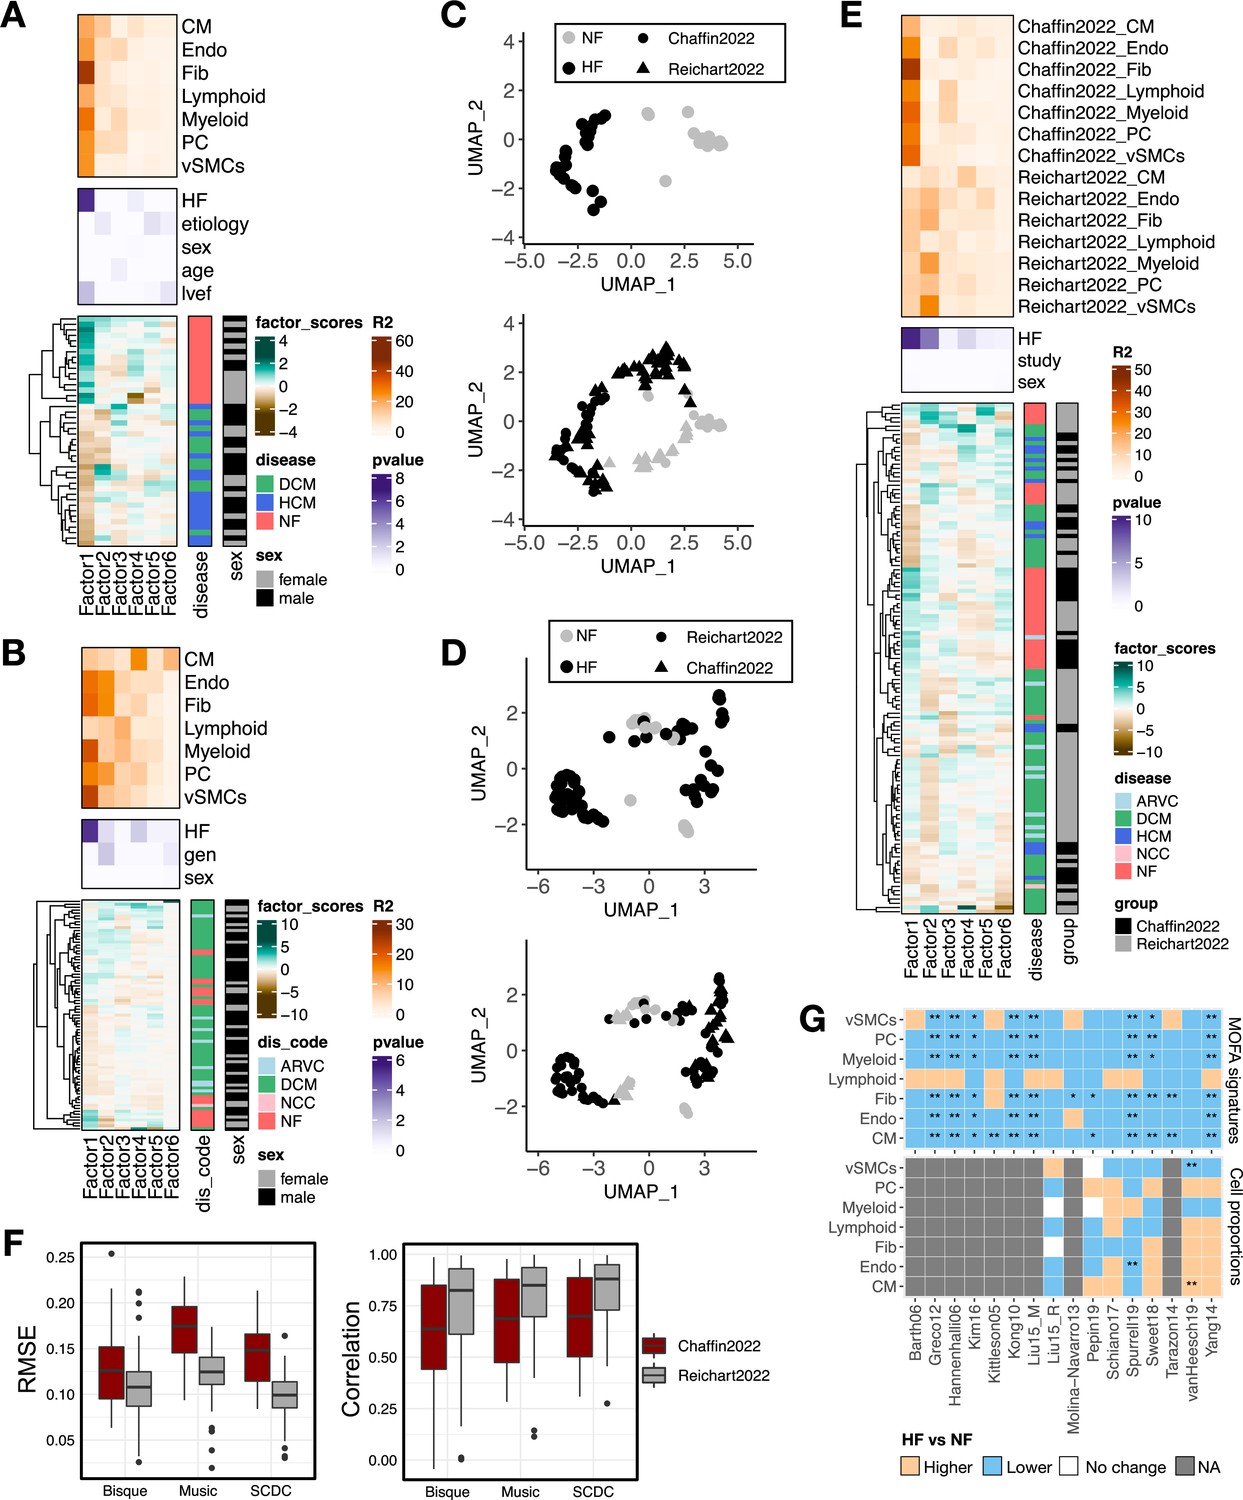
(A) Summary statistics of the multicellular factor analysis model for Chaffin2022. The lower panel shows the hierarchical clustering of the factor scores inferred by the multicellular factor analysis model for the samples in the study. The patient’s condition and sex are indicated in each row. The middle panel shows the -log10(adj. p-values) of testing for associations between the factor scores and heart failure, etiology, age, ejection fraction (lvef), and sex (Kruskal-Wallis test). The upper panel shows the percentage of explained variance of each cell-type expression matrix recovered by the factor. DCM = dilated cardiomyopathy, HCM = hypertrophic cardiomyopathy, NF = non-failing. (B) Summary statistics of the multicellular factor analysis model for Reichart2022. The lower panel shows the hierarchical clustering of the factor scores inferred by the model for the samples in the study. The patient’s condition and sex are indicated in each row. The middle panel shows the -log10(adj. p-values) of testing for associations between the factor scores and heart failure, genotype, and sex. The upper panel shows the percentage of explained variance of each cell-type expression matrix recovered by the factor. ARVC = arrhythmogenic right ventricular cardiomyopathy, DCM = dilated cardiomyopathy, NCC = non-compaction cardiomyopathy, NF = non-failing. (C) Uniform Manifold Approximation and Projection (UMAP) embedding of the patient samples of Chaffin2022 using their respective factor scores (upper panel) and projected location of samples from Reichart2022 (lower panel). (D) UMAP embedding of the patient samples of Reichart2022 using their respective factor scores (upper panel) and projected location of samples from Chaffin2022 (lower panel). (E) Summary statistics of the grouped multicellular factor analysis model of Chaffin2022 and Reichart2022. The lower panel shows the hierarchical clustering of the factor scores inferred by the model of the 121 samples. The patient’s condition, sex, and study labels are indicated in each row. The middle panel shows the -log10(adj. p-values) of testing for associations between the factor scores and heart failure, sex, or the study label (Kruskal-Wallis test). The upper panel shows the percentage of explained variance of each cell-type expression matrix recovered by the factor for each study separately. ARVC = arrhythmogenic right ventricular cardiomyopathy, DCM = dilated cardiomyopathy, HCM = hypertrophic cardiomyopathy, NCC = non-compaction cardiomyopathy, NF = non-failing. (F) Evaluation of the performance of the cell-type deconvolution methods Bisque, Music, and SCDC in the estimation of true cell compositions from pseudobulk samples of Chaffin2022 (n=42) and Reichart2022 (n=79). Left panel shows the root-mean-squared-error and the lower panel the Pearson correlation to true values. (G) Adjusted p-values (Wilcoxon tests) obtained from the comparison of heart failing vs non-failing samples across 16 independent bulk studies from ReHeaT using cell-type factor signatures (upper) or estimated cell-type compositions (lower). Stars highlight differences between conditions (*=adj. p-value ≤ 0.1, **=adj. p-value ≤ 0.05). Gray tiles represent studies where the comparison was not possible (microarray study). CMs = cardiomyocytes, Fibs = fibroblasts, Endos = endothelial cells, vSMCs = vascular smooth muscle cells, PCs = pericytes. Data information: In F data is presented as box plots where the middle line corresponds to the median, the lower and upper hinges correspond to the first and third quartiles, and the whiskers extend no further than 1.5× interquartile range (IQR).
Tables
Table 1
Comparison of multicellular integration methods.
| Method | Statistical method | Decomposition | Input | Output | ||||||
|---|---|---|---|---|---|---|---|---|---|---|
| Multicellular programs | Unsupervised analysis of samples | Evaluation of the quality of the latent space | ||||||||
| Data format | Flexible data type | Multiple groups (e.g. independent studies) | Non-overlapping features across views/layers | Handles missing data | ||||||
| DIALOGUE (Jerby-Arnon and Regev, 2022) | Penalized matrix decomposition followed by multi-level modeling | Linear | Multi-view | No - only summarized gene expression across cell types or tissue niches | No | Yes | No | Yes | No | No |
| scITD (Mitchel et al., 2022) | Tucker decomposition | Linear | Tensor | No - only summarized gene expression across cell types | No | No | No | Yes | Yes | Yes |
| Tensor cell2cell (Armingol et al., 2022) | Tensor component analysis | Linear | Tensor | No - only coexpression of ligand and receptors of pairs of sender and receiving cell types | No | No | Yes | Yes | Yes | Yes |
| Multicellular factor analysis with MOFA (Argelaguet et al., 2020; Argelaguet et al., 2018) | Probabilistic group factor analysis | Linear | Multi-view | Yes - any collection of tissue-level features including summarized gene expression across cell types, cell-type compositional data, cell-type spatial relationships, or cell communication scores | Yes | Yes | Yes | Yes | Yes | Yes |
Additional files
Download links
A two-part list of links to download the article, or parts of the article, in various formats.
Downloads (link to download the article as PDF)
Open citations (links to open the citations from this article in various online reference manager services)
Cite this article (links to download the citations from this article in formats compatible with various reference manager tools)
Multicellular factor analysis of single-cell data for a tissue-centric understanding of disease
eLife 12:e93161.
https://doi.org/10.7554/eLife.93161


