Exceptional longevity of mammalian ovarian and oocyte macromolecules throughout the reproductive lifespan
- Department of Neurology, Northwestern University Feinberg School of Medicine, United States
- Department of Obstetrics and Gynecology, Feinberg School of Medicine, Northwestern University, United States
- Department of Medicine, Aging Institute, University of Pittsburgh School of Medicine, United States
- Department of Medicine, Division of Genetics, Brigham and Women’s Hospital, United States
Figures
Figure 1 with 2 supplements
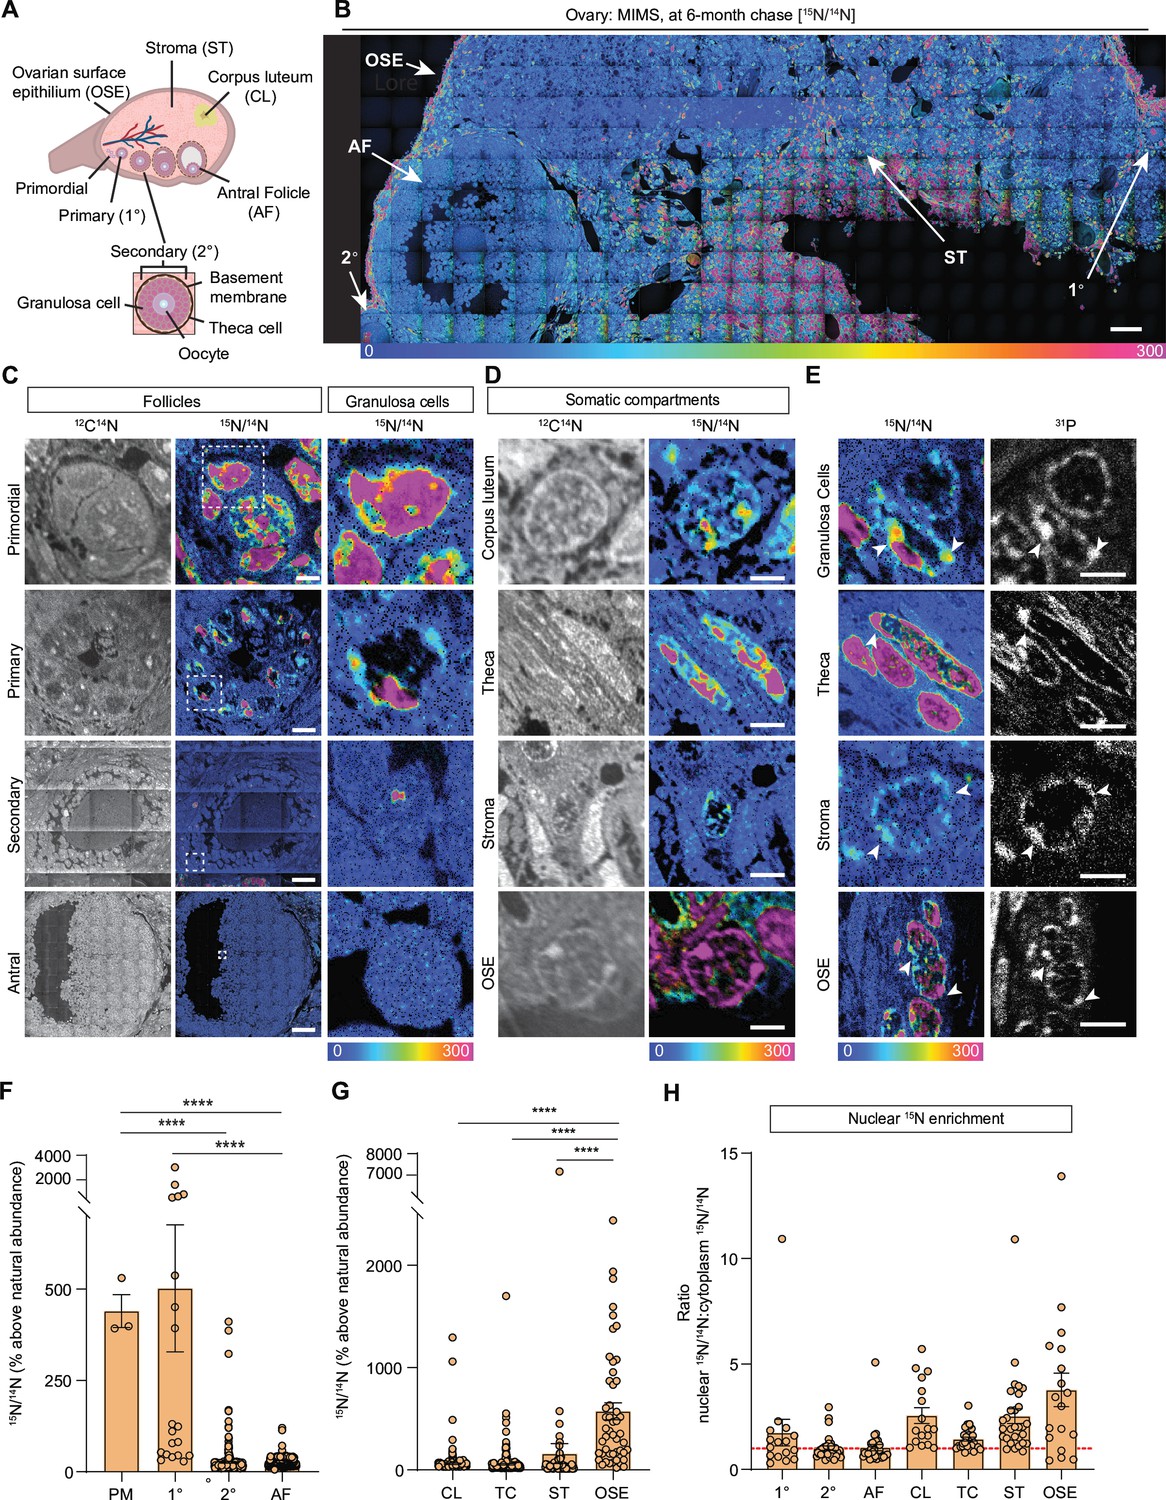
Multi-isotope imaging mass spectrometry (MIMS) analysis of cells and structures across ovarian tissue sections.
(A) Diagram depicting and defining structures of the mammalian ovary. (B) Representative hue saturation intensity (HSI) mosaic from an ovary of a 15N-labeled mouse (6 months of age). Localization and abundance of 15N varied depending on cell type. HSI scale was set to 0% (natural 15N/14N ratio) to 300% (above the natural ratio). (C) High abundance of 15N is seen in early-stage follicles, specifically within granulosa cells. (D) Representative images of somatic cells show differences in 15N-labeling. (E) Intracellular abundance of 15N is colocalized with 31P abundance across all cell types. (F) Differences in 15N/14N ratios reveal granulosa cells of early-stage follicles have greater 15N abundance than later stages (n=3 (PM), 20 (1°), 305 (2°), 2848 (AF)). (G) Among somatic cells, quantitative analysis shows a greater abundance of 15N at the ovarian surface epithelium (n=242 (CL), 276 (TC), 74 (ST), 74 (OSE)). (H) Ratio analysis shows abundance of 15N localized in nuclear regions of cells (n=16 (1°), 30 (2°), 30 (AF), 17 (CL), 30 (TC), 30 (ST), 18 (OSE)). A hypothetical ratio of one, denoted as a red dash line, signifies no difference in 15N abundance between cytoplasmic and nuclear regions. Abbreviations: PM (primordial follicle), 1° (primary follicle), 2° (secondary follicle), AF (antral follicle), CL (corpus luteum), TC (theca cell), ST (stroma), and OSE (ovarian surface epithelium). HSI scale for all images was set to 0%-300% (above natural abundance). Data are shown as mean± SEM. Statistical analysis was performed using a one-way ANOVA. Asterisk denotes statistical significance (* p≤0.05; ** p≤0.01; *** p≤0.001; **** p≤0.0001). Scale bar = (B): 50 µm; (C): 3 µm (PM), 6 µm (1°), 30 µm (2°), 75 µm (AF); (D): 2.5 µm (CL), 2.5 µm (TC), 5 µm (ST), 2.5 µm (OSE); (E): 3 µm (GC), 3 µm (TC), 2.5 µm (ST), 6 µm (OSE).
Figure 1—figure supplement 1
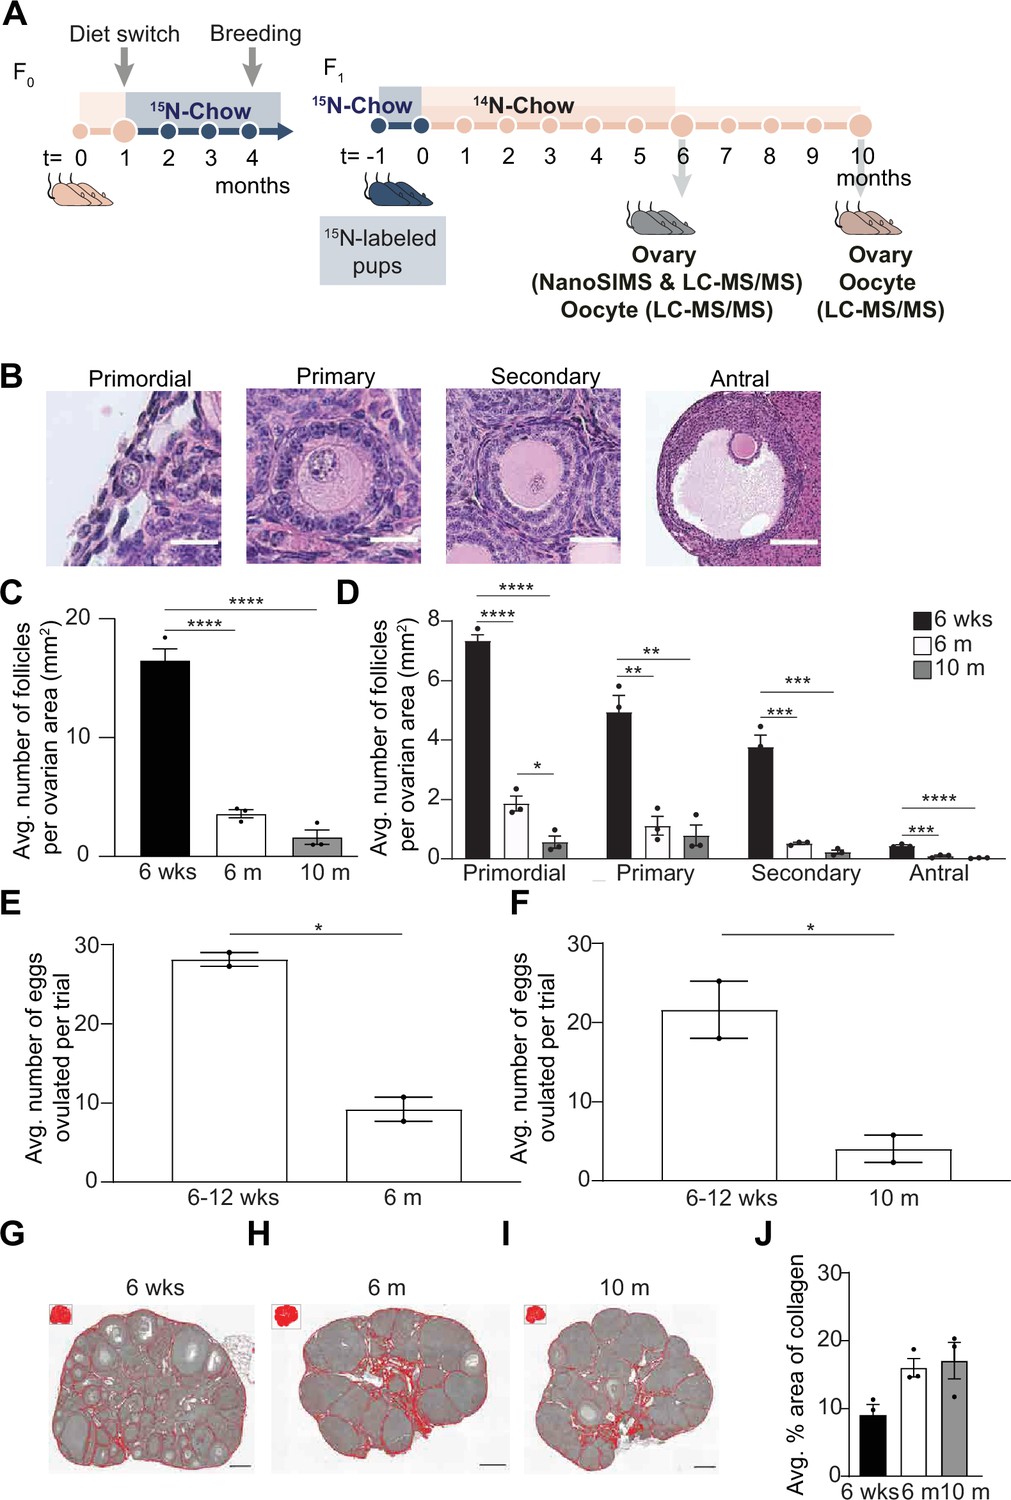
Multi-generational whole animal pulse-chase labeling design along the reproductive aging continuum.
(A) Wild-type female FVB mice (n=3) were fed a 15N-diet for 13 weeks and were maintained on a 15N-labeled diet through breeding, pregnancy, and weaning to produce 15N-labeled pups. Labeled pups were sacrificed after switching over to a 14N-diet for a chase period of 6 or 10 months. Ovaries and oocytes were designated for NanoSIMS, or liquid chromatography/mass spectrometry. Female FVB mice experience age-associated changes in ovarian reserve, ovarian microenvironment, and gamete quality. (B) Representative images of each follicle class from mice of 6 weeks and 6 months of age. (C) Average follicle number per area of ovarian section from mice of the following ages: 6 weeks, 6 months, and 10 months (n=3 mice per age cohort). (D) Graph represents average number of follicles within each follicle class per area of ovarian section for mice ages 6 weeks, 6 months, and 10 months (n=3 mice per age cohort). (E) Comparison of average number of eggs ovulated per trial for mice at 6–12 weeks, 6 months, and (F) 10 months. The data points represent the average number of eggs collected per mouse from two independent trials. In each trial, oviducts from three to four mice were pooled per age group. Representative processed color threshold images of Picrosirius Red (PSR)-stained ovarian tissue sections from mice (G) 6 weeks, (H) 6 months, and (I) 10 months of age. (J) Graph comparing the average percent area of PSR-positive staining per ovarian section (pixels/μm2) (n=3 mice per age cohort). Data are shown as mean ± SEM. Statistical analysis was performed using a one-way ANOVA. Asterisk denotes statistical significance (*p≤0.05; **p≤0.01; ***p≤0.001; ****p≤0.0001). Scale bar for images of (B) primordial, primary, secondary, and antral follicles are 20 μm, 40 μm, 40 μm, and 140 μm, respectively. Scale bars in (G–I) are 180 μm.
Figure 1—figure supplement 2
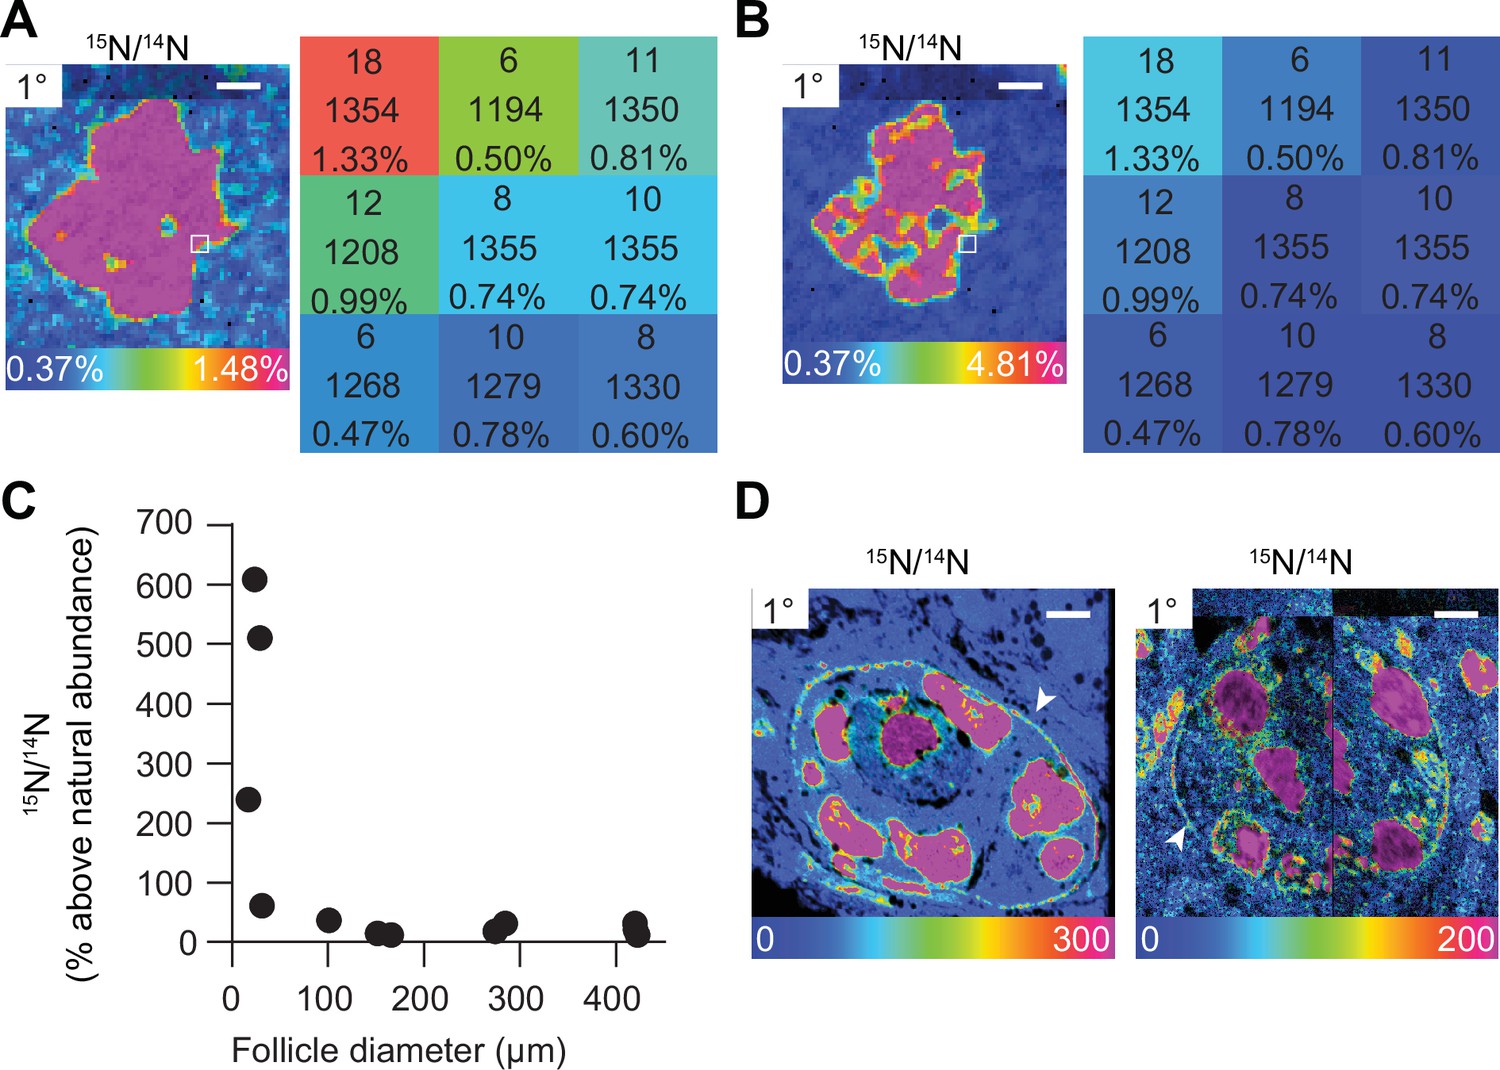
Multi-isotope imaging mass spectrometry (MIMS) uncovers structures enriched with 15N.
(A) Hue saturation intensity (HSI) image maps 15N/14N ratio across nuclear region of a primary follicle. Using a rainbow scale, blue is set to the natural ratio of 15N (0.37%) and overabundance is set to 1.48% (or 300% above the natural ratio). Each pixel provides quantitative information. The numbers in each pixel represent the number of 15N ions, 14N ions, and the 15N/14N ratio, respectively. (B) Changes to the rainbow scale can be used to emphasize regional ratio differences and change the visual representation of the data. Visual changes to HSI images due to different scales do not change the quantitative data behind each pixel. (C) Total 15N abundance of each follicle plotted by follicle diameter shows smaller follicles containing high abundance of 15N. (D) HSI images reveal high 15N abundance concentrated at the basement membrane of early-stage follicles. Scale bar (A, B) = 2.5 μm, (D) left = 4.0 μm, right = 4.5 μm.
Figure 2
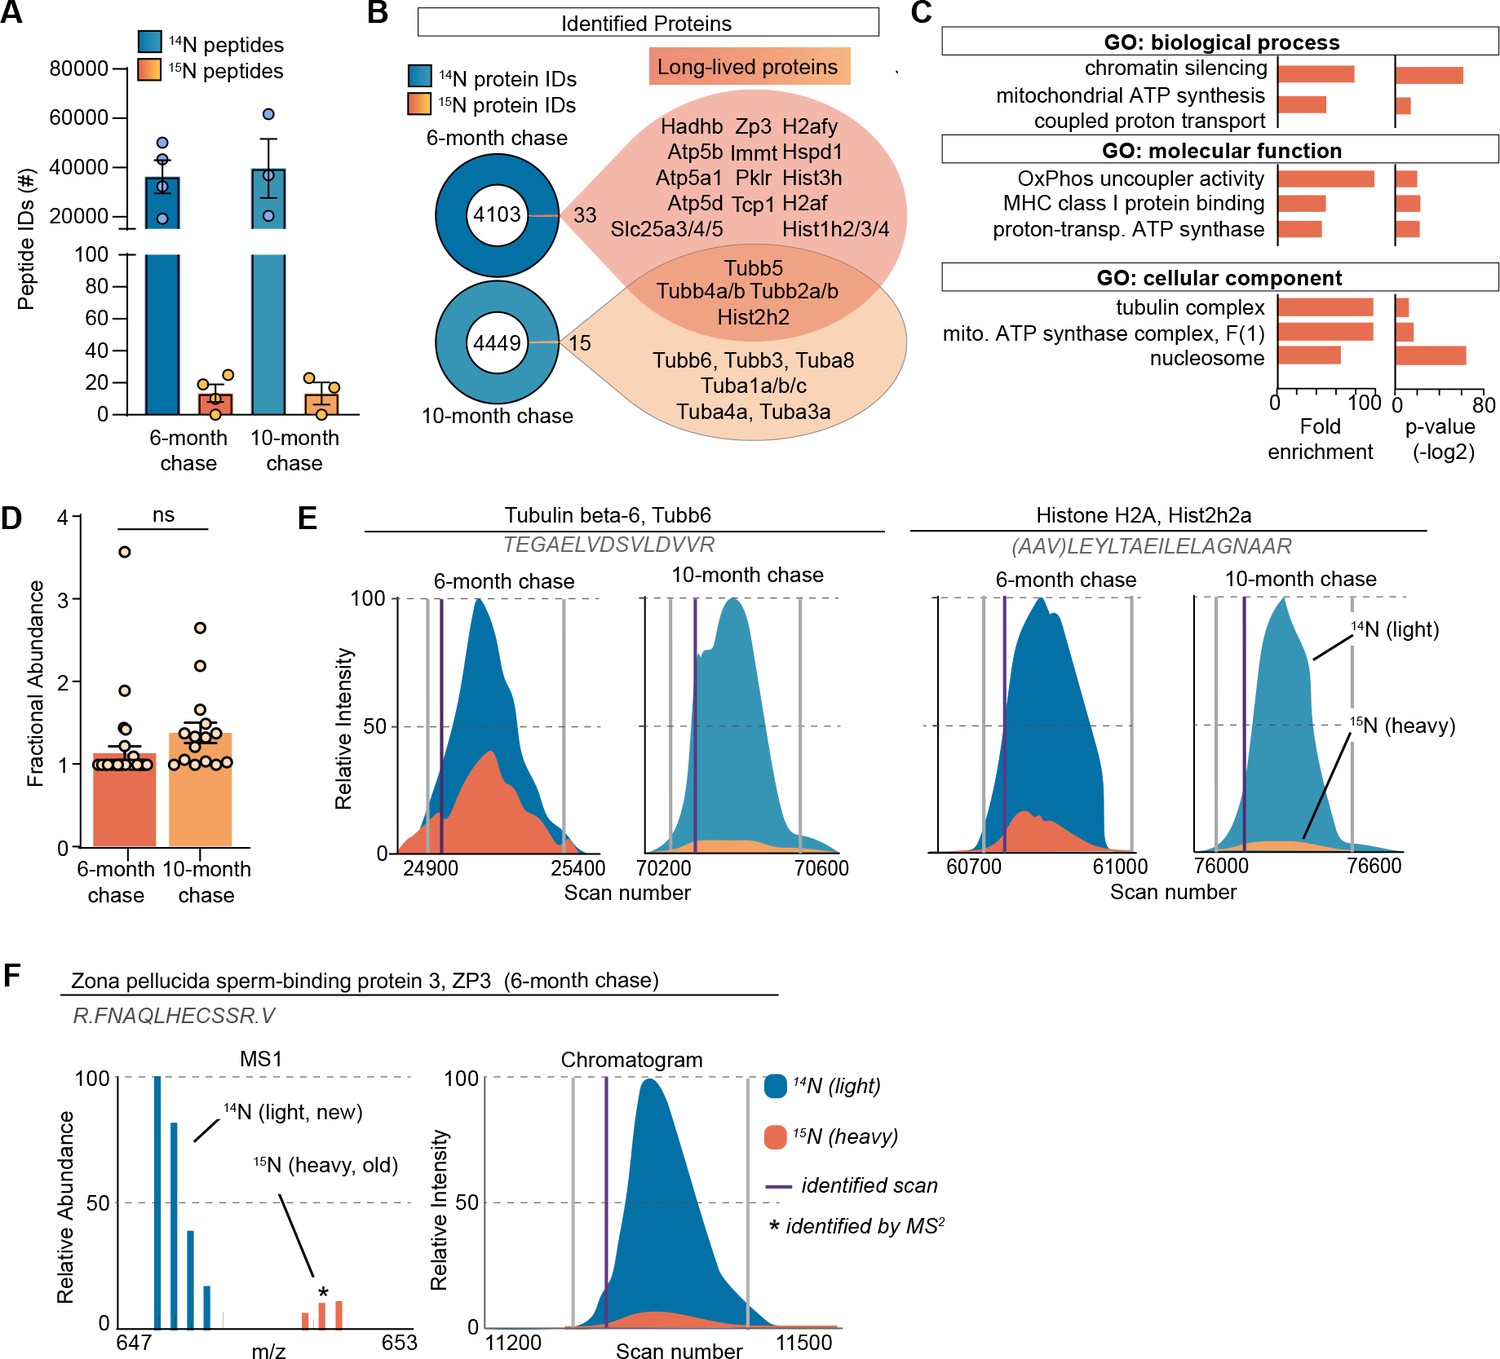
Long-lived proteome in mammalian ovaries.
(A) Summary of peptide identification at 6- and 10-month chase points, blue graphs indicate 14N-peptide IDs, orange/yellow graphs indicate 15N-peptide IDs. (B) Summary of protein identification at each timepoint, with a list of proteins identified as long-lived in orange. (C) Gene ontology (GO) analysis of the long-lived proteins (LLPs) identified in ovaries at 6-month chase revealed that terms related to chromatin, nucleosome, tubulins, and mitochondria are significantly enriched. (D) Fractional abundance of LLPs identified at 6- and 10-month chase. (E) Annotated representative chromatograms of two representative proteins that persist through both 6- and 10-month chase, illustrating the decreasing 15N-signal over time. Blue - 14N (new), orange 15N (old), purple line: identified scan. (F) Annotated representative raw MS1 scan of zona pellucida-3 protein (ZP3). Mean ± SEM; three to four biological replicates per timepoint, ns - not significant by Student’s t-test.
Figure 3 with 1 supplement
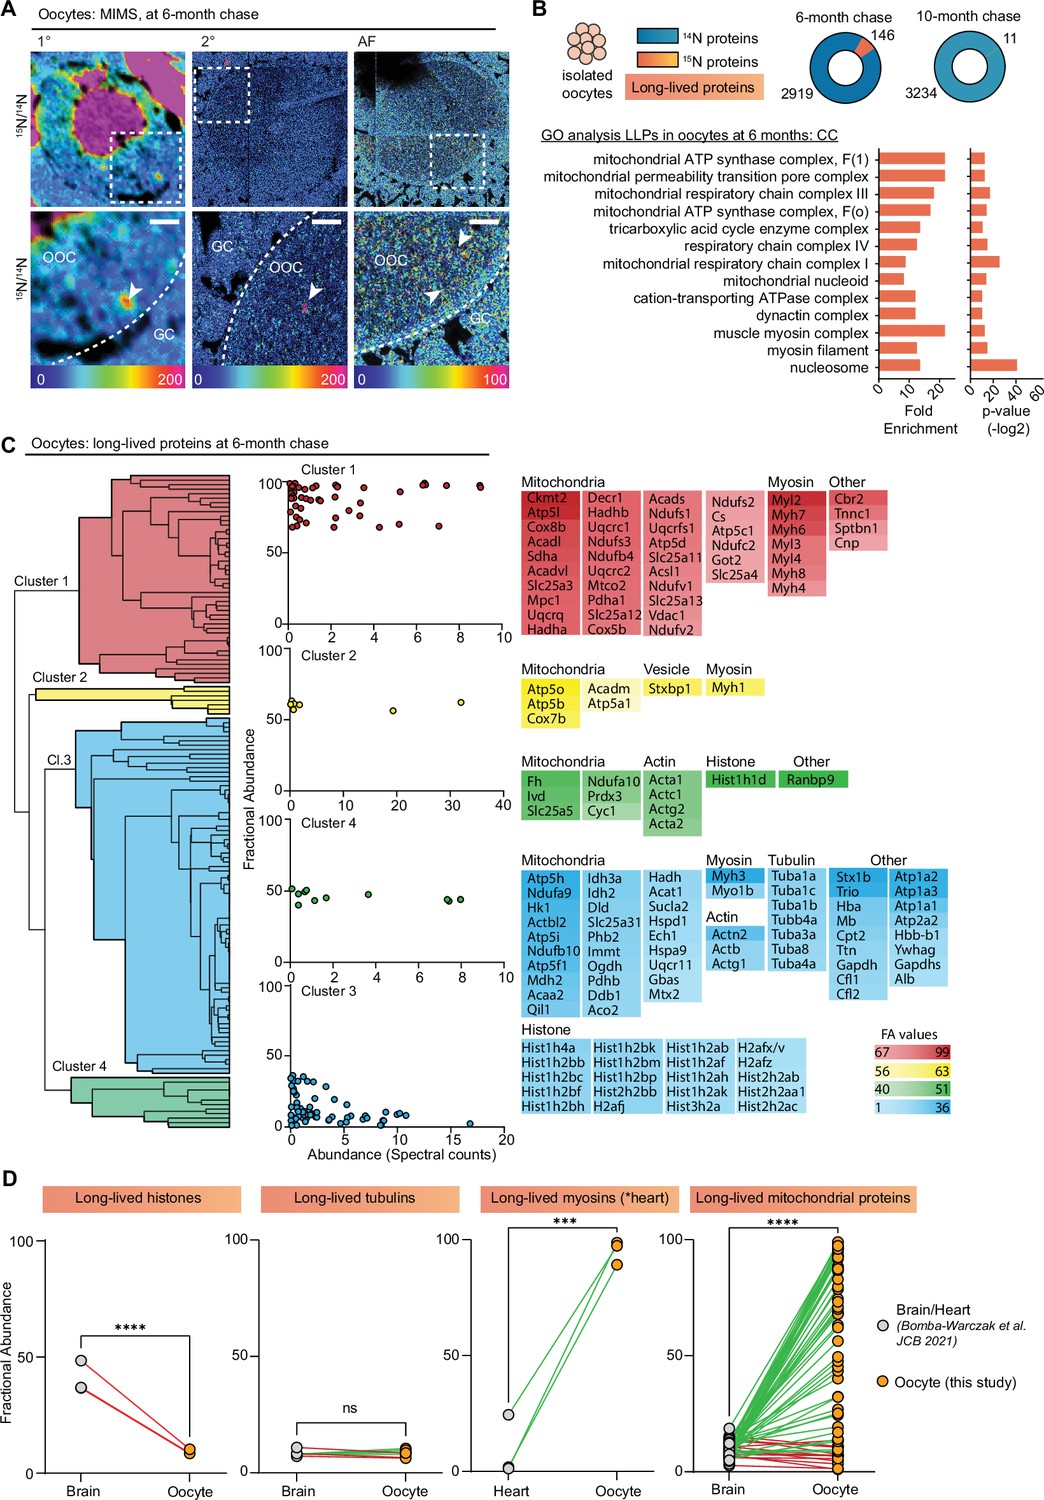
Exceptional longevity of nuclear, cytoskeletal, and mitochondrial proteins in mouse oocytes.
(A) Multi-isotope imaging mass spectrometry (MIMS) analysis reveals high abundance of 15N in nuclei and throughout the cytoplasm of oocytes. (B) Purified oocyte population was harvested from pulse-chased mice and analyzed using gel-liquid chromatography mass spectrometry (LC-MS/MS). Charts illustrate the number of proteins identified at each timepoint (blue) along with long-lived proteins (orange). Gene ontology (GO) analysis of the long-lived proteins (LLPs) identified in oocytes at 6-month chase revealed an enrichment for terms related to nucleosome, myosins, and mitochondria. (C) Hierarchical cluster analysis of fractional abundance of LLPs identified in oocytes. (D) Direct comparison of fractional abundances of proteins previously identified as long-lived and LLPs in oocytes. Mean ± SEM; oocytes collected from four to seven females per timepoint, ***p-value<0.001, ****p-value<0.0001 by Kruskal-Wallis ANOVA with Tukey’s multiple comparisons test. Scale bar = 4 µm.
Figure 3—figure supplement 1
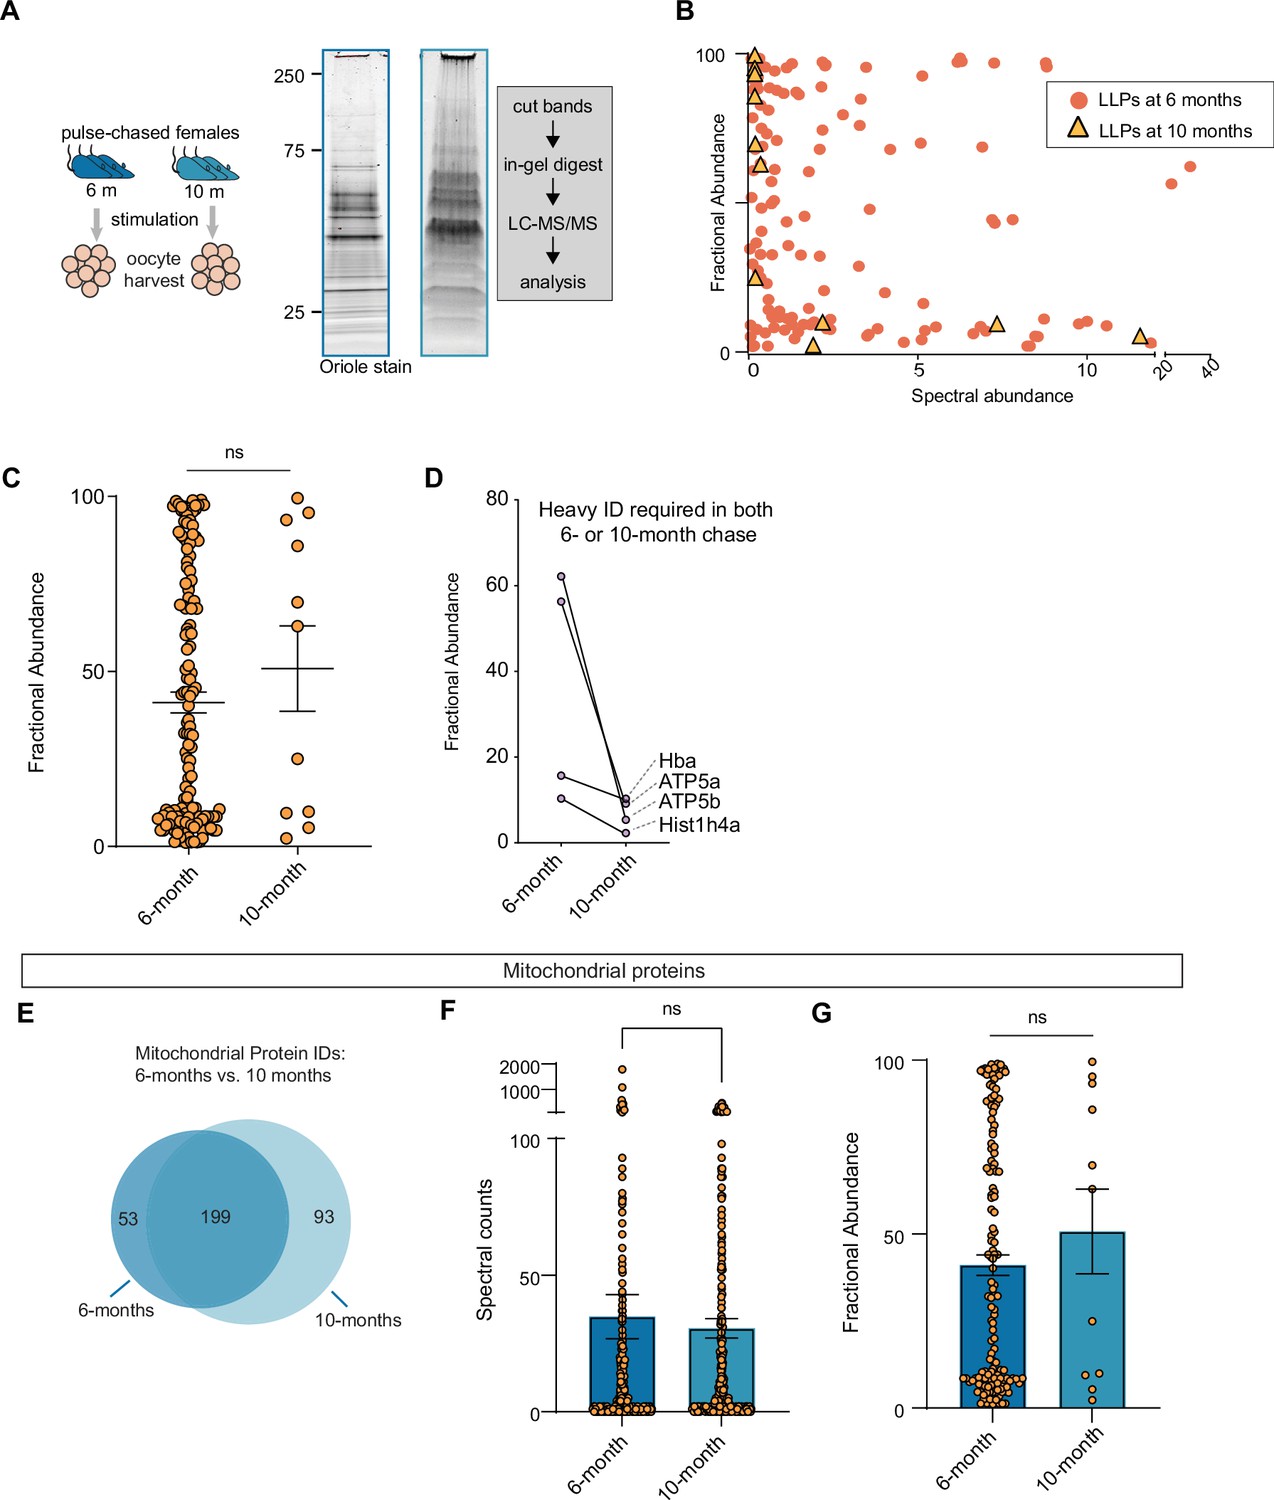
Long-lived proteins at 6- and 10-month chase points in oocytes.
(A) Experimental scheme to identify and measure long-lived proteins (LLPs) mouse oocyte. (B, C) Fractional abundance of each identified LLPs at both 6 and 10 months as compared to the spectral abundance for each LLPs. (D) Plots showing decrease in fractional abundance (FA) values for same proteins identified as LLPs at 6- and 10-month chase. (E) Venn diagram illustrating the overlap of mitochondrial proteins identified at 6- and 10-month timepoints. (F) Spectral counts of mitochondrial proteins as well as the (G) fractional abundance of each identified mito-LLPs at both 6 and 10 months, illustrating that even though there are no significant difference in spectral counts at each timepoint, the number of quantified proteins decreased dramatically between 6 and 10 months of chase. Mean ± SEM; oocytes collected from four to seven females per timepoint, statistical analysis: Kruskal-Wallis ANOVA with Tukey’s multiple comparisons test.
-
Figure 3—figure supplement 1—source data 1
PDF containing original scan of oriole-stained gel with annotations.
- https://cdn.elifesciences.org/articles/93172/elife-93172-fig3-figsupp1-data1-v1.zip
-
Figure 3—figure supplement 1—source data 2
PDF containing original scan of oriole-stained gel with annotations.
- https://cdn.elifesciences.org/articles/93172/elife-93172-fig3-figsupp1-data2-v1.zip
-
Figure 3—figure supplement 1—source data 3
Original oriole-stained gel of oocyte homogenate collected at 6 m timepoint.
- https://cdn.elifesciences.org/articles/93172/elife-93172-fig3-figsupp1-data3-v1.zip
-
Figure 3—figure supplement 1—source data 4
Original oriole-stained gel of oocyte homogenate collected at 10 m timepoint.
- https://cdn.elifesciences.org/articles/93172/elife-93172-fig3-figsupp1-data4-v1.zip
Additional files
-
Supplementary file 1
Summary of proteins identified in 6- and 10-month chase ovaries.
- https://cdn.elifesciences.org/articles/93172/elife-93172-supp1-v1.xlsx
-
Supplementary file 2
Summary of proteins identified in 6- and 10-month chase oocytes.
- https://cdn.elifesciences.org/articles/93172/elife-93172-supp2-v1.xlsx
-
MDAR checklist
- https://cdn.elifesciences.org/articles/93172/elife-93172-mdarchecklist1-v1.docx
Download links
A two-part list of links to download the article, or parts of the article, in various formats.
Downloads (link to download the article as PDF)
Open citations (links to open the citations from this article in various online reference manager services)
Cite this article (links to download the citations from this article in formats compatible with various reference manager tools)
Exceptional longevity of mammalian ovarian and oocyte macromolecules throughout the reproductive lifespan
eLife 13:RP93172.
https://doi.org/10.7554/eLife.93172.3


