Bacterial vampirism mediated through taxis to serum
- Washington State University, Department of Veterinary Microbiology and Pathology, United States
- University of Oregon, Institute of Molecular Biology, United States
- University of Oregon, Department of Chemistry & Biochemistry, United States
- Washington State University, Department of Mathematics and Statistics, United States
Figures
Figure 1
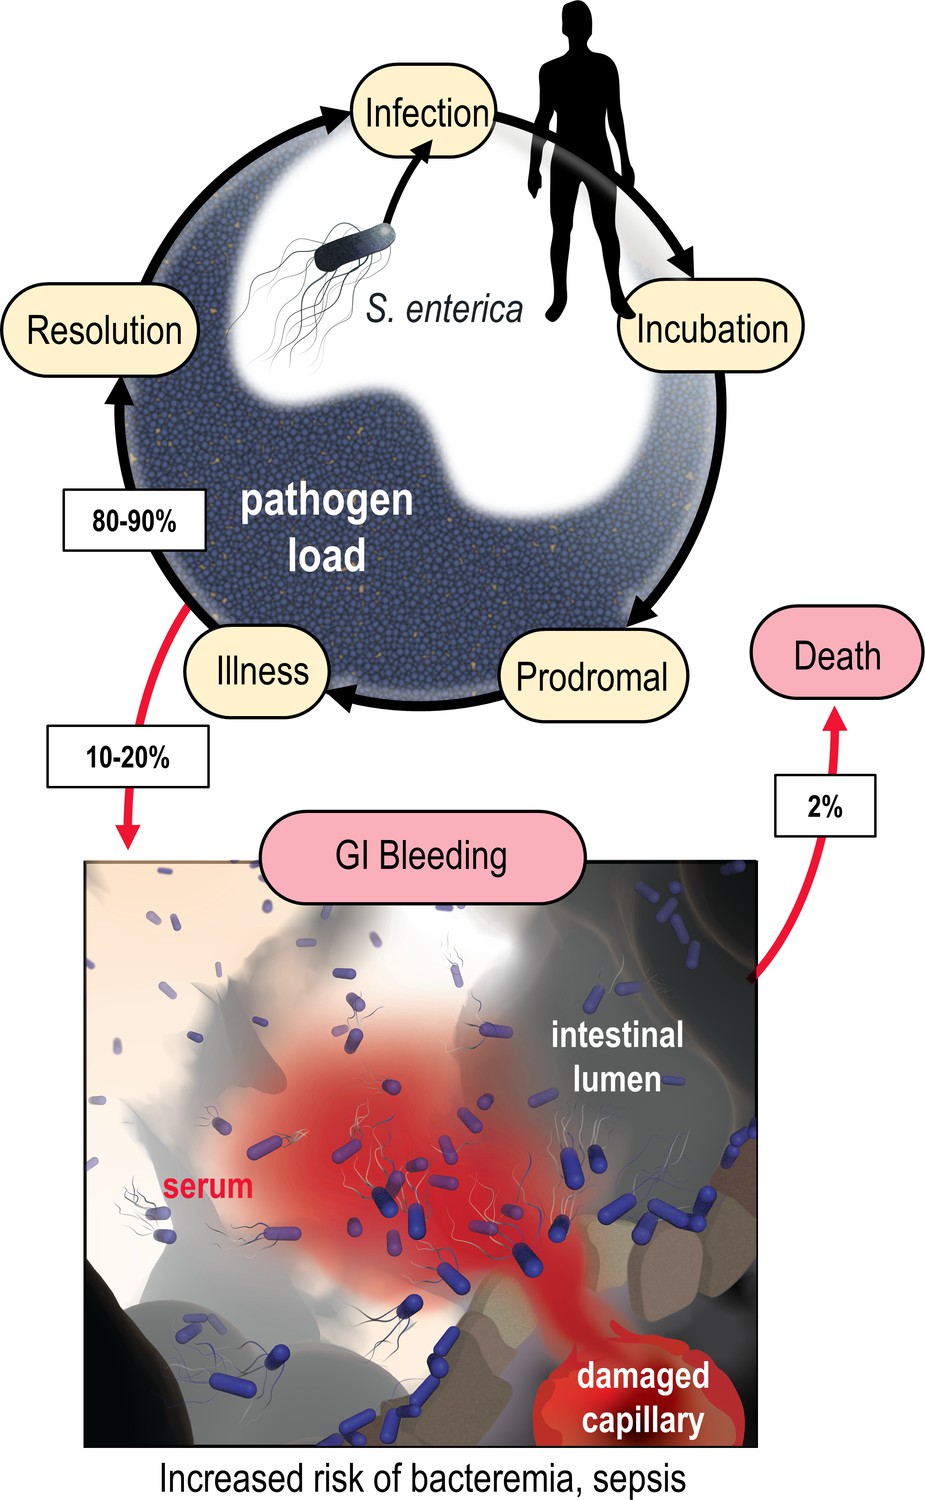
Model of the microenvironment of bacterial-induced hemorrhagic lesions.
The typical course of non-typhoidal S. enterica infections is shown proceeding through infection, incubation, prodromal, illness, and resolution stages (black arrows). The atypical route of gastrointestinal (GI) bleeding, associated with increased mortality and morbidity, is shown in red arrows, with rates approximated from available literature. An artistic depiction of bacterial injury tropism is shown bottom.
Figure 2 with 2 supplements
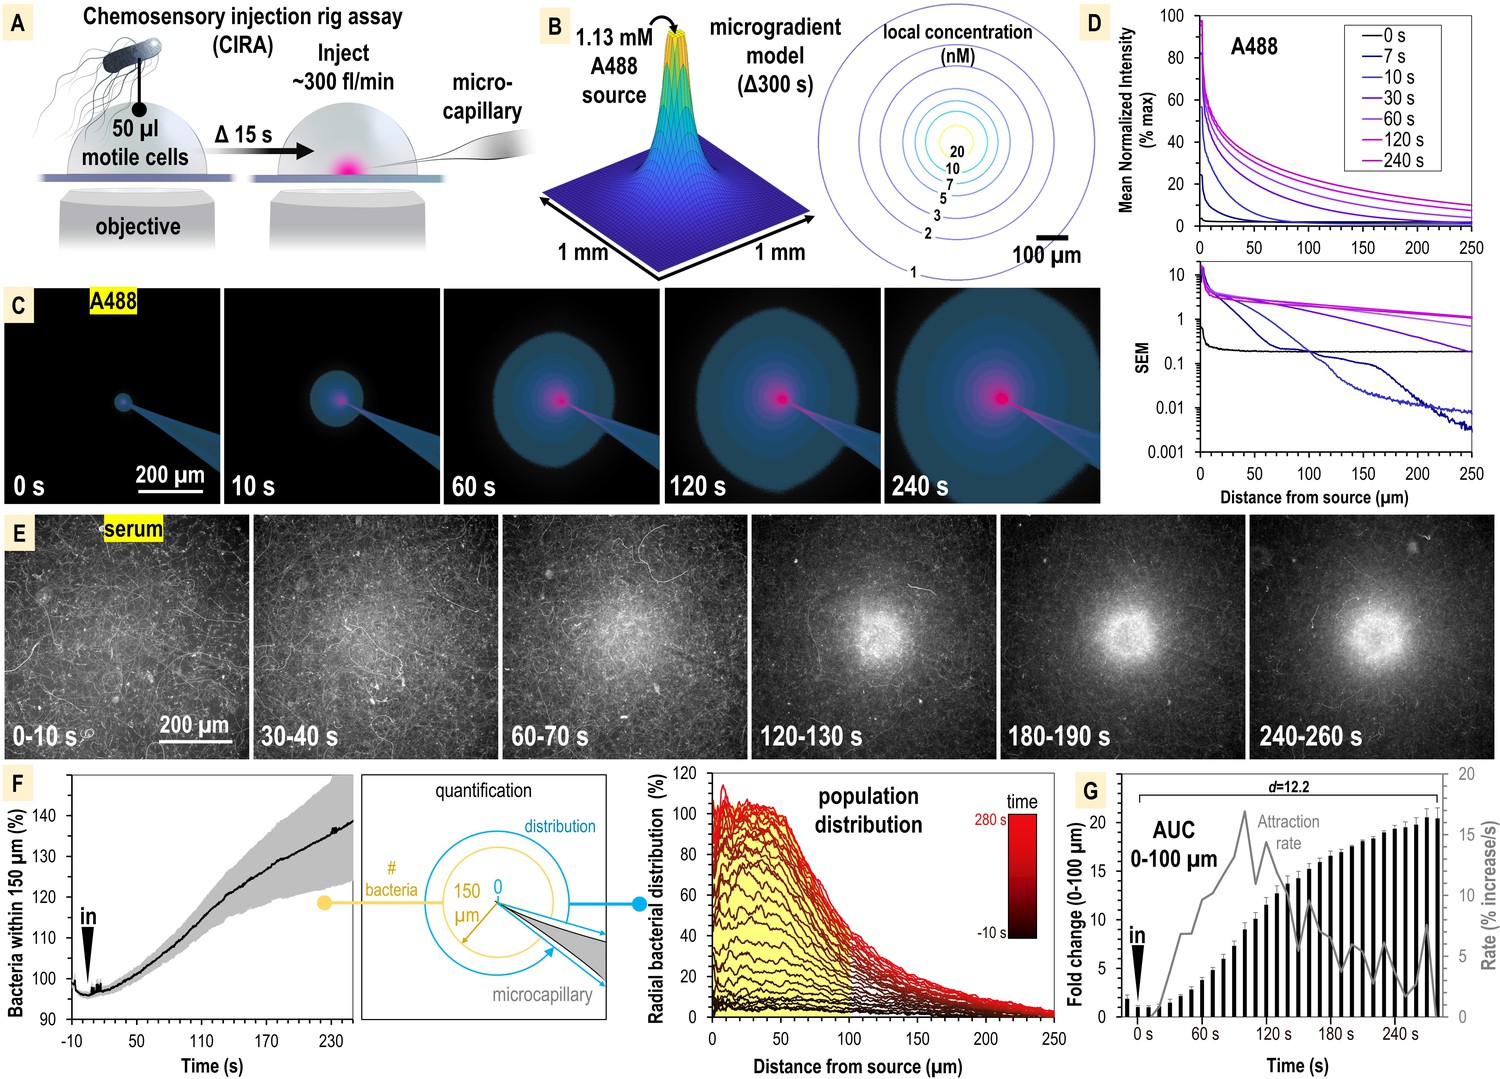
S. enterica Typhimurium IR715 rapidly localizes toward human serum.
(A) Chemosensory injection rig assay (CIRA) experimental design. (B) CIRA microgradient diffusion model, simulated with a source of 1.13 mM A488 dye after 300 s of injection. (C) Experimental visualization of the CIRA microgradient with A488 dye. (D) Injection and diffusion of A488 dye. Shown at the top is the mean normalized fluorescence intensity at representative time points as a function of distance from the source, and shown at the bottom is the standard error of the mean (SEM) for these data (n = 6). (E) Response of S. enterica Typhimurium IR715 to human serum (max projections over 10 s intervals). (F) Quantification of S. enterica Typhimurium IR715 attraction response to human serum (n = 4, 37°C) characterized as either the relative number of bacteria within 150 µm of the source (left) or the radial distribution of the bacterial population over time (right, shown in 10 s intervals). (G) Area under the curve (AUC) versus time for the bacterial population within 100 µm of the serum treatment source (area indicated in yellow in F). Effect size (Cohen’s d) between the treatment start and endpoints is indicated. Insertion of the treatment microcapillary is indicated with black ‘in’ arrow. Attraction rate over time indicated in gray. Data shown are means, error bars indicate SEM.
Figure 2—figure supplement 1
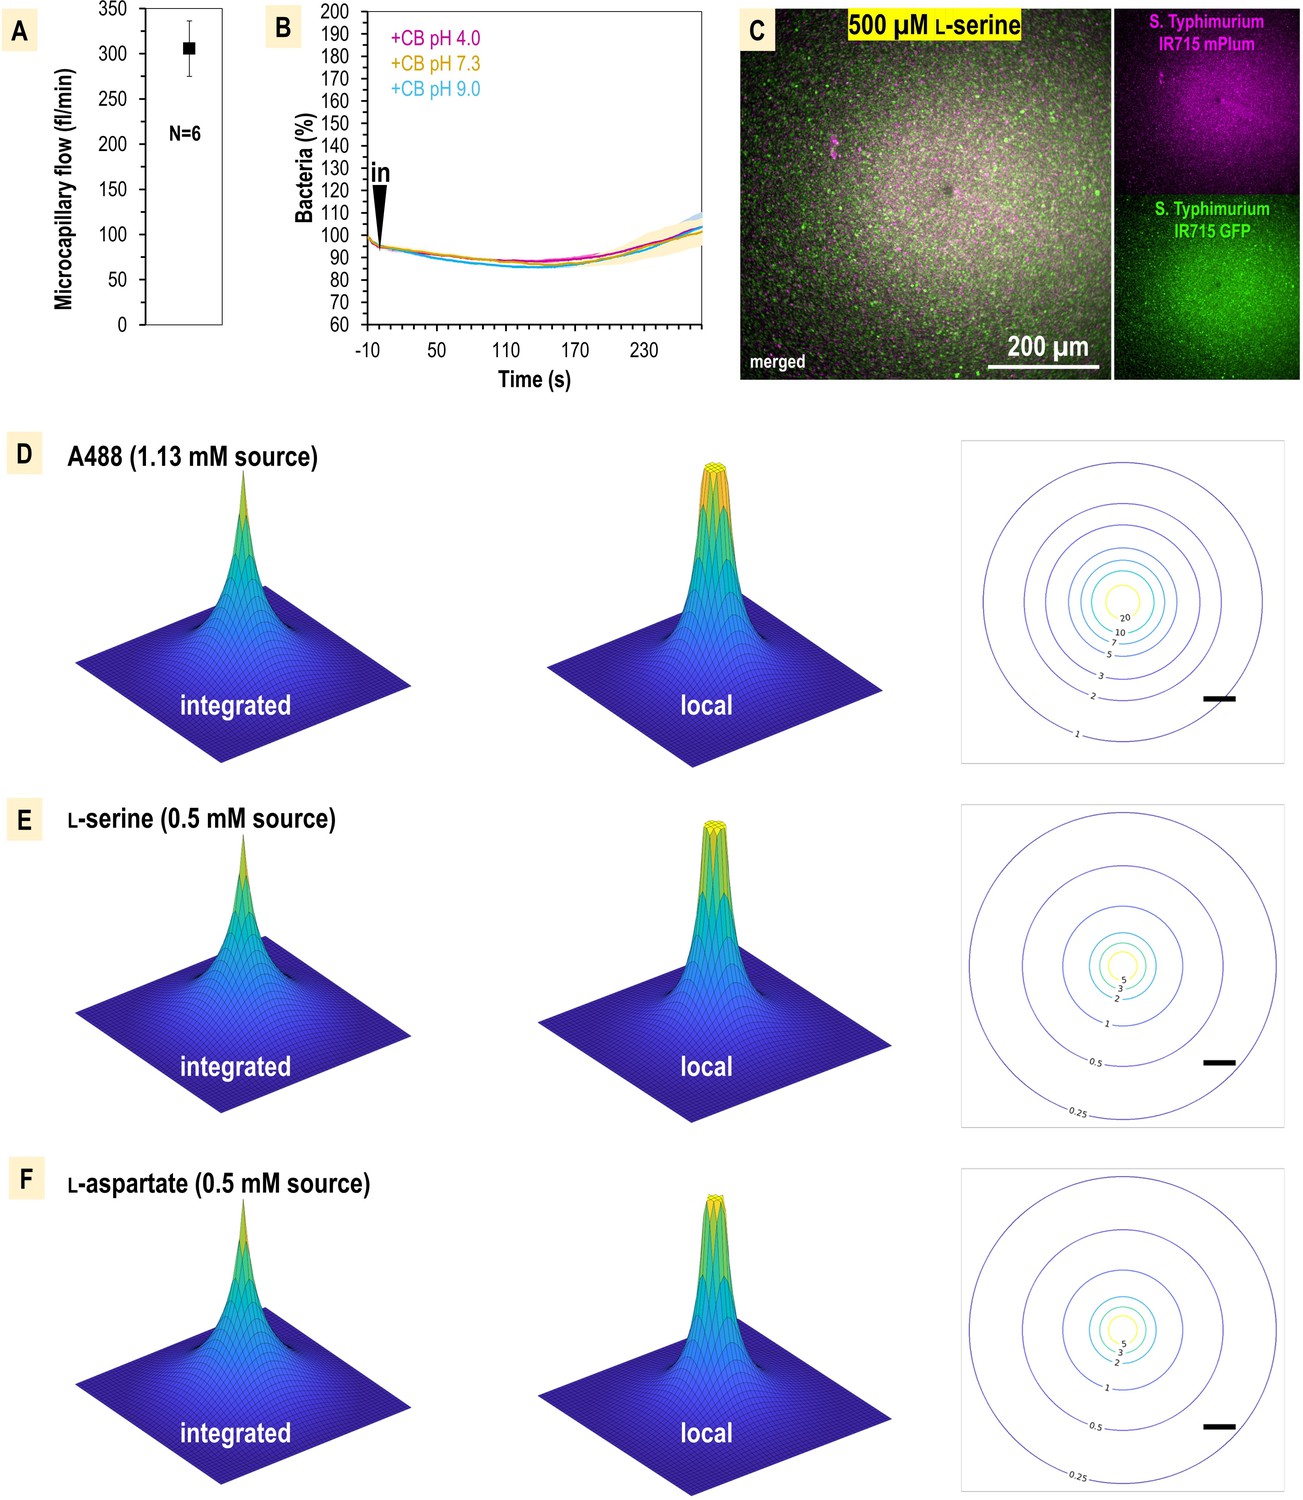
Chemosensory injection rig assay (CIRA) experimentation controls and microgradient modeling.
(A) Average injection flow of treatment solution from the glass microcapillary. Flow was measured through injection of known concentrations of methylene blue dye, diluted in CB, into a 50 µl pond of CB over 20 min. After treatments, the absorbance of solutions was measured at 665 nm and quantified based on a standard curve. Applying a compensation pressure of 35 hPa resulted in an average flow of 305.5 fl/min ± 31. (B) CIRA localization in response to treatments of buffered CB of different pH. (C) Comparison of responses of GFP versus mPlum strains using CIRA. (D–F) Model of the CIRA microgradient for effectors relevant to this study. Topology maps of 1 mm × 1 mm size are shown for each microgradient in an ‘integrated’ format, which models what is seen by eye from the bottom-up view of the microscopy plane (left), or as the local concentration that would be experienced by a bacterium at a given distance (center). A plane through the center of the treatment sphere is shown (right), with relative concentrations experienced at a given distance expressed in nM units (scale bar is 100 µm).
Figure 2—figure supplement 2

Comparison of chemosensory injection rig assay (CIRA) diffusion modeling with experimental A488 data.
Computed (red dashed) and measured (black solid) integrated concentrations of A488 as a function of distance from injection site for time t = 120 s. Both quantities are reported as a percentage of the concentration at the injection site (1.1 mM). The relative error (blue solid) is reported as the relative difference of the measured concentration to the computed concentration.
Figure 3
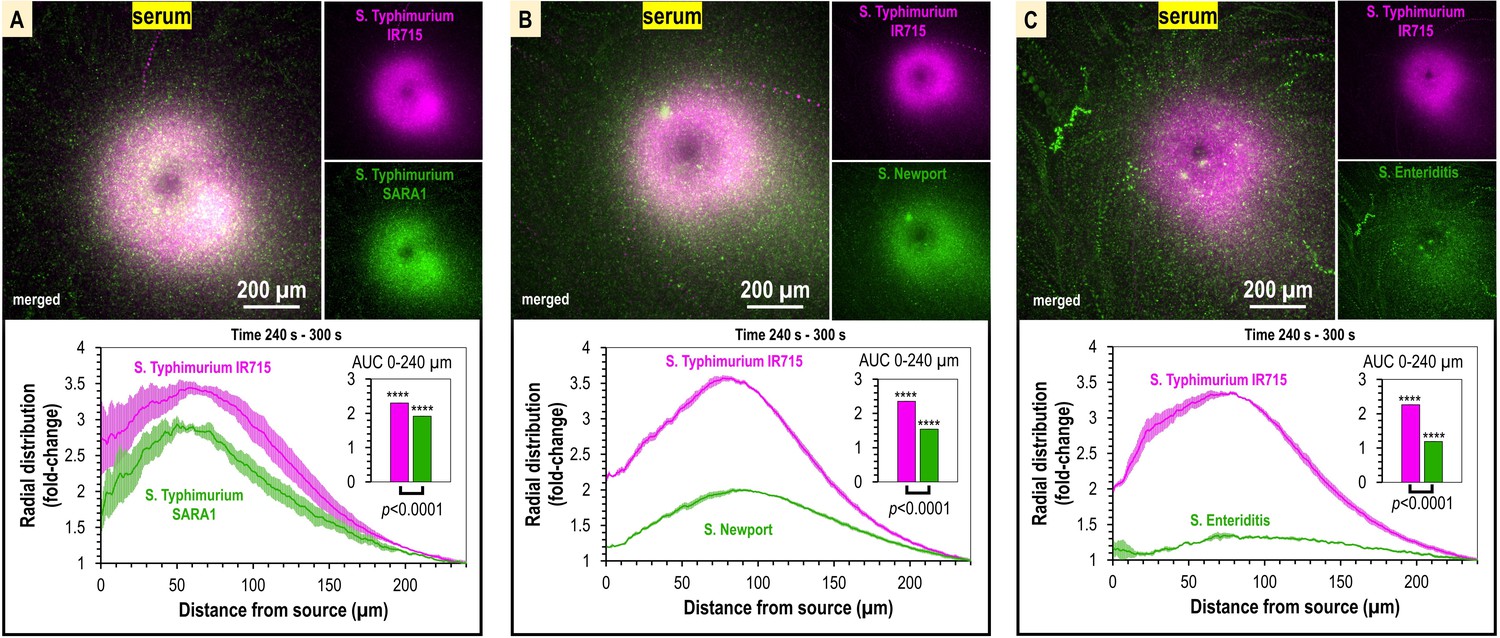
Taxis to human serum is retained across S. enterica clinical isolates and diverse serovars.
(A–C) Chemosensory injection rig assay (CIRA) competition experiments between S. Typhimurium IR715 (pink) and clinical isolates (green) responding to human serum for 5 min (n = 4, 37°C). Images are representative max projections over the final minute of treatment. Radial distributions calculated from max projections and averaged across replicates are shown as fold-change relative to the image periphery at 240 µm from the source. Inset plots show fold-change area under the curve (AUC) of strains in the same experiment relative to an expected baseline of 1 (no change). p-Values shown are calculated with an unpaired two-sided t-test comparing the means of the two strains, or one-sided t-test to assess statistical significance in terms of change from onefold (stars). Data shown are means, error bars indicate SEM.
Figure 4 with 1 supplement
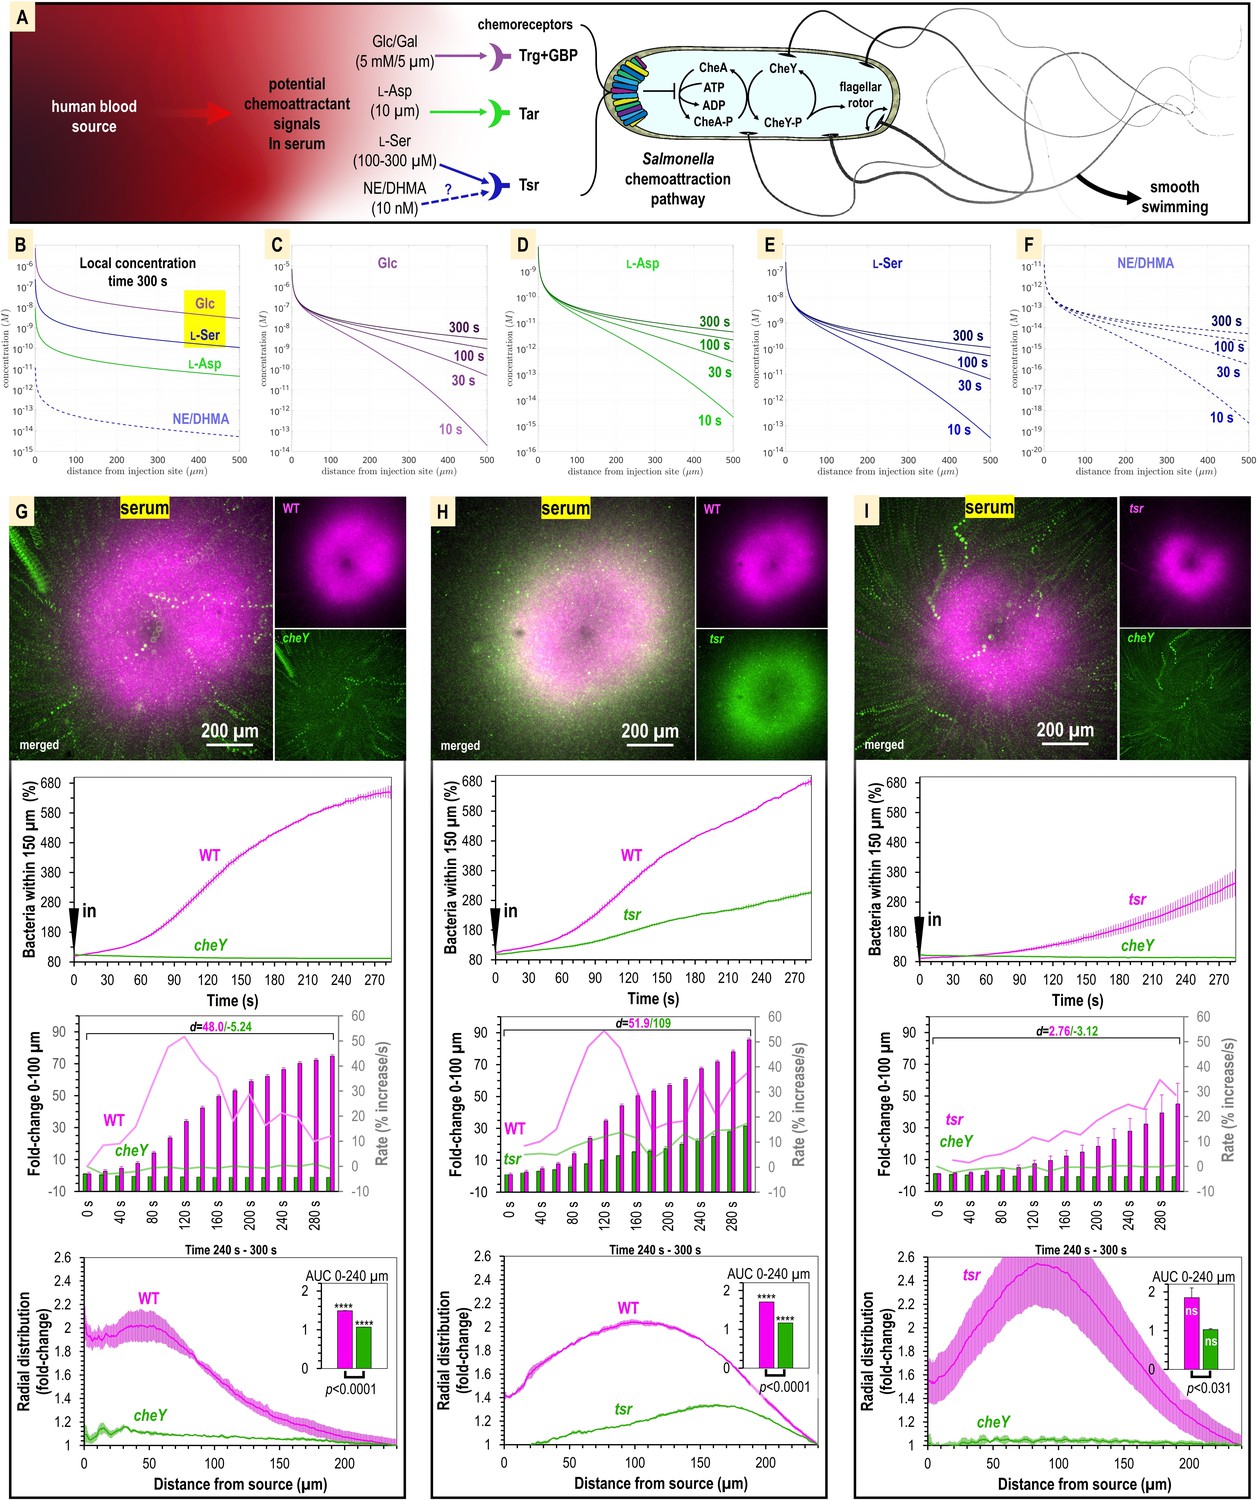
Attraction to human serum is mediated through chemotaxis and the chemoreceptor Tsr.
(A) Potential mechanisms involved in Salmonella sensing of chemoattractants present in human serum. Approximate concentrations of these effectors in human serum are indicated in parentheses (Zhou et al., 2023). (B–F) Microgradient modeling of serum chemoattractant concentrations. (G–I) Chemosensory injection rig assay (CIRA) competition experiments between S. Typhimurium IR715 WT and isogenic mutants cheY, or tsr, and tsr versus cheY, in response to human serum (n = 3–4, 37°C). Rates in terms of fold-change are indicated with light pink/light green lines and plotted on the gray secondary y-axis. Inset area under the curve (AUC) plots are shown as described in Figure 3. Data are means, and error bars are SEM.
Figure 4—figure supplement 1
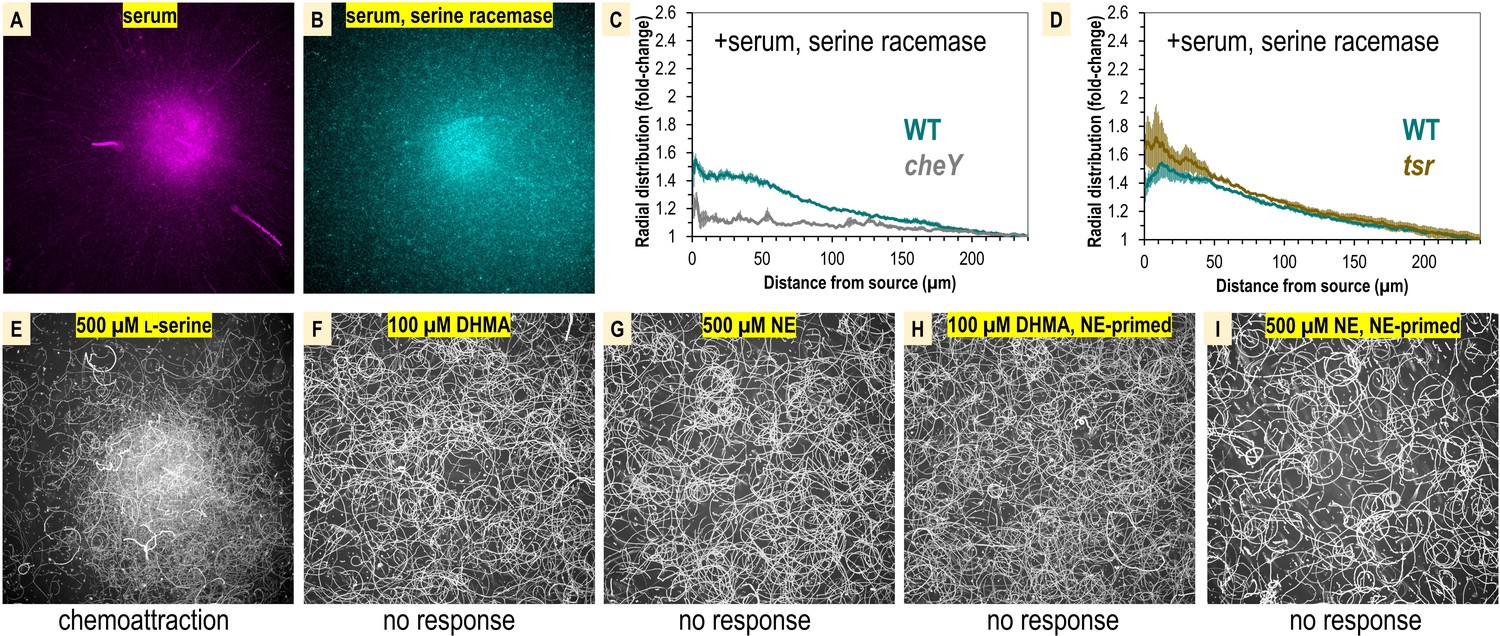
Comparison of S. Typhimurium IR715 chemotactic responses to human serum, human serum with serine racemase treatment, L-serine versus 3,4-dihydroxymandelic acid (DHMA) and norepinephrine (NE) .
(A, B) Shown are max projections from chemosensory injection rig assay (CIRA) experiments over a 10 s time period following 300 s of treatments as shown. (C, D) The radial distribution of bacteria in CIRA competition experiments with serine-racemase-treated human serum after 300 s is shown. (E–I) Shown are max projections over 10 s following CIRA treatments, as indicated. The chemotactic response is noted below each experiment. Panels (H–I) utilized cells that were primed with 5 µM NE for 3 hr prior to experimentation.
Figure 5 with 1 supplement
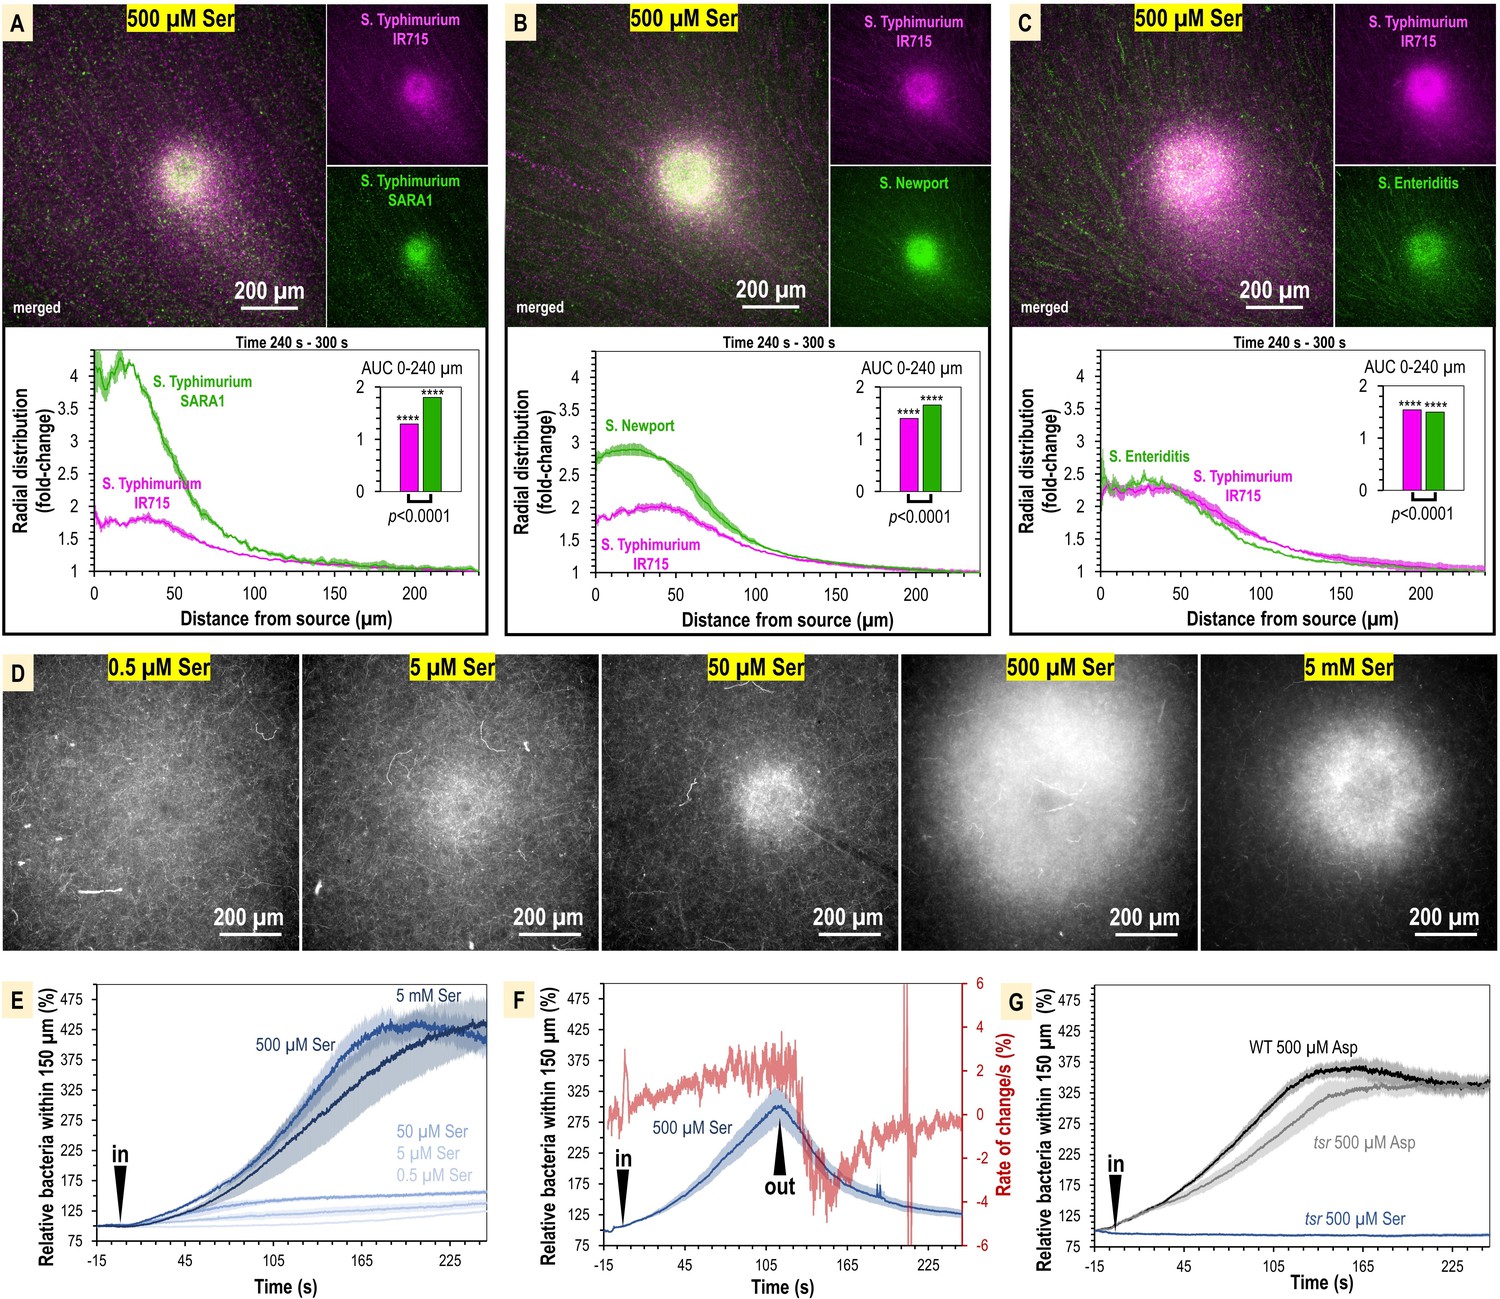
The concentration of L-serine in human serum is sufficient to mediate chemoattraction.
(A–C) Chemosensory injection rig assay (CIRA) competition experiments between S. Typhimurium IR715 (pink) and clinical isolates (green) in response to 500 µM L-serine (n = 3, 37°C). (D) Representative results showing max projections of S. Typhimurium IR715 at 240–300 s post CIRA treatment with L-serine concentrations (30°C). (E) Quantification of multiple replicate experiments shown in (D). (F) Attraction and dispersion of S. Typhimurium IR715 following addition and removal of 500 µM L-serine source (30°C). (G) S. Typhimurium IR715 WT or tsr mutant responses to L-aspartate or L-serine treatments (30°C).
Figure 5—figure supplement 1
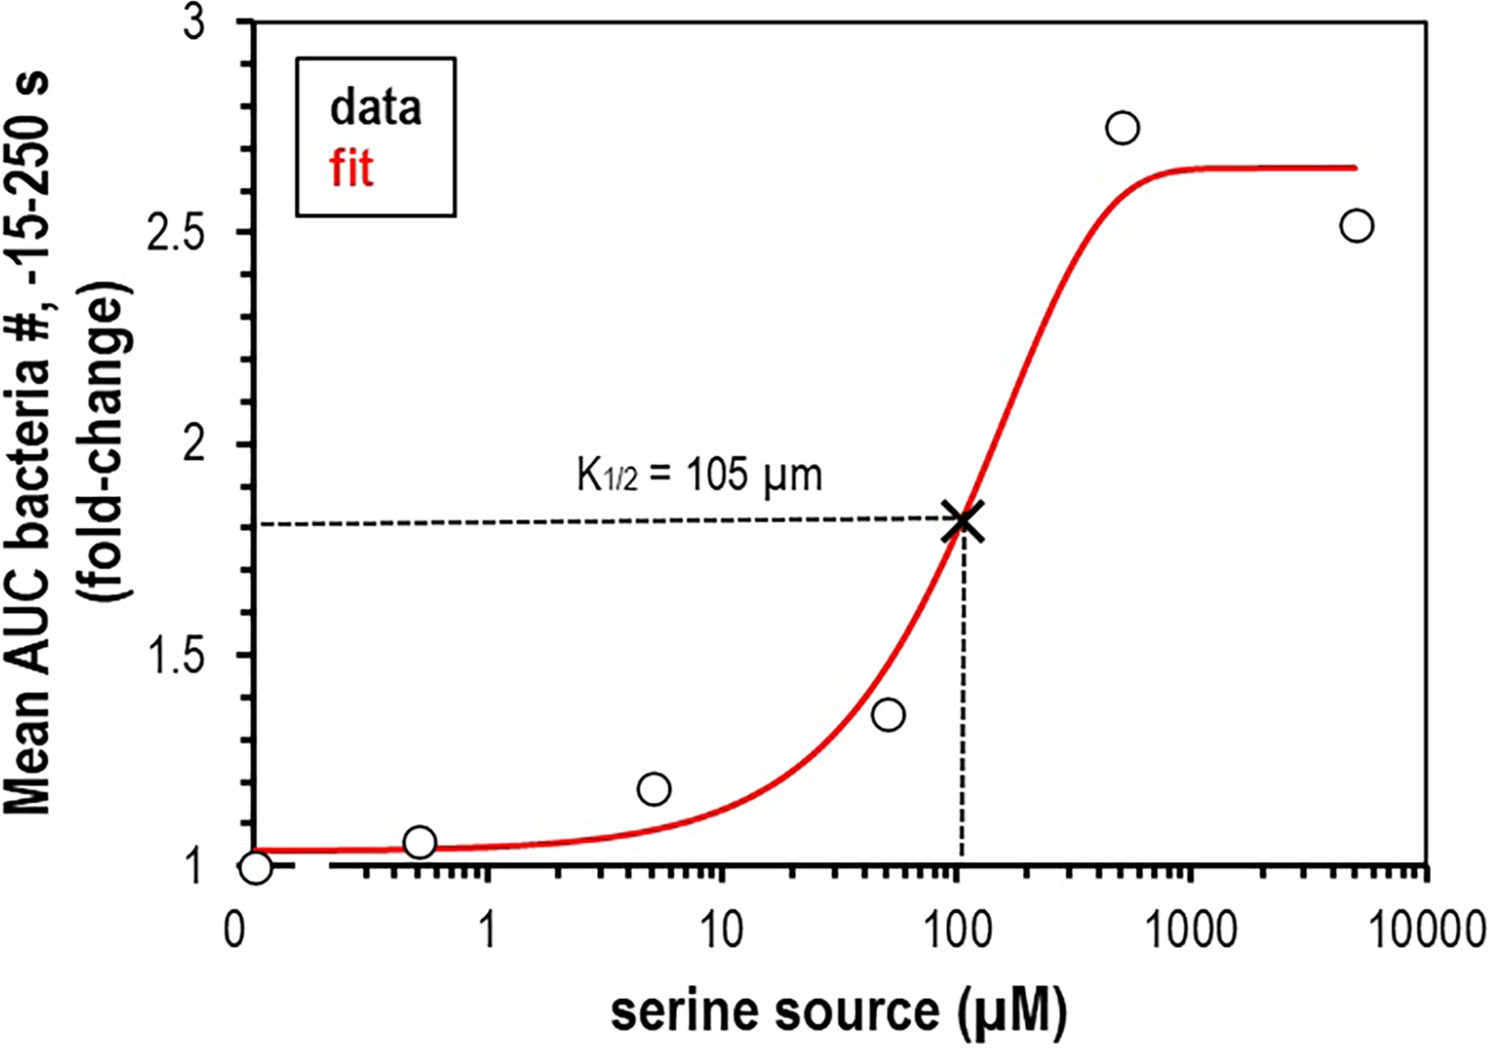
Calculation of L-serine source required for half-maximal chemoattraction response (K1/2).
Data are mean area under the curve (AUC) values of relative number of bacteria within 150 µm of the treatment location for the –15 s to 250 s range, represented as fold-change. Data are fit with an exponential curve (red line). , where a = 2.636193, b = −1.616338, and c = 0.006282888. K1/2 is calculated to be 105 µm (x, dashed lines).
Figure 6 with 1 supplement
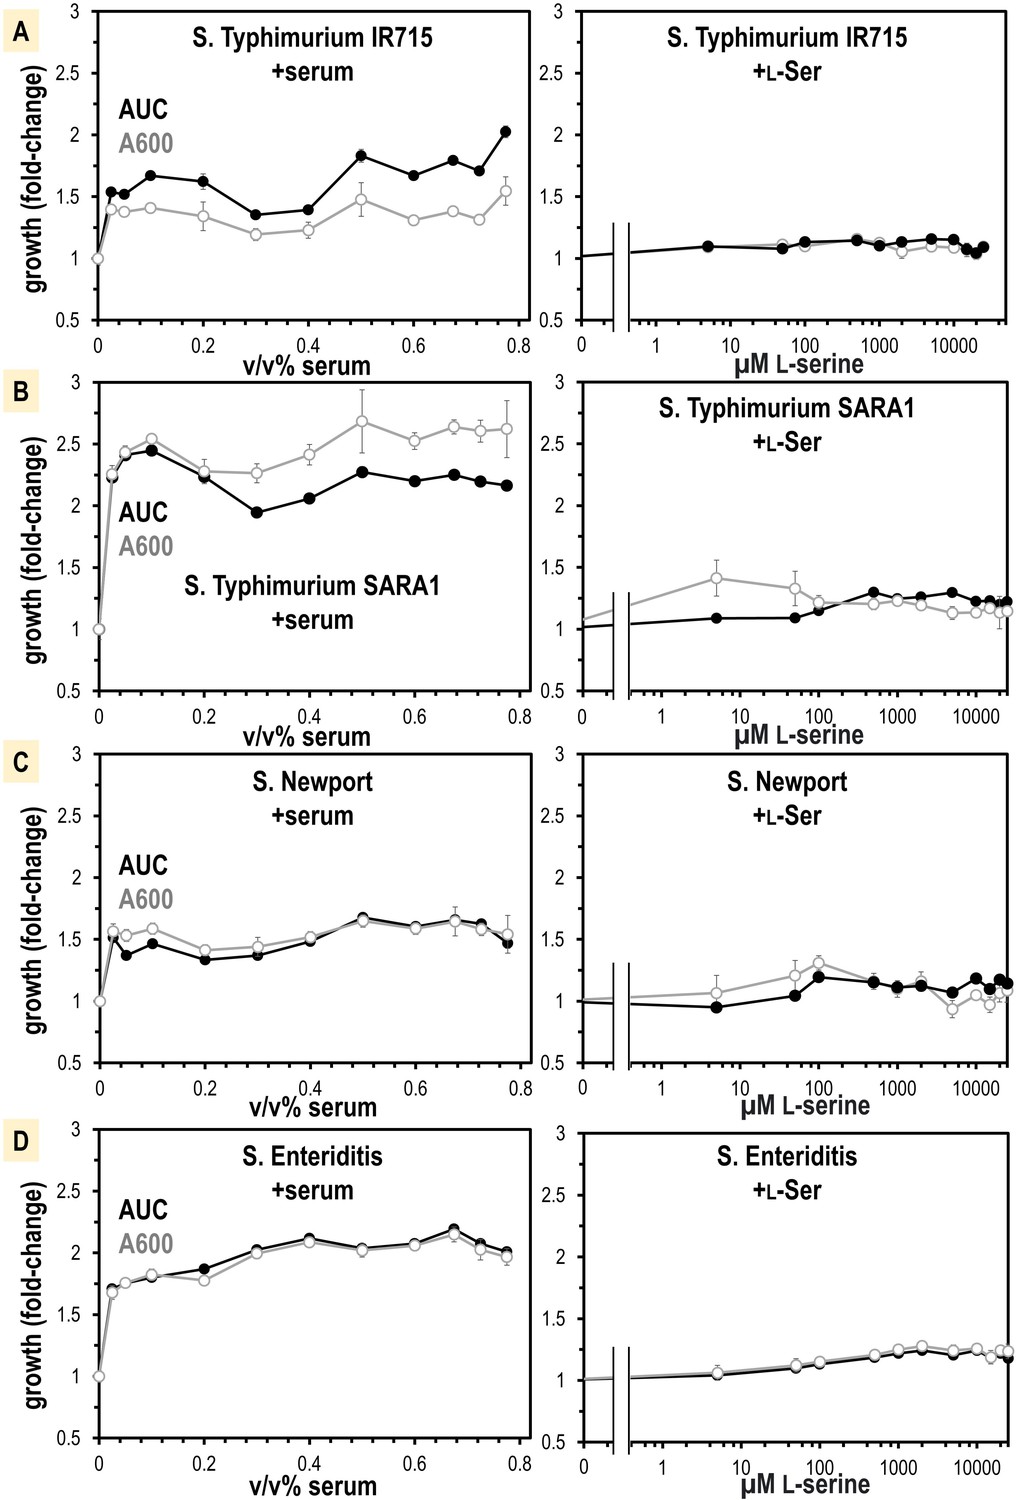
Non-typhoidal S. enterica strains obtain a growth benefit from human serum not recapitulated from L-Ser treatments alone.
(A–D) Growth is shown as area under the curve (AUC, black) and A600 at mid-log phase for the untreated replicates (gray, n = 16). Data are means, and error is SEM.
Figure 6—figure supplement 1

Total serine present in human serum samples, as determined by mass spectrometry.
Treatment with 50 µg recombinant serine dehydratase (SDS) over 4 hr did not decrease serine content in human serum.
Figure 7 with 1 supplement
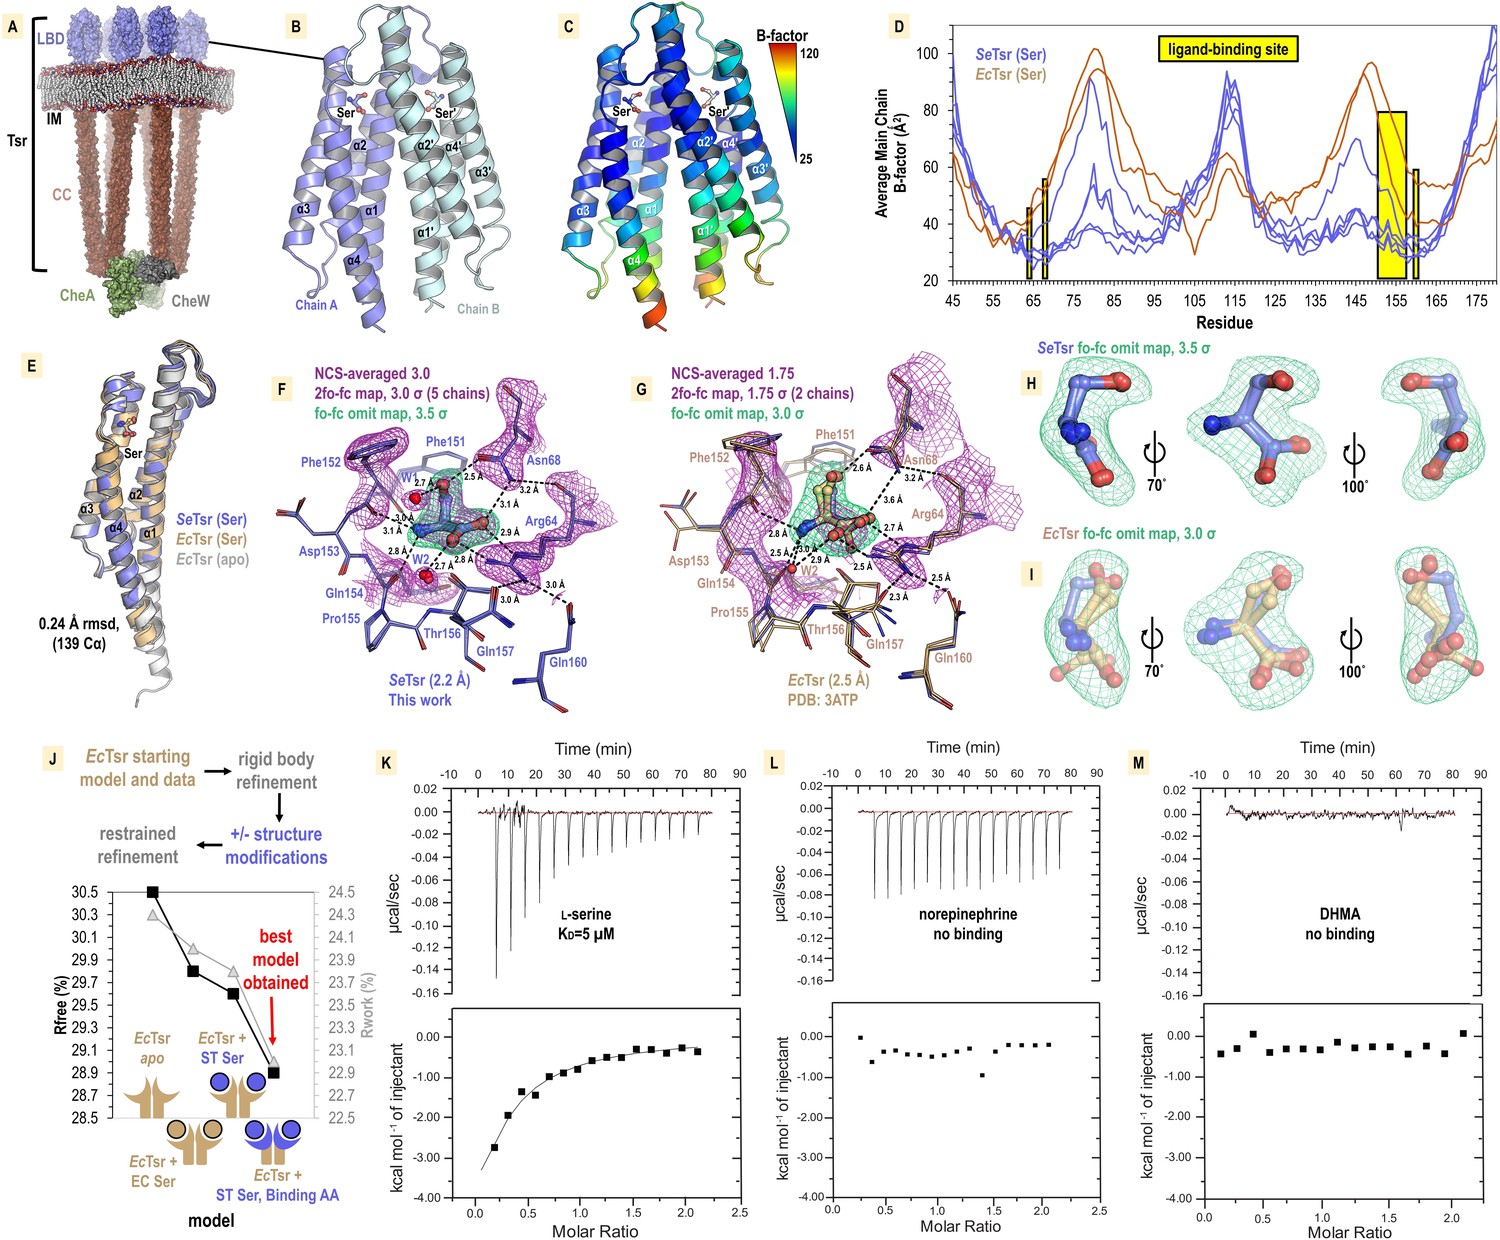
Structural mechanism underlying taxis to serum.
(A) Model of the core chemoreceptor signaling unit showing two full-length Tsr chemoreceptor trimer-of-dimers; coiled-coil region (CC), inner membrane (IM) Cassidy et al., 2020. (B) Crystal structure of S. enterica Tsr ligand-binding domain (LBD) dimer in complex with L-serine (2.2 Å). (C, D) Relative order of the SeTsr structure as indicated by B-factor (Å2). (E) Overlay of chains from serine-bound SeTsr (blue), serine-bound EcTsr (orange), and apo EcTsr (white). (F) Binding of the L-serine ligand as seen with an overlay of the five unique chains of the asymmetric unit (AU) in the SeTsr structure. Purple mesh represents averaged non-crystallographic symmetry 2fo-fc omit map electron density (ligand not included in the density calculations). Green mesh represents fo-fc omit map difference density for Chain A. Hydrogen bonds to the ligand are shown as dashed black lines with distances indicated in Å. (G) The ligand-binding site of serine-bound EcTsr is shown as in (F), with omit map fo-fc electron density. The two chains of EcTsr in the AU are overlaid (orange) with one chain of serine-bound SeTsr (blue). (H, I) Closeup view of the L-serine ligand and fo-fc omit map density for the SeTsr (blue) and EcTsr (orange) structures, respectively. (J) Paired refinement comparing resulting crystallographic R-factors, as indicated. The schematics indicate for each refinement which parts of the Tsr LBD dimer were modeled as in the EcTsr structure (orange) or SeTsr structure (blue), with the crescent shape representing the ligand-binding site. For each refinement strategy and resulting model, Rfree values (black) and Rwork values (gray) are indicated. (K–M) Isothermal titration calorimetry analyses of the SeTsr LBD with L-serine, norepinephrine (NE) , or 3,4-dihydroxymandelic acid (DHMA).
Figure 7—figure supplement 1
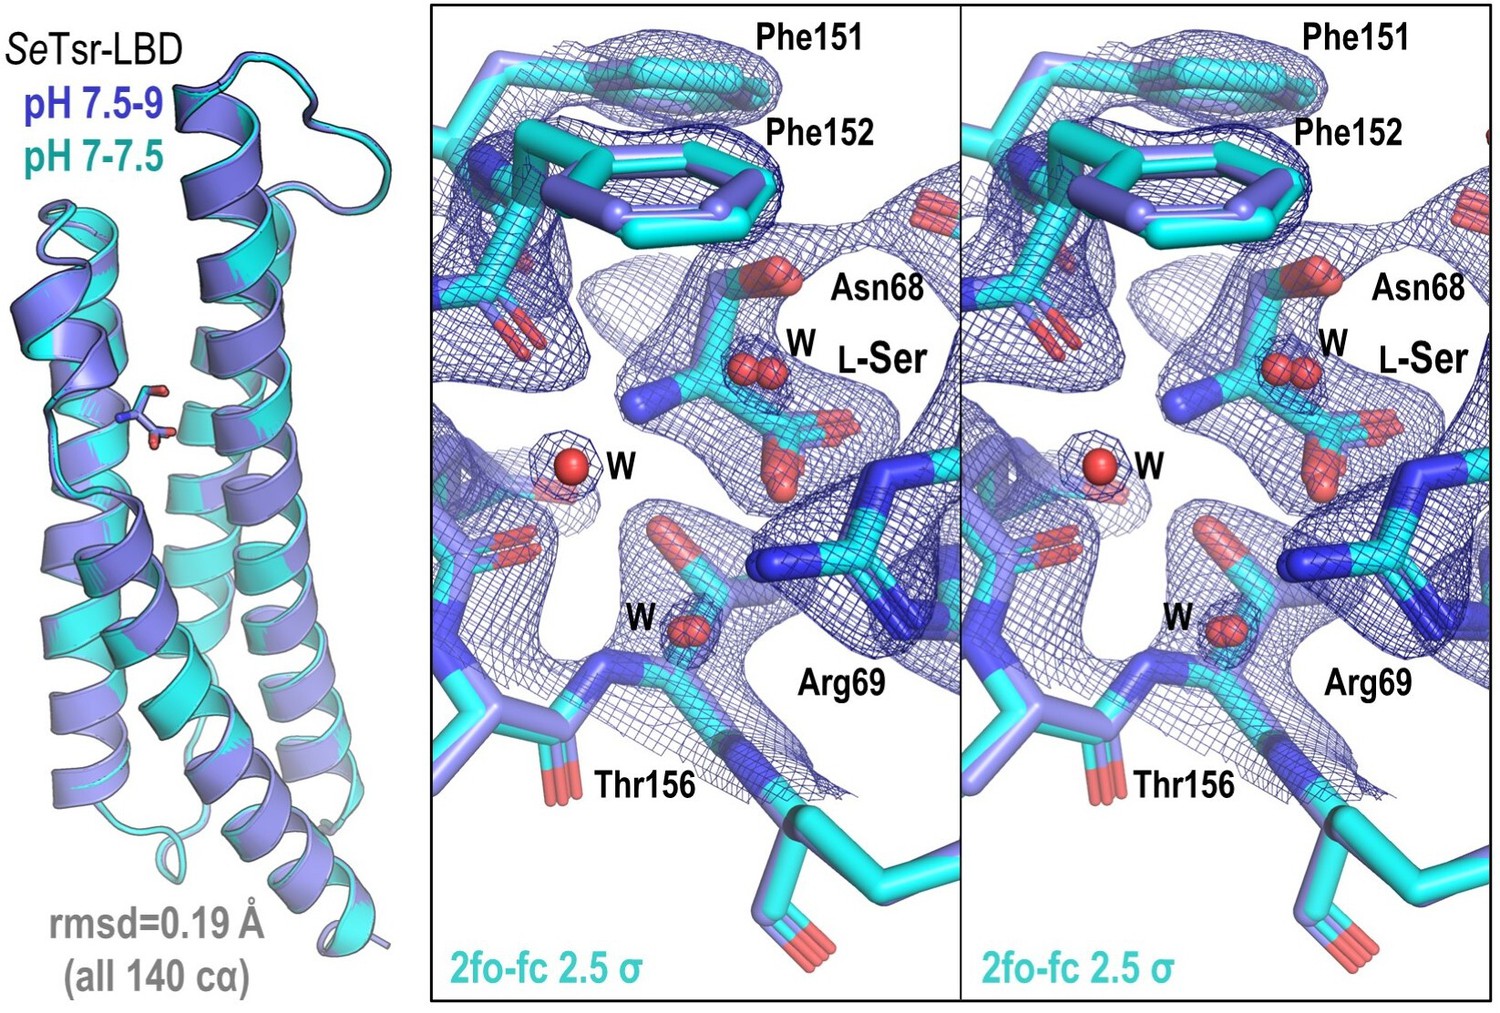
Comparison of SeTsr ligand-binding domain (LBD) structures solved at different pH.
Shown on the left is an overlay of SeTsr at pH 7.5–9.7 (PDB: 8FYV, dark blue) and pH 7–7.5 (PDB: 8VL8, light blue). Shown on the right is a stereo image of the overlaid L-Ser binding site with electron density shown for the pH 7–7.5 structure as blue mesh.
Figure 8
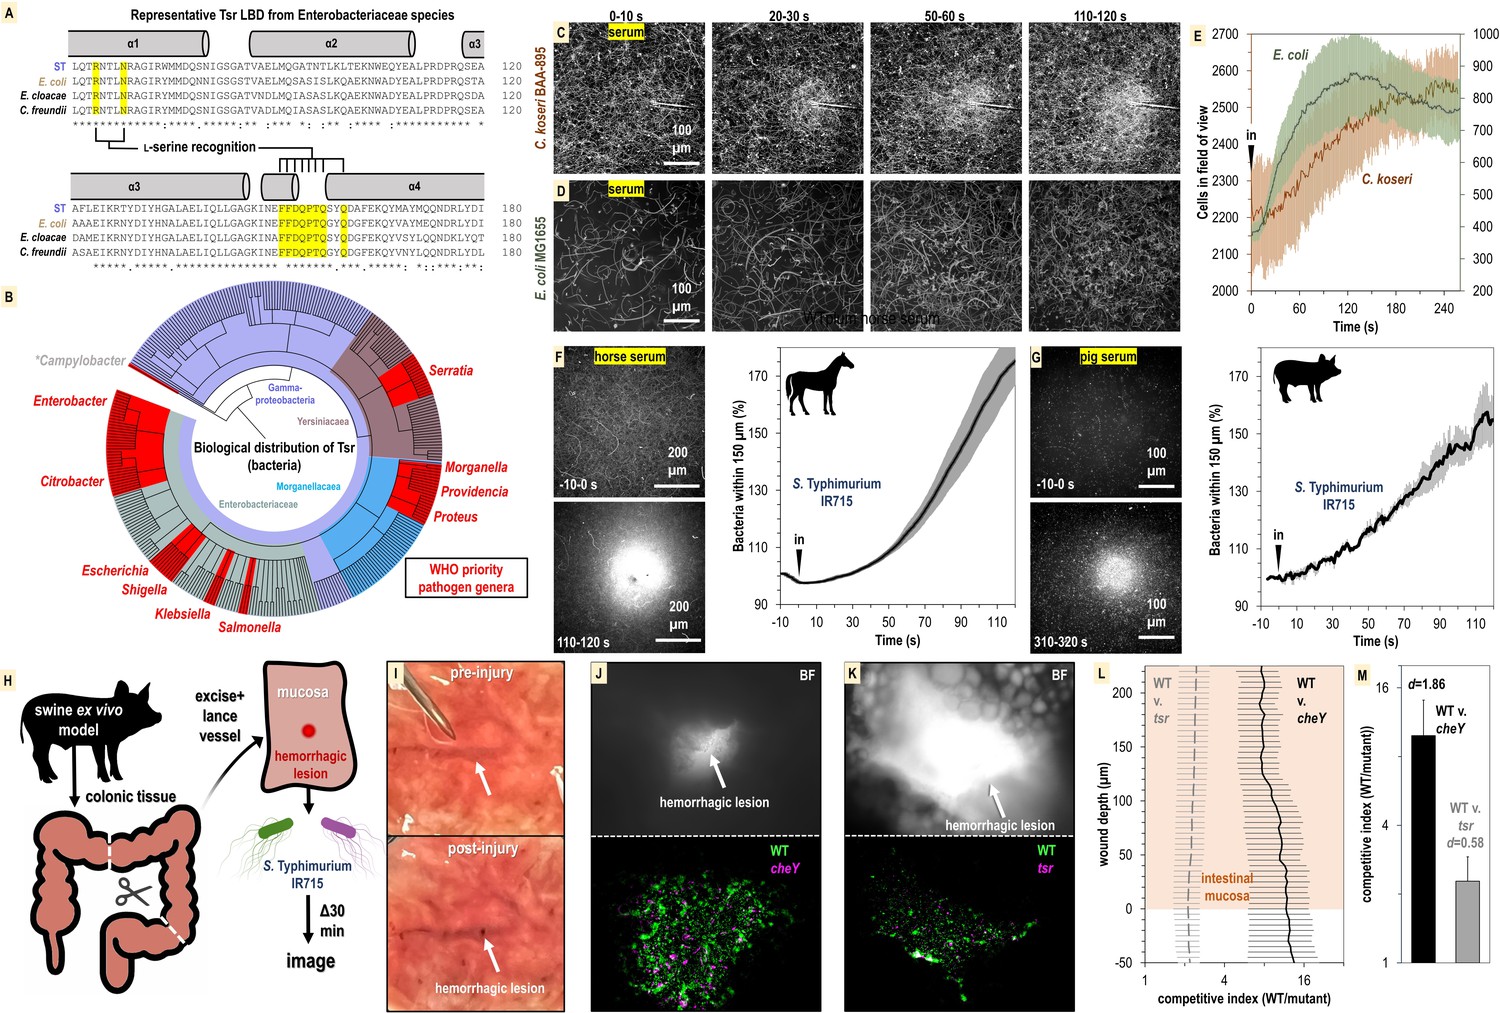
Relevance of bacterial vampirism in other systems.
(A) Sequence conservation of the Tsr ligand-binding domain among representative Enterobacteriaceae orthologues with residues of the L-serine ligand-binding pocket highlighted. (B) Biological distribution of Tsr orthologues. WHO priority pathogen genera are highlighted in red. (C, D) Response of C. koseri BAA-895 (n = 3, 37°C) and E. coli MG1655 to human serum (n = 3, 30°C), shown as max projections at indicated time points. (E) Quantification of chemotaxis responses. Plotted data shown are shown on separate y-axes as mean cells in the field of view averaged over 1 s. (F, G) Response of wildtype (WT) S. Typhimurium IR715 to horse serum or pig serum. (H) Overview of swine ex vivo colonic hemorrhagic lesion model. (I) Representative images of colonic mucosa before (top) and after (bottom) lancing of vasculature. (J, K) Representative images showing bacterial localization into colonic hemorrhagic lesions in co-inoculation experiments with WT (gfp) and cheY (dtom) (n = 4), or WT (gfp) and tsr (dtom) (n = 3) S. Typhimurium IR715. The lesion is shown in brightfield (BF, top) and gfp/dtom fluorescent channels (bottom). (L) Competitive indices of migration into lesions. The mucosa is set to a y-axis value of 0, and migration further into the lesion is reflected by increasing y-axis values. The x-axis is shown on a log scale. (M) Area under the curve (AUC) quantification of bacterial lesions localization shown in (L) (0–225 µM). Effect size (Cohen’s d) is noted. Data shown are means, and error bars show SEM.
Figure 9
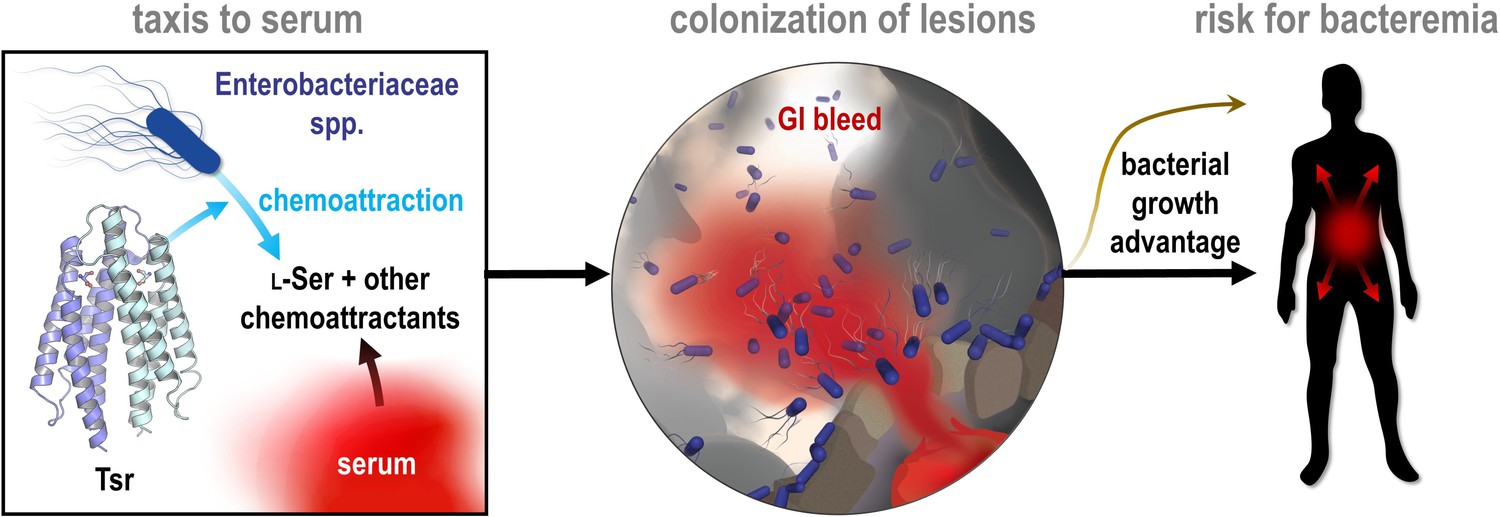
Model of bacterial vampirism.
Serum contains high concentrations of L-Ser, and other chemoattractants, that are recognized by chemoreceptors, including Tsr, to drive Enterobacteriaceae taxis toward serum. Taxis to serum promotes colonization of enterohemorrhagic lesions and provides a bacterial growth advantage from nutrients acquired from serum. The bacterial behavior of seeking and feeding on serum, which we have defined as ‘bacterial vampirism’ may represent a risk factor for bacterial entry into the bloodstream.
Videos
Video 1
A488 vs. S. enterica Typhimurium IR715 + serum.
Representative chemosensory injection rig assay (CIRA) experiments with Alexa Fluor 488 dye (left) and S. enterica Typhimurium IR715 treated with human serum (right). Video is shown at 1× speed and is also viewable at https://www.youtube.com/watch?v=dyrQT2Ni5J8.
Video 2
Comparison of responses to human serum between Salmonella strains.
Representative chemosensory injection rig assay (CIRA) experiments comparing responses to human serum between S. enterica Typhimurium IR715 (mplum) and clinical isolates (gfp), as indicated. Videos depict responses over 5 min of treatment. Viewable at https://youtu.be/dwtZtoisjrU.
Video 3
Comparison of responses to human serum between wildtype (WT) and chemotactic mutants (IR715 background).
Representative chemosensory injection rig assay (CIRA) experiments comparing responses to human serum between WT S. enterica Typhimurium IR715 (mplum in left and center panel) and chemotactic mutants tsr (gfp in center panel, mplum in right panel), and cheY (gfp in left and right panel). Videos depict responses over 5 min of treatment. Viewable at https://youtu.be/O5zsEAqcJw8.
Video 4
Comparison of responses to 500 µM L-serine between Salmonella strains.
Representative chemosensory injection rig assay (CIRA) experiments comparing responses to 500 µM L-serine between S. enterica Typhimurium IR715 (mplum) and clinical isolates (gfp), as indicated. Videos depict responses over 5 min of treatment. Viewable at https://www.youtube.com/watch?v=p0Tsp06ZHO8.
Video 5
Comparison of responses of S. Typhimurium IR715 to L-serine and norepinephrine.
Chemosensory injection rig assay (CIRA) experiments comparing response of S. Typhimurium IR715 to L-serine or to norepinephrine. Cells are unprimed or primed with norepinephrine (NE) , as indicated. Videos depict responses over 5 min of treatment. Viewable at https://youtu.be/pUOlVjKYptc.
Video 6
Chemosensory injection rig assay (CIRA) experiments showing response of S. Typhimurium IR715 to DHMA.
Cells are unprimed (left) or primed with norepinephrine (NE) (right). Viewable at https://youtu.be/j4YL95QFCuI.
Video 7
SeTsr ligand-binding domain (LBD) crystal structure (PDB: 8FYV) and comparison with EcTsr LBD (PDB: 3ATP).
Crystal structure of S. enterica Typhimurium Tsr LBD (PDB: 8FYV) and comparison with E. coli Tsr LBD crystal structure (PDB: 3ATP). Viewable at https://youtu.be/OlowDhRLNhA.
Video 8
Representative chemosensory injection rig assay (CIRA) experiment showing response of C. koseri BAA-895 to human serum.
Viewable at https://youtu.be/9iMJz2OPbso.
Video 9
Representative chemosensory injection rig assay (CIRA) experiment showing response of E. coli (pxS-gfp) MG1655 to human serum.
Viewable at https://www.youtube.com/watch?v=jq3cj9e52n4.
Tables
Key resources table
| Reagent type (species) or resource | Designation | Source or reference | Identifiers | Additional information |
|---|---|---|---|---|
| Strain, strain background (Salmonella enterica Typhimurium) | Salmonella enterica Typhimurium | Rogers et al., 2020 | IR715 | Nalidixic acid-derivative of ATCC 14028 |
| Strain, strain background (S. enterica Typhimurium) | S. enterica Typhimurium cheY mutant | Rogers et al., 2020 | FR13 | IR715 cheY::Tn10 (TetR) |
| Strain, strain background (S. enterica Typhimurium) | S. enterica Typhimurium tsr mutant | Rogers et al., 2020 | FR4 | IR715 tsr::pFR3 (CmR) |
| Strain, strain background (S. enterica Typhimurium) | S. enterica Typhimurium Clinical Isolate | Beltran et al., 1991 | SARA1 | Isolated from patient in Mexico |
| Strain, strain background (S. enterica Newport) | S. enterica Newport Clinical Isolate | Shariat et al., 2013b | M11018046001A | Isolated from patient in PA, USA |
| Strain, strain background (S. enterica Enteriditis) | S. enterica Enteriditis Clinical Isolate | Shariat et al., 2013a | 05E01375 | Isolated from patient in PA, USA |
| Strain, strain background (Citrobacter koseri) | C. koseri Clinical Isolate | ATCC | BAA-895 | Human Clinical Isolate |
| Strain, strain background (Escherichia coli) | E. coli Clinical Isolate | Karen Guillemin (UO) Millipore Sigma | MG1655, K12 | Model of WT E. coli Rosetta (DE3) BL21 derivative |
| Biological sample (Homo sapiens) | Human serum | This study | Prod. #: ISERABOTCHI100ML | See method details |
| Recombinant DNA reagent | XS Plasmid expressing sfGFP | Wiles et al., 2018 | pXS-sfGFP | pGEN-mcs with a modular sfGFP expression scaffold (AmpR) |
| Recombinant DNA reagent | XS Plasmid expressing mPulm | Wiles et al., 2018 | pXS-mPlum | pGEN-mcs with a modular mPlum expression scaffold (AmpR) |
| Recombinant DNA reagent | pET-30a(+)-SeTsrLBD | This study; Genscript | Vector for recombinant expression of SeTsr LBD (KanR) | |
| Peptide, recombinant protein | SeTsr LBD | This study | See ‘Method details’ |
Additional files
-
Supplementary file 1
Table of crystallographic statistics.
- https://cdn.elifesciences.org/articles/93178/elife-93178-supp1-v2.docx
-
Supplementary file 2
Database of Tsr homologue sequences.
- https://cdn.elifesciences.org/articles/93178/elife-93178-supp2-v2.csv
-
MDAR checklist
- https://cdn.elifesciences.org/articles/93178/elife-93178-mdarchecklist1-v2.docx
Download links
A two-part list of links to download the article, or parts of the article, in various formats.
Downloads (link to download the article as PDF)
Open citations (links to open the citations from this article in various online reference manager services)
Cite this article (links to download the citations from this article in formats compatible with various reference manager tools)
Bacterial vampirism mediated through taxis to serum
eLife 12:RP93178.
https://doi.org/10.7554/eLife.93178.3


