An antimicrobial drug recommender system using MALDI-TOF MS and dual-branch neural networks
- Department of Data Analysis and Mathematical Modelling, Ghent University, Belgium
Figures
Figure 1
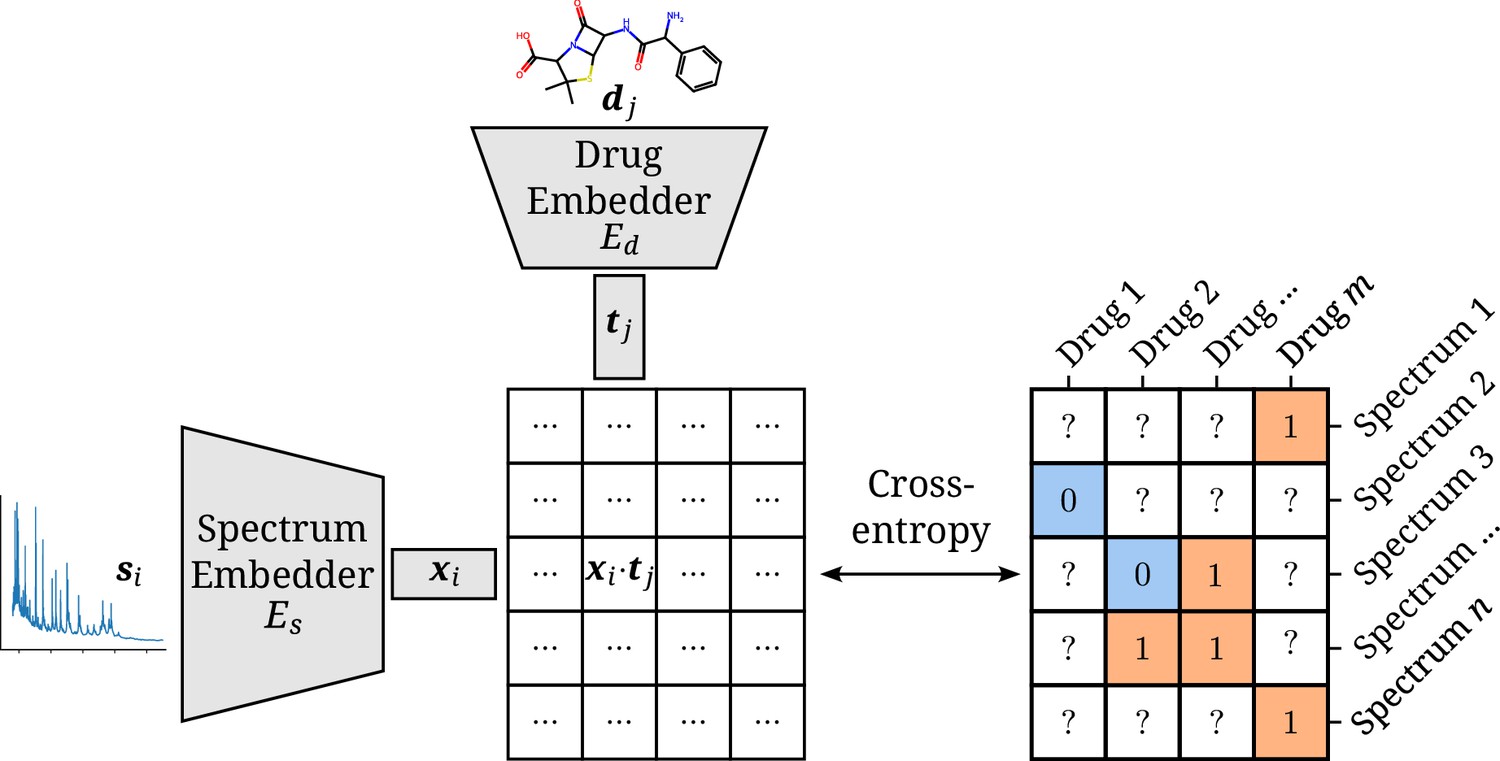
Architectural overview of the proposed model.
Antimicrobial resistance (AMR) labels of spectrum–drug pairs can be represented in an incomplete matrix. A microbial sample that is susceptible to a drug is denoted by a negative label (orange), whereas positive labels (blue) signify an intermediate or resistant combination. Instance (spectrum) and target (drug) embeddings and are obtained from their respective input representations passed through their respective neural network branch. The two resulting embeddings are aggregated to a single score by their (scaled) dot product. The cross-entropy loss optimizes this score to be maximal or minimal for positive or negative combinations of microbial spectra and drugs, respectively.
Figure 2
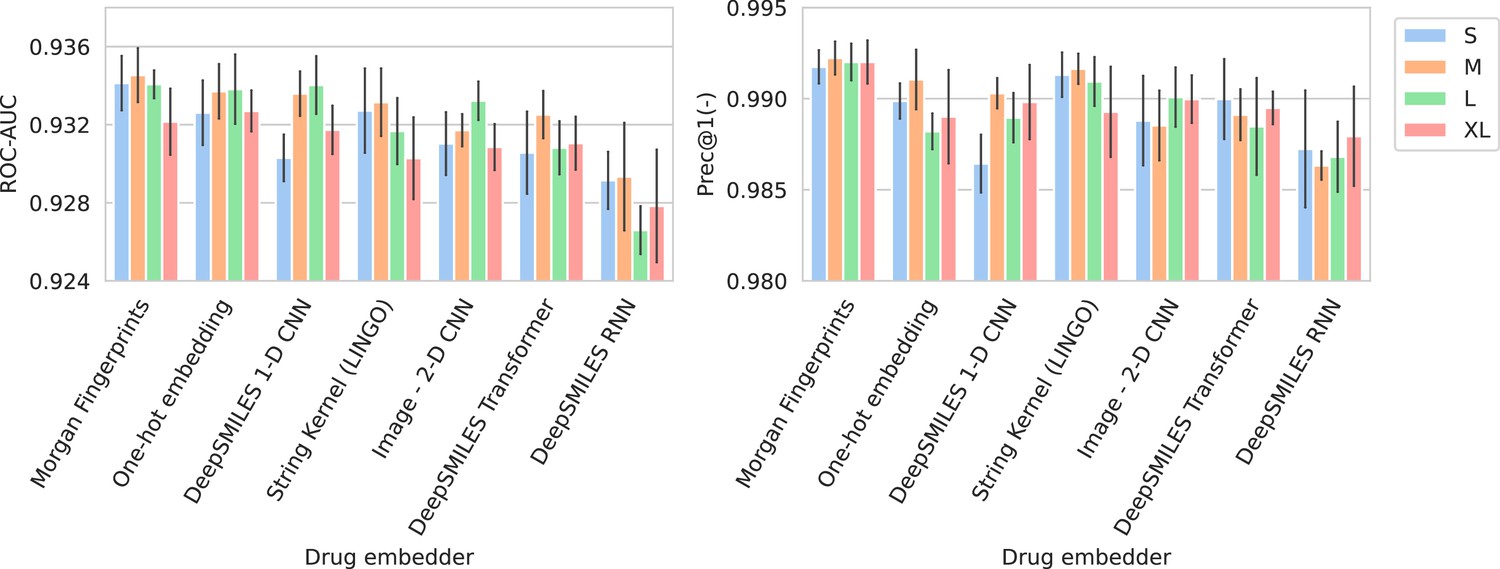
Barplots showing test performance results for all trained models.
Area under the receiver operating characteristic curve (ROC-AUC) evaluates overall ranking of predictions. Prec@1(-) evaluates how often the top suggested treatment would be effective. Both metrics are calculated per spectrum/patient and then averaged. Errorbars represent the standard deviation over five random model seeds. The x-axis and colors show the different drug and spectrum embedders, respectively.
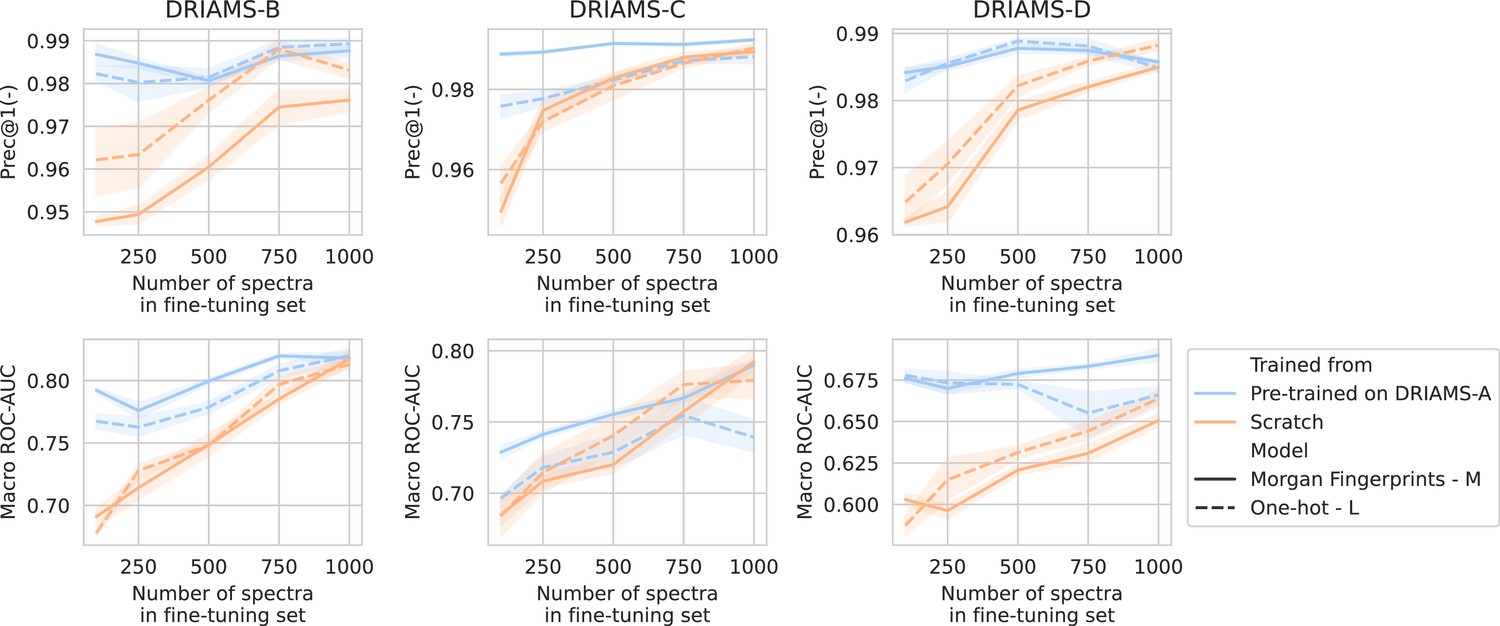
Figure 3
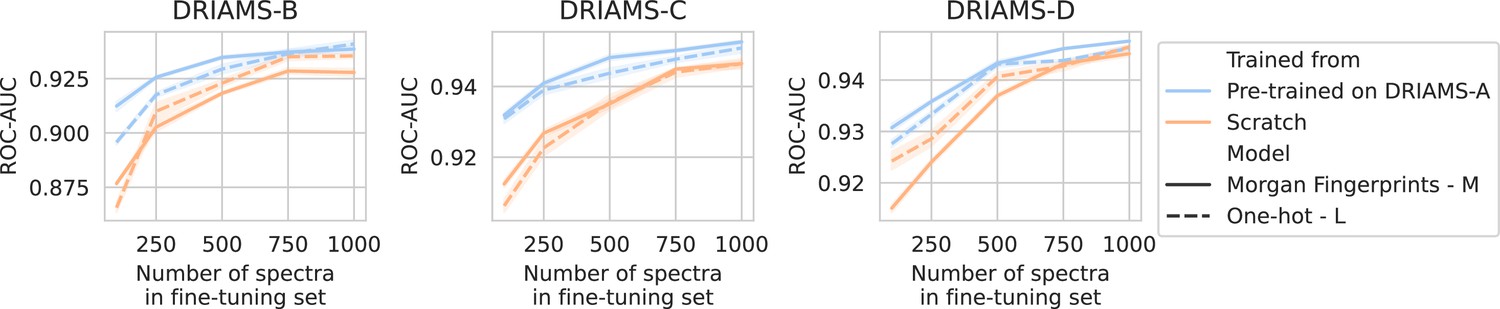
Transfer learning of DRIAMS-A models to other hospitals.
Errorbands show the standard deviation over five runs. Results in terms of other evaluation metrics are shown in Appendix 3—figure 4.
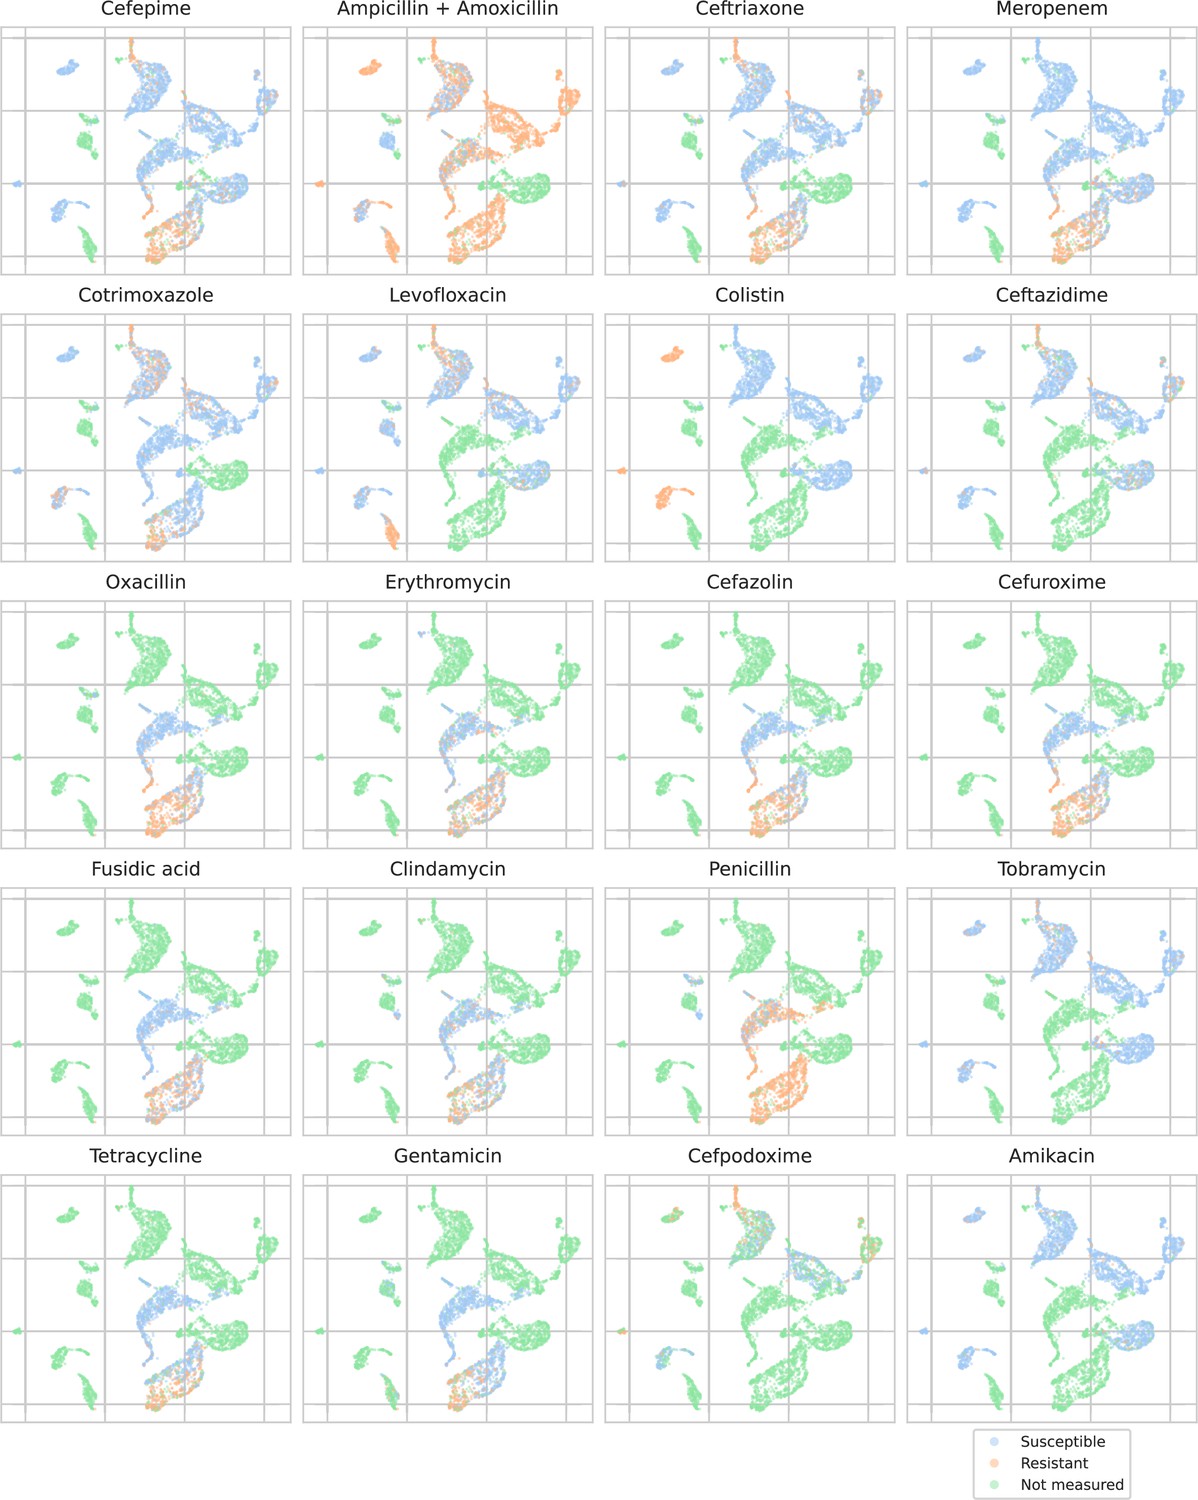
Figure 4
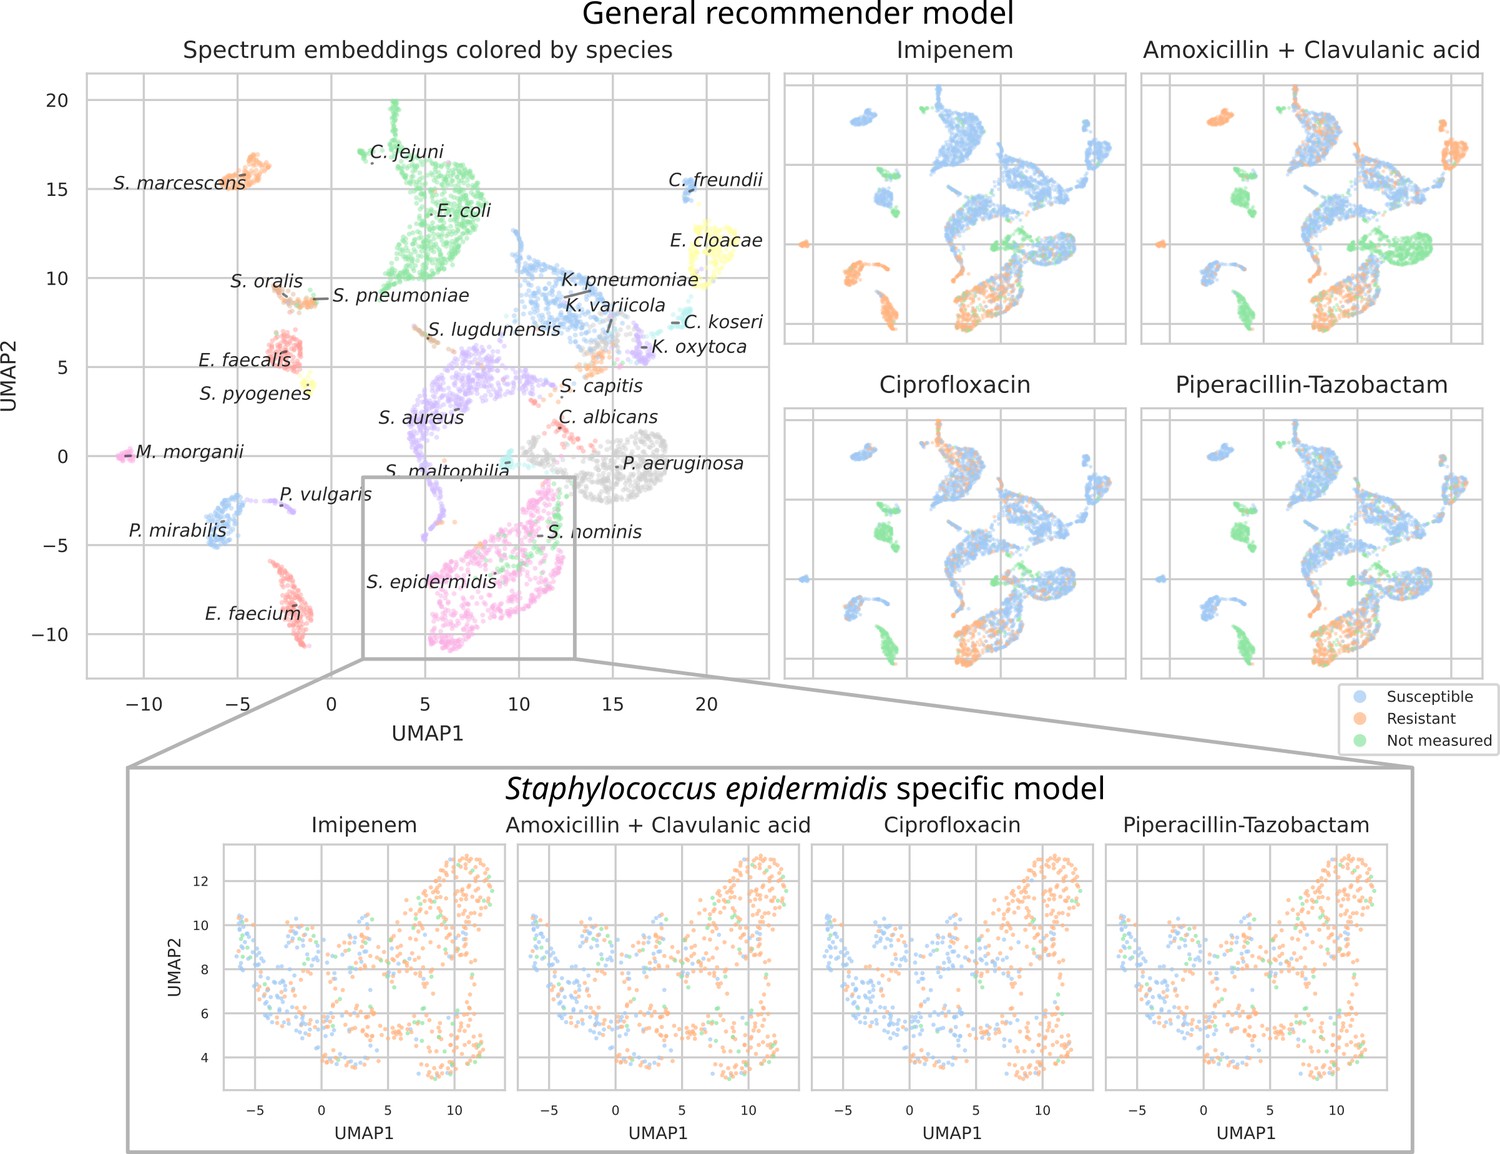
UMAP scatterplots of test set matrix-assisted laser desorption/ionization time-of-flight (MALDI-TOF) spectra embeddings .
Top: embeddings from a ‘general’ (trained on all species) recommender. Only embeddings belonging to the 25 most occurring species in the test set are shown. The panels on the right show the same embeddings as on the left, but colored according to its antimicrobial resistance (AMR) status to a certain drug. The four displayed drugs are selected based on a ranking of the product of the number of positive and negative labels . In this way, the drugs that have a lot of observed labels, both positives and negatives, are displayed. Bottom: highlighted embeddings from a S. epidermidis-specific recommender model.
Appendix 2—figure 1

Structure used for the residual blocks, used in the 1D CNN, 2D CNN, and transformer.
In the case of convolutions, the output is zero padded so as to produce the same output dimensions as in the input.
Appendix 2—figure 2
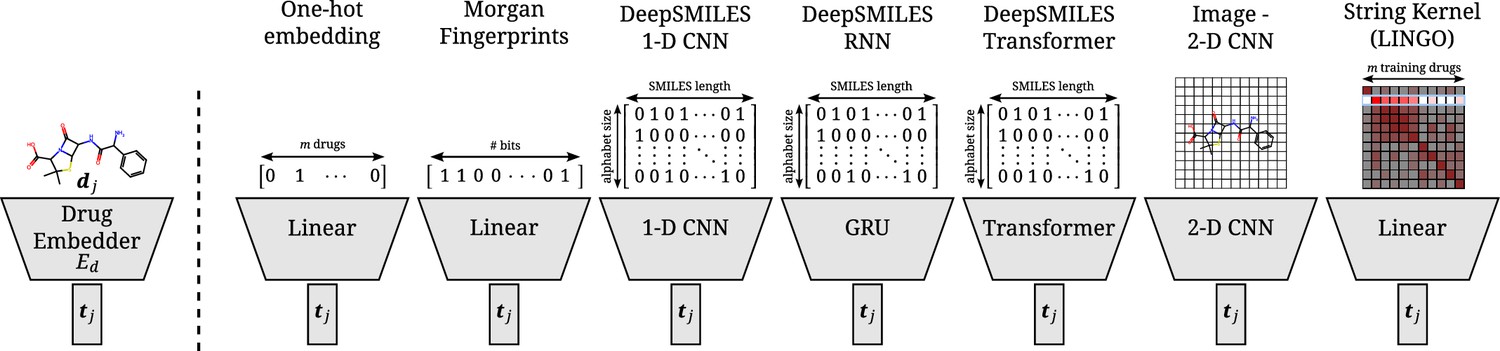
Overview of all different drug embedders tested in this work.
One-hot embeddings are the only technique not incorporating prior knowledge of the structure of the compound. Hence, they are the only technique incapable of directly transferring to new compounds. Morgan fingerprints produce a bit-vector containing information on the presence of certain substructures. DeepSMILES strings are encoded and processed with a 1D CNN, GRU, or transformer. Drawings of molecules are processed with a 2D CNN. A string kernel on SMILES strings produces a numerical vector for every drug (taken as the row in the resulting Gram matrix).
Appendix 2—figure 3
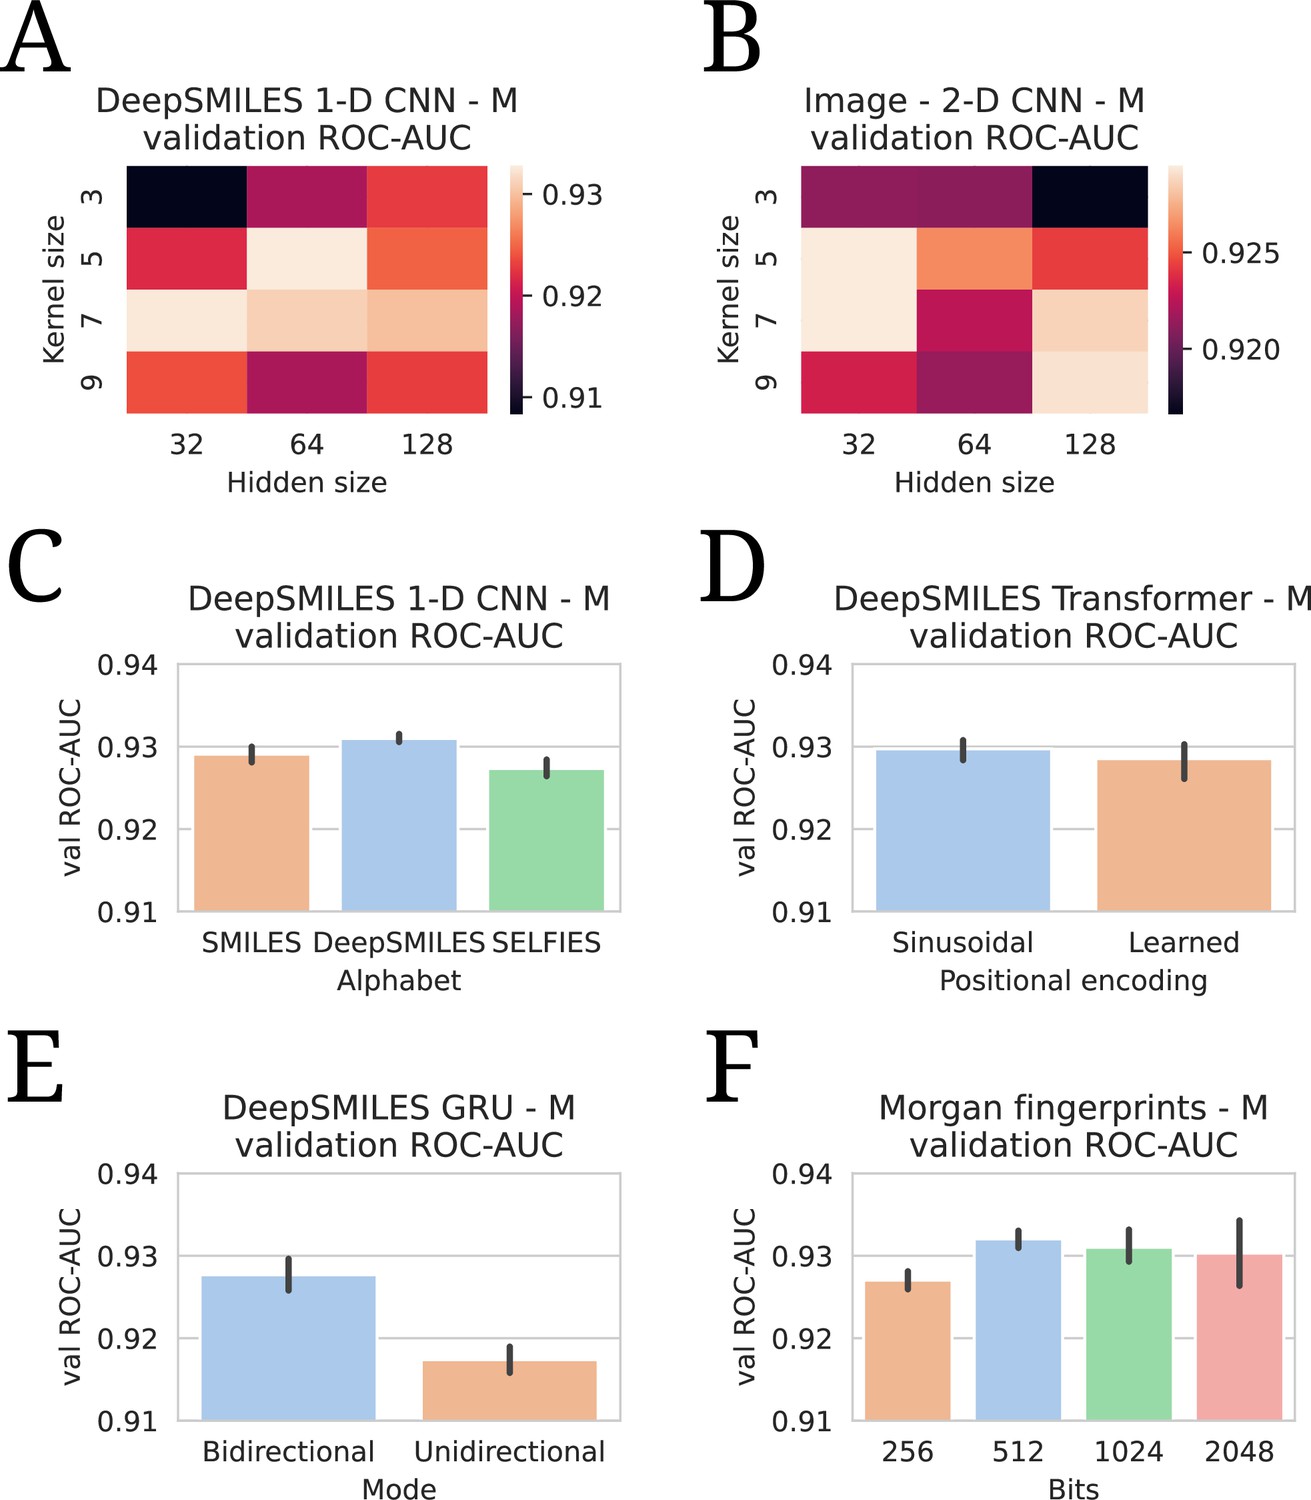
All hyperparameter tuning experiments.
All evaluations are listed in terms of validation area under the receiver operating characteristic curve (ROC-AUC). All numbers are averages of five model runs, with errorbars showing standard deviations. In every experiment, the highest average is chosen to use in the final models. (A) Tuning of kernel and hidden size in a DeepSMILES CNN. (B) Tuning of kernel and hidden size in an Image CNN. (C) Tuning of alphabet in a DeepSMILES CNN. (D) Tuning of positional encodings in a DeepSMILES Transformer. (E) Tuning of directionality in a DeepSMILES GRU. (F) Tuning of number of bits in a Morgen Fingerprint-based drug embedder.
Appendix 3—figure 1

Spectrum-macro receiver operating characteristic (ROC) curve for best-performing model (Morgan fingerprints drug embedder, medium-sized spectrum embedder).
The y-axis shows the average sensitivity (across patients), while the x-axis shows one minus the average specificity. Note that this ROC curve is not a traditional ROC curve constructed from one single label set and one corresponding prediction set. Rather, it is constructed from spectrum-macro metrics as follows: for any possible threshold value, binarize all predictions. Then, for every spectrum/patient independently, compute the sensitivity and specificity for the subset of labels corresponding to that spectrum/patient. Finally, those sensitivities and specificities are averaged across patients to obtain one point on above ROC curve. In blue, the optimal sensitivity and specificity (according to the Youden index) is indicated (Youden, 1950).
Appendix 3—figure 2
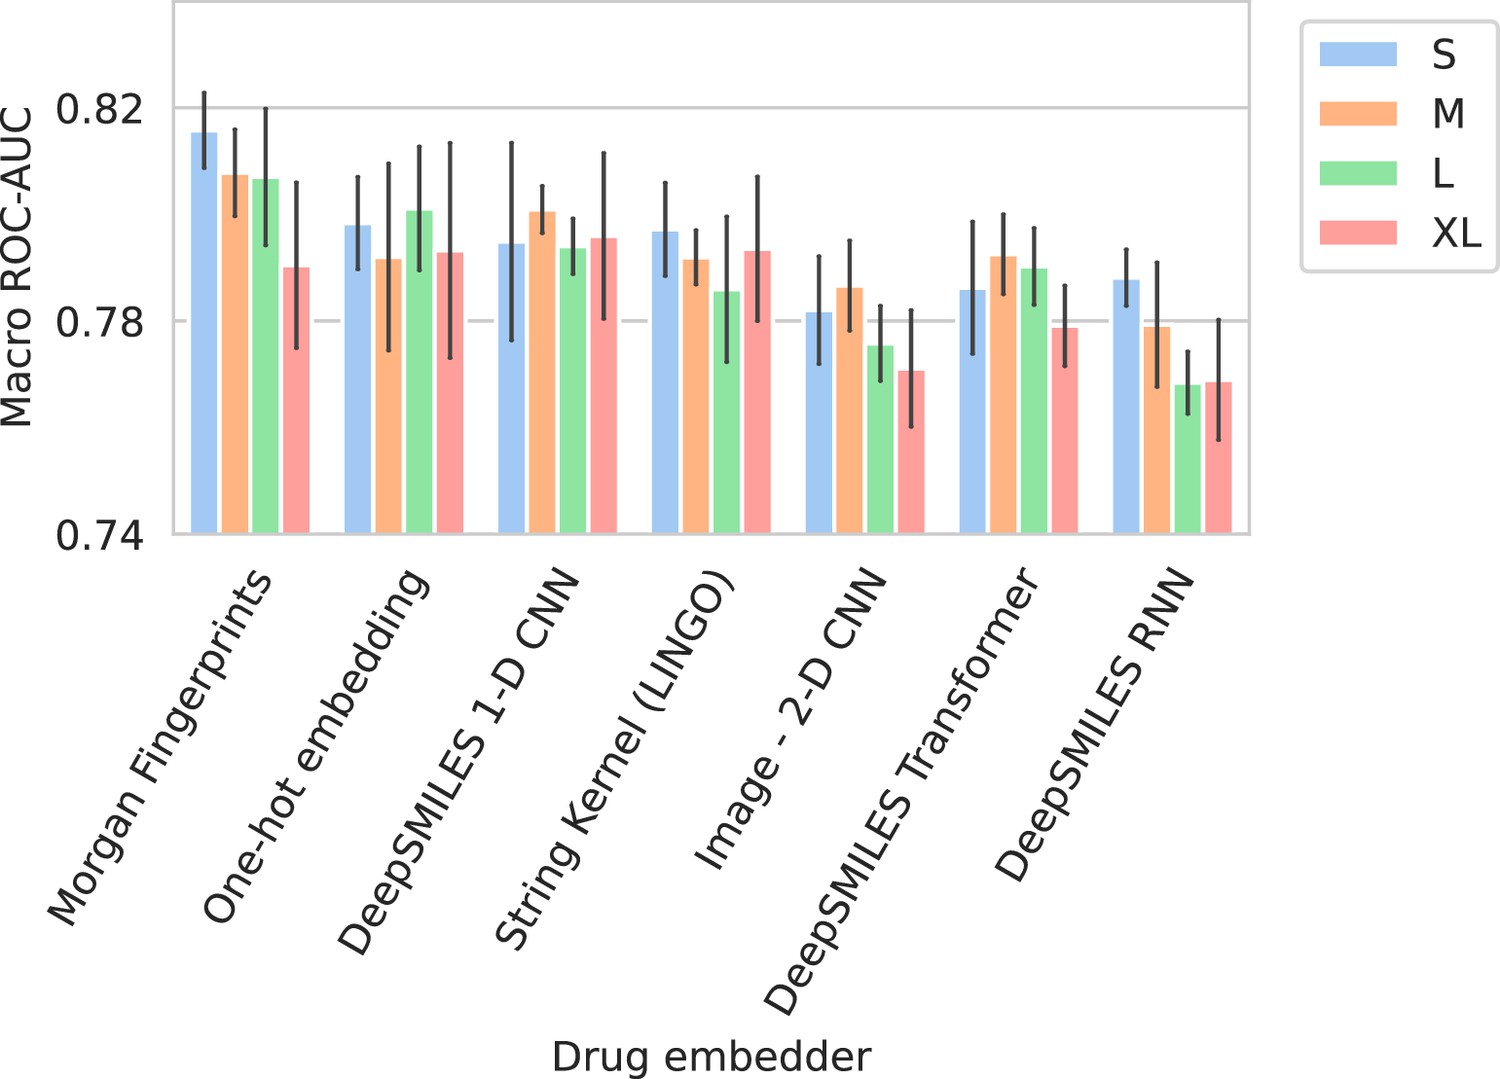
Barplots showing test performance results for all trained models.
Colors represent the different spectrum embedder model sizes. Performance is shown in terms of macro area under the receiver operating characteristic curve (ROC-AUC) (computed per drug and averaged). Errorbars represent the standard deviation over five random seeds.
Appendix 3—figure 3
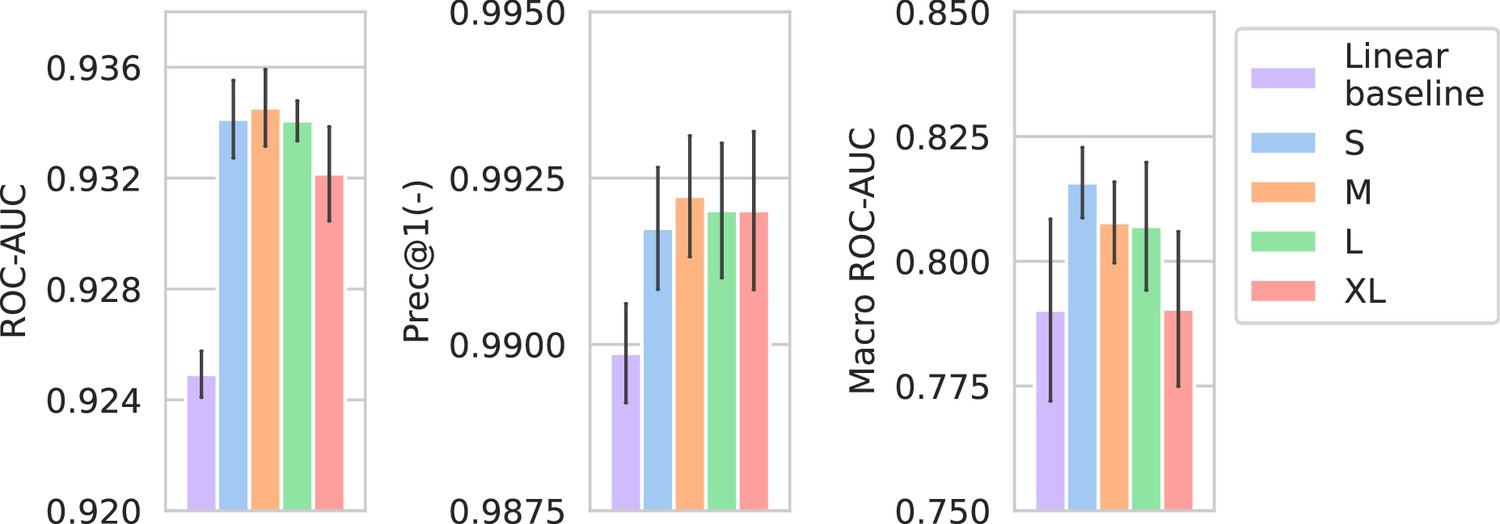
Performance of models compared against a linear spectrum embedder baseline.
The comparison is only shown for the best-performing drug embedder (Morgan fingerprints). Errorbars represent the standard deviation over five random seeds.
Appendix 3—figure 4
Transfer learning of DRIAMS-A models to other hospitals.
Errorbands show the standard deviation over five runs.
Appendix 3—figure 5
UMAP scatterplots of test set matrix-assisted laser desorption/ionization time-of-flight (MALDI-TOF) spectra embeddings .
Embeddings from a ‘general’ (trained on all spectra across species) recommender are shown. Only embeddings belonging to the 25 most occurring species in the test set are shown. Spectra are colored according to its antimicrobial resistance (AMR) status to a certain drug. The 20 displayed drugs were selected based on a ranking of the product of the number of positive and negative labels . In this way, the drugs that have a lot of observed labels, both positives and negatives, are displayed. The drugs here are ranked 5–24 (the first four are shown in Figure 4). In order to map the clusters back to species, readers are referred back to Figure 4.
Appendix 3—figure 6
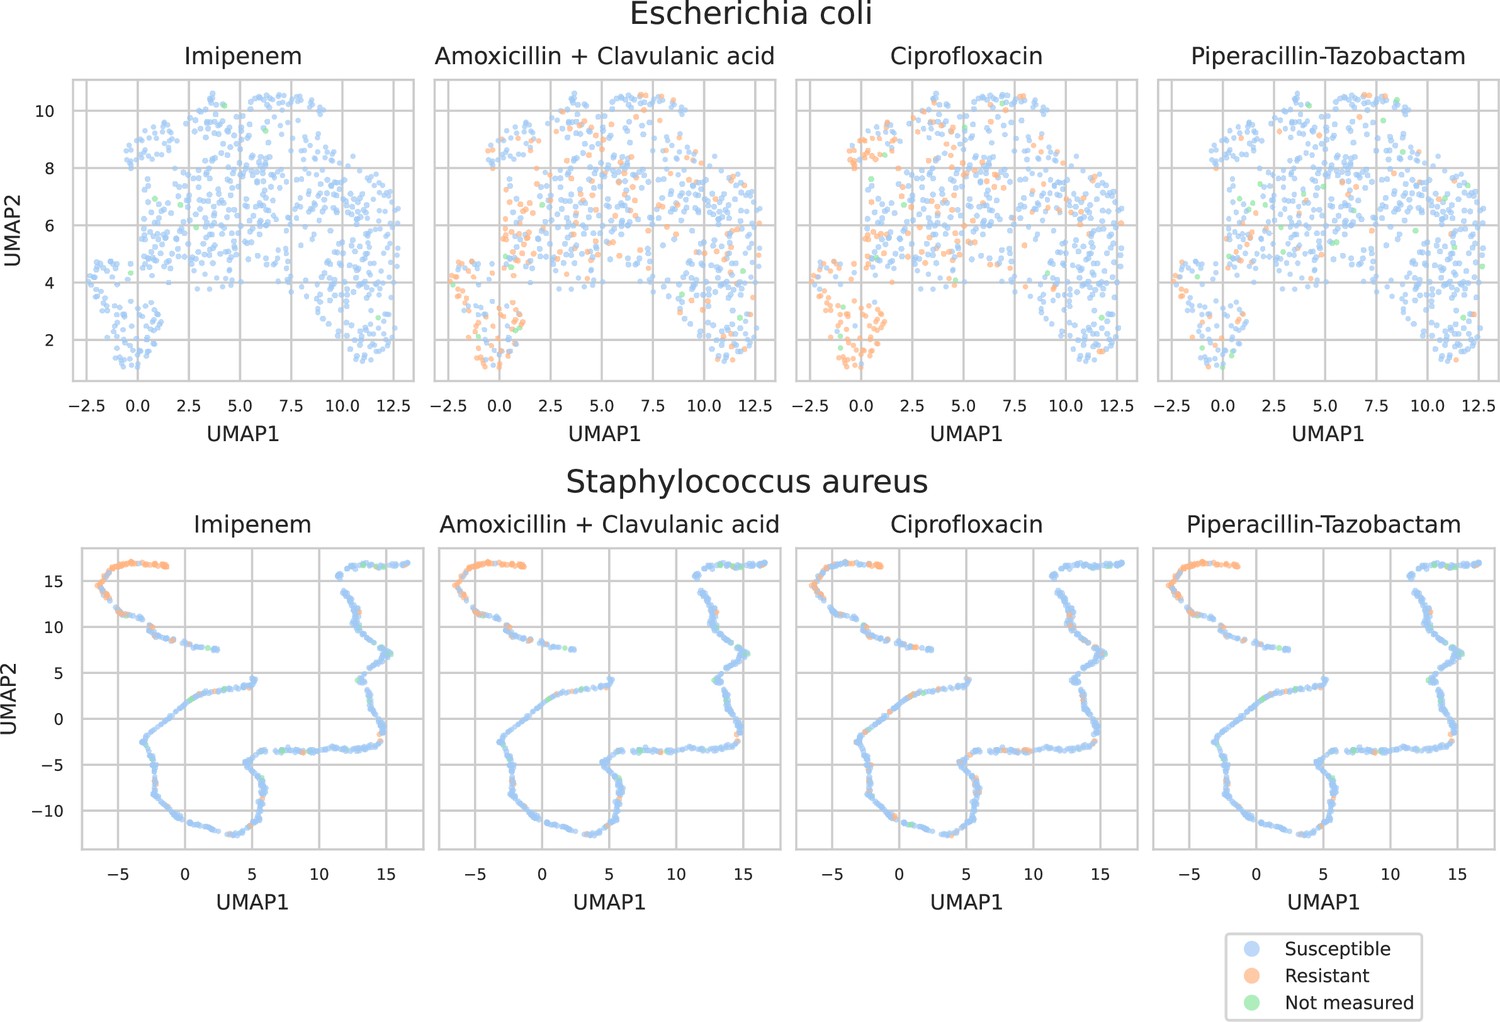
UMAP scatterplots of test set matrix-assisted laser desorption/ionization time-of-flight (MALDI-TOF) spectra embeddings .
Embeddings from two ‘species-specific’ recommenders are shown. Spectra are colored according to its antimicrobial resistance (AMR) status to a certain drug.
Tables
Table 1
All tested model sizes for the (instance) spectrum branch.
Hidden sizes represent the evolution of the hidden state dimensionality as it goes through the model, with every hyphen defining one fully connected layer. The listed number of parameters only includes those of the instance (spectrum) branch.
| Size | # weights | Hidden sizes |
|---|---|---|
| S | 1,578,176 | 6000-256-128-64 |
| M | 3,246,784 | 6000-512-256-128-64 |
| L | 6,846,144 | 6000-1024-512-256-128-64 |
| XL | 15,093,440 | 6000-2048-1024-512-256-128-64 |
Table 2
Test performance of selected general and species-specific dual branch recommender models.
The listed averages and standard deviations are calculated over five independent runs of the same model. Performance is computed on the subset of labels spanning the 25 most common species in DRIAMS-A.
| Model | ROC-AUC | Prec@1(-) | Macro ROC-AUC |
|---|---|---|---|
| General recommender (Morgan fingerprints – M) | 0.9411 ± 0.0007 | 0.9967 ± 0.0011 | 0.7684 ± 0.0050 |
| General recommender (one-hot – L) | 0.9408 ± 0.0011 | 0.9940 ± 0.0009 | 0.7746 ± 0.0316 |
| Species-specific recommenders (Morgan fingerprints – M) | 0.9461 ± 0.0010 | 0.9973 ± 0.0004 | 0.7905 ± 0.0151 |
| Species-specific recommenders (one-hot – L) | 0.9468 ± 0.0012 | 0.9950 ± 0.0011 | 0.7686 ± 0.0155 |
-
ROC-AUC, area under the receiver operating characteristic curve.
Table 3
Test performance of selected recommender models, compared to the performance of a collection of models – each trained on only one species–drug combination – coined ‘species–drug classifiers’.
‘Species–drug classifiers’ refer to a collection of binary classifiers, each trained to predict antimicrobial resistance (AMR) status for a subset of data comprising a single species–drug combination. ‘Simulated expert’s best guess’ refers to counting AMR label frequencies in single species–drug combinations and taking those as predictions. The listed averages and standard deviations are calculated over five independent runs of the same model. Given the non-stochastic nature of the logistic regression and XGBoost implementations, only one set of models is trained and, hence, no standard deviations are reported. Performance is computed on the subset of labels spanning the 200 most common species–drug combinations.
| Model | ROC-AUC | Prec@1(-) | Macro ROC-AUC | Species–drug macro ROC-AUC |
|---|---|---|---|---|
| Species-specific recommenders (Morgan fingerprints – M) | 0.9009 ± 0.0018 | 0.9830 ± 0.0015 | 0.8283 ± 0.0059 | 0.6381 ± 0.0121 |
| Species-specific recommenders (one-hot – L) | 0.9030 ± 0.0018 | 0.9814 ± 0.0020 | 0.8129 ± 0.0079 | 0.6511 ± 0.0290 |
| General recommender (Morgan fingerprints – M) | 0.8939 ± 0.0016 | 0.9746 ± 0.0006 | 0.8114 ± 0.0064 | 0.6517 ± 0.0076 |
| General recommender (one-hot – L) | 0.8933 ± 0.0020 | 0.9778 ± 0.0023 | 0.8124 ± 0.0033 | 0.6521 ± 0.0078 |
| Species–drug classifiers (MLP – S) | 0.8341 ± 0.0135 | 0.9420 ± 0.0123 | 0.8005 ± 0.0032 | 0.6745 ± 0.0218 |
| Species–drug classifiers (MLP – M) | 0.8382 ± 0.0077 | 0.9421 ± 0.0196 | 0.8075 ± 0.0049 | 0.6797 ± 0.0097 |
| Species–drug classifiers (MLP – L) | 0.8457 ± 0.0088 | 0.9505 ± 0.0100 | 0.8037 ± 0.0079 | 0.6648 ± 0.0149 |
| Species–drug classifiers (MLP – XL) | 0.8611 ± 0.0049 | 0.9722 ± 0.0041 | 0.8106 ± 0.0069 | 0.6801 ± 0.0101 |
| Species–drug classifiers (logistic regression) | 0.8684 | 0.9432 | 0.7989 | 0.7200 |
| Species–drug classifiers (XGBoost) | 0.8346 | 0.9196 | 0.7763 | 0.6236 |
| Simulated expert’s best guess | 0.8681 | 0.9743 | 0.7159 | 0.5000 |
-
ROC-AUC, area under the receiver operating characteristic curve.
Appendix 1—table 1
Full list of modifications made to drug names in DRIAMS.
Modifications consist of (1) removal of drugs, (2) merging of drugs, and (3) renaming drugs.
| Original drug name | Step undertaken |
|---|---|
| Quinolones | Removed |
| Aminoglycosides | Removed |
| Ofloxacin | Merged with levofloxacin |
| Benzylpenicillin | Merged with penicillin |
| Benzylpenicillin_others | Merged with penicillin |
| Benzylpenicillin_with_meningitis | Merged with penicillin |
| Benzylpenicillin_with_pneumonia | Merged with penicillin |
| Penicillin_with_endokarditis | Merged with penicillin |
| Penicillin_without_endokarditis | Merged with penicillin |
| Penicillin_without_meningitis | Merged with penicillin |
| Penicillin_with_meningitis | Merged with penicillin |
| Penicillin_with_pneumonia | Merged with penicillin |
| Penicillin_with_other_infections | Merged with penicillin |
| Cefuroxime.1 | Merged with cefuroxime |
| Cotrimoxazol | Merged with cotrimoxazole |
| Gentamicin_high_level | Merged with gentamicin |
| Cefoxitin_screen | Merged with cefoxitin |
| Teicoplanin_GRD | Merged with teicoplanin |
| Vancomycin_GRD | Merged with vancomycin |
| Rifampicin_1mg-l | Merged with rifampicin |
| Meropenem_with_meningitis | Merged with meropenem |
| Meropenem_without_meningitis | Merged with meropenem |
| Meropenem_with_pneumonia | Merged with meropenem |
| Amoxicillin-Clavulanic acid_uncomplicated_HWI | Merged with amoxicillin-clavulanic acid |
| Strepomycin_high_level | Renamed to streptomycin |
| Bacitracin | Renamed to bacitracin A |
| Ceftarolin | Renamed to ceftaroline fosamil |
| Fosfomycin-Trometamol | Renamed to fosfomycin tromethamine |
Appendix 3—table 1
Full table of test results.
The listed averages and standard deviations are calculated over five independent runs of the same model. The best models for every metric per drug embedder are underlined. The overall best model for every metric is in bold face.
| Drug embedder | Spectrum embedder | ROC-AUC | Prec@1(-) | Macro ROC-AUC |
|---|---|---|---|---|
| Morgan fingerprints | S | 0.9341 ± 0.0014 | 0.9917 ± 0.0009 | 0.8158 ± 0.0070 |
| M | 0.9345 ± 0.0014 | 0.9922 ± 0.0009 | 0.8078 ± 0.0081 | |
| L | 0.9341 ± 0.0007 | 0.9920 ± 0.0010 | 0.8070 ± 0.0128 | |
| XL | 0.9322 ± 0.0017 | 0.9920 ± 0.0012 | 0.7904 ± 0.0155 | |
| One-hot embedding | S | 0.9326 ± 0.0017 | 0.9899 ± 0.0010 | 0.7984 ± 0.0086 |
| M | 0.9337 ± 0.0014 | 0.9910 ± 0.0016 | 0.7920 ± 0.0175 | |
| L | 0.9338 ± 0.0018 | 0.9882 ± 0.0010 | 0.8011 ± 0.0116 | |
| XL | 0.9327 ± 0.0011 | 0.9890 ± 0.0026 | 0.7932 ± 0.0201 | |
| DeepSMILES 1-D CNN | S | 0.9303 ± 0.0012 | 0.9864 ± 0.0016 | 0.7949 ± 0.0185 |
| M | 0.9336 ± 0.0011 | 0.9903 ± 0.0008 | 0.8009 ± 0.0044 | |
| L | 0.9337 ± 0.0015 | 0.9890 ± 0.0014 | 0.7940 ± 0.0052 | |
| XL | 0.9317 ± 0.0012 | 0.9898 ± 0.0020 | 0.7960 ± 0.0155 | |
| String Kernel (LINGO) | S | 0.9327 ± 0.0022 | 0.9913 ± 0.0012 | 0.7972 ± 0.0087 |
| M | 0.9332 ± 0.0017 | 0.9916 ± 0.0008 | 0.7919 ± 0.0051 | |
| L | 0.9317 ± 0.0017 | 0.9909 ± 0.0013 | 0.7859 ± 0.0136 | |
| XL | 0.9303 ± 0.0021 | 0.9893 ± 0.0025 | 0.7935 ± 0.0135 | |
| Image – 2-D CNN | S | 0.9310 ± 0.0016 | 0.9888 ± 0.0025 | 0.7820 ± 0.0101 |
| M | 0.9317 ± 0.0008 | 0.9885 ± 0.0019 | 0.7866 ± 0.0084 | |
| L | 0.9332 ± 0.0010 | 0.9901 ± 0.0016 | 0.7758 ± 0.0070 | |
| XL | 0.9309 ± 0.0012 | 0.9900 ± 0.0013 | 0.7711 ± 0.0109 | |
| DeepSMILES Transformer | S | 0.9306 ± 0.0021 | 0.9900 ± 0.0022 | 0.7862 ± 0.0124 |
| M | 0.9325 ± 0.0012 | 0.9891 ± 0.0014 | 0.7925 ± 0.0075 | |
| L | 0.9308 ± 0.0014 | 0.9885 ± 0.0027 | 0.7902 ± 0.0072 | |
| XL | 0.9311 ± 0.0014 | 0.9895 ± 0.0009 | 0.7791 ± 0.0075 | |
| DeepSMILES RNN | S | 0.9291 ± 0.0015 | 0.9872 ± 0.0032 | 0.7881 ± 0.0053 |
| M | 0.9293 ± 0.0028 | 0.9863 ± 0.0008 | 0.7793 ± 0.0116 | |
| L | 0.9266 ± 0.0012 | 0.9868 ± 0.0019 | 0.7684 ± 0.0058 | |
| XL | 0.9278 ± 0.0029 | 0.9879 ± 0.0027 | 0.7689 ± 0.0113 |
-
ROC-AUC area under the receiver operating characteristic curve.
Appendix 3—table 2
Test area under the receiver operating characteristic curve (ROC-AUC) performance per species.
Reported figures are averages across the five different medium-sized Morgan fingerprint-based recommenders.
| Species | ROC-AUC |
|---|---|
| Staphylococcus aureus | 0.9578 |
| Staphylococcus epidermidis | 0.9478 |
| Escherichia coli | 0.9184 |
| Klebsiella pneumoniae | 0.9643 |
| Pseudomonas aeruginosa | 0.7614 |
| Enterobacter cloacae | 0.9831 |
| Proteus mirabilis | 0.9727 |
| Staphylococcus hominis | 0.9594 |
| Serratia marcescens | 0.9848 |
| Staphylococcus capitis | 0.9425 |
| Enterococcus faecium | 0.9914 |
| Klebsiella oxytoca | 0.9861 |
| Klebsiella variicola | 0.9824 |
| Citrobacter koseri | 0.9970 |
| Enterococcus faecalis | 0.9594 |
| Staphylococcus lugdunensis | 0.9705 |
| Citrobacter freundii | 0.9622 |
| Morganella morganii | 0.9931 |
| Proteus vulgaris | 0.9828 |
| Staphylococcus haemolyticus | 0.9751 |
| Candida albicans | 0.7446 |
| Streptococcus pneumoniae | 0.9059 |
| Stenotrophomonas maltophilia | 1.0000 |
| Campylobacter jejuni | 1.0000 |
| Haemophilus influenzae | 1.0000 |
Additional files
Download links
A two-part list of links to download the article, or parts of the article, in various formats.
Downloads (link to download the article as PDF)
Open citations (links to open the citations from this article in various online reference manager services)
Cite this article (links to download the citations from this article in formats compatible with various reference manager tools)
An antimicrobial drug recommender system using MALDI-TOF MS and dual-branch neural networks
eLife 13:RP93242.
https://doi.org/10.7554/eLife.93242.4


