A latent clinical-anatomical dimension relating metabolic syndrome to brain structure and cognition
- Department of Neurology, University Medical Center Hamburg-Eppendorf, Germany
- Institute for Systems Neuroscience, Medical Faculty, Heinrich-Heine University Düsseldorf, Germany
- Institute of Neuroscience and Medicine, Brain and Behaviour (INM-7), Research Center Jülich, Germany
- Midwifery Science-Health Services Research and Prevention, Institute for Health Services Research in Dermatology and Nursing (IVDP), University Medical Center Hamburg-Eppendorf, Germany
- Department of Cardiology, University Heart and Vascular Center, Germany
- German Center for Cardiovascular Research (DZHK), partner site Hamburg/Kiel/Luebeck, Germany
- University Center of Cardiovascular Science, University Heart and Vascular Center, Germany
- Department of Psychiatry and Psychotherapy, University Medical Center Hamburg-Eppendorf, Germany
- Department of Diagnostic and Interventional Neuroradiology, University Medical Center Hamburg-Eppendorf, Germany
- Epidemiological Study Center, University Medical Center Hamburg-Eppendorf, Germany
Figures
Figure 1
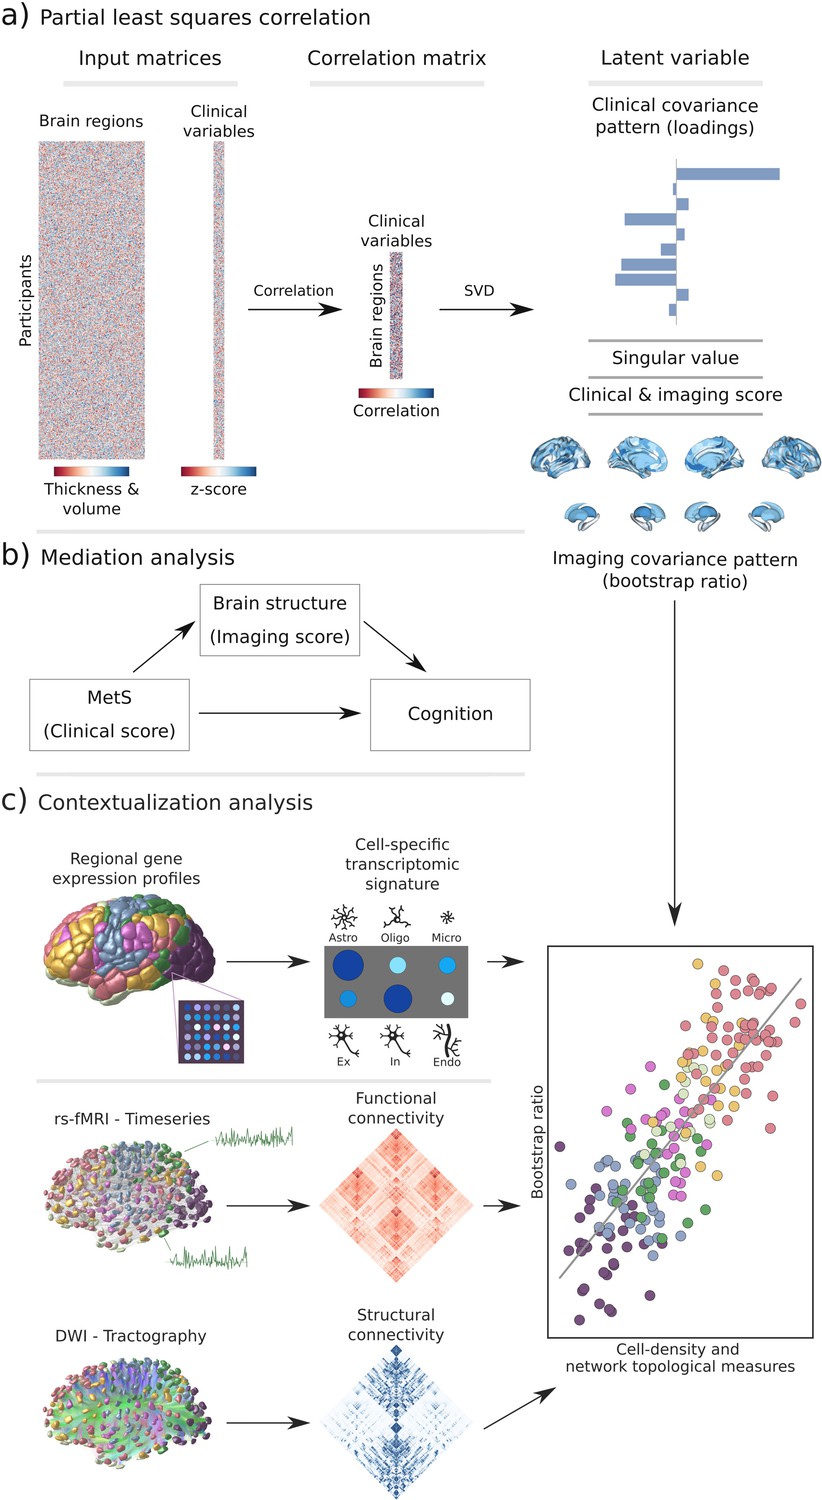
Methodology.
(a) Illustration of the partial least squares correlation analysis. Starting from two input matrices containing per-subject information of regional morphological measures as well as clinical data (demographic and metabolic syndrome (MetS)-related risk factors) a correlation matrix is computed. This matrix is subsequently subjected to singular value decomposition resulting in a set of mutually orthogonal latent variables. Latent variables each consist of a left singular vector (here, clinical covariance profile), singular value, and right singular vector (here, imaging covariance profile). In addition, subject-specific clinical and imaging scores are computed. (b) The interplay between MetS, brain structure, and cognition was investigated in a post-hoc mediation analysis. We tested whether the relationship between the clinical score, representing MetS severity, and different cognitive test performances was statistically mediated by the imaging score. (c) Contextualization analysis. Upper row: based on microarray gene expression data, the densities of different cell populations across the cortex were quantified. Middle and lower row: based on functional and structural group-consensus connectomes based on data from the Human Connectome Project, metrics of functional and structural brain network topology were derived. Cell density as well as connectomic measures were related to the bootstrap ratio via spatial correlations. Modified from Petersen et al., 2022b; Zeighami et al., 2019. Abbreviations: Astro – astrocytes; DWI – diffusion-weighted magnetic resonance imaging; Endo – endothelial cells; Ex – excitatory neuron populations (Ex1-8); In – inhibitory neuron populations (In1-8); Micro – microglia; Oligo – oligodendrocytes; rs-fMRI – resting-state functional magnetic resonance imaging; SVD – singular value decomposition.
Figure 2 with 4 supplements
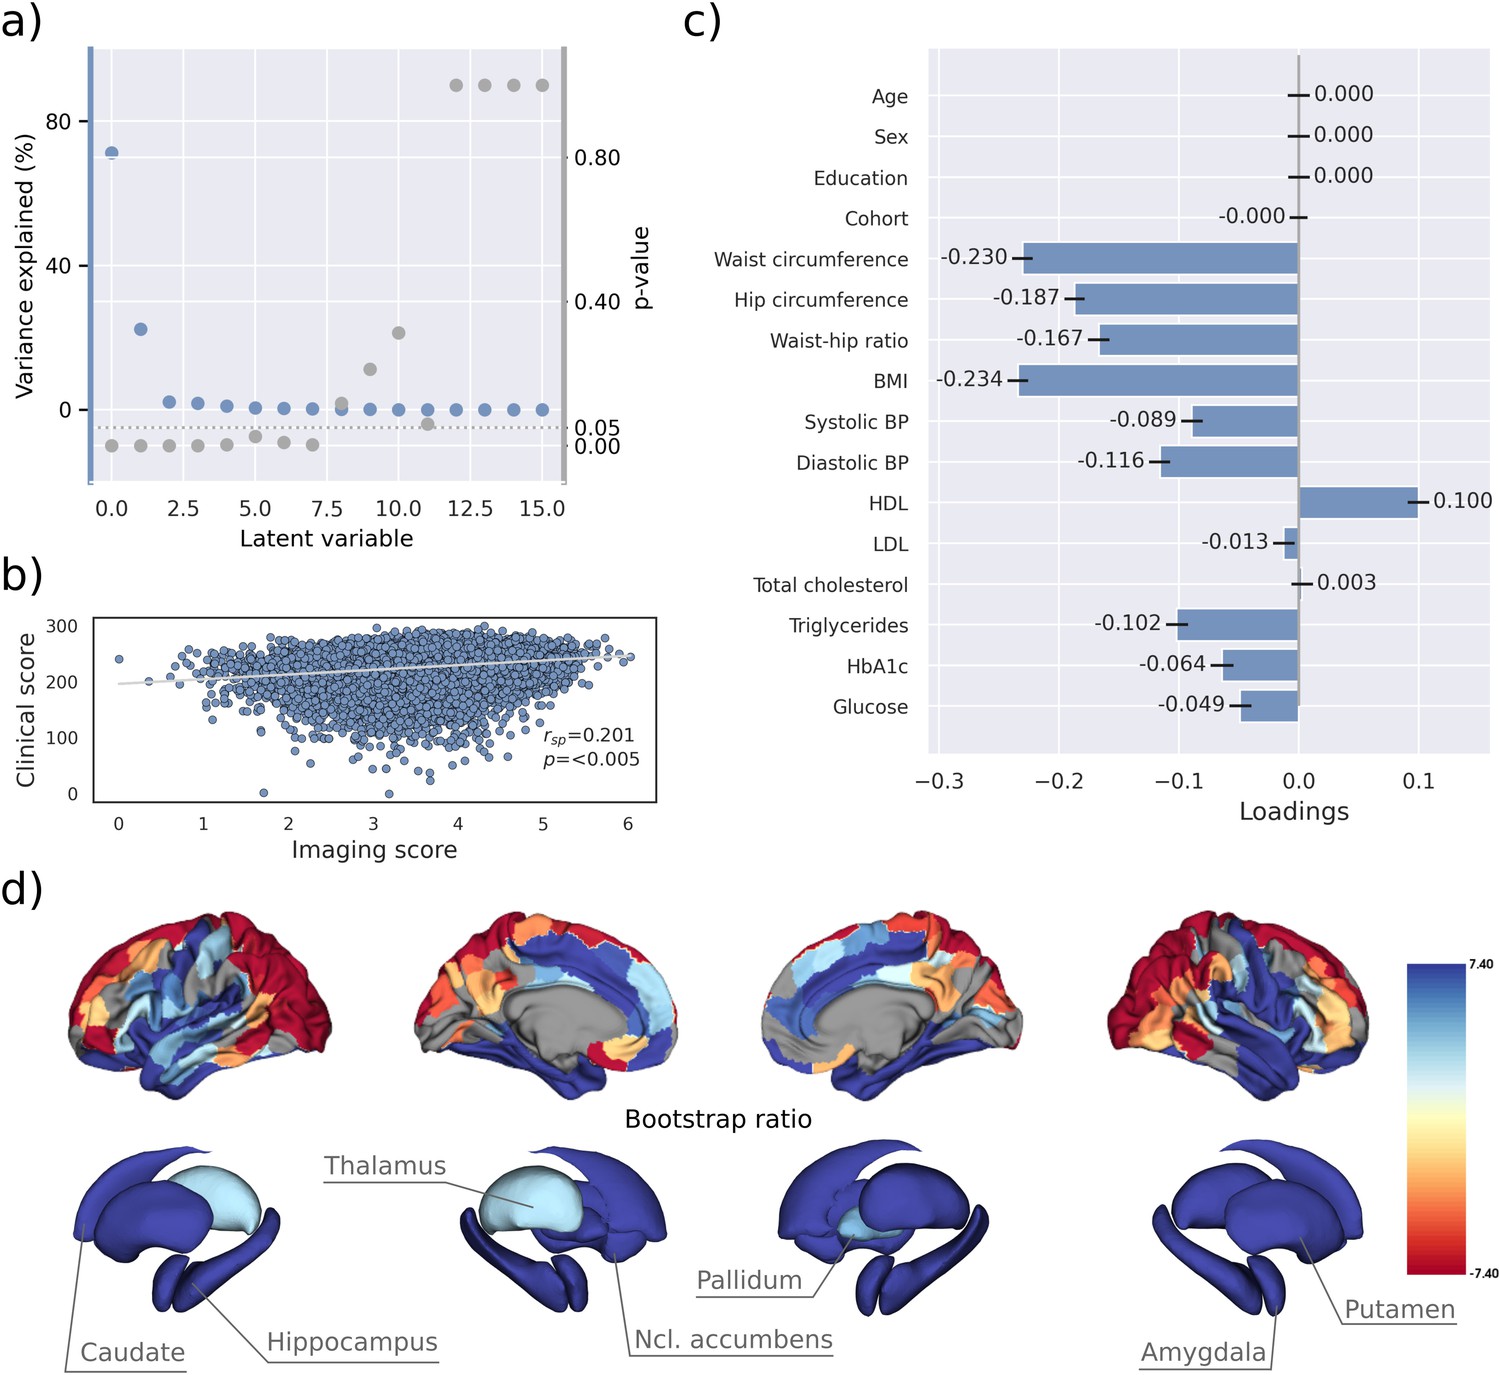
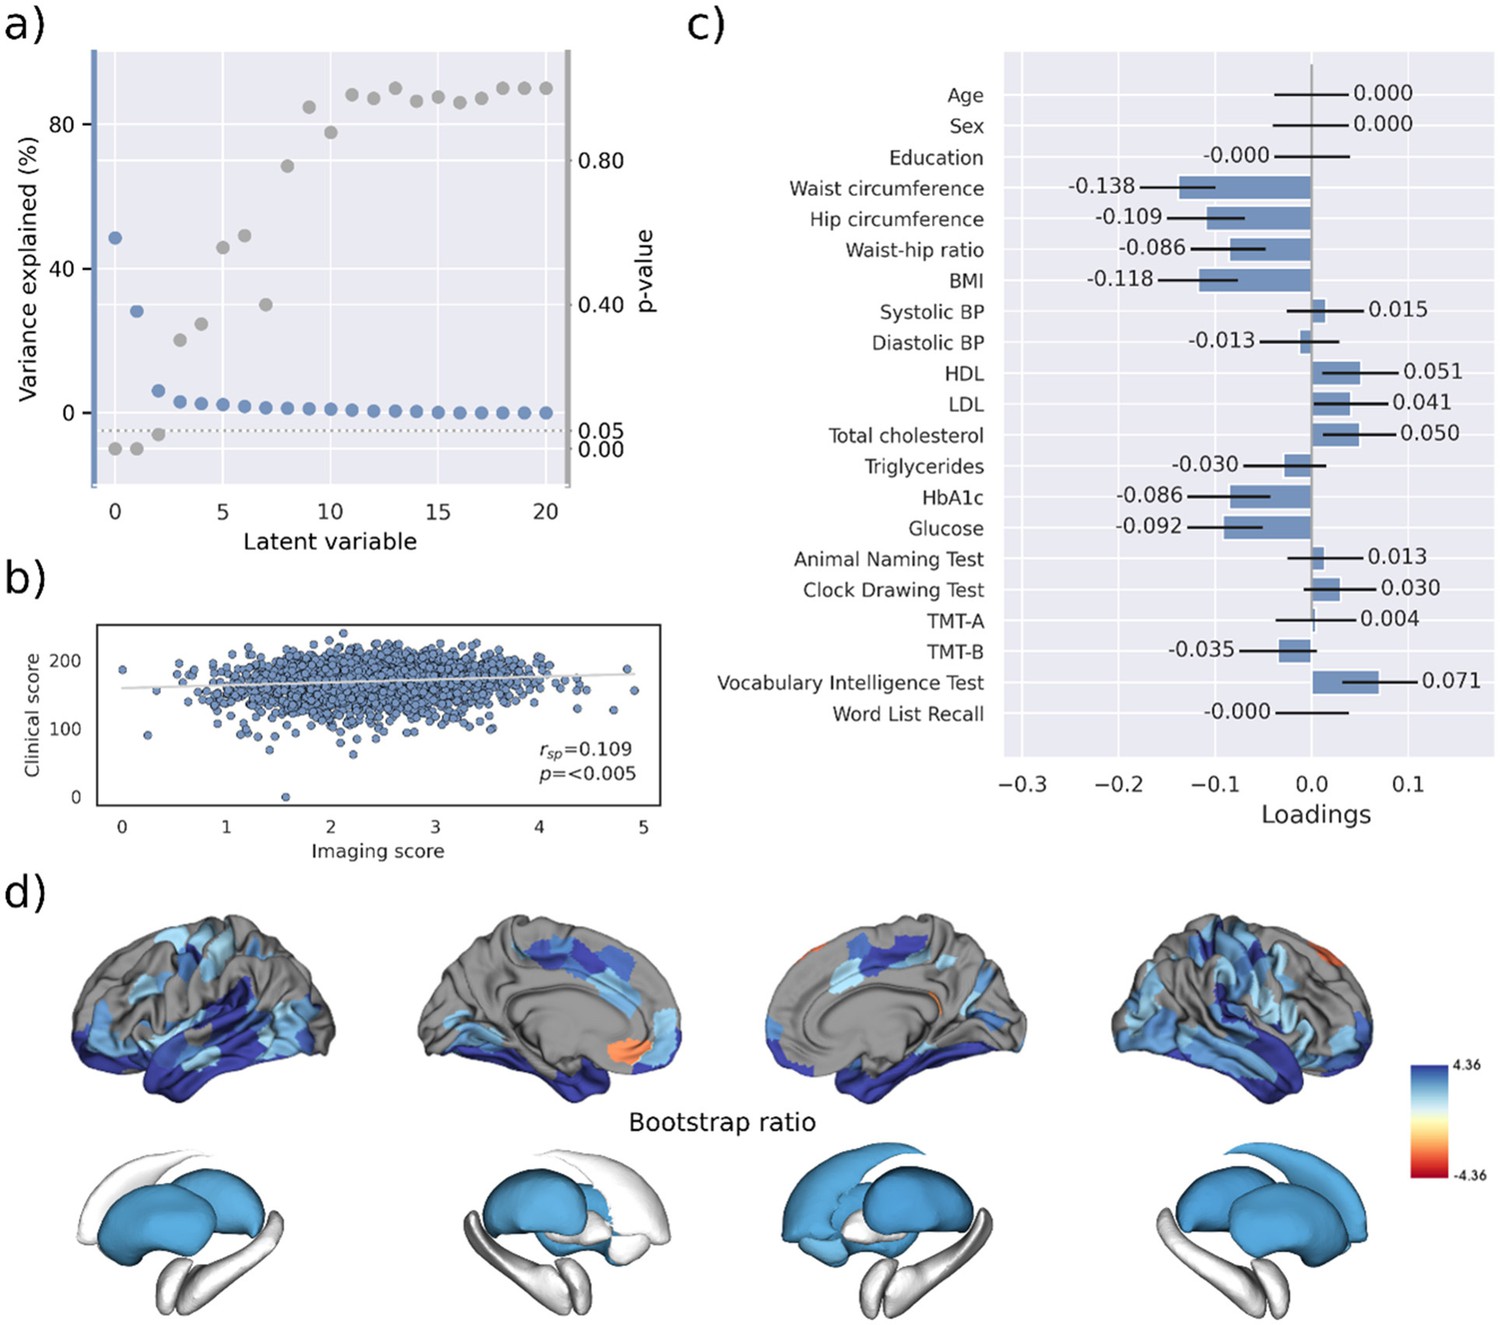
Partial least squares correlation analysis (PLS).
(a) Explained variance and p-values of latent variables. (b) Scatter plot relating subject-specific clinical and imaging PLS scores. Higher scores indicate higher adherence to the respective covariance profile. (c) Clinical covariance profile. 95% confidence intervals were calculated via bootstrap resampling. Note that confound removal for age, sex, education, and cohort was performed prior to the PLS. (d) Imaging covariance profile represented by bootstrap ratio. A high positive or negative bootstrap ratio indicates high contribution of a brain region to the overall covariance profile. Regions with a significant bootstrap ratio (>1.96 or <–1.96) are highlighted by colors. Abbreviations: BMI – Body mass index, HDL – high-density lipoprotein, LDL – low-density lipoprotein, - Spearman correlation coefficient.
Figure 2—figure supplement 1
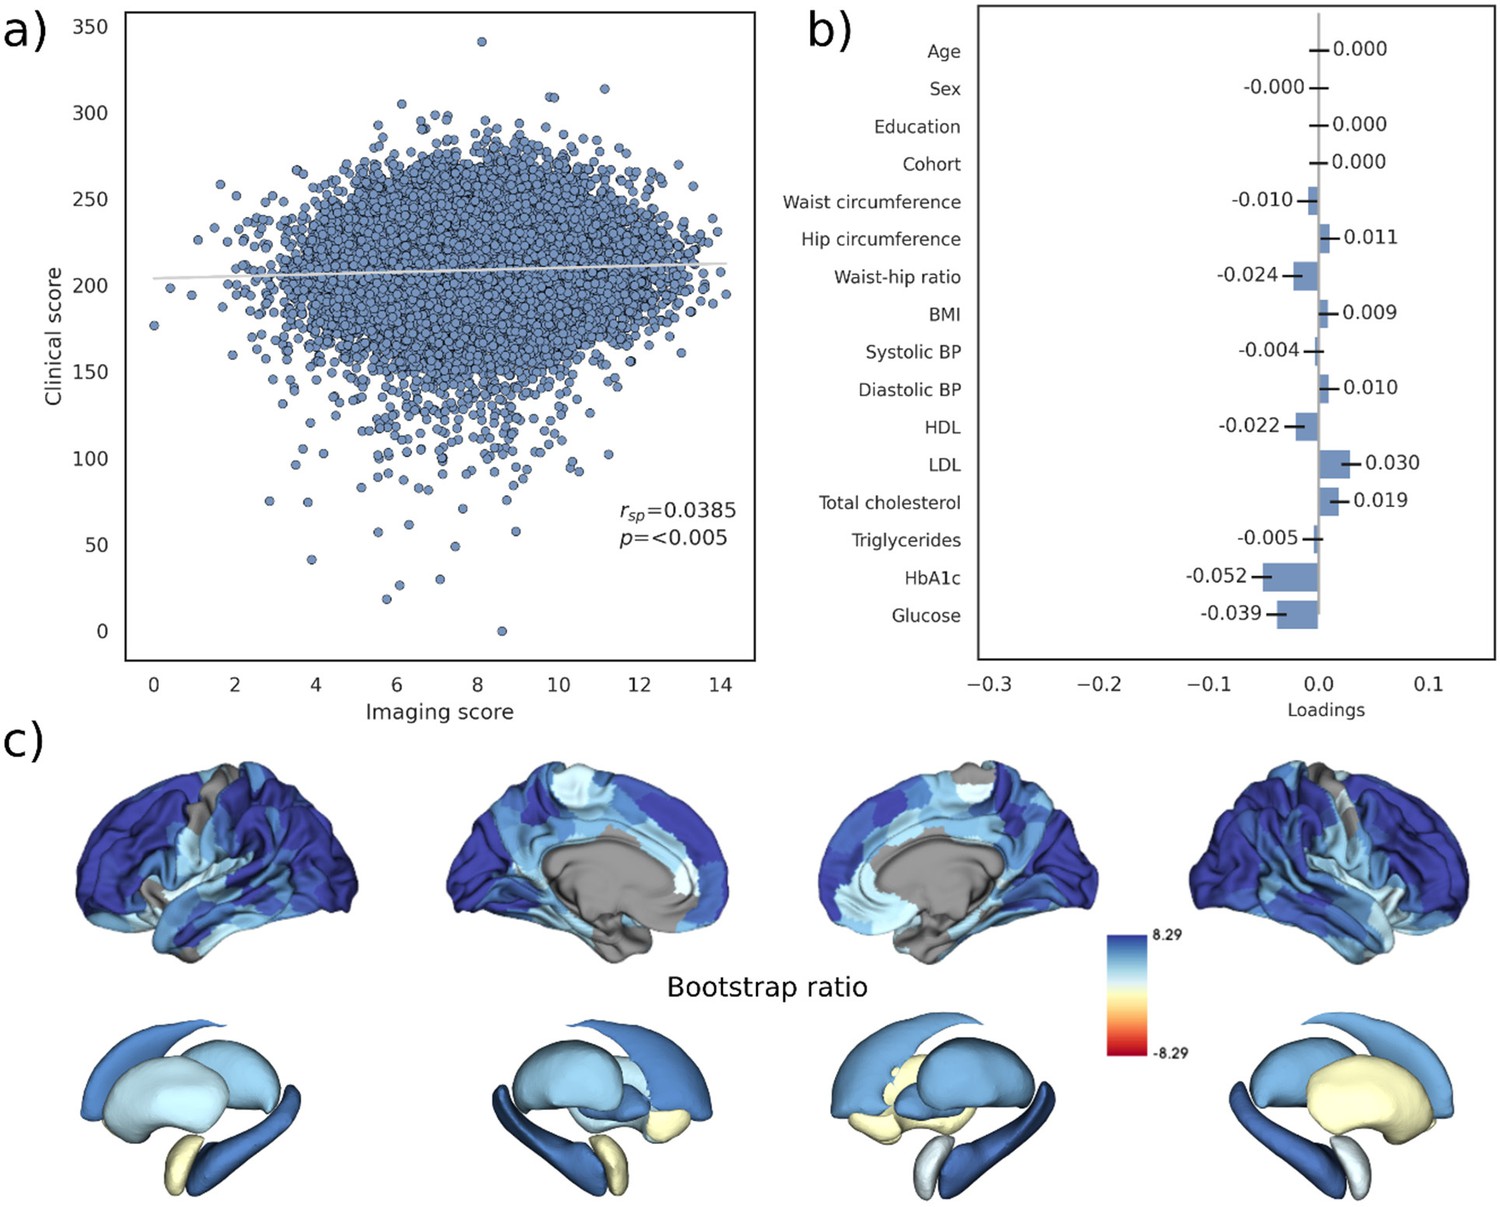
Partial least squares correlation analysis – Latent variable 2.
The figure presents the results of latent variable 2 of the partial least squares correlation analysis. (a) Scatter plot relating subject-specific clinical and imaging PLS scores. (b) Clinical covariance profile. (c) Imaging covariance profile represented by bootstrap ratio. A high positive or negative bootstrap ratio indicates high contribution of a brain region to the overall covariance profile. Regions with a significant bootstrap ratio (>1.96 or <–1.96) are highlighted by colors. Abbreviations: BMI – Body mass index, HDL – high-density lipoprotein, LDL – low-density lipoprotein, - Spearman correlation coefficient.
Figure 2—figure supplement 2
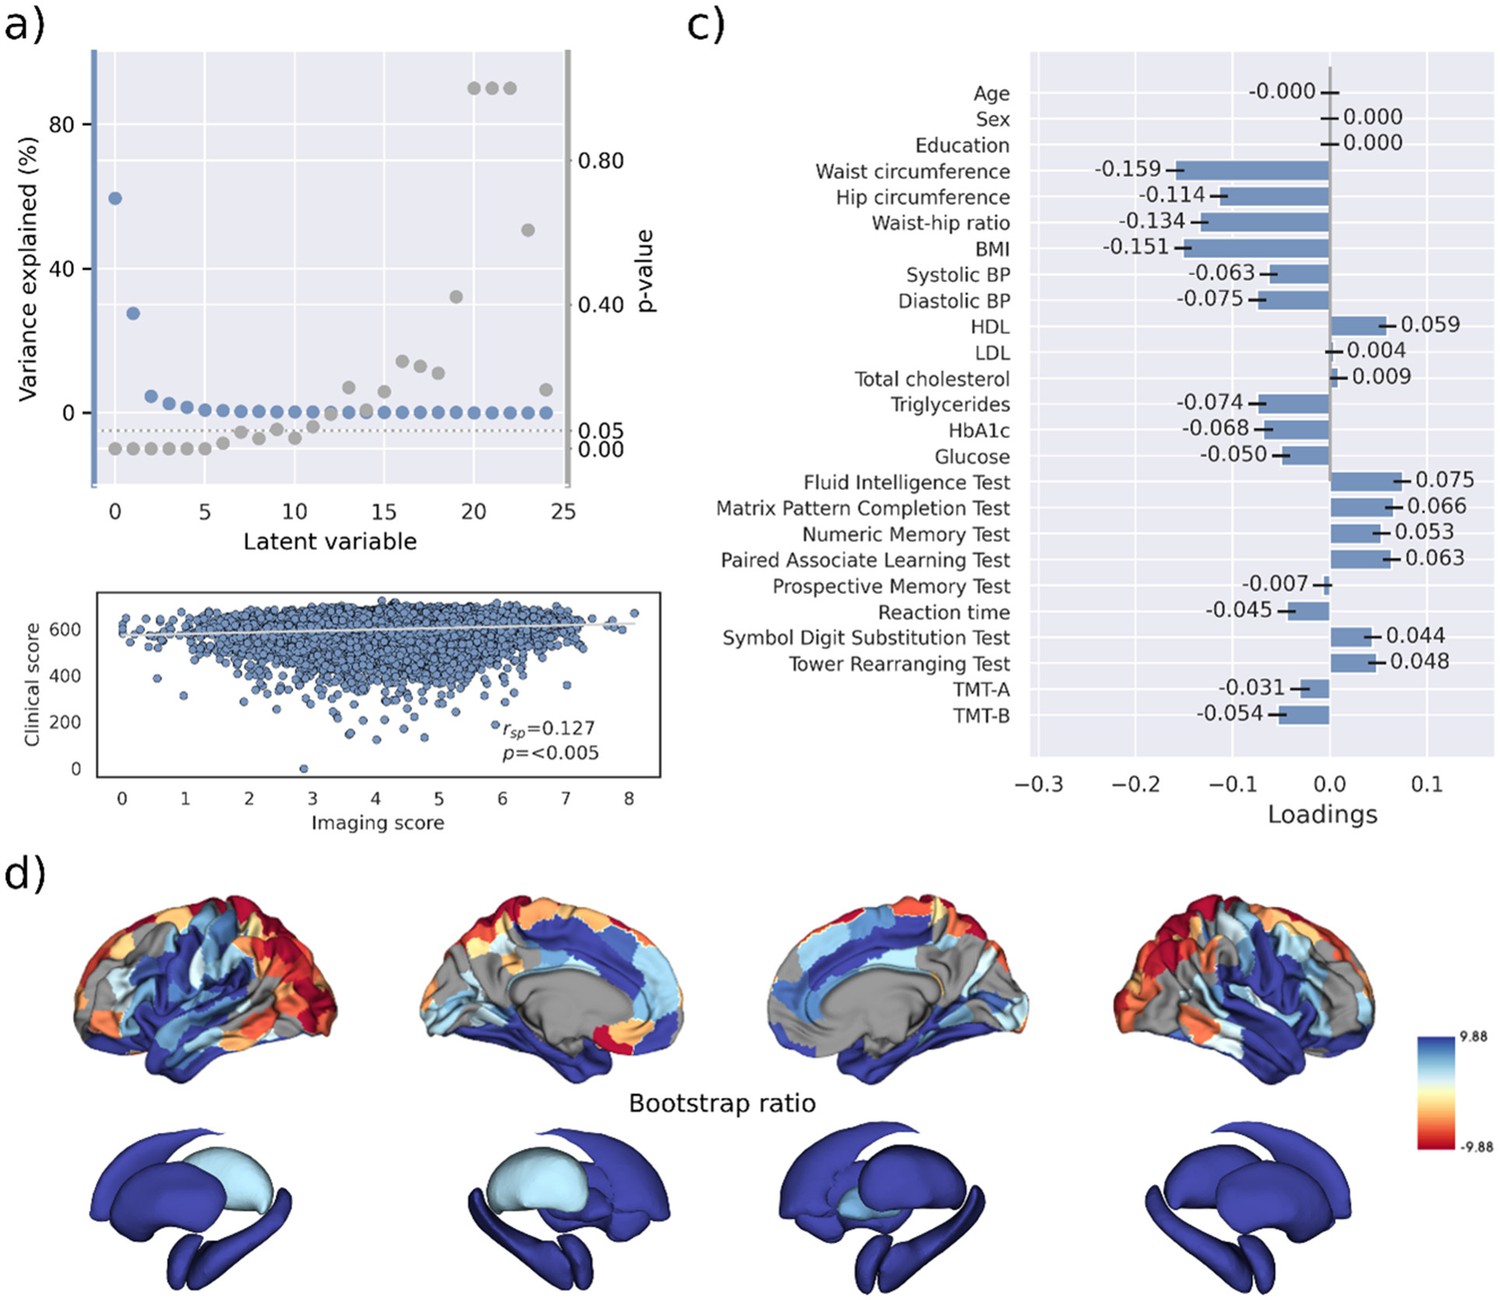
Partial least squares correlation analysis – UK Biobank (including cognitive test results).
Partial least squares correlation analysis of the UK Biobank subsample including cognitive test results. (a) Explained variance and p-values of latent variables. (b) Scatter plot relating subject-specific clinical and imaging scores. Higher scores indicate higher adherence to the respective covariance profile. (c) Clinical covariance profile. 95% confidence intervals were calculated via bootstrap resampling. Note that confound removal for age, sex, and education was performed prior to the PLS. (d) Bootstrap ratio representing the covarying brain morphology pattern. A high positive or negative bootstrap ratio indicates high contribution of a brain region to the overall covariance profile. Regions with a significant bootstrap ratio (>1.96 or <–1.96) are highlighted by colors. Abbreviations: BMI – Body mass index, HDL – high-density lipoprotein, LDL – low-density lipoprotein, – Spearman correlation coefficient; p – p-value; TMT-A – Trail Making Test A; TMT-B – Trail Making Test B.
Figure 2—figure supplement 3
Partial least squares correlation analysis – Hamburg City Health Study (HCHS) (including cognitive test results).
Partial least squares correlation analysis of the HCHS subsample including cognitive test results. (a) Explained variance and p-values of latent variables. (b) Scatter plot relating subject-specific clinical and imaging scores. Higher scores indicate higher adherence to the respective covariance profile. (c) Clinical covariance profile. 95% confidence intervals were calculated via bootstrap resampling. Note that confound removal for age, sex, and education was performed prior to the PLS. (d) Bootstrap ratio representing the covarying brain morphology pattern. A high positive or negative bootstrap ratio indicates high contribution of a brain region to the overall covariance profile. Regions with a significant bootstrap ratio (>1.96 or <–1.96) are highlighted by colors. Abbreviations: BMI – Body mass index, HDL – high-density lipoprotein, LDL – low-density lipoprotein, – Spearman correlation coefficient; p – p-value; TMT-A – Trail Making Test A; TMT-B – Trail Making Test B.
Figure 2—figure supplement 4
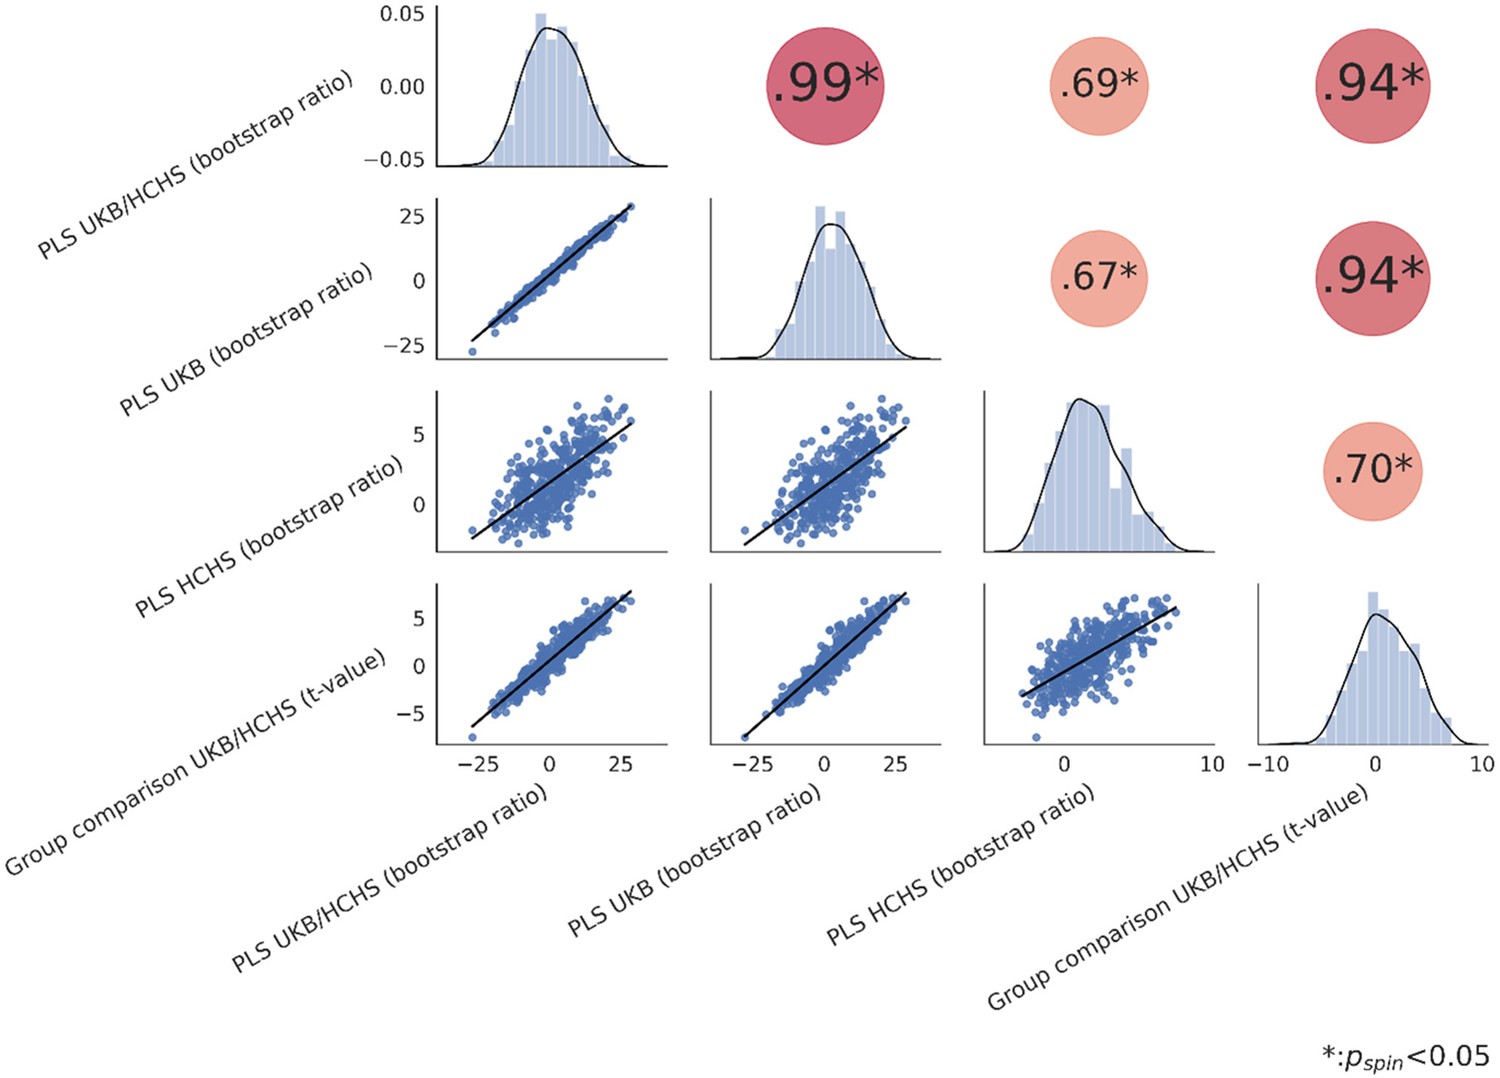
Spatial correlation of effect size maps.
Spatial correlation matrix of all Schaefer 400-parcellated metabolic syndrome effect maps (bootstrap ratio and t-statistic). The upper triangle of the matrix displays Spearman correlations with dot size and color representing the magnitude of the coefficients. Asterisks highlight significant correlations after spin permutation testing and false discovery rate correction. The diagonal shows kernel density plots. The lower triangle illustrates the variables’ linear relationships via regression plots. Abbreviations: HCHS – Hamburg City Health Study, PLS – Partial least squares correlation analysis; - Spearman correlation coefficient; – false discovery rate-corrected p-value derived from spin permutations; UKB – UK Biobank.
Figure 3
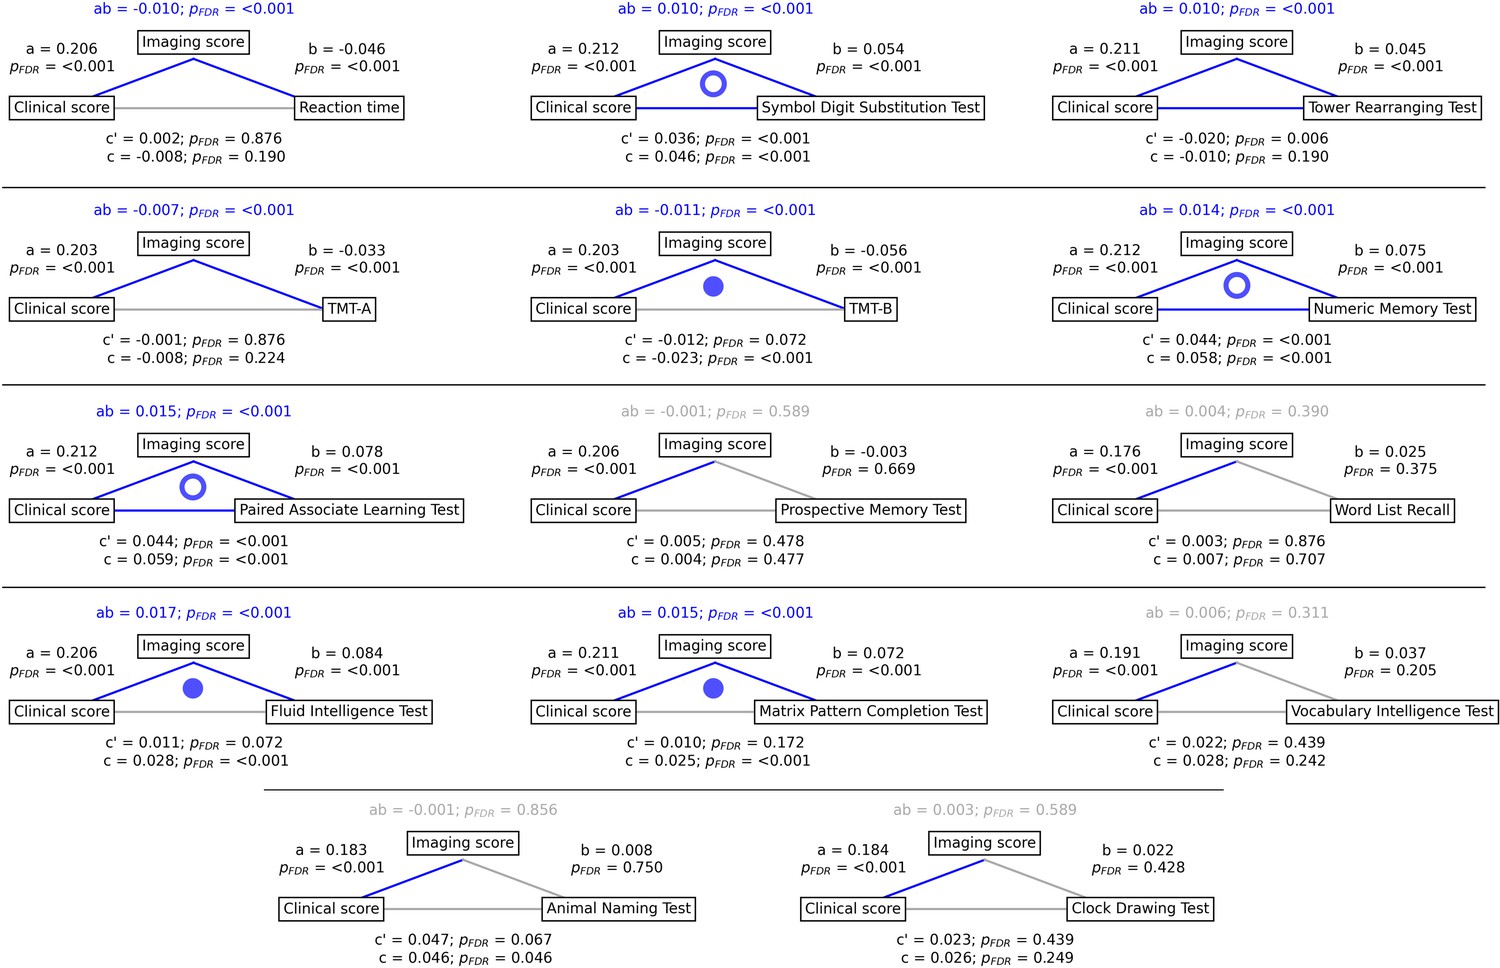
Mediation analysis results.
Mediation effects of subject-specific imaging PLS scores on the relationship between metabolic syndrome (MetS) represented by the clinical PLS score and cognitive test performances. Path plots display standardized effects and p-values: (a) clinical score to imaging score, (b) imaging score to cognitive score, (ab) indirect effect (c’) direct effect, and (c) total effect. Significant paths are highlighted in blue; non-significant in light gray. If the indirect effect ab was significant, the text for ab is highlighted in blue. A blue dot in the path plot indicates if a relationship is significantly mediated, i.e., the indirect effect ab was significant and the direct effect c’ was reduced or non-significant compared to the total effect c. An empty dot indicates a partial mediation, and a full dot indicates a full mediation. Abbreviations: - false discovery rate-corrected p-values; PLS – partial least squares correlation; TMT-A – Trail Making Test A; TMT-B – Trail Making Test B.
Figure 4 with 2 supplements
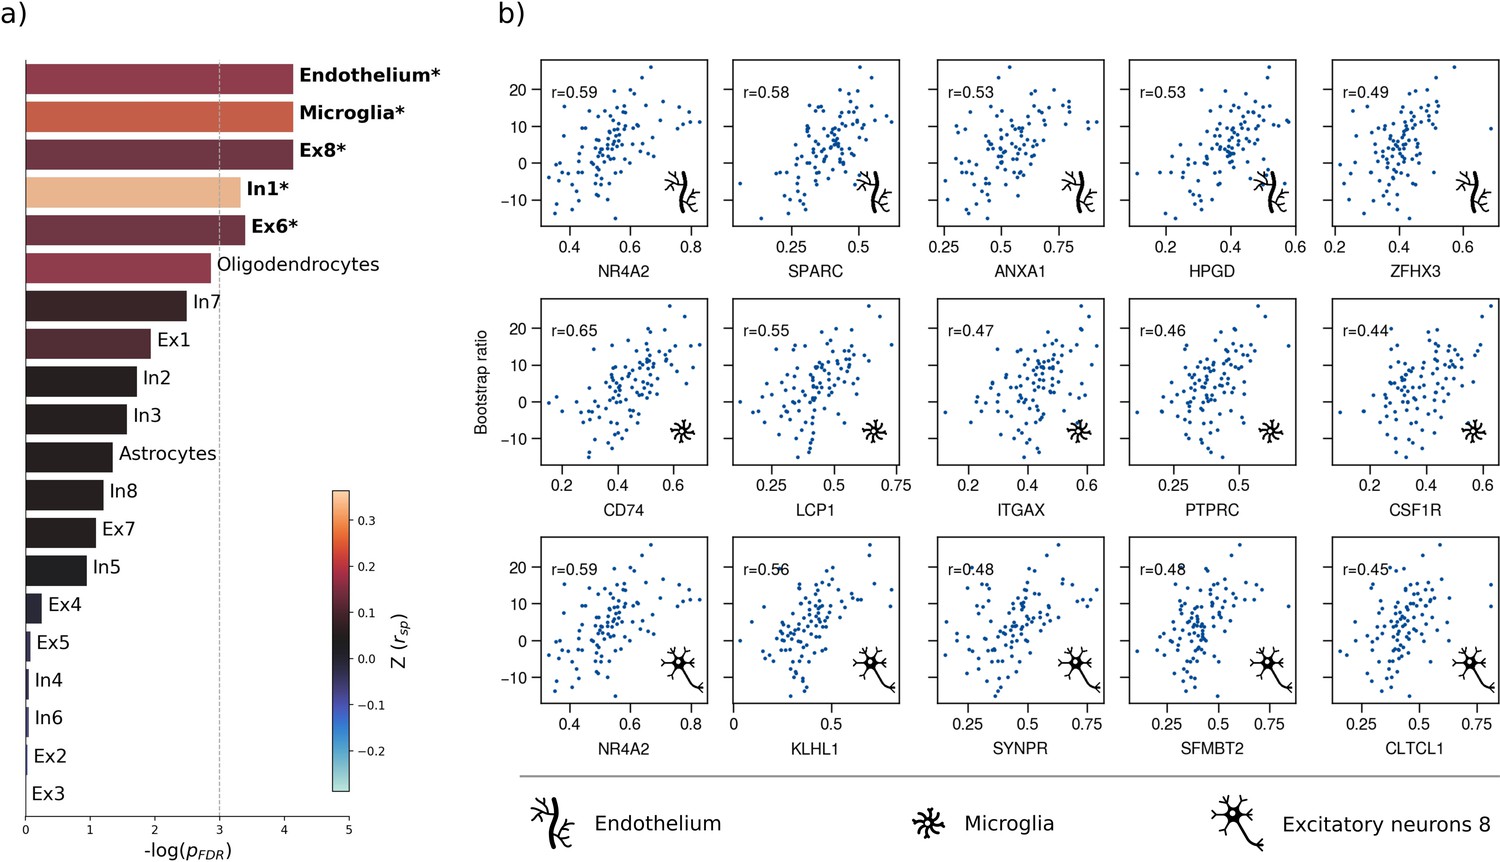
Virtual histology analysis.
The regional correspondence between metabolic syndrome (MetS) effects (bootstrap ratio) and cell type-specific gene expression profiles was examined via an ensemble-based gene category enrichment analysis. (a) Barplot displaying spatial correlation results. The bar height displays the significance level. Colors encode the aggregate z-transformed Spearman correlation coefficient relating the Schaefer100-parcellated bootstrap ratio and respective cell population densities. Asterisks indicate statistical significance. The significance threshold of <0.05 is highlighted by a vertical dashed line. (b) Scatter plots illustrating spatial correlations between MetS effects and exemplary cortical gene expression profiles per cell population significantly associated across analyses – i.e., endothelium, microglia, and excitatory neurons type 8. Top 5 genes most strongly correlating with the bootstrap ratio map were visualized for each of these cell populations. Icons in the bottom right of each scatter plot indicate the corresponding cell type. A legend explaining the icons is provided at the bottom. First row: endothelium; second row: microglia; third row: excitatory neurons type 8. Virtual histology analysis results for the bootstrap ratios of latent variables 2 and 3 are shown in Figure 4—figure supplement 1. A corresponding plot illustrating the contextualization of the t-statistic derived from group statistics is shown in Figure 4—figure supplement 2. Abbreviations: – negative logarithm of the false discovery rate-corrected p-value derived from spatial lag models (Dukart et al., 2021; Burt et al., 2018); – Spearman correlation coeffient. – aggregate z-transformed Spearman correlation coefficient.
Figure 4—figure supplement 1
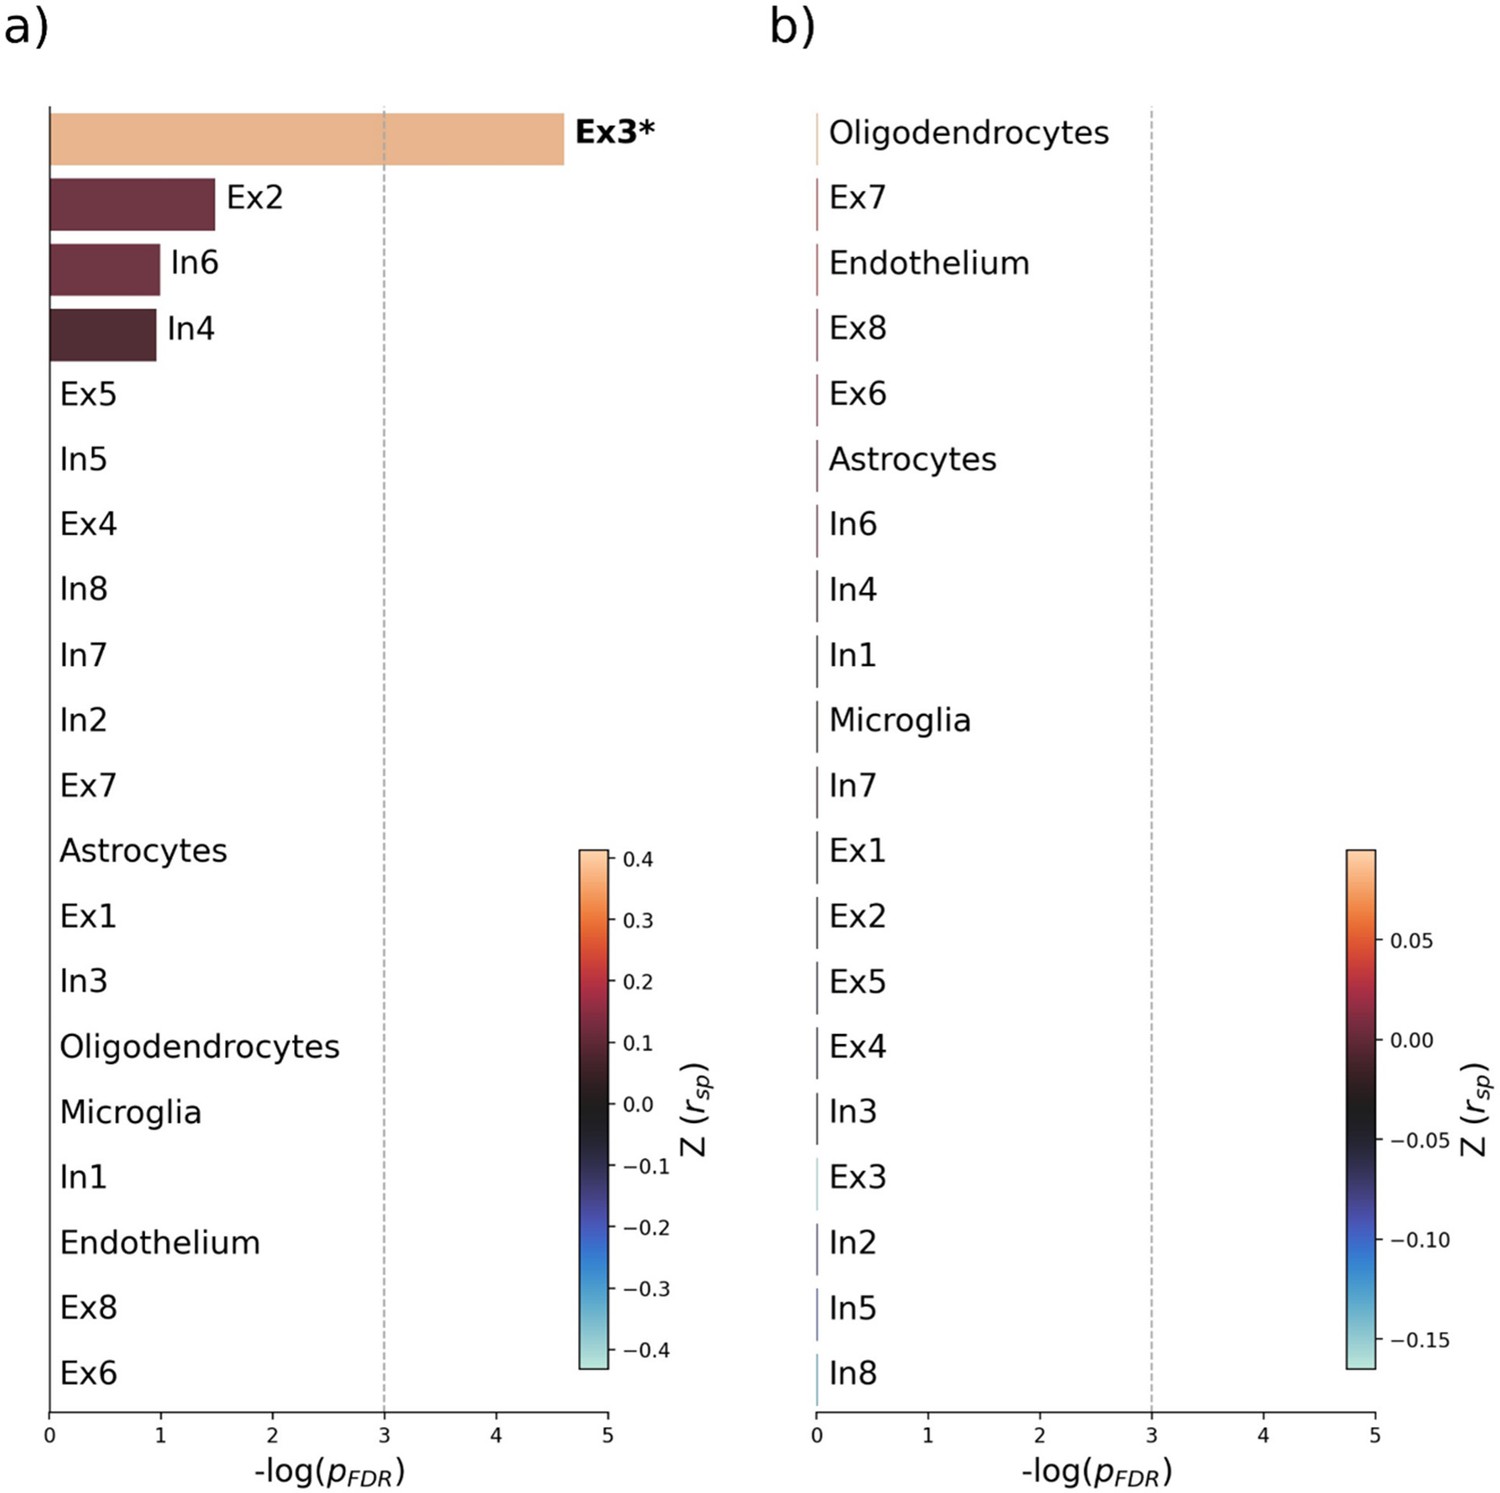
Virtual histology analysis of latent variables 2 and 3.
Virtual histology analysis of the bootstrap ratio maps of latent variables 2 and 3 from the partial least squares (PLS) main analysis. Barplots display spatial correlation results of the bootstrap ratio of latent variables 2 and 3 and respective cell population densities computed via ensemble-based gene category enrichment analysis. (a) Results corresponding with the bootstrap ratio of latent variable 2. (b) Results corresponding with the bootstrap ratio of latent variable 3. Abbreviations: – negative logarithm of the false discovery rate-corrected p-value derived from spatial lag models; – Spearman correlation coefficient. – aggregate z-transformed Spearman correlation coefficient.
Figure 4—figure supplement 2
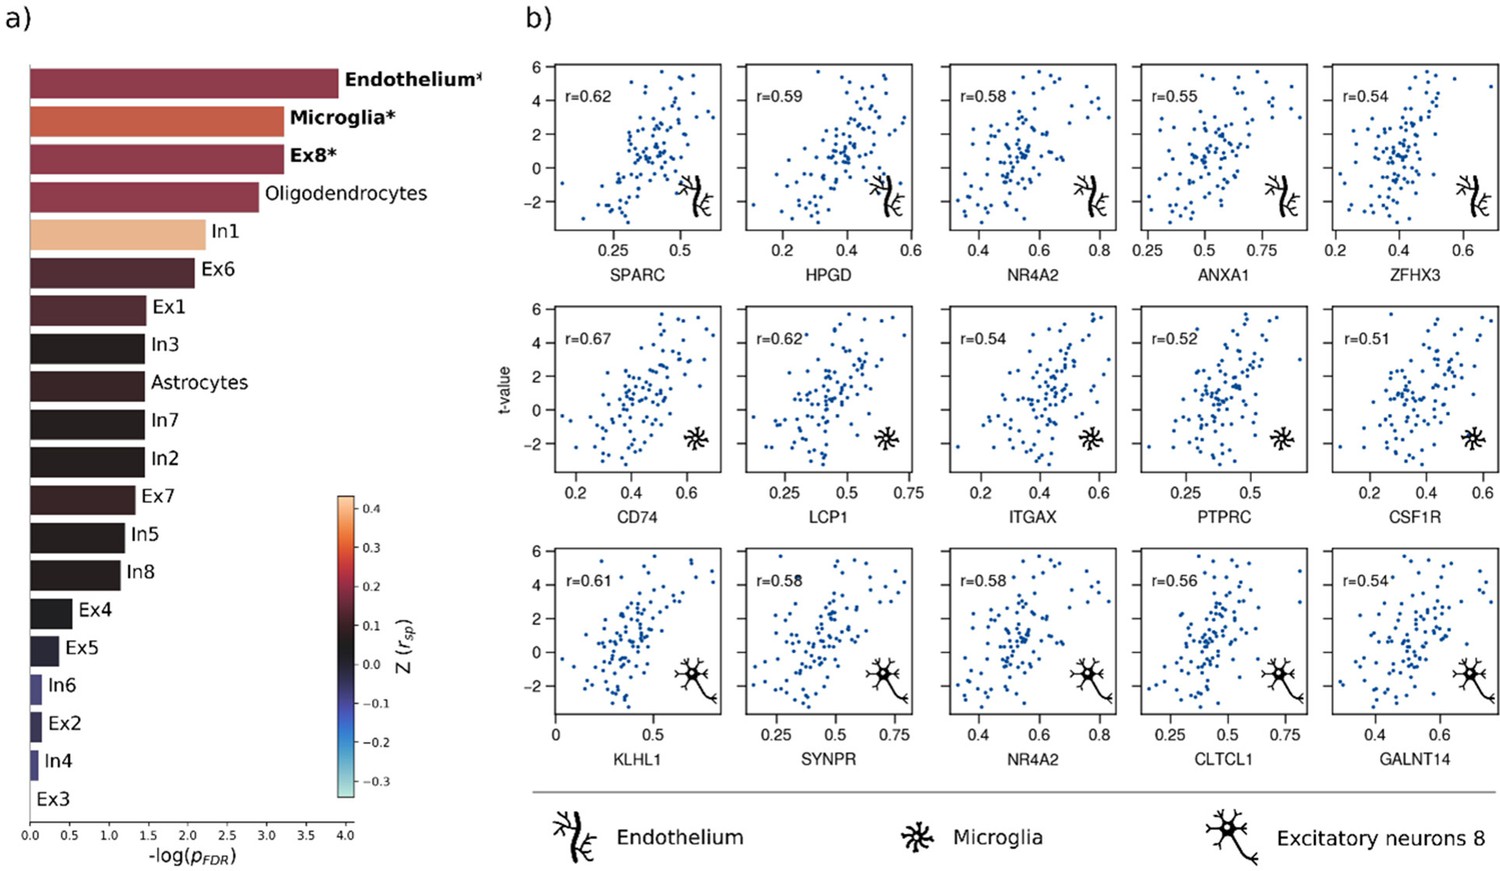
Sensitivity virtual histology analysis based on t-statistic map from group comparison.
Virtual histology analysis of the t-statistic map derived from group comparison between individuals with metabolic syndrome and controls. (a) Barplot displaying spatial correlation results of the bootstrap ratio and respective cell population densities computed via ensemble-based gene category enrichment analysis. (b) Scatter plots illustrating per significantly associated cell population exemplary genes with top 5-highest correlation coefficients with the t-statistic map per significantly associated cell population across analyses (i.e. endothelium, microglia, excitatory neurons 8). Icons in the bottom right of each scatter plot indicate the corresponding cell type. First row: endothelium; second row: microglia; third row: excitatory neurons type 8. Abbreviations: – negative logarithm of the false discovery rate-corrected p-value derived from spatial lag models; – Spearman correlation coefficient. – aggregate z-transformed Spearman correlation coefficient.
Figure 5 with 2 supplements
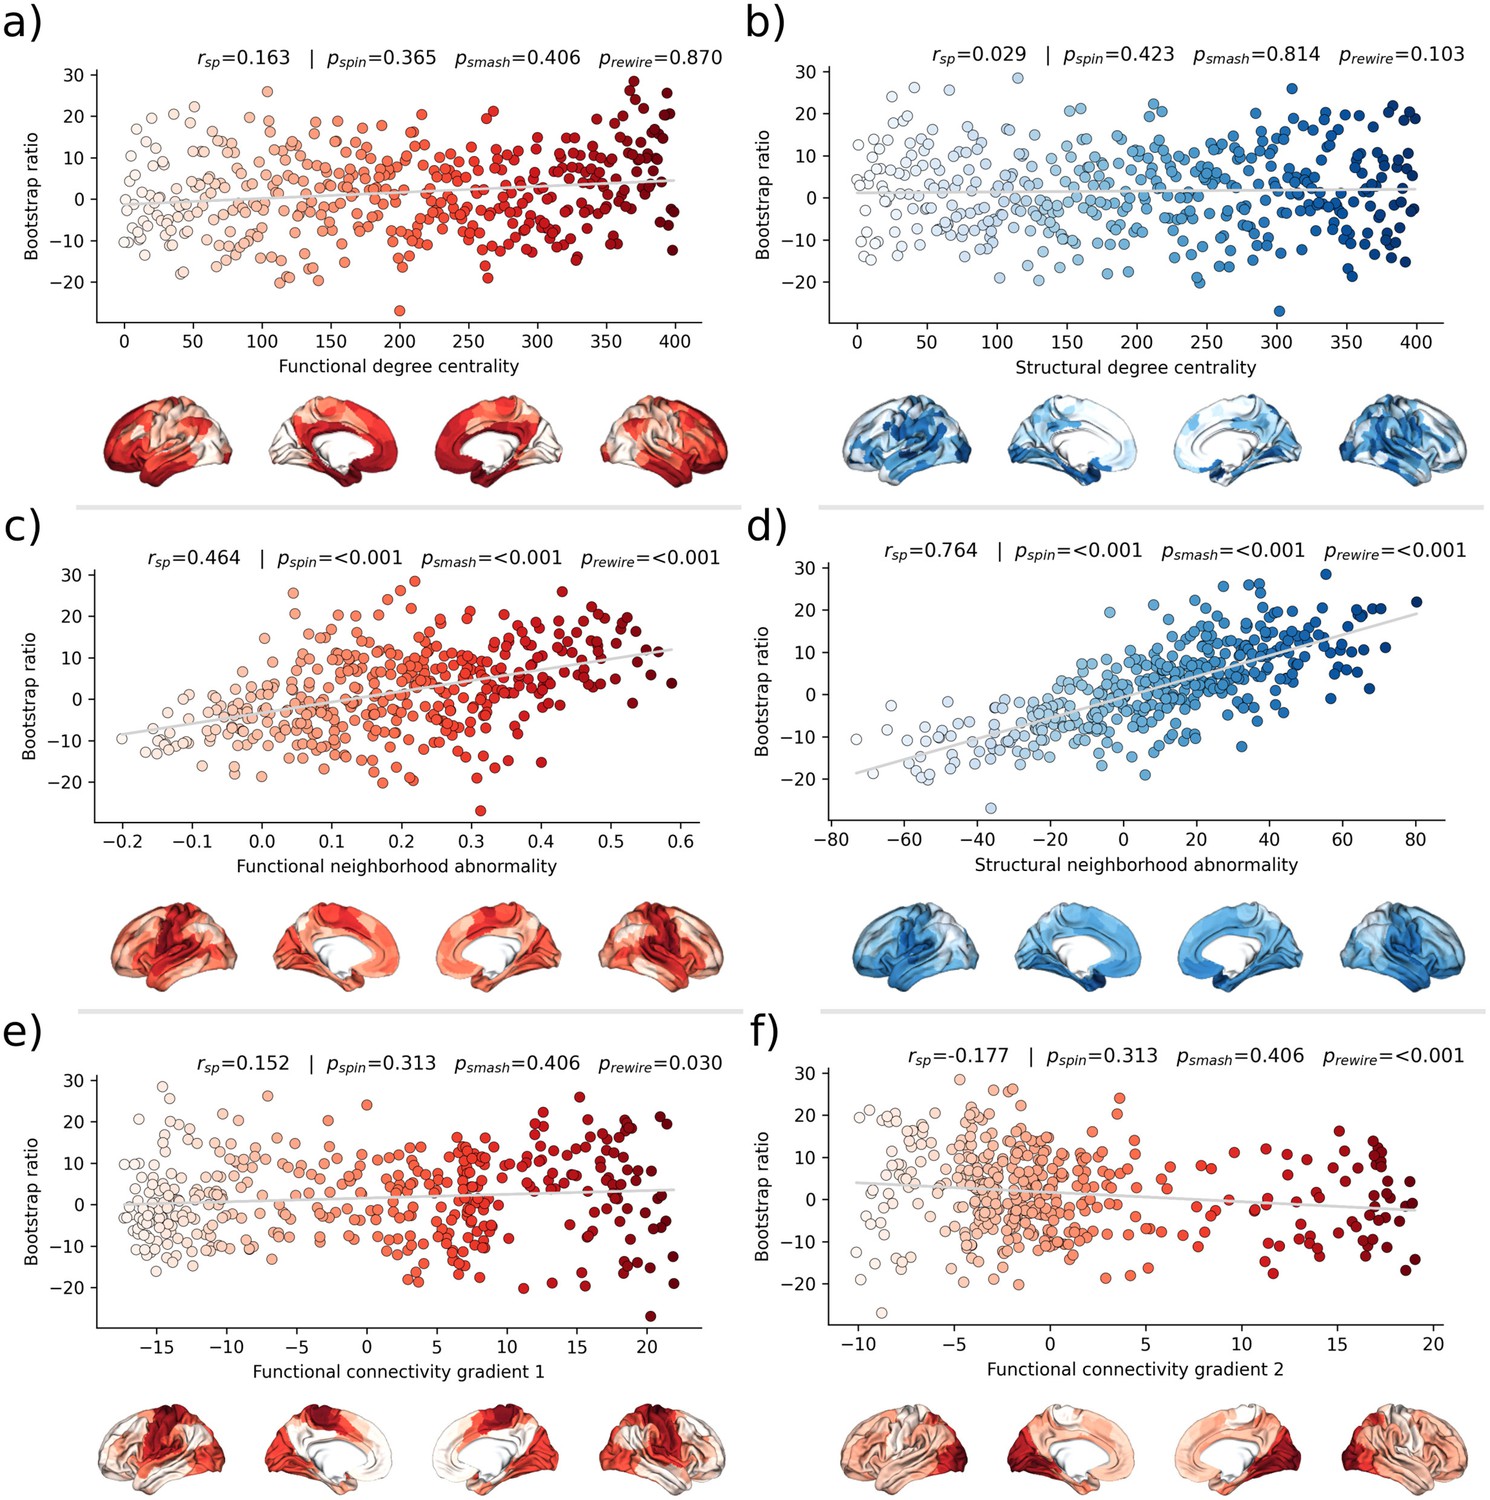
Brain network contextualization.
Spatial correlation results derived from relating Schaefer 400×7-parcellated maps of metabolic syndrome (MetS) effects (bootstrap ratio) to network topological indices (red: functional connectivity, blue: structural connectivity). Scatter plots that illustrate the spatial relationship are supplemented by surface plots for anatomical localization. The color coding of cortical regions and associated dots corresponds. (a and b) Functional and structural degree centrality rank. (c and d) Functional and structural neighborhood abnormality. (e and f) Intrinsic functional network hierarchy represented by functional connectivity gradients 1 and 2. Complementary results concerning t-statistic maps derived from group comparisons between MetS subjects and controls are presented in Figure 5—figure supplement 1. Corresponding results after reperforming the analysis with HCHS-derived group-consensus connectomes are presented in Figure 5—figure supplement 2. Abbreviations: HCHS – Hamburg City Health Study; - p-value derived from network rewiring (Maslov et al., 2004); - p-value derived from brainSMASH surrogates (Burt et al., 2020); - p-value derived from spin permutation results (Alexander-Bloch et al., 2018); - Spearman correlation coefficient.
Figure 5—figure supplement 1
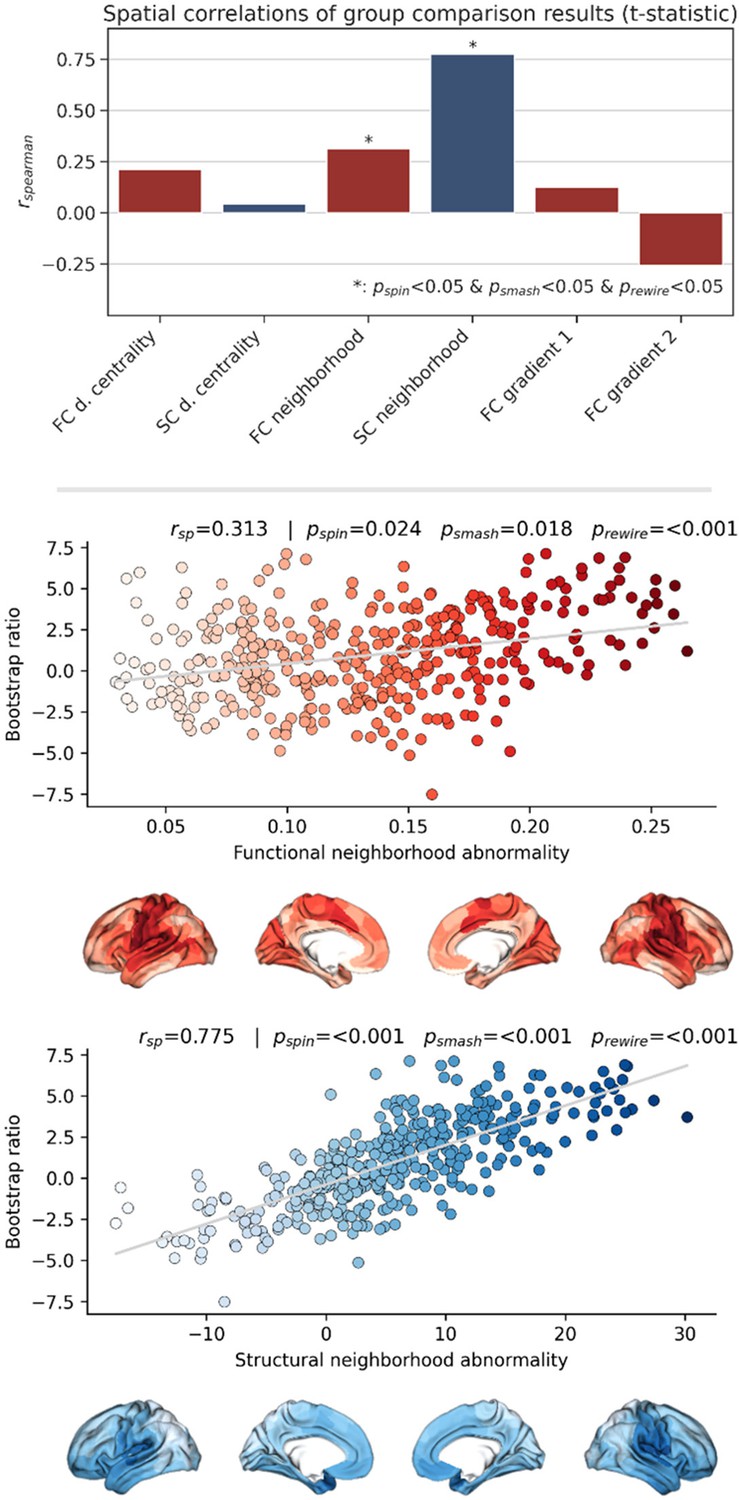
Sensitivity network contextualization analysis based on t-statistic map derived from group comparison.
Brain network contextualization analysis of group statistics results. Results are presented for t-statistics maps derived from group statistics considering the pooled sample of UK Biobank subjects and Hamburg City Health Study (HCHS) subjects. The upper row barplot summarizes the analysis results displaying the Spearman correlation with regard to each investigated index. Asterisks indicate statistical significance with respect to spin, brainSMASH, and network rewiring null models. The middle and lower rows display scatter plots of the significant association of the t-statistics map and the functional and structural neighborhood abnormality, respectively. The scatter plots are supplemented by surface plots for anatomical localization. Abbreviations: - p-value derived from network rewiring (Maslov et al., 2004); - p-value derived from brainSMASH surrogates (Burt et al., 2020); - p-value derived from spin permutation results (Alexander-Bloch et al., 2018); - Spearman correlation coefficient.
Figure 5—figure supplement 2
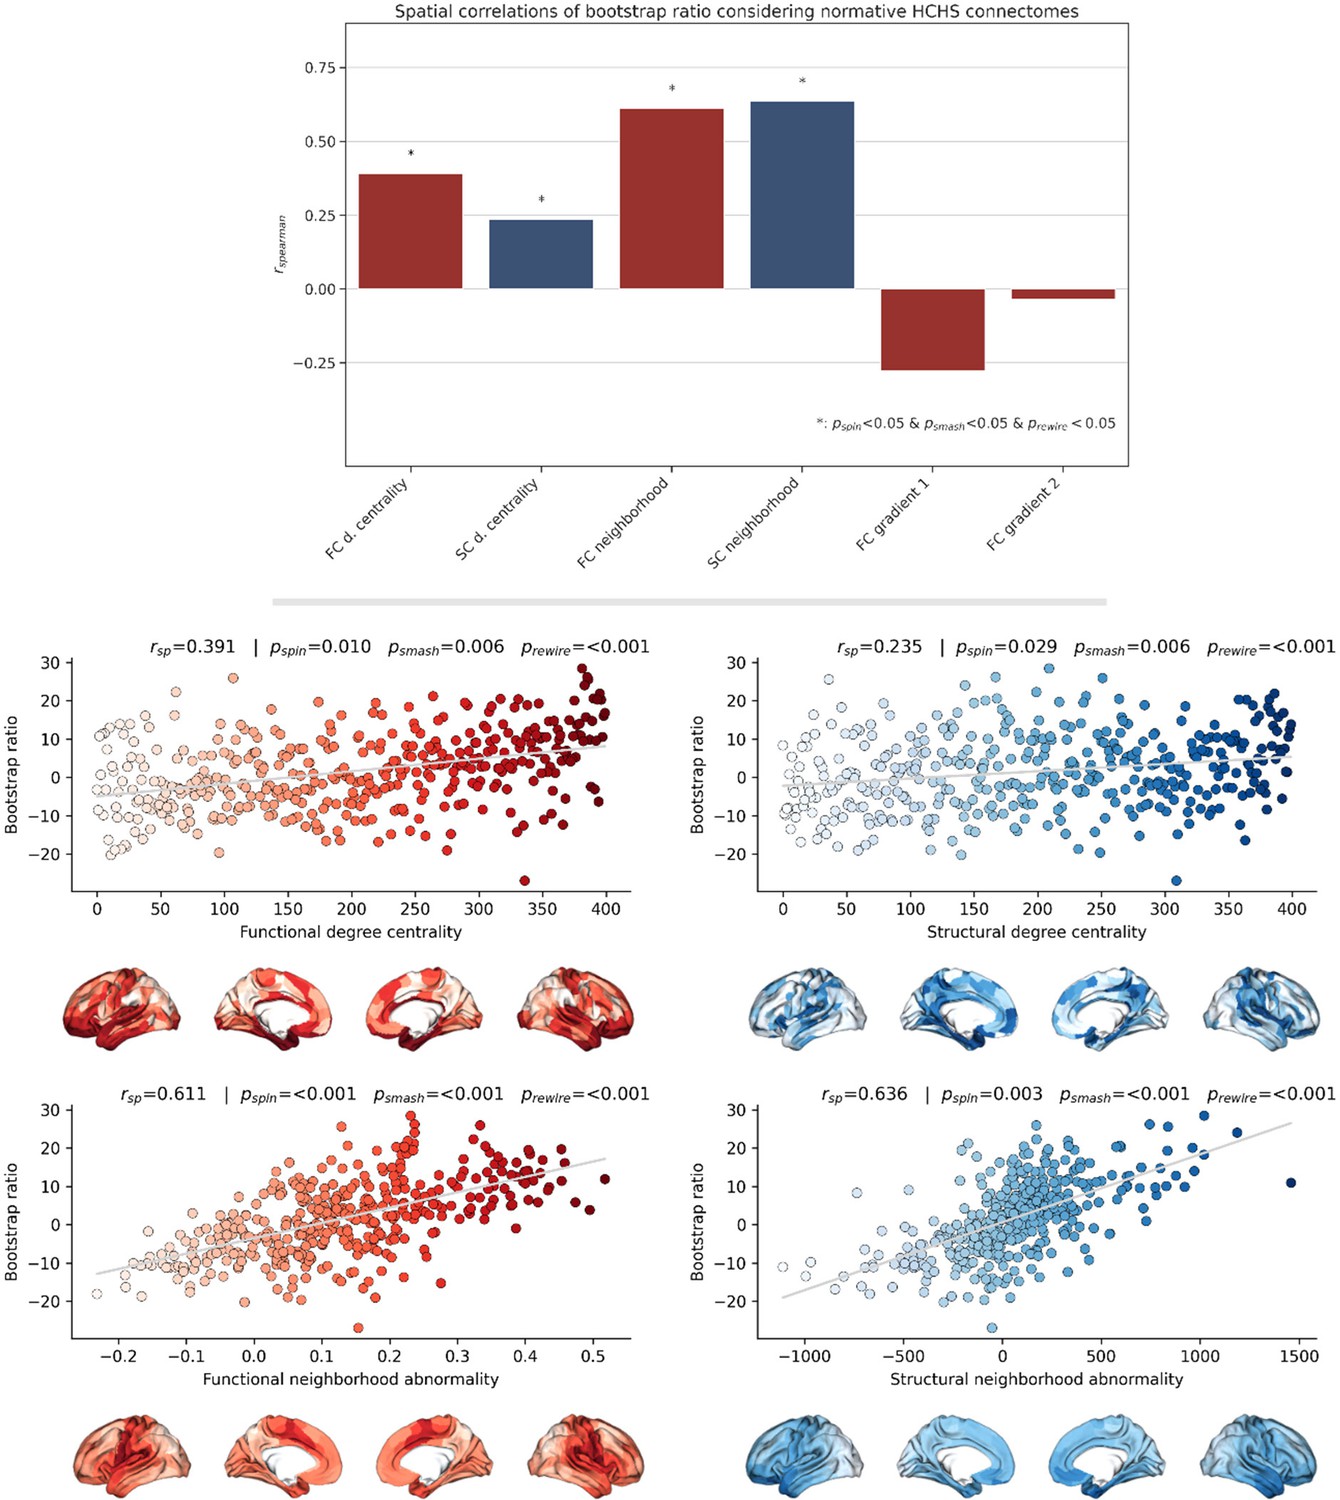
Sensitivity network contextualization analysis based on group-consensus connectomes from the Hamburg City Health Study.
Brain network contextualization analysis of partial least squares correlation results (bootstrap ratio) based on group-consensus connectomes from the Hamburg City Health Study. Results are presented for bootstrap ratio maps derived from partial least squares correlation analysis considering the pooled sample. The upper row bar plot summarizes the analysis results displaying the Spearman correlation with regard to each investigated index. Asterisks indicate statistical significance with respect to spin, brainSMASH, and network rewiring null models. Scatter plots that illustrate the significant spatial relationships are presented below. The middle row displays the relationship of the bootstrap ratio map and the ranked functional and structural degree centrality. The lower row illustrates the association of the bootstrap ratio map and the functional and structural neighborhood abnormality. Abbreviations: - p-value derived from network rewiring (Maslov et al., 2004); - p-value derived from brainSMASH surrogates (Burt et al., 2020); - p-value derived from spin permutation results (Alexander-Bloch et al., 2018); - Spearman correlation coefficient.
Figure 6
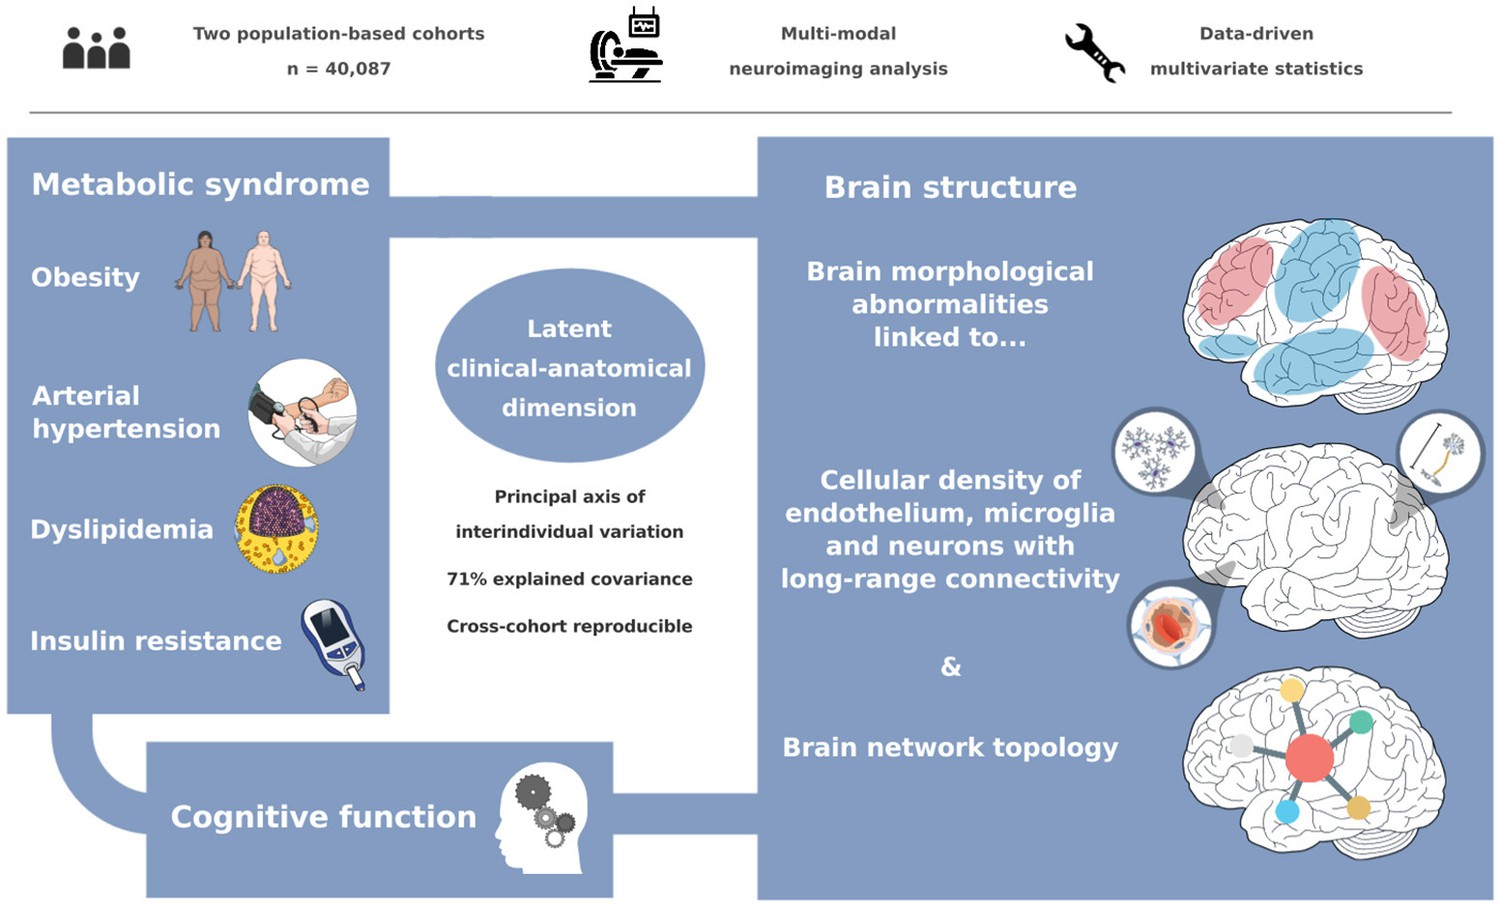
Graphical abstract.
Appendix 1—figure 1
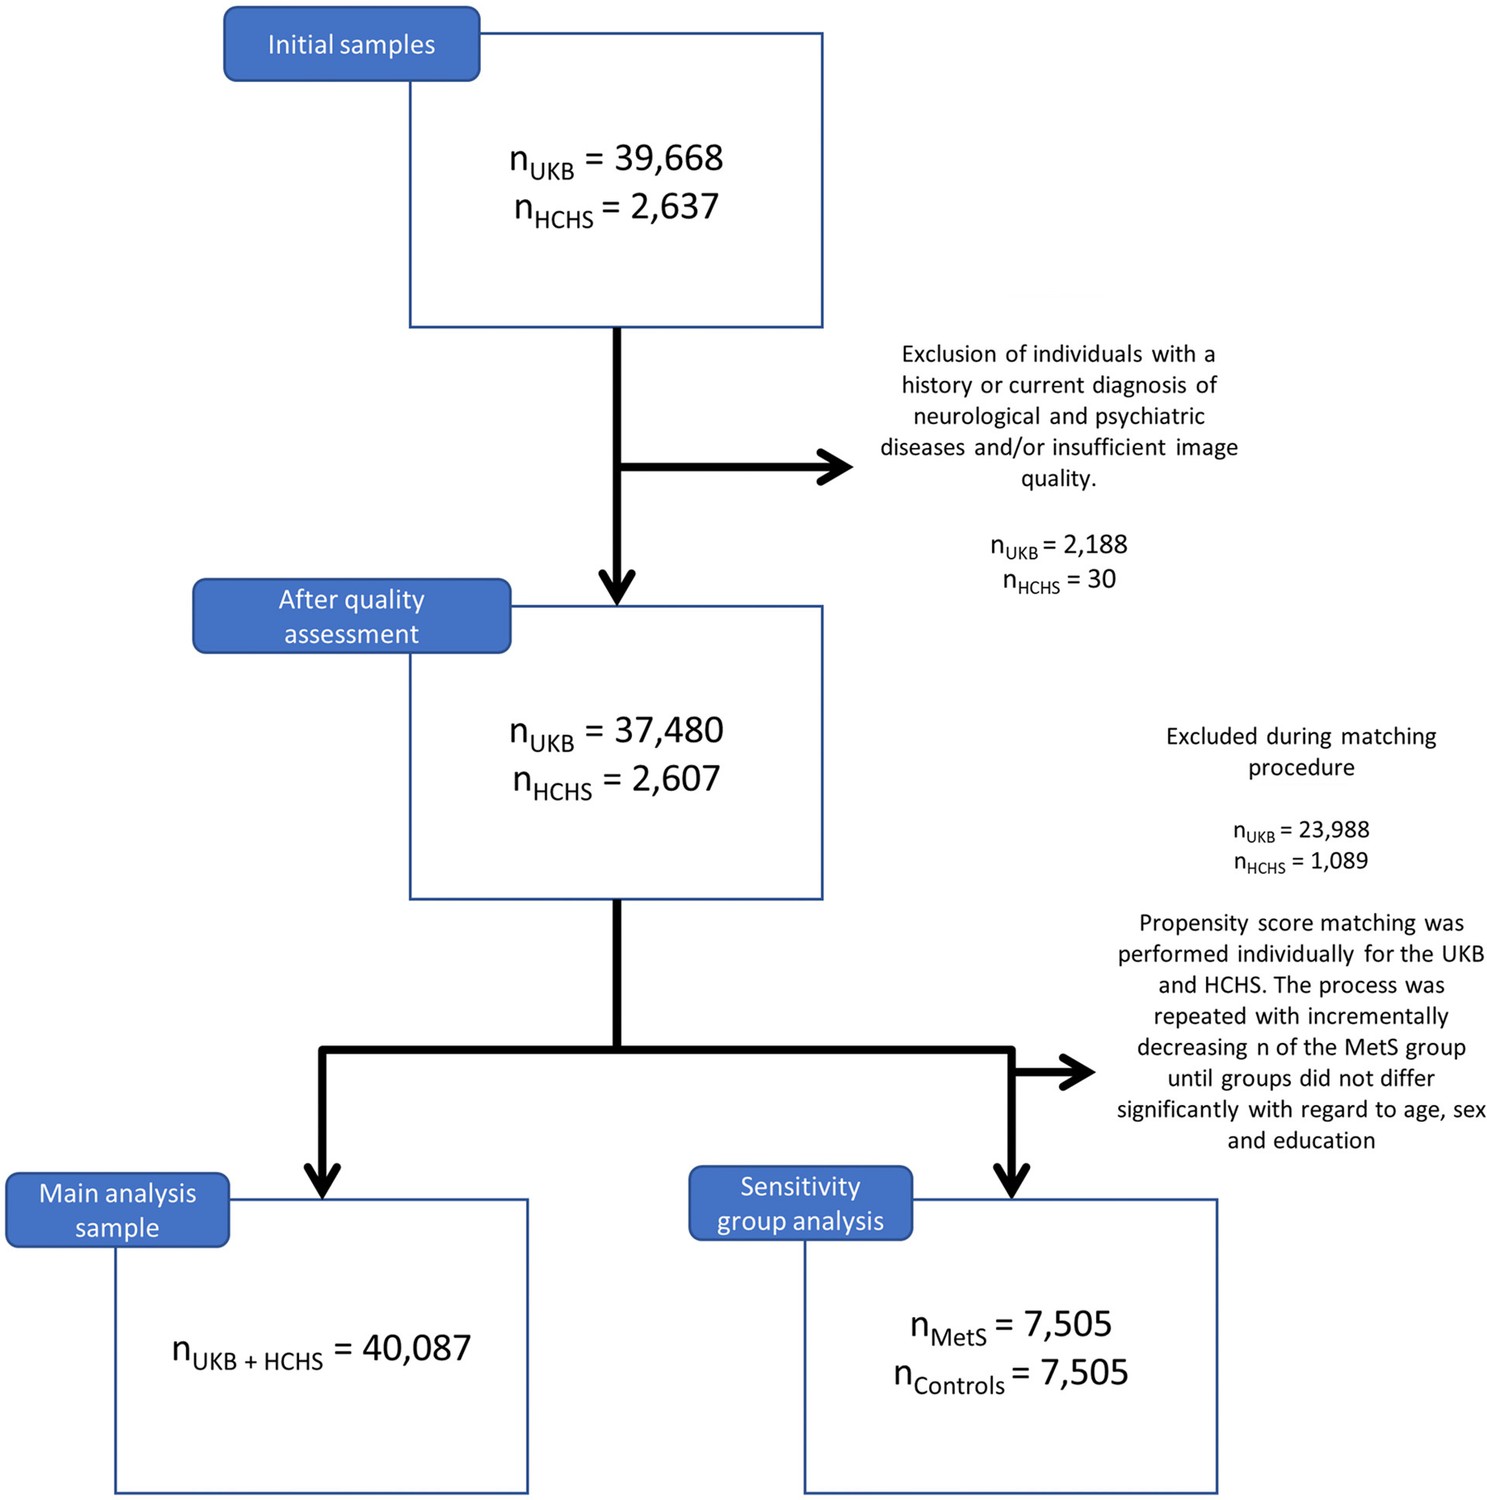
Flowchart sample selection procedure.
Appendix 1—figure 2
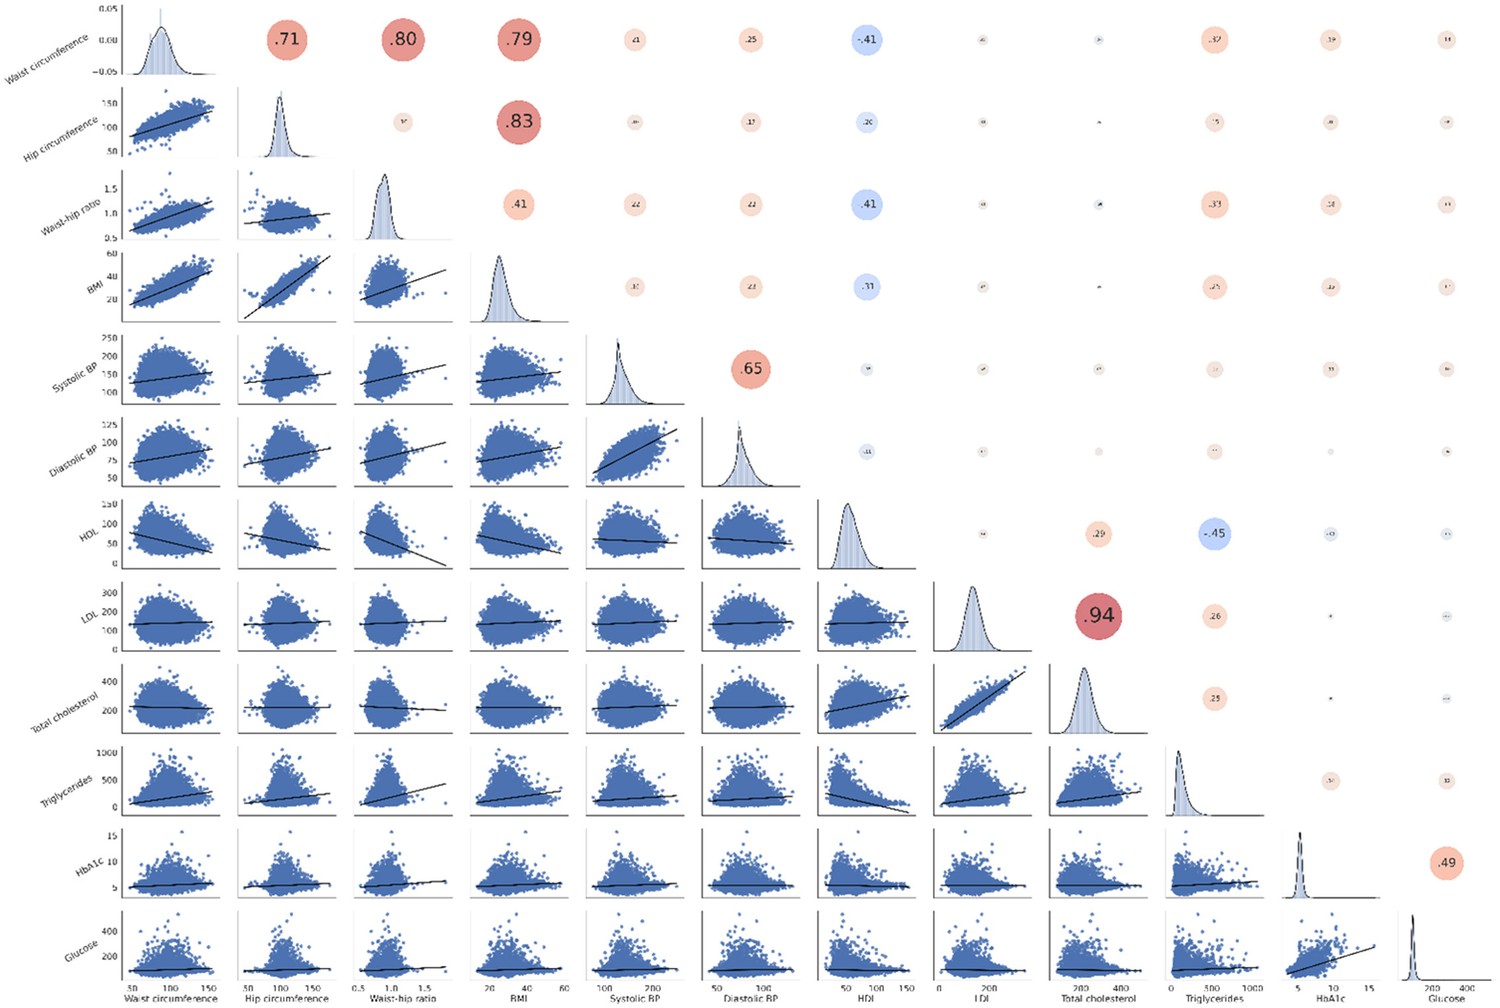
Correlation matrix of metabolic syndrome-related risk factors.
The upper triangle of the matrix displays Pearson correlations with dot size and color representing the magnitude of the coefficients. The diagonal shows kernel density plots. The lower triangle illustrates the variables’ linear relationships via regression plots. Of note, non fasting plasma glucose was investigated in this analysis. Abbreviations: BP – blood pressure.
Appendix 2—figure 1
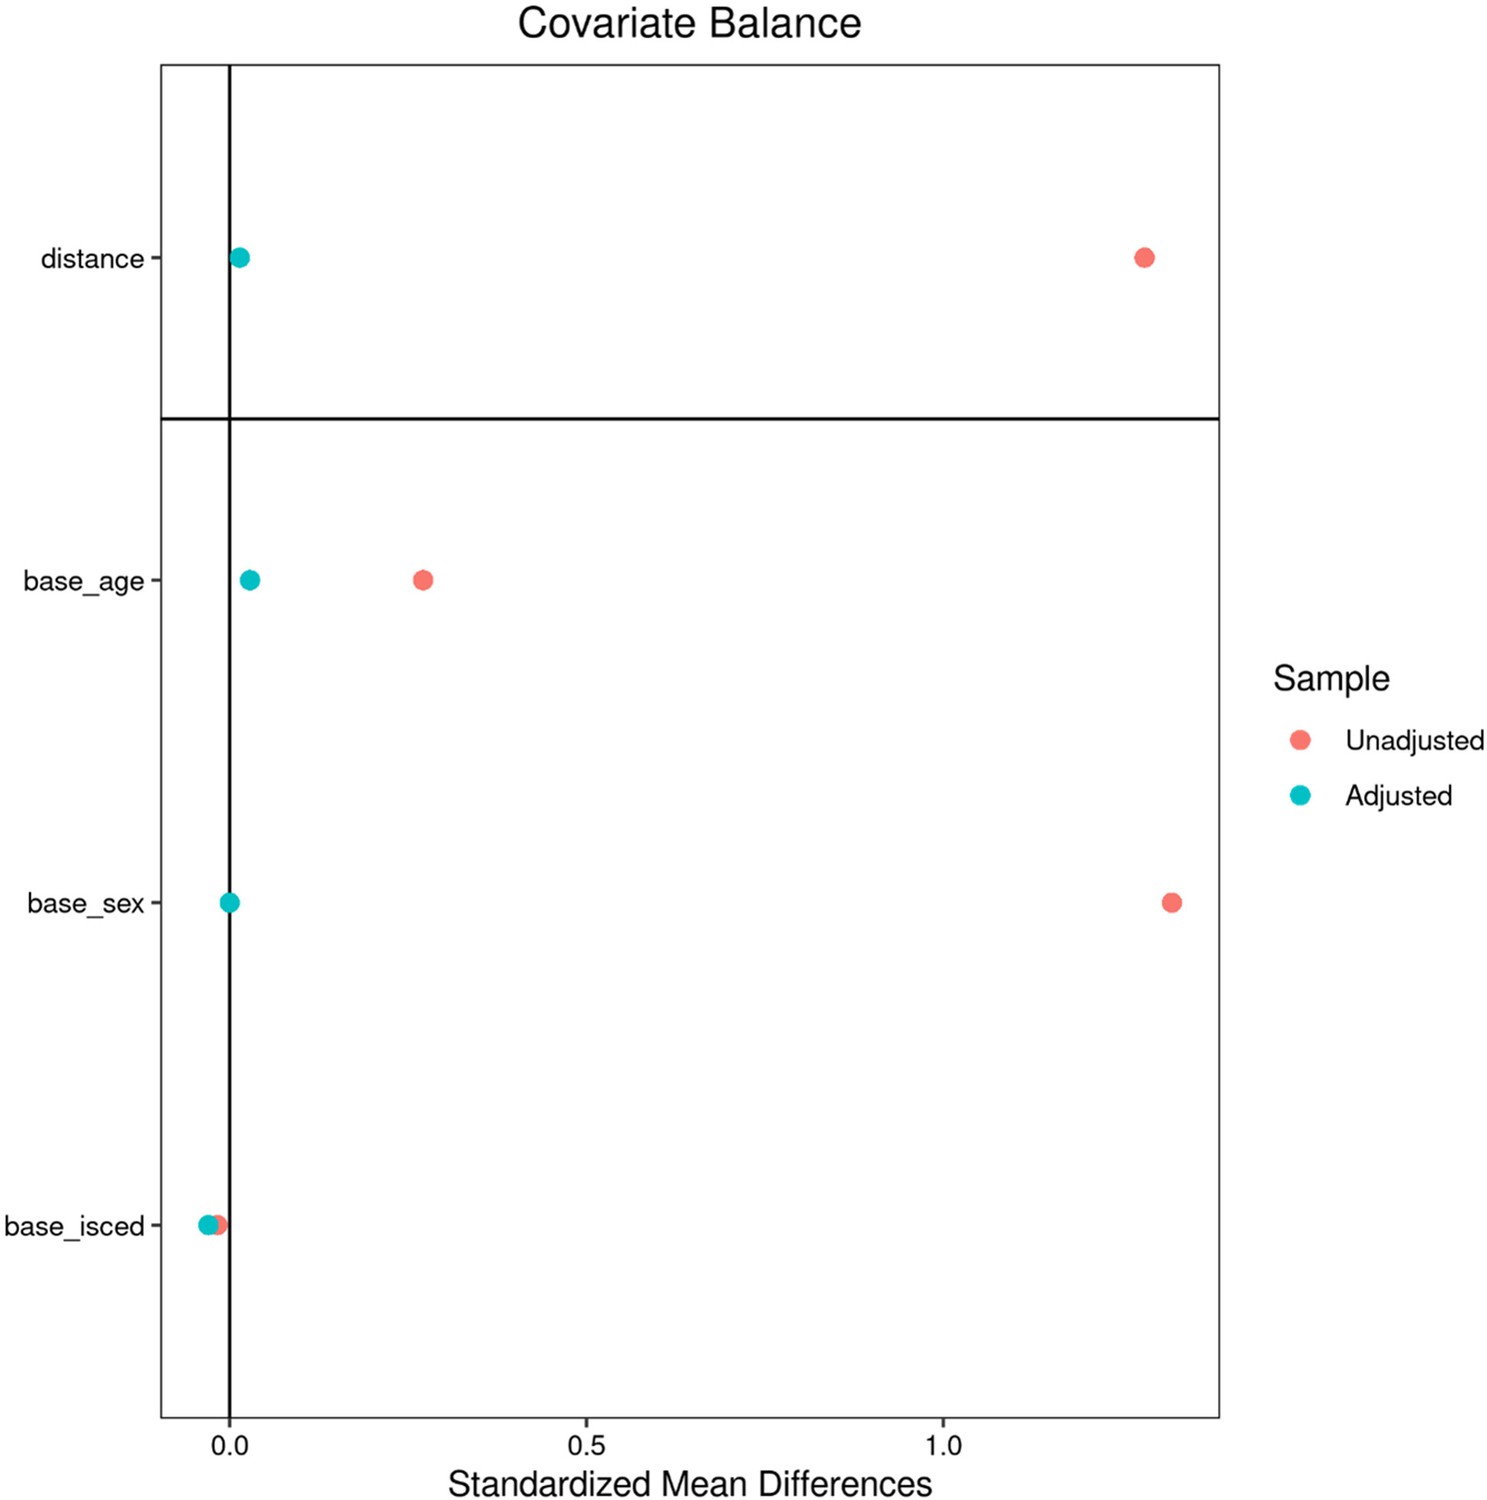
Matching - UK Biobank.
Appendix 2—figure 2
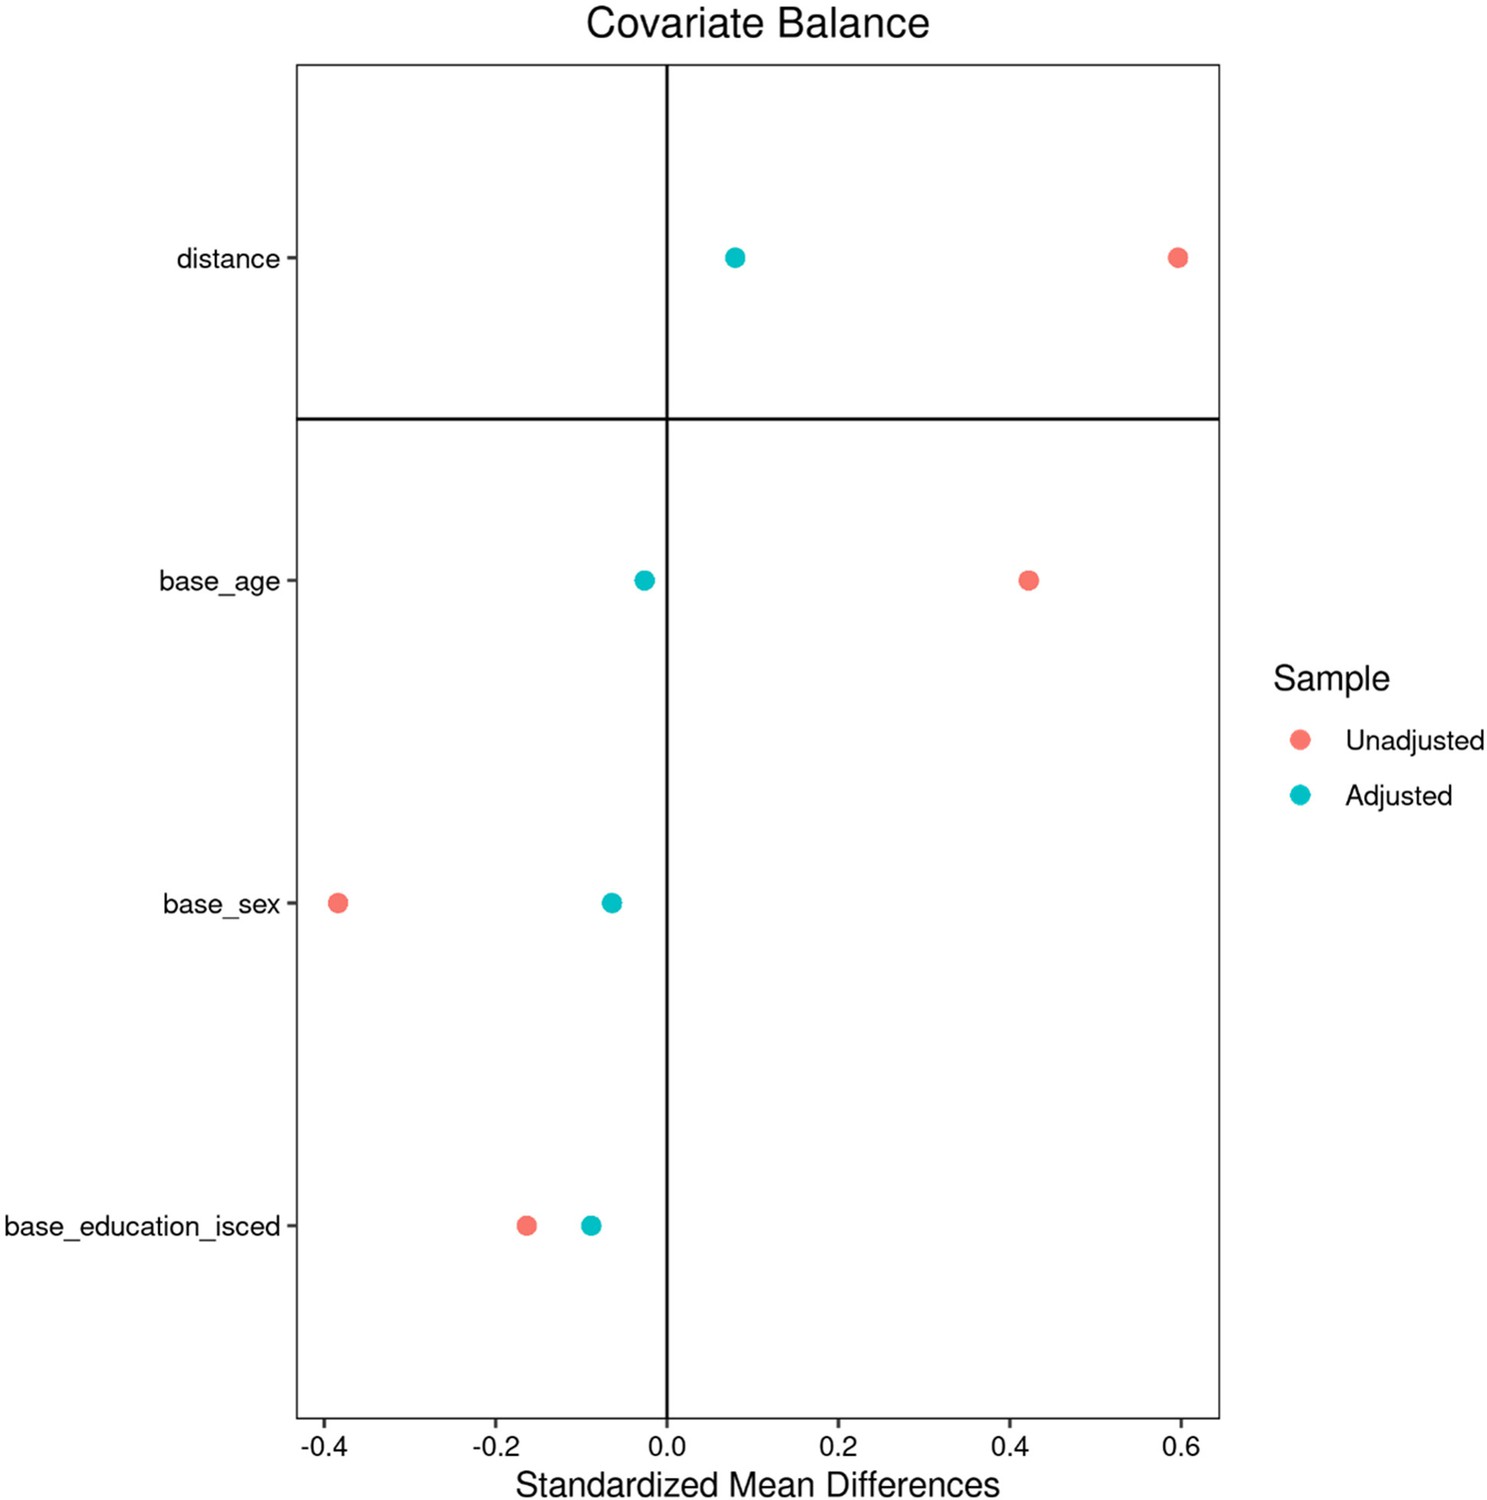
Matching – Hamburg City Health Study.
Appendix 2—figure 3
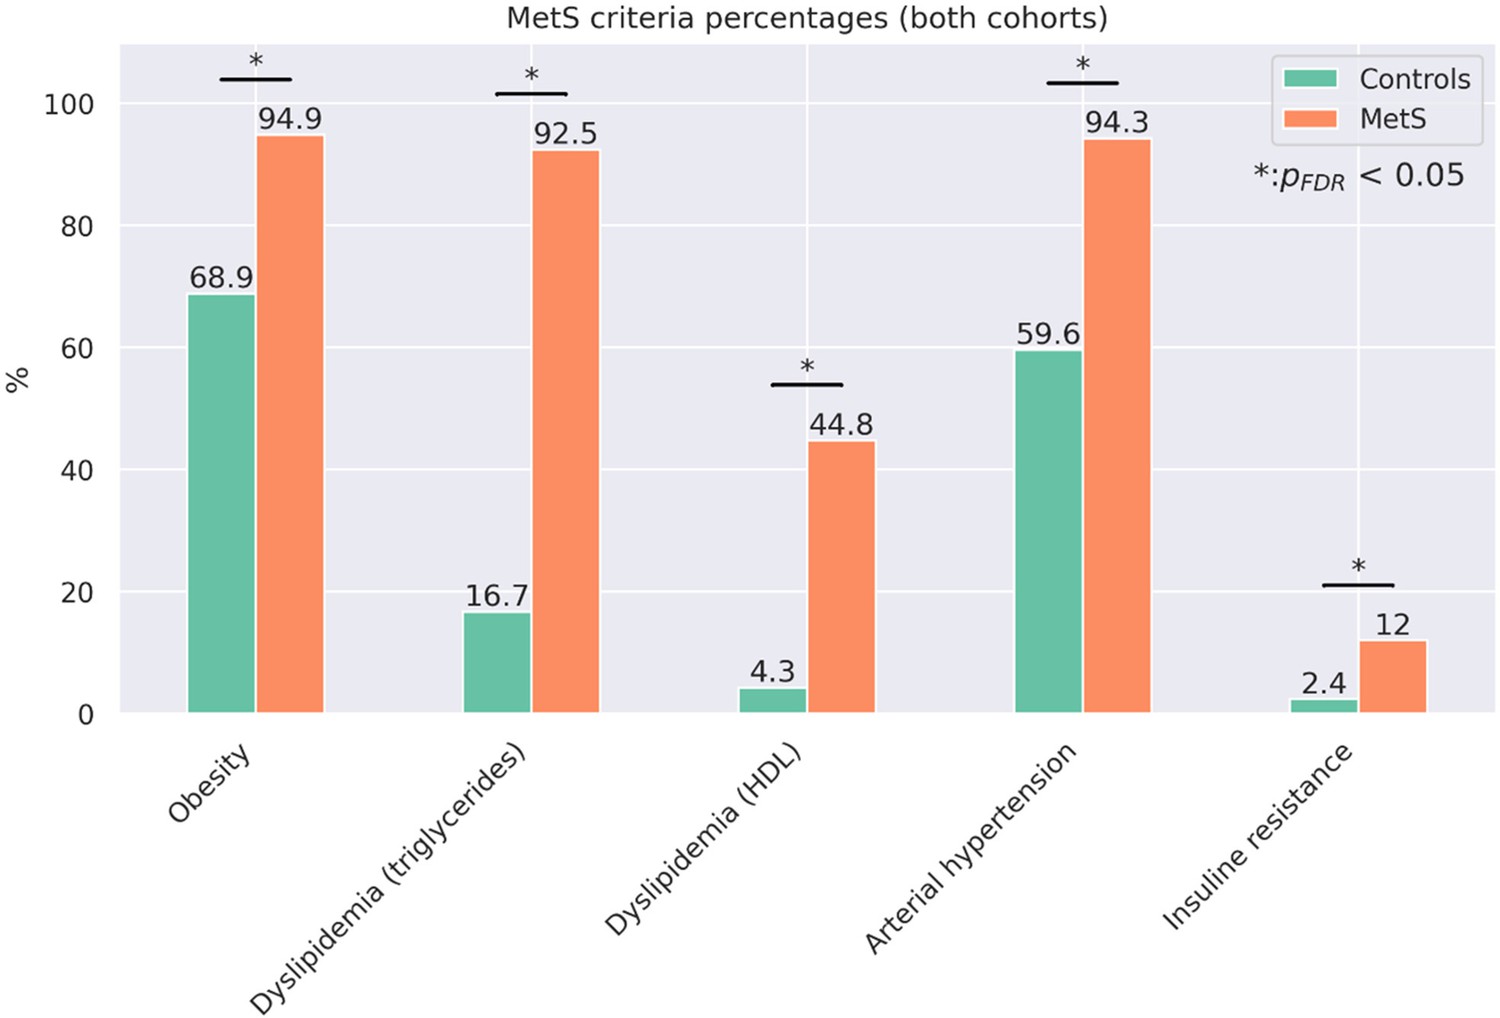
Proportion of metabolic syndrome criteria.
Barplots indicate the percentage amount of metabolic syndrome (MetS) criteria that apply by group for the pooled sample. Significant group differences in χ2-tests are highlighted by asterisks.
Appendix 2—figure 4
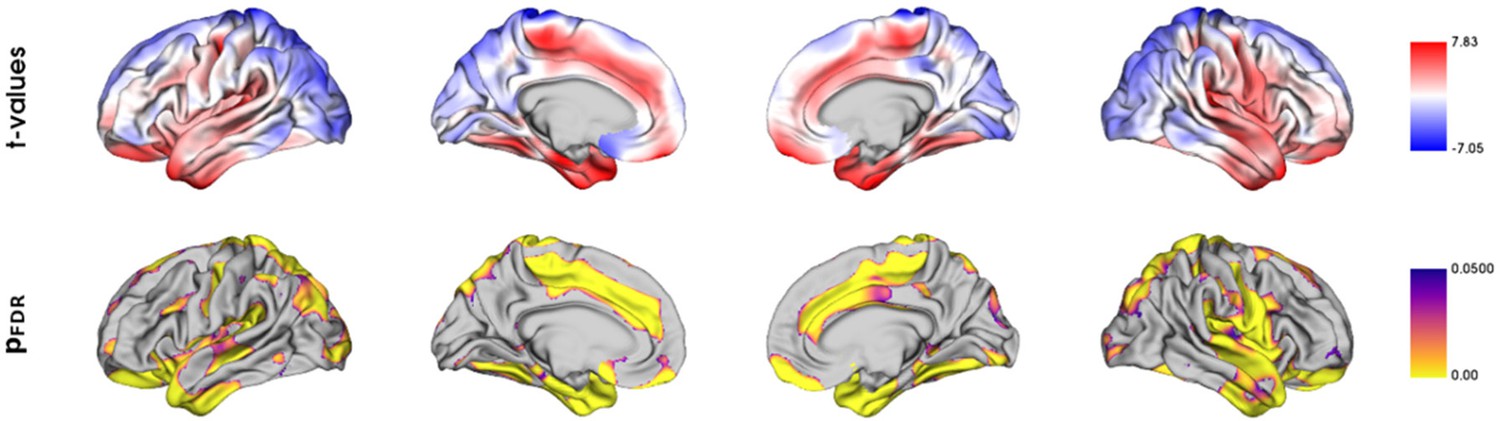
Vertix-wise group comparison of cortical thickness.
Vertex-level group comparison between individuals with metabolic syndrome and matched controls. Resulting surface maps of standardized t-statistic estimates encode the group-differences between patients and controls, with lower cortical thickness in the metabolic syndrome (MetS) group being represented by a positive t and lower by a negative t. The vertex-wise t-statistic map was Schaefer-parcellated for the downstream analyses.
Tables
Table 1
Descriptive statistics UKB and HCHS.
| Metric | Stat* |
|---|---|
| Age (years) | 63.55±7.59 (40087) |
| Sex (% female) | 46.47 (40087) |
| Education (ISCED) | 2.62±0.73 (39944) |
| Metabolic syndrome components | |
| Waist circumference (cm) | 88.47±12.71 (38800) |
| Hip circumference (cm) | 100.90±8.79 (38801) |
| Waist-hip ratio | 0.88±0.09 (38800) |
| Body mass index | 26.47±4.37 (38701) |
| RRsystolic (mmHg) | 138.30±18.57 (31234) |
| RRdiastolic (mmHg) | 78.88±10.09 (31238) |
| Antihypertensive therapy (%) | 6.96 (39976) |
| HDL (mg/dL) | 61.76±23.69 (34468) |
| LDL (mg/dL) | 137.38±36.29 (37456) |
| Cholesterol (mg/dL) | 211.29±56.42 (37531) |
| Triglycerides (mg/dL) | 148.90±83.84 (37510) |
| Lipid lowering therapy (%) | 14.44 (39976) |
| HbA1c (%) | 5.37±0.48 (37284) |
| Blood glucose (mg/dL) | 90.29±17.58 (34432) |
| Antidiabetic therapy (%) | 0.45 (39976) |
| Imaging | |
| Mean cortical thickness (mm) | 2.40±0.09 (40087) |
| Cognitive variables of the UK Biobank | |
| Fluid Intelligence | 6.63±2.06 (36510) |
| Matrix Pattern Completion | 7.99±2.13 (25771) |
| Numeric Memory Test | 6.69±1.52 (26780) |
| Paired Associate Learning | 6.92±2.63 (26048) |
| Prospective Memory | 1.07±0.39 (37192) |
| Reaction Time (sec) | 594.16±109.08 (37015) |
| Symbol Digit Substitution | 18.96±5.25 (25810) |
| Tower Rearranging Test | 9.91±3.23 (25555) |
| Trail Making Test A (sec) | 223.03±86.51 (26048) |
| Trail Making Test B (sec) | 550.01±270.09 (26048) |
| Cognitive variables of the Hamburg City Health Study | |
| Animal Naming Test | 24.78±6.92 (2416) |
| Clock Drawing Test | 6.43±1.12 (2479) |
| Trail Making Test A (sec) | 40.09±14.33 (2290) |
| Trail Making Test B (sec) | 90.05±37.30 (2264) |
| Multiple-Choice Vocabulary Intelligence Test | 31.27±3.58 (2026) |
| Word List Recall | 7.75±1.84 (2342) |
-
*
Presented as mean ± SD (N).
Appendix 1—table 1
Partial least squares analysis - latent variables.
| Latent variable | Explained variance (%) | p-value |
|---|---|---|
| 0 | 71.20 | 0.0002 |
| 1 | 22.33 | 0.0002 |
| 2 | 2.12 | 0.0002 |
| 3 | 1.84 | 0.0006 |
| 4 | 1.03 | 0.0026 |
| 5 | 0.52 | 0.0266 |
| 6 | 0.38 | 0.0100 |
| 7 | 0.23 | 0.0032 |
| 8 | 0.18 | 0.1178 |
| 9 | 0.16 | 0.2122 |
| 10 | 0.00 | 0.3137 |
| 11 | 0.00 | 0.0608 |
| 12 | 0.00 | 1 |
| 13 | 0.00 | 1 |
| 14 | 0.00 | 1 |
| 15 | 0.00 | 1 |
Appendix 1—table 2
Partial least squares analysis-Cross-validation.
| CV fold | rsp |
|---|---|
| 0 | 0.17 |
| 1 | 0.21 |
| 2 | 0.22 |
| 3 | 0.16 |
| 4 | 0.15 |
| 5 | 0.18 |
| 6 | 0.23 |
| 7 | 0.13 |
| 8 | 0.20 |
| 9 | 0.22 |
Appendix 1—table 3
Virtual histology analysis - Bootstrap ratio (partial least squares, PLS).
| Cell type | Zrsp | pFDR |
|---|---|---|
| Endo | 0.190 | 0.016 |
| Micro | 0.271 | 0.016 |
| Ex8 | 0.165 | 0.016 |
| In1 | 0.363 | 0.036 |
| Ex6 | 0.146 | 0.034 |
| Oligo | 0.207 | 0.057 |
| In7 | 0.079 | 0.083 |
| Ex1 | 0.122 | 0.144 |
| In2 | 0.058 | 0.179 |
| In3 | 0.047 | 0.208 |
| Astro | 0.071 | 0.259 |
| In8 | 0.055 | 0.299 |
| Ex7 | 0.044 | 0.336 |
| In5 | 0.037 | 0.388 |
| Ex4 | –0.020 | 0.776 |
| Ex5 | –0.055 | 0.924 |
| In4 | –0.056 | 0.949 |
| In6 | –0.099 | 0.949 |
| Ex2 | –0.102 | 0.967 |
| Ex3 | –0.289 | 0.999 |
Appendix 1—table 4
Virtual histology analysis - t-statistic (group comparison).
| Cell type | Zrsp | pFDR |
|---|---|---|
| Endo | 0.208 | 0.020 |
| Micro | 0.321 | 0.040 |
| Ex8 | 0.208 | 0.040 |
| Oligo | 0.233 | 0.055 |
| In1 | 0.432 | 0.108 |
| Ex6 | 0.145 | 0.123 |
| Ex1 | 0.156 | 0.229 |
| In3 | 0.058 | 0.233 |
| Astro | 0.120 | 0.233 |
| In7 | 0.059 | 0.233 |
| In2 | 0.063 | 0.233 |
| Ex7 | 0.089 | 0.263 |
| In5 | 0.063 | 0.300 |
| In8 | 0.066 | 0.317 |
| Ex4 | 0.015 | 0.585 |
| Ex5 | –0.007 | 0.690 |
| In6 | –0.078 | 0.861 |
| Ex2 | –0.070 | 0.861 |
| In4 | –0.087 | 0.901 |
| Ex3 | –0.341 | 0.997 |
Appendix 1—table 5
UK Biobank field IDs.
| Age | 21003 |
|---|---|
| Sex | 31 |
| Education | 6133* |
| Waist circumference | 48 |
| Hip circumference | 49 |
| Body mass index | 21001 |
| RRsystolic | 4080 |
| RRdiastolic | 4079 |
| HDL | 30760 |
| LDL | 30780 |
| Cholesterol | 30690 |
| Triglycerides | 30870 |
| HbA1c | 30750 |
| Blood glucose | 30740 |
| Medication for cholesterol, blood pressure, diabetes | 6153 |
| Fluid Intelligence | 20191 |
| Matrix Pattern Completion | 6373 |
| Numeric Memory Test | 20240 |
| Paired Associate Learning | 20197 |
| Prospective Memory | 20018 |
| Reaction Time | 20023 |
| Symbol Digit Substitution | 20159 |
| Tower Rearranging Test | 21004 |
| Trail Making Test A | 6348 |
| Trail Making Test B | 6350 |
-
Abbreviations: RR = blood pressure.
-
*
Converted to International Standard Classification of Education (ISCED) via the UKBB parser (https://github.com/USC-IGC/ukbb_parser; Zhu et al., 2019).
Appendix 1—table 6
Metabolic syndrome Criteria of the International Diabetes Federation (IDF) (Alberti et al., 2006).
| Metabolic syndrome = obesity + two further criteria | |
|---|---|
| Obesity | waist circumference ♀:≥80 cm; ♂:≥94 cm |
| Dyslipidemia (raised triglycerides) | ≥150 mg/dL (1.7 mmol/L) or lipid lowering medication |
| Dyslipidemia (reduced HDL cholesterol) | ♀:<50 mg/dL (1.29 mmol/L); ♂:<40 mg/dL (1.03 mmol/L) in males |
| Arterial hypertension (raised blood pressure) | systolic BP ≥130 or diastolic BP ≥85 mm Hg or antihypertensive medication or diagnosis of hypertension |
| Insuline resistance | Fasting plasma glucose ≥100 mg/dL (5.6 mmol/L) or antidiabetic therapy or diagnosis of diabetes mellitus type 2* |
-
*
Measurements of fasting plasma glucose were not available for the study sample. Consequently, the criterion of insulin resistance was only based on the diagnosis of diabetes mellitus and administration of antidiabetic therapy.
Appendix 2—table 1
Descriptive group statistics - UK Biobank.
| Metric* | Individuals with MetS | Matched controls | Puncorr | PFDR | Stat† |
|---|---|---|---|---|---|
| Age (years) | 64.73±7.42 (6746) | 64.51±7.27 (6746) | 0.095 | 0.154 | –0.03 |
| Sex (% female) | 18.81 (6746) | 18.81 (6746) | >0.99 | >0.99 | 0 |
| Education (ISCED) | 2.63±0.73 (6746) | 2.67±0.71 (6746) | 0.036 | 0.069 | 0.04 |
| Metabolic syndrome criteria | |||||
| Waist circumference (cm) | 97.39±10.21 (6726) | 88.22±10.59 (6595) | <0.001 | <0.001 ‡ | –0.88 |
| RRsystolic (mmHg) | 146.41±15.38 (6213) | 135.57±17.71 (5397) | <0.001 | <0.001 ‡ | –0.66 |
| RRdiastolic (mmHg) | 82.26±9.39 (6214) | 77.58±9.79 (5397) | <0.001 | <0.001 ‡ | –0.49 |
| Antihypertensive therapy (%) | 9.96 (6746) | 9.68 (6746) | <0.001 | <0.001 ‡ | 7.07 |
| HDL (mmol/L) | 1.18±0.26 (6225) | 1.49±0.32 (6332) | <0.001 | <0.001 ‡ | 1.08 |
| Triglycerides (mmol/L) | 2.43±1.13 (6617) | 1.30±0.59 (6543) | <0.001 | <0.001 ‡ | –1.25 |
| Lipid-lowering therapy (%) | 39.05 (6746) | 7.07 (6746) | <0.001 | <.001 ‡ | 2446.5 |
| Blood glucose (mmol/L) | 5.18±1.41 (6219) | 4.92±0.68 (6325) | <0.001 | <.001 ‡ | –0.23 |
| Antidiabetic therapy (%) | 0.06 (6746) | 0.19 (6746) | 0.052 | 0.097 | 3.77 |
| Cognitive scores | |||||
| Fluid Intelligence | 6.66±2.10 (6221) | 6.82±2.09 (6241) | <0.001 | <0.001 ‡ | 0.08 |
| Matrix Pattern Completion | 8.02±2.13 (4283) | 8.14±2.06 (4355) | 0.055 | 0.096 | 0.06 |
| Numeric Memory Test | 6.64±1.61 (4419) | 6.84±1.53 (4505) | <0.001 | <0.001 ‡ | 0.12 |
| Paired Associate Learning | 6.45±2.60 (4337) | 6.73±2.61 (4392) | <0.001 | <0.001 ‡ | 0.10 |
| Prospective Memory | 1.05±0.40 (6362) | 1.06±0.39 (6349) | 0.221 | 0.339 | 0.02 |
| Reaction Time | 590.75±108.27 (6331) | 590.15±111.13 (6325) | 0.792 | 0.858 | –0.005 |
| Symbol Digit Substitution | 18.47±5.12 (4292) | 19.00±5.16 (4353) | <0.001 | <0.001 ‡ | 0.10 |
| Tower Rearranging Test | 10.00±3.28 (4255) | 10.08±3.20 (4325) | 0.747 | 0.845 | 0.02 |
| Trail Making Test A (sec) | 226.83±86.26 (4337) | 224.06±83.06 (4392) | 0.643 | 0.836 | –0.03 |
| Trail Making Test B (sec) | 561.81±271.39 (4337) | 553.62±282.55 (4392) | 0.611 | 0.756 | –0.03 |
| Imaging | |||||
| Mean cortical thickness (mm) | 2.392±0.09 (6746) | 2.397±0.09 (6746) | 0.035 | 0.071 | 0.05 |
-
Abbreviations: cm = centimeter, dL = deciliter, HDL = high-density lipoprotein, ISCED = International Standard Classification of Education, MetS = metabolic syndrome, mg = milligram, mm = millimeter, mmHg = millimeters of mercury, mmol/L = millimole perliter, PC = principal component, Puncor = uncorrected p-values, PFDR = false-discovery rate-corrected p-values, RR = Blood pressure, sec = seconds.
-
*
Presented as mean ± SD (N).
-
†
Presented as χ2 for categorical and Cohen’s d for continuous data.
-
‡
Denotes statistical significance at FDR-corrected p<0.001
Appendix 2—table 2
Descriptive group statistics Hamburg City Health Study (HCHS).
| Metric* | Individuals with MetS | Matched controls | Puncorr | PFDR | Stat |
|---|---|---|---|---|---|
| Age (years) | 65.77±7.40 (759) | 65.97±7.52 (759) | 0.613 | 0.647 | 0.03 |
| Sex (% female) | 33.47 | 36.50 | 0.236 | 0.281 | 1.4 |
| Education (ISCED) | 2.37±0.58 (759) | 2.42±0.60 (759) | 0.09 | 0.114 | 0.09 |
| Metabolic syndrome criteria | |||||
| Waist circumference (cm) | 103.38±11.23 (754) | 91.45±11.36 (747) | <0.001 | <0.001† | –1.06 |
| RRsystolic (mmHg) | 145.66±18.54 (740) | 140.17±21.10 (746) | <0.001 | <0.001† | –.28 |
| RRdiastolic (mmHg) | 83.75±10.11 (740) | 82.00±10.40 (746) | 0.001 | 0.002 | –.17 |
| Antihypertensive therapy (%) | 52.60% | 26.22% | <0.001 | <0.001† | 108.89 |
| HDL (mg/dL) | 54.60±16.13 (751) | 67.63±17.46 (759) | <0.001 | <0.001† | 0.78 |
| Triglycerides (mg/dL) | 161.53±92.61 (751) | 91.23±30.62 (759) | <0.001 | <0.001† | –1.02 |
| Lipid lowering therapy (%) | 40.85% | 7.64% | <0.001 | <0.001† | 225.29 |
| Blood glucose (mg/dL) | 107.47±28.59 (742) | 90.99±10.87 (753) | <0.001 | <0.001† | –0.76 |
| Antidiabetic therapy (%) | 14.42% | 1.45% | <0.001 | <0.001† | 85.47 |
| Cognitive scores | |||||
| Animal Naming Test | 23.71±6.46 (712) | 24.77±6.75 (711) | 0.005 | 0.009 | 0.16 |
| Clock Drawing Test | 6.36±1.17 (730) | 6.39±1.16 (733) | 0.774 | 0.774 | 0.02 |
| Trail Making Test A (sec) | 41.26±14.28 (685) | 40.42±14.54 (675) | 0.321 | 0.359 | –0.06 |
| Trail Making Test B (sec) | 93.74±37.30 (675) | 89.89±37.69 (671) | 0.086 | 0.114 | –0.10 |
| Multiple-Choice Vocabulary Intelligence Test | 31.18±3.43 (603) | 31.71±3.22 (619) | 0.019 | 0.034 | 0.16 |
| Word List Recall | 7.42±1.89 (691) | 7.64±1.84 (673) | 0.057 | 0.083 | 0.12 |
| Imaging | |||||
| Mean cortical thickness (mm) | 2.327±0.08 (759) | 2.334±0.08 (757) | 0.045 | 0.071 | 0.1 |
-
Abbreviations: cm = centimeter, dL = deciliter, HDL = high-density lipoprotein, ISCED = International Standard Classification of Education, MetS = metabolic syndrome, mg = milligram, mm = millimeter, mmHg = millimeters of mercury, Puncor = uncorrected p-values, PFDR = false-discovery rate-corrected p-values, RR = Blood pressure, sec = seconds.
-
*
Presented as mean ± SD (N).
-
†
Denotes statistical significance at FDR-corrected p<0.001.
Additional files
-
Supplementary file 1
Schaefer 400×7-parcellated maps of metabolic syndrome (MetS)-related brain morphological abnormalities (bootstrap ratio from PLS, t-statistic from group comparison).
- https://cdn.elifesciences.org/articles/93246/elife-93246-supp1-v1.csv
-
Supplementary file 2
Schaefer 100×7-parcellated bootstrap ratio map.
- https://cdn.elifesciences.org/articles/93246/elife-93246-supp2-v1.csv
-
Supplementary file 3
t-statistic from group comparison on fsLR.
- https://cdn.elifesciences.org/articles/93246/elife-93246-supp3-v1.csv
-
MDAR checklist
- https://cdn.elifesciences.org/articles/93246/elife-93246-mdarchecklist1-v1.pdf
Download links
A two-part list of links to download the article, or parts of the article, in various formats.
Downloads (link to download the article as PDF)
Open citations (links to open the citations from this article in various online reference manager services)
Cite this article (links to download the citations from this article in formats compatible with various reference manager tools)
A latent clinical-anatomical dimension relating metabolic syndrome to brain structure and cognition
eLife 12:RP93246.
https://doi.org/10.7554/eLife.93246.3


