Maternal smoking DNA methylation risk score associated with health outcomes in offspring of European and South Asian ancestry
- Department of Medicine, Faculty of Health Sciences, McMaster University, Canada
- Peter Boris Centre for Addictions Research, St. Joseph’s Healthcare Hamilton, Canada
- Department of Psychiatry and Behavioural Neurosciences, McMaster University, Canada
- Population Health Research Institute, David Braley Cardiac, Vascular and Stroke Research Institute, Canada
- Department of Health Research Methods, Evidence, and Impact, McMaster University, Canada
- Department of Pediatrics, McMaster University, Canada
- Department of Pediatrics, University of Toronto, Canada
- Department of Pediatrics, BC Children’s Hospital, The University of British Columbia, Canada
- Program in Translational Medicine, SickKids Research Institute, Canada
- Department of Pediatrics, University of Alberta, Canada
- Children’s Hospital Research Institute of Manitoba, Department of Pediatrics and Child Health, University of Manitoba, Canada
- Section of Allergy and Immunology, Department of Pediatrics and Child Health, University of Manitoba, Canada
- Thrombosis and Atherosclerosis Research Institute, David Braley Cardiac, Vascular and Stroke Research Institute, Canada
- Department of Pathology and Molecular Medicine, McMaster University, Michael G. DeGroote School of Medicine, Canada
Figures
Figure 1
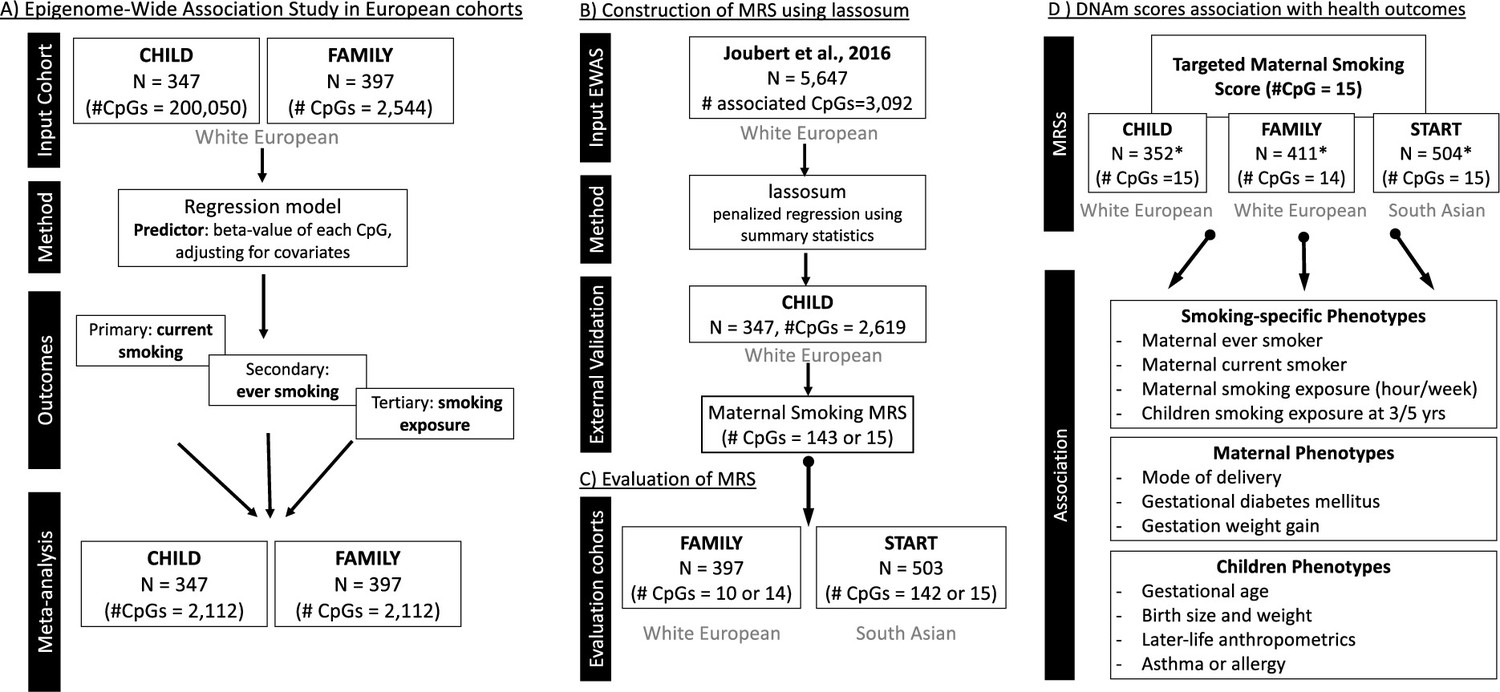
Schematic overview of the analytical pipeline for the cord blood DNA methylation (DNAm) maternal smoking score and association study.
(A) shows the epigenome-wide association studies conducted in the European cohorts (CHILD and FAMILY); (B) illustrates the workflow for methylation risk score (MRS) construction using an external epigenome-wide association studies (EWAS) (Joubert et al., 2016) as the discovery sample and The Canadian Healthy Infant Longitudinal Development (CHILD) study as the external validation study, while (C) demonstrates the evaluation of the MRS in two independent cohorts of White European (i.e. FAMILY) and South Asian (i.e. START). The validated MRS was then tested for association with smoking-specific, maternal, and children phenotypes in CHILD, FAMILY, and START, as shown in (D). *indicates cohort sample size including those with missing smoking history.
Figure 2 with 8 supplements
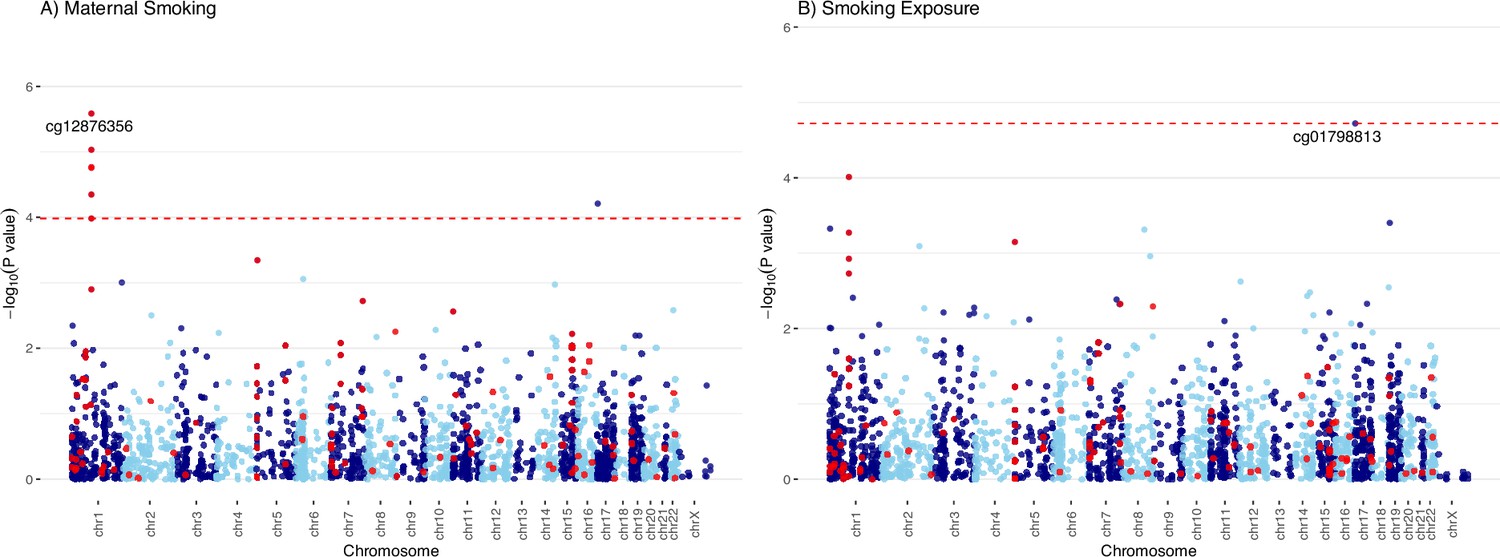
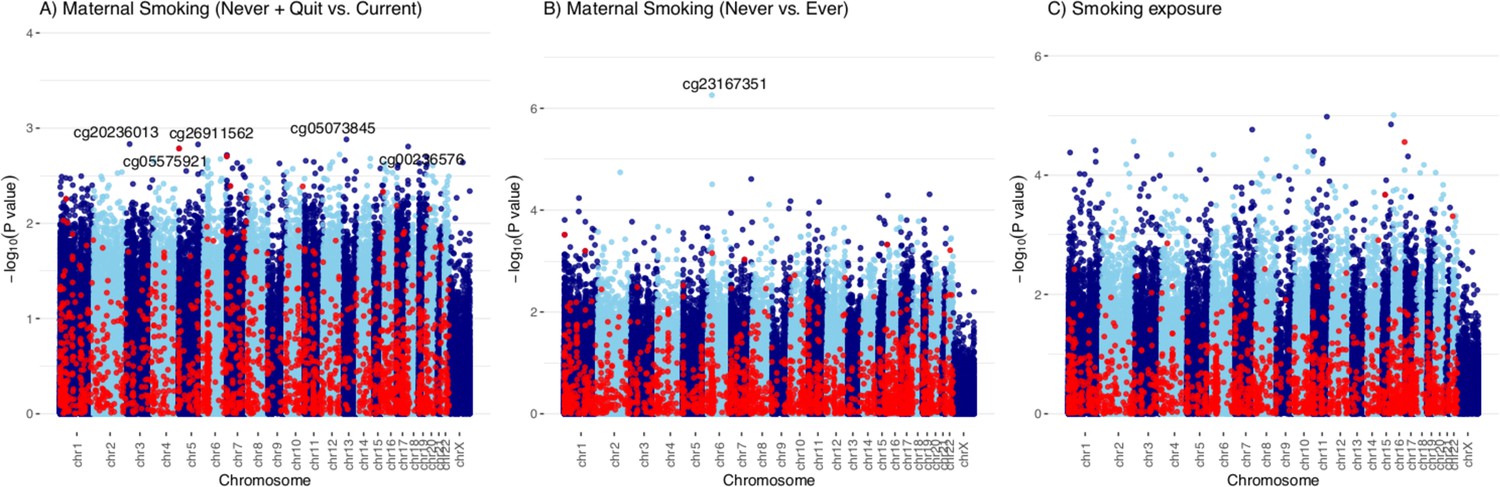
Manhattan plots of the meta-analyzed association between cord blood DNA methylation (DNAm) and maternal smoking in Europeans.
Manhattan plots summarized the meta-analyzed association p-values between cord blood DNA methylation levels and current maternal smoking (A; n = 744) or smoking exposure (B ; n = 735) at a common set of 2114 cytosine–phosphate–guanine (CpG) sites. The red line denotes the smallest -log10(p-value) that is below the false discovery rate (FDR) correction threshold of 0.05. The red dots represent established associations with maternal smoking reported by Joubert and colleagues (Joubert et al., 2016).
-
Figure 2—source data 1
Histogram of the smoking exposure across the three cohorts.
- https://cdn.elifesciences.org/articles/93260/elife-93260-fig2-data1-v1.pdf
Figure 2—figure supplement 1

Manhattan plots of the meta-analyzed association between cord blood DNA methylation and ever maternal smoking in the combined European cohorts.
The meta-analyzed association p-values for ever maternal smoking (n = 744) and methylation levels at 2114 cytosine–phosphate–guanine (CpG) sites were summarized in the Manhattan plot. Ever maternal smoking was defined to compare those who were currently smoking or quitted before or during this pregnancy vs. those never smoked. The red line denotes the smallest -log10(p-value) that is below the false discovery rate (FDR) correction threshold of 0.05. The red dots represent established associations with maternal smoking reported in Joubert and colleagues (Joubert et al., 2016).
Figure 2—figure supplement 2
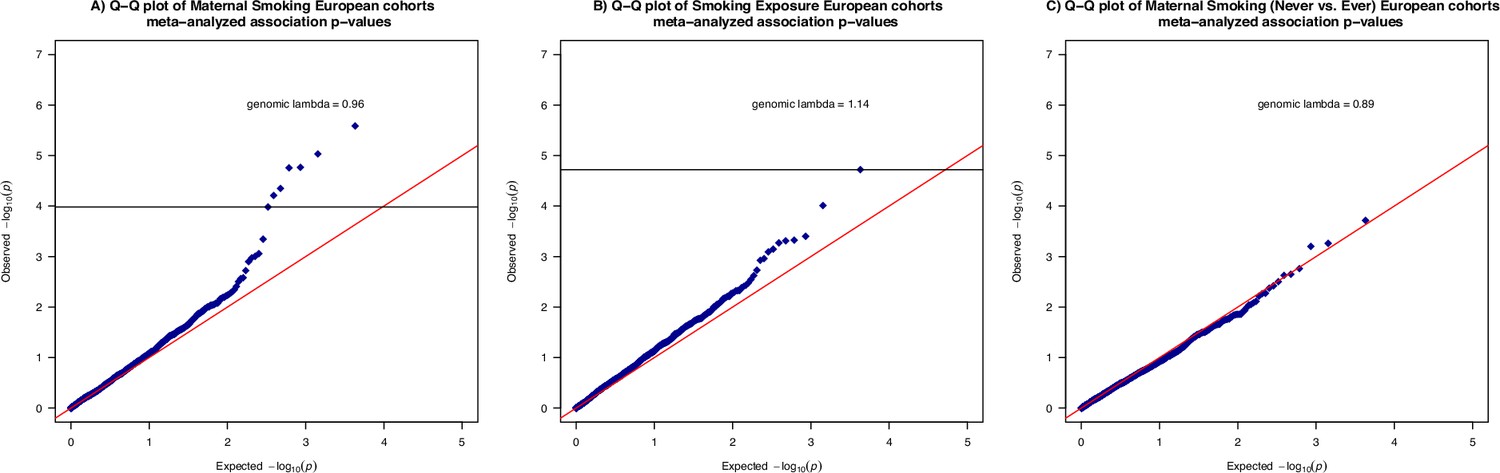
Quantile-quantile plots of the meta-analyzed association between cord blood DNA methylation and maternal smoking history, smoking exposure in the combined European cohorts.
Quantile-quantile plots summarized the association p-values between cord blood DNA methylation levels and current maternal smoking (A; n = 744) or ever maternal smoking (B; n = 744) or weekly smoking exposure (C; n = 735) at 2114 cytosine–phosphate–guanine (CpG) sites. The red line (y=x) is the line of reference and the genomic inflation factor, calculated as the ratio between the observed median and the theoretical median of the association test statistics, was annotated for each outcome. The horizontal lines (in A and B only) correspond to the smallest -log10(p-value) that is below the false discovery rate (FDR) correction threshold of 0.05.
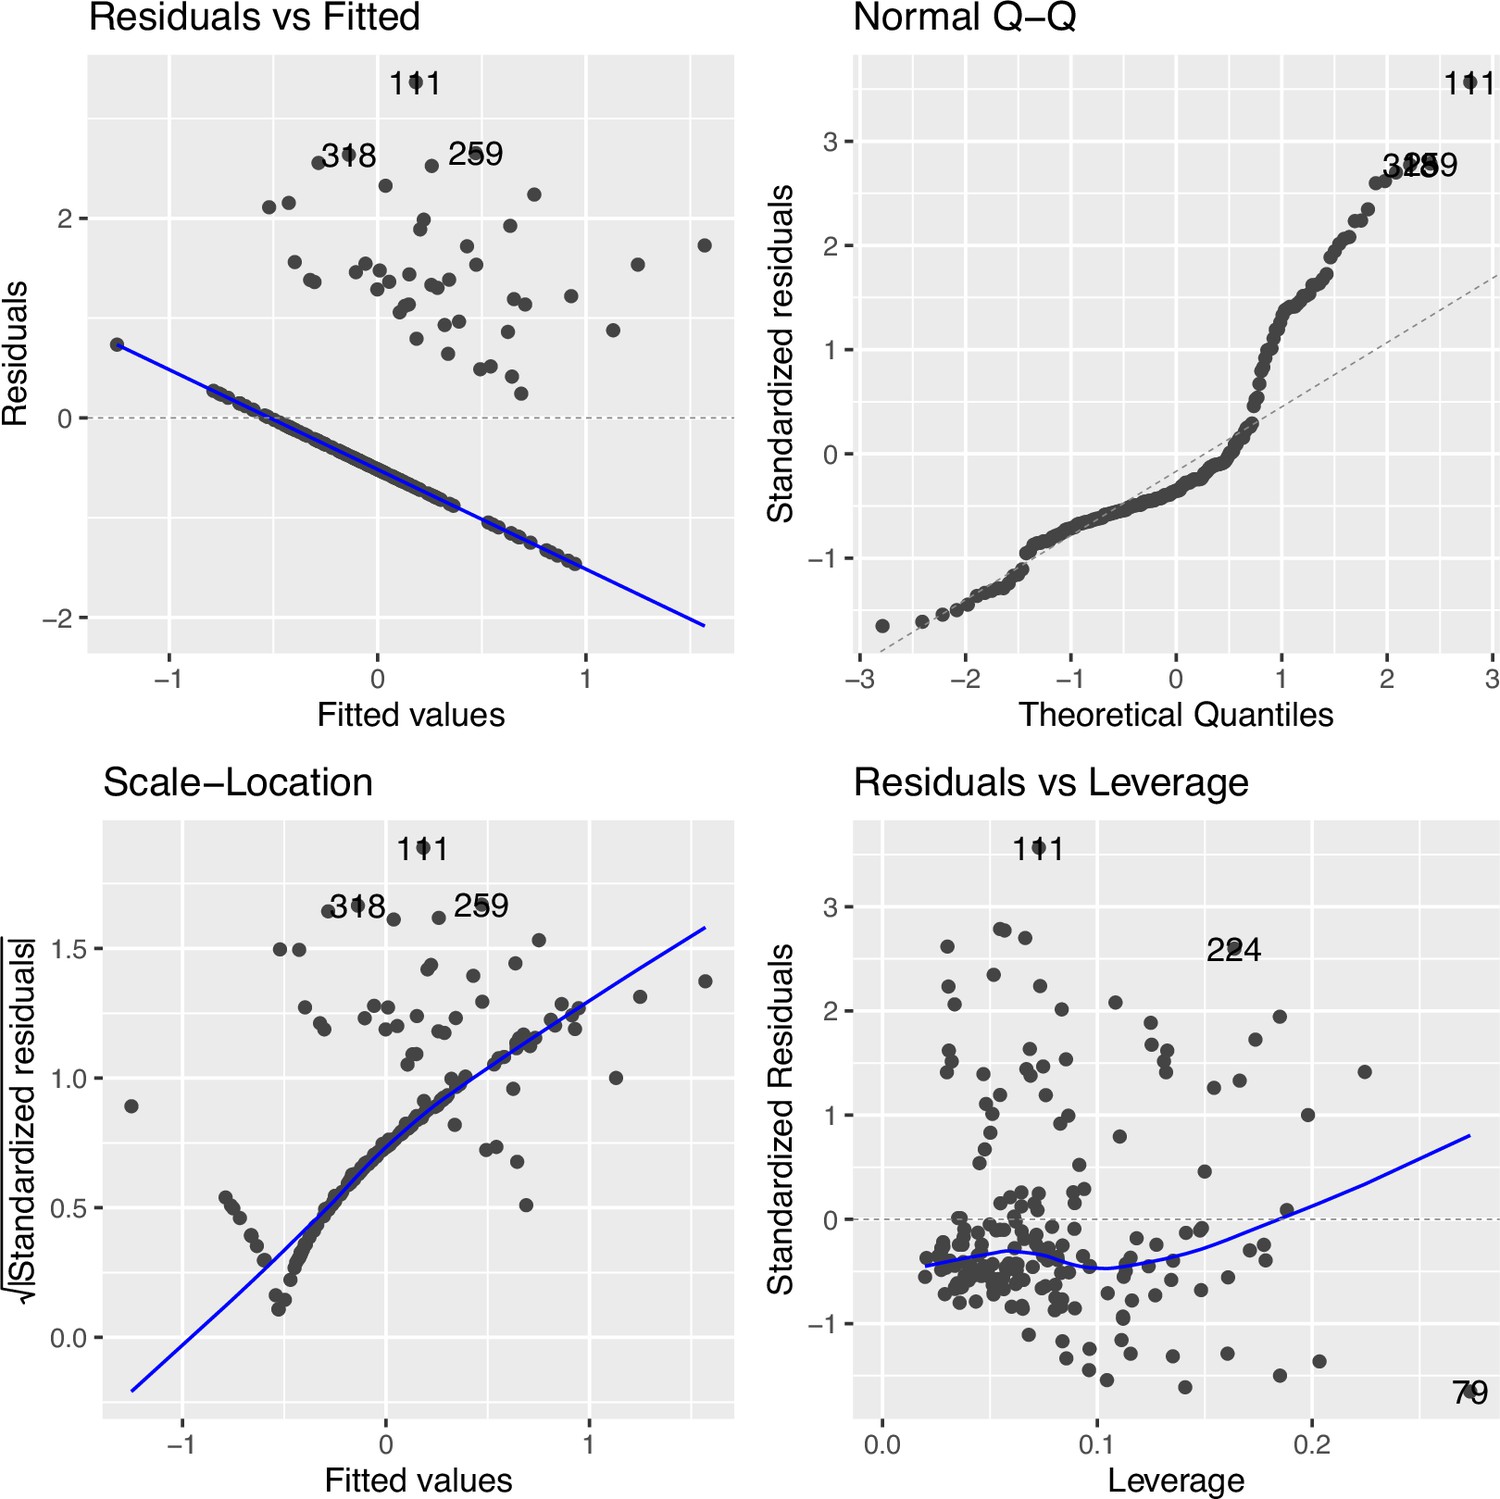
Figure 2—figure supplement 3
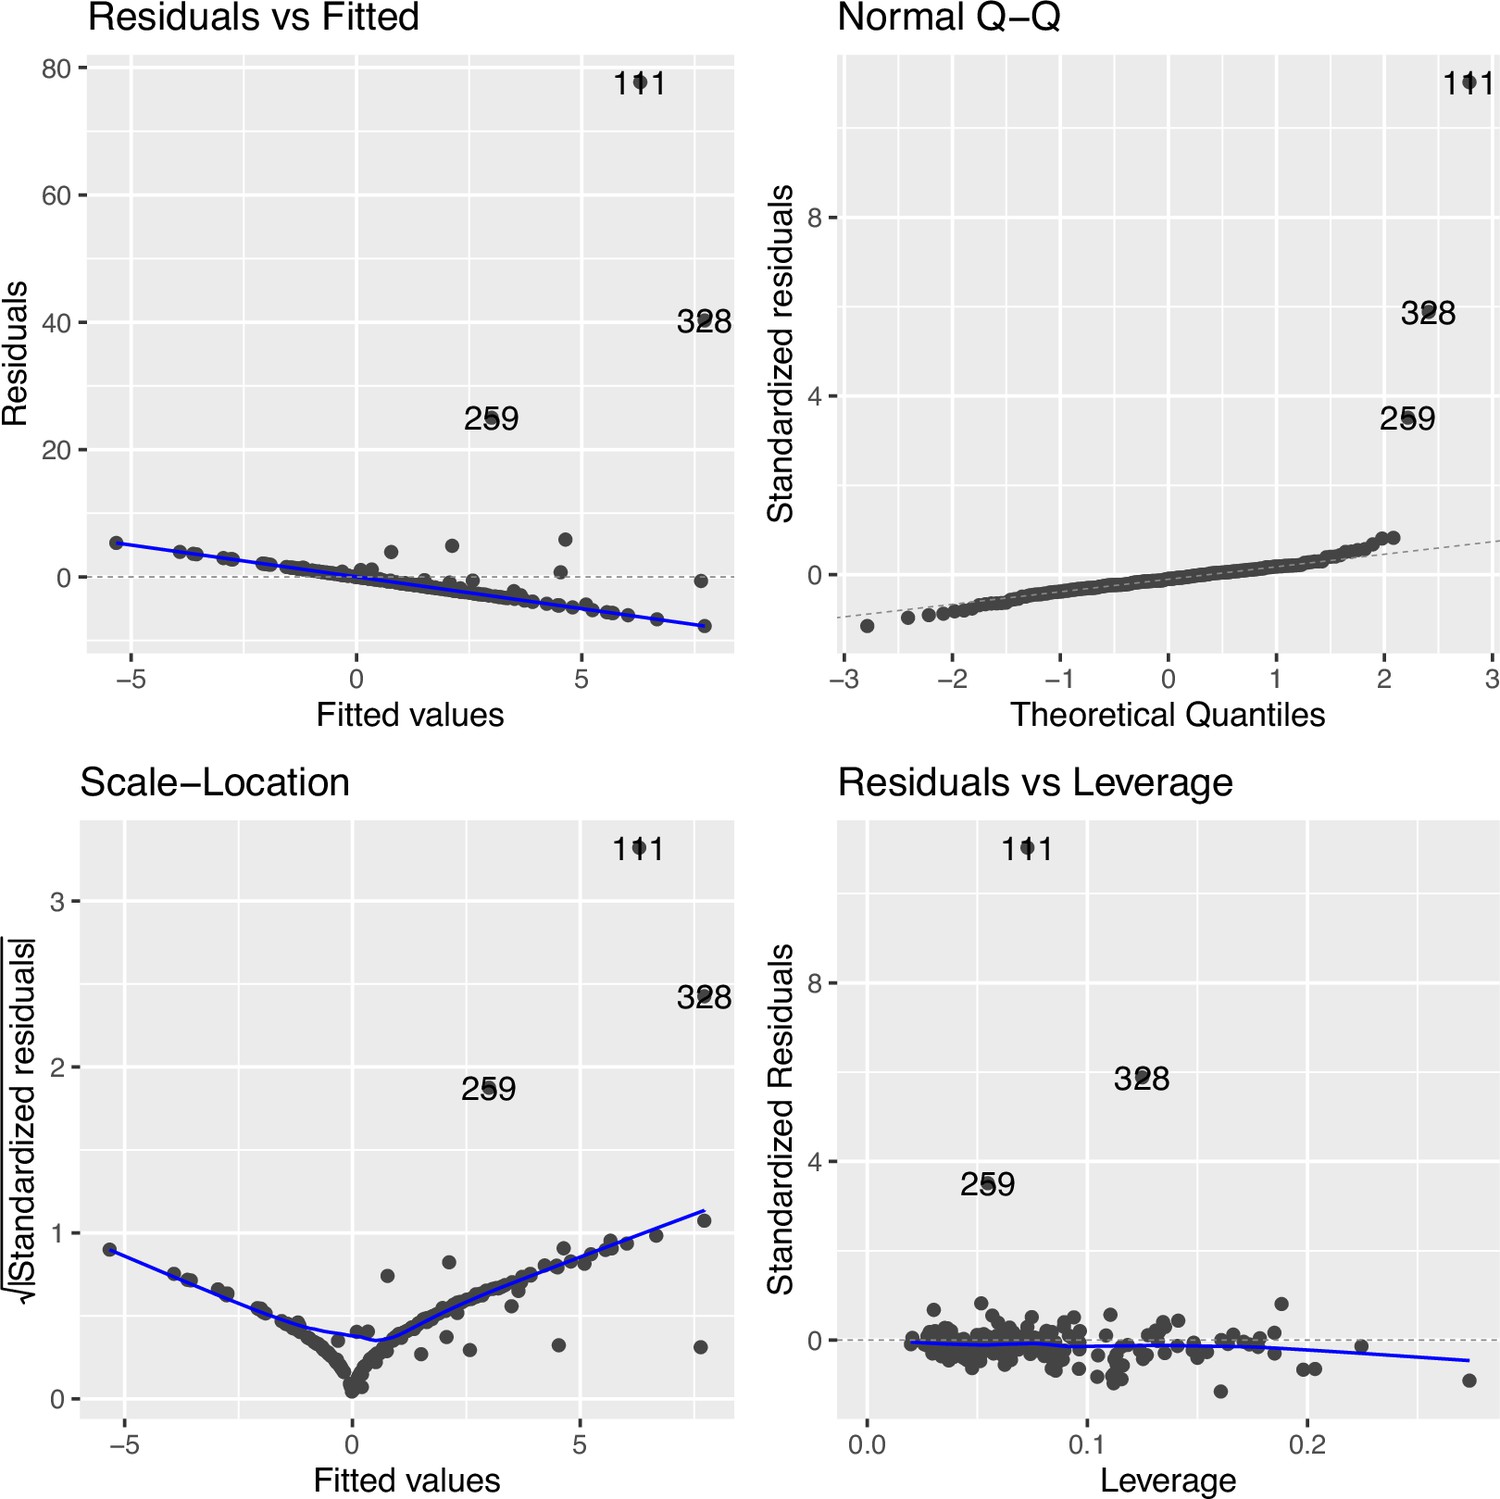
Regression diagnostic for association between the top cytosine–phosphate–guanine (CpG) (cg09935388) and smoking exposure (n=339) without data transformation in The Canadian Healthy Infant Longitudinal Development (CHILD).
The Residuals vs. Fitted plot shows the residuals on the y-axis and the fitted values on the x-axis, indicating departure from linearity (measured by distance from the blue line to each point) was quite severe. The Q-Q plot compares the standardized residuals with the theoretical quantiles from a standard normal distribution, showing non-normality was largely driven by the three extreme points. The Scale-Location plot shows the square root of the standardized residuals vs. the fitted values. There were also considerable variance heteroskedasticity as shown in the scale and location diagnostic plot. The Residuals vs. Leverage compares the residuals against the leverage of each observation, showing the main outlying points corresponded to the tail of the smoking exposure phenotype >25 hr/week.
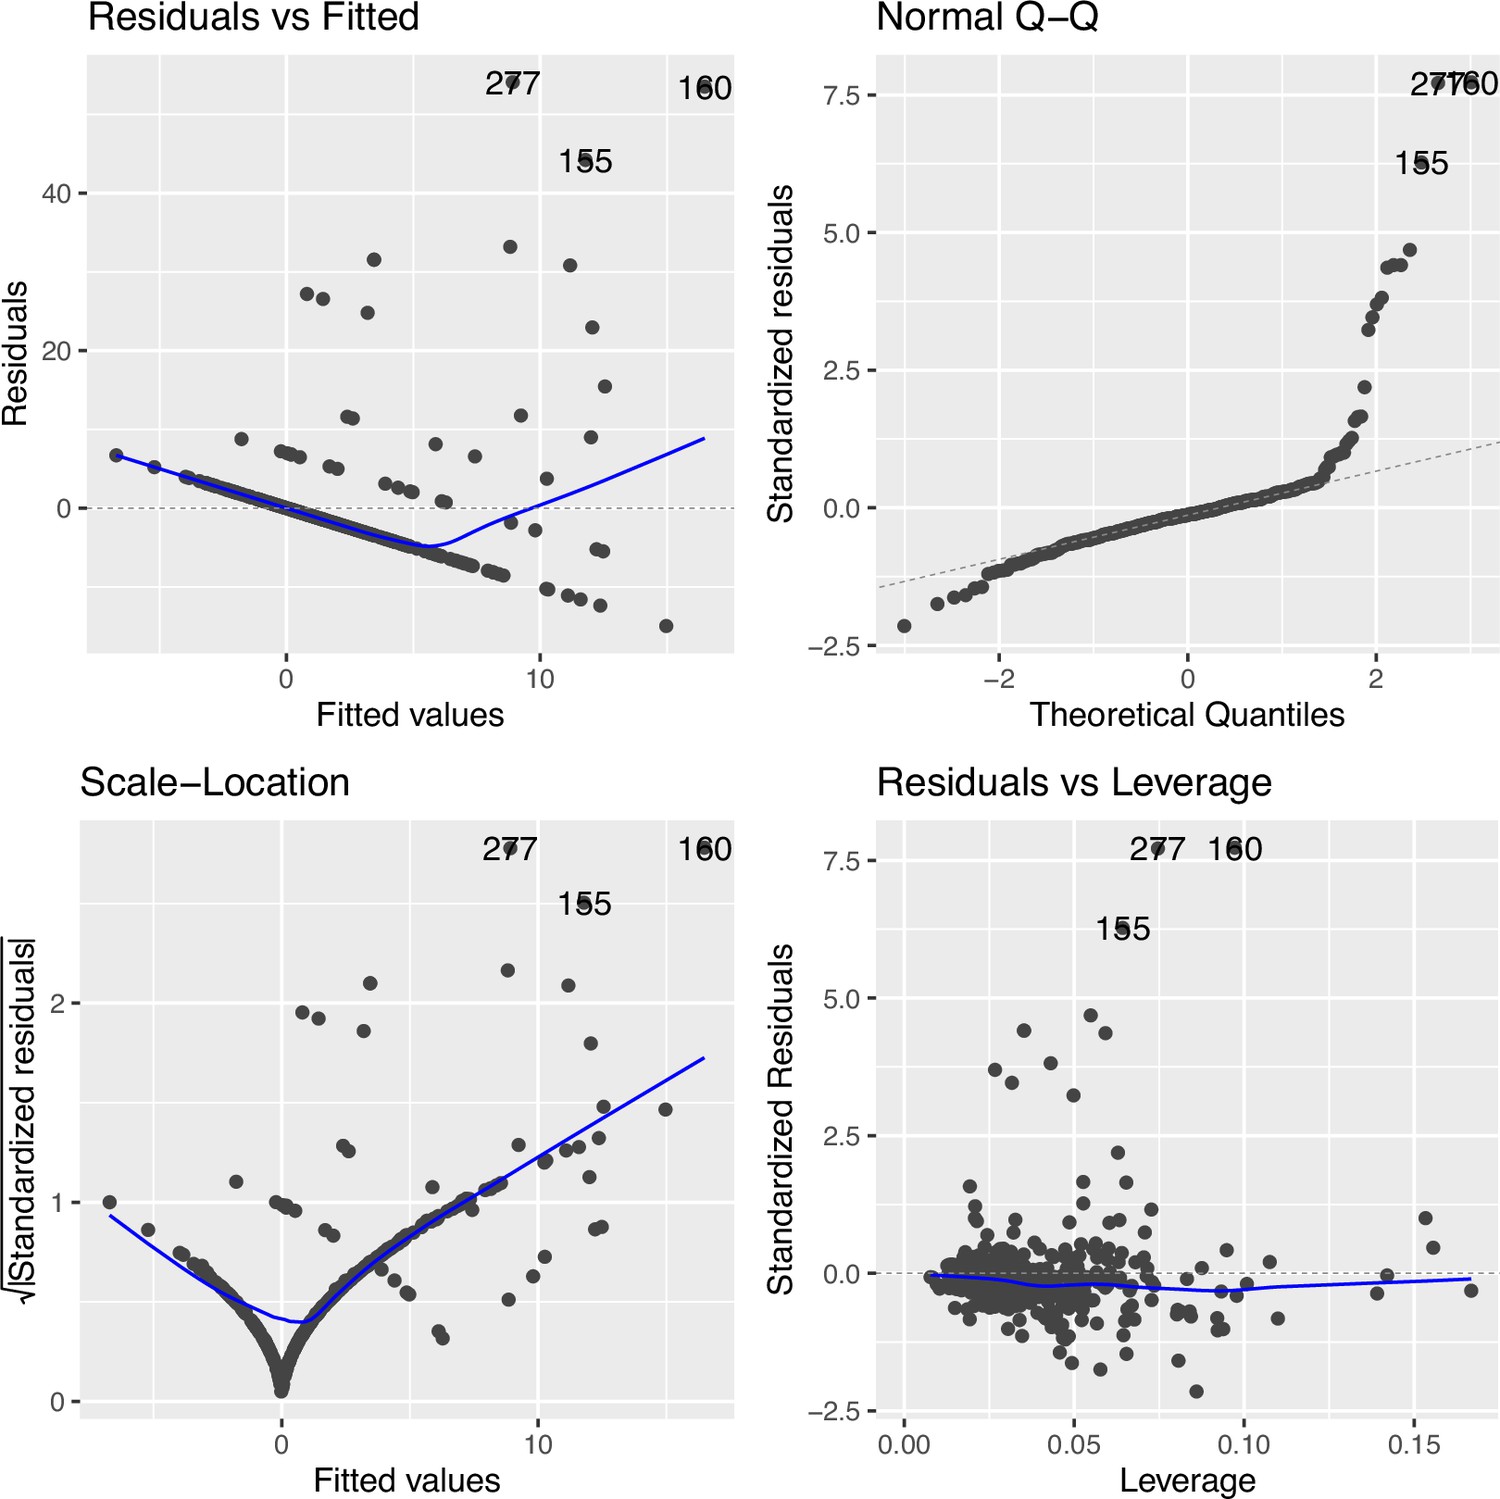
Figure 2—figure supplement 4
Regression diagnostic for association between the top cytosine–phosphate–guanine (CpG) (cg09935388) and smoking exposure (n=396) without data transformation in Family Atherosclerosis Monitoring In early life (FAMILY).
The Residuals vs. Fitted plot shows the residuals on the y-axis and the fitted values on the x-axis, indicating departure from linearity (measured by distance from the blue line to each point) was severe. The Q-Q plot compares the standardized residuals with the theoretical quantiles from a standard normal distribution, showing a large number of data points driving the departure from non-normality. The Scale-Location plot shows the square root of the standardized residuals vs. the fitted values, which suggests considerable variance heteroskedasticity. The Residuals vs. Leverage compares the residuals against the leverage of each observation, showing varying level of leverage points.
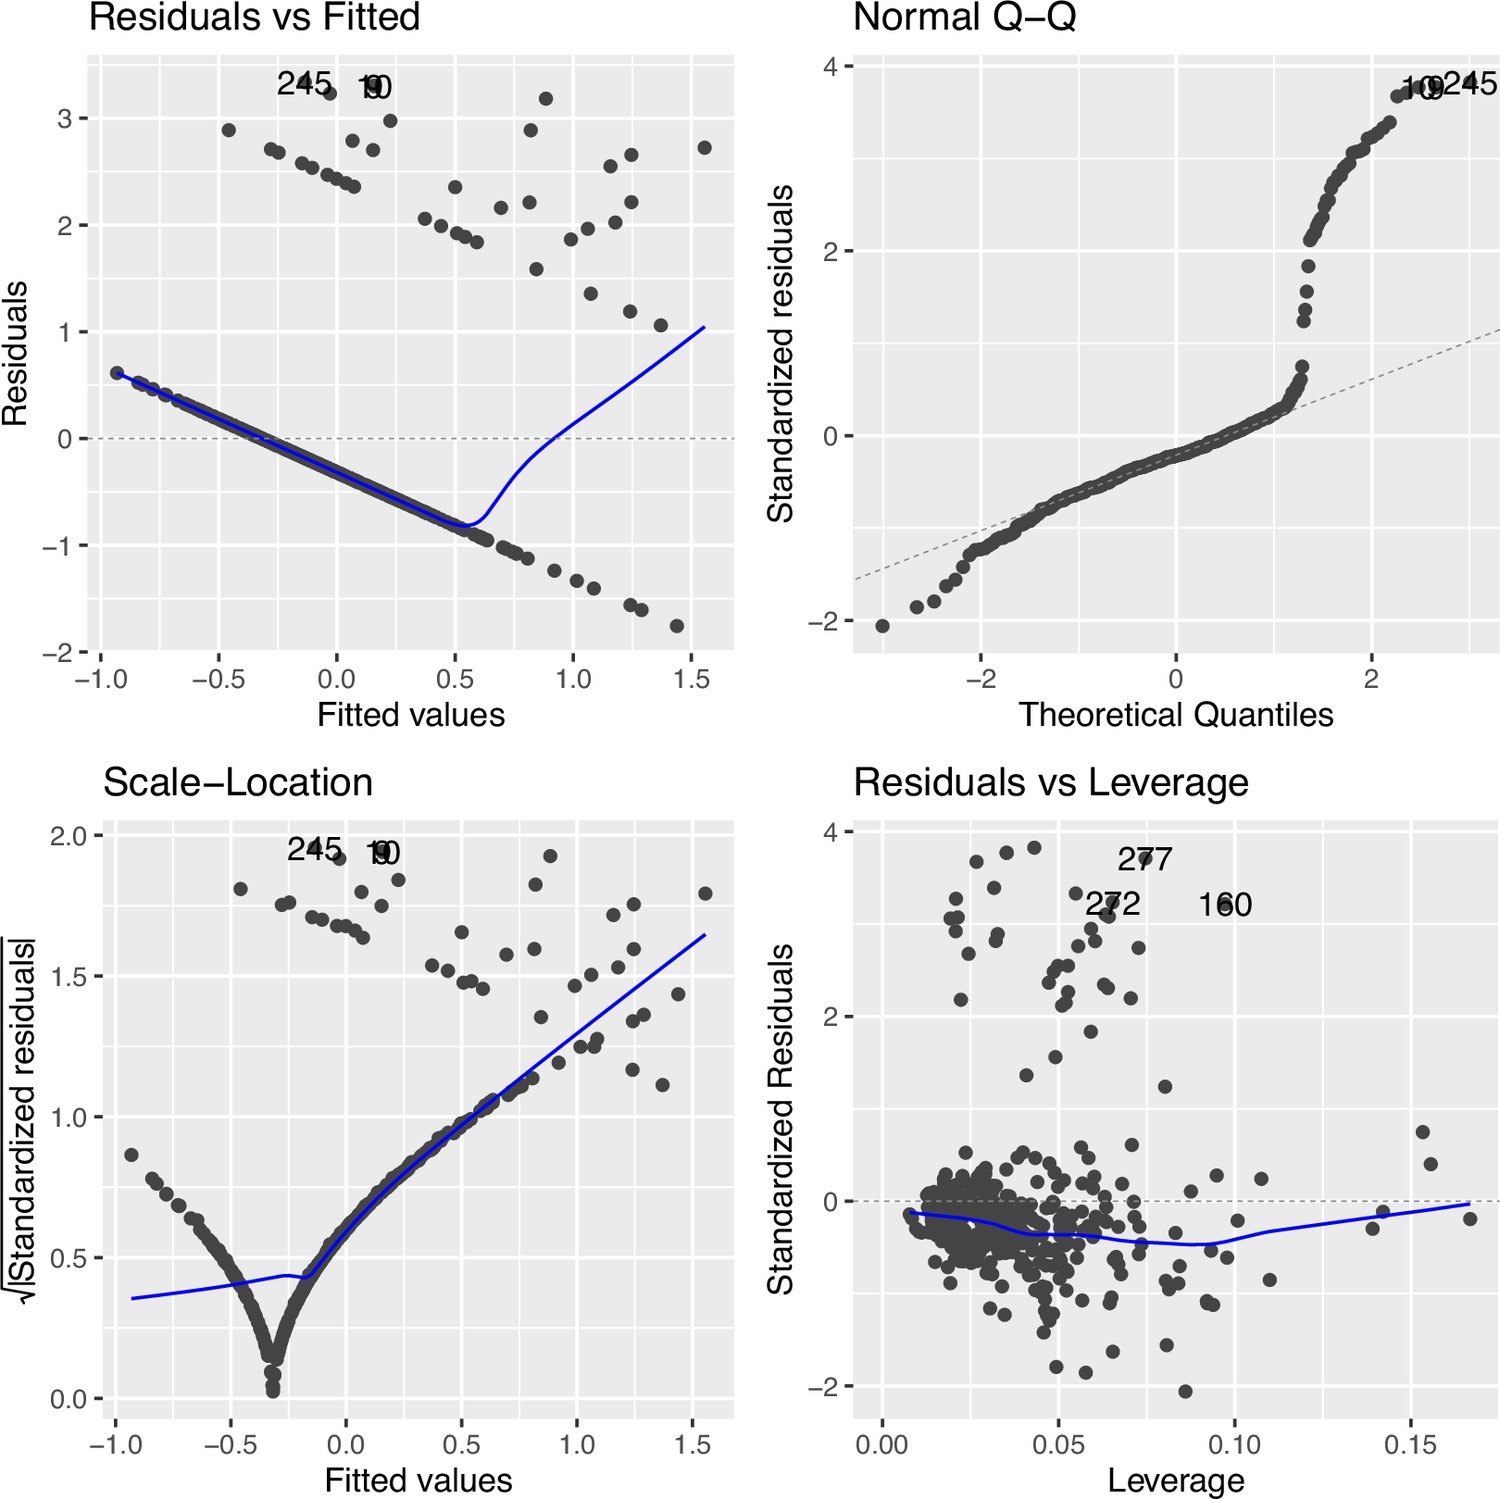
Figure 2—figure supplement 5
Regression diagnostic for association between the top cytosine–phosphate–guanine (CpG) (cg09935388) and smoking exposure (n=339) under an inverse normal rank transformation in Canadian Healthy Infant Longitudinal Development (CHILD).
The Residuals vs. Fitted plot shows the residuals on the y-axis and the fitted values on the x-axis, indicating some level of departure from linearity (measured by distance from the blue line to each point), which was improved as compared to Figure 2—figure supplement 3. The Q-Q plot compares the standardized residuals with the theoretical quantiles from a standard normal distribution, some departure from non-normality. The Scale-Location plot shows the square root of the standardized residuals vs. the fitted values, which suggests some variance heteroskedasticity still remained. The Residuals vs. Leverage compares the residuals against the leverage of each observation, suggesting influential observations remained but with reduced influence on the model.
Figure 2—figure supplement 6
Regression diagnostic for association between the top cytosine–phosphate–guanine (CpG) (cg09935388) and smoking exposure (n=396) under an inverse rank transformation in Family Atherosclerosis Monitoring In early life (FAMILY).
The Residuals vs. Fitted plot shows the residuals on the y-axis and the fitted values on the x-axis, indicating some level of departure from linearity (measured by distance from the blue line to each point), which was improved as compared to Figure 2—figure supplement 4. The Q-Q plot compares the standardized residuals with the theoretical quantiles from a standard normal distribution, some departure from non-normality. The Scale-Location plot shows the square root of the standardized residuals vs. the fitted values, which suggests some variance heteroskedasticity still remained. The Residuals vs. Leverage compares the residuals against the leverage of each observation, suggesting influential observations remained but with reduced influence on the model.
Figure 2—figure supplement 7
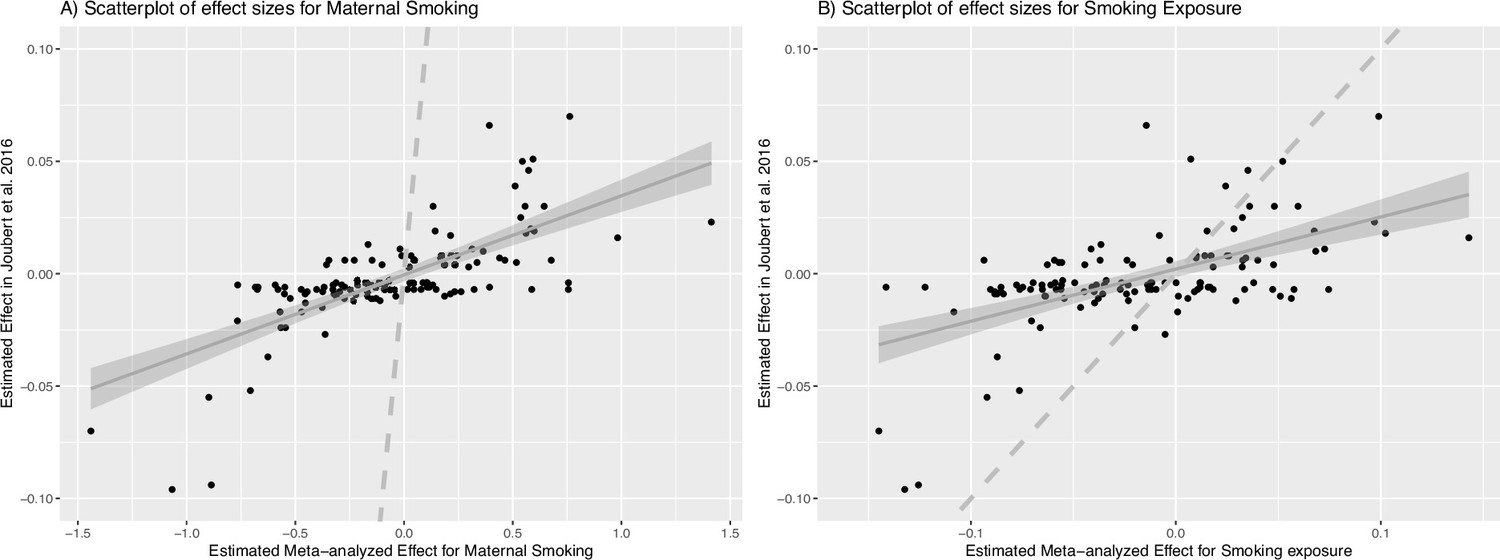
Scatterplots of meta-analyzed association effects for maternal smoking history or smoking exposure and reported effects of maternal smoking.
(A) shows the scatterplot of meta-analyzed effects for maternal smoking (n=744) in the combined Canadian Healthy Infant Longitudinal Development (CHILD) and Family Atherosclerosis Monitoring In early life (FAMILY) cohorts (x-axis) vs. reported effects for maternal smoking in Joubert et al., 2016 (y-axis) for all cytosine–phosphate–guanines (CpGs) present in CHILD, FAMILY, and Joubert et al., 2016 (# CpGs = 128); (B) is the scatterplot of meta-analyzed effects for weekly smoking exposure (n=735) in the combined CHILD and FAMILY cohorts (x-axis) vs. reported effects for maternal smoking in Joubert et al., 2016 (y-axis) for all CpGs present in CHILD, FAMILY, and Joubert et al., 2016 (# CpGs = 128). The solid gray line is the best fitted line using the ordinary least square method (95% confidence interval shown as the shaded area) for the linear relationship between the effect sizes and the dashed gray line represents the reference of y=x.
Figure 2—figure supplement 8
Manhattan plots of the Epigenome-wide associations between cord blood DNA methylation (DNAm) and maternal smoking history, smoking exposure in Canadian Healthy Infant Longitudinal Development (CHILD).
Manhattan plots summarized the association p-values between cord blood DNA methylation levels and current maternal smoking (A; n=347) or ever maternal smoking (B; n=347) or weekly smoking exposure (C; n=339) at 200,050 cytosine–phosphate–guanine (CpG) sites. The red line denotes the smallest -log10(p-value) that is below the false discovery rate (FDR) correction threshold of 0.05. The red dots represent established associations with maternal smoking reported in Joubert and colleagues (Joubert et al., 2016).
Figure 3 with 3 supplements
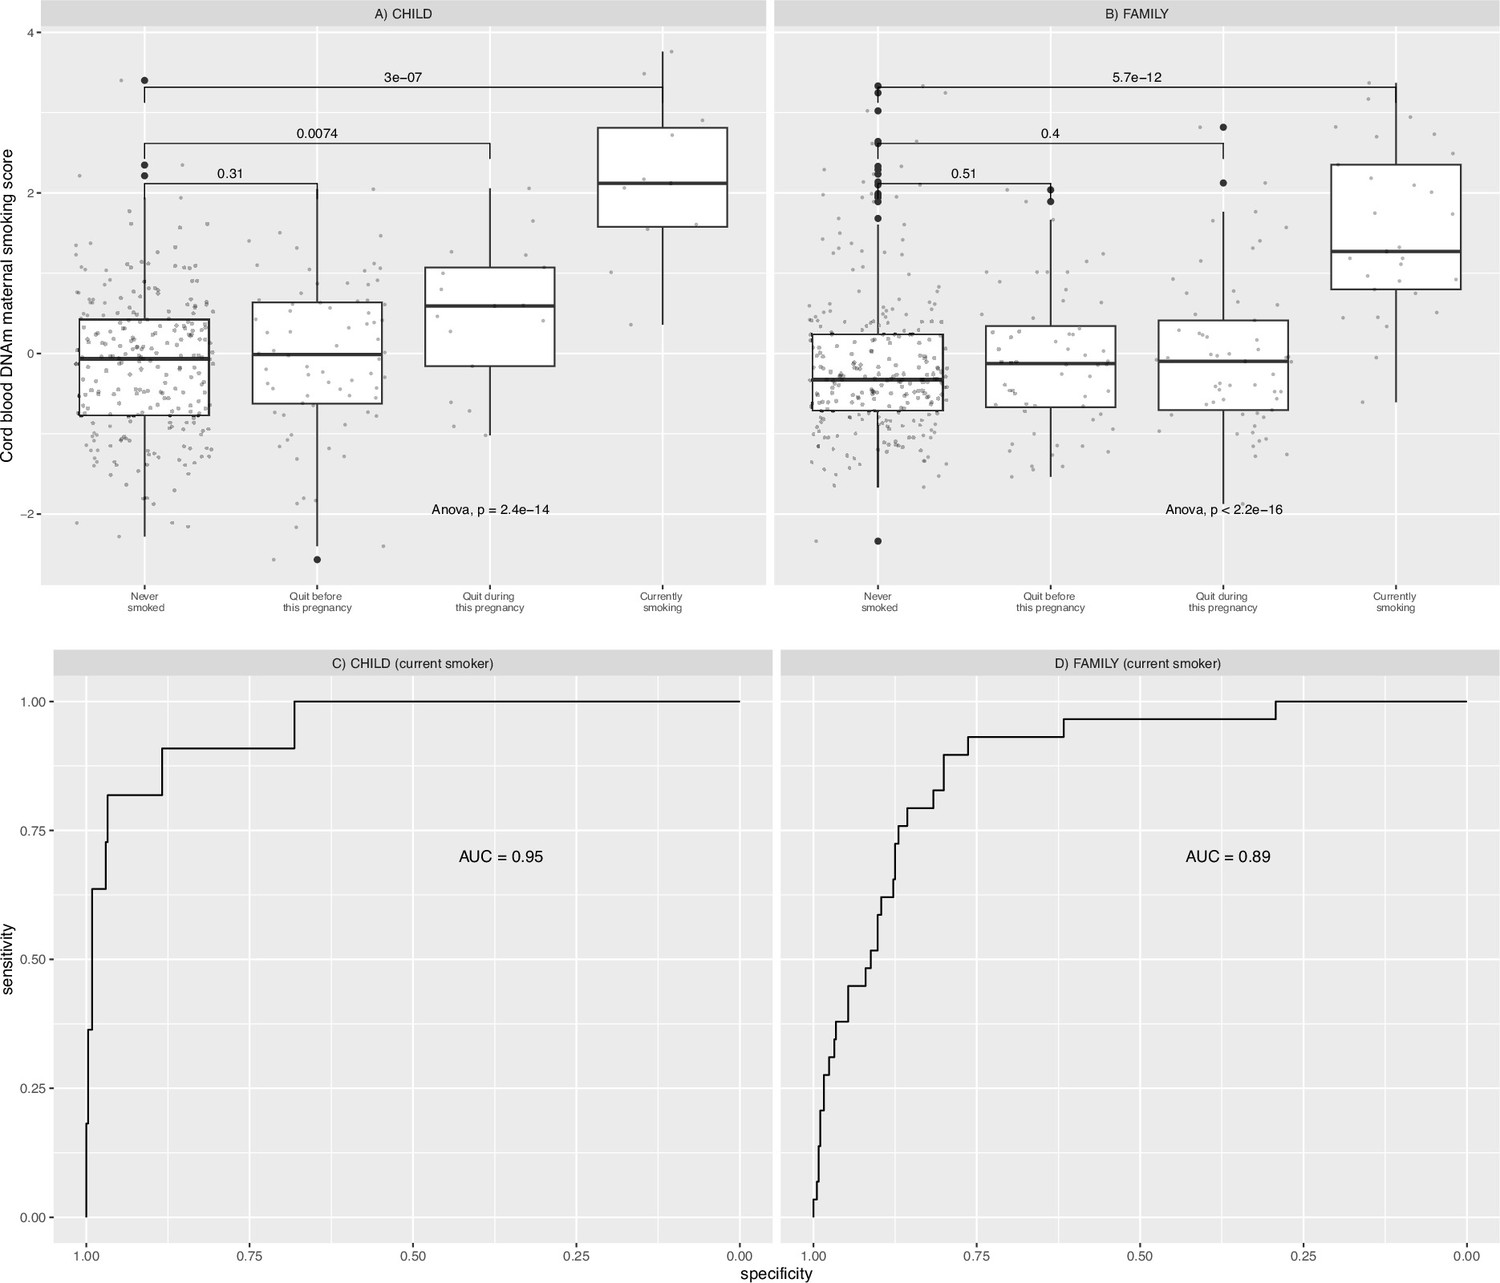
Relationships between maternal smoking methylation risk score (MRS) and maternal smoking history categories for Canadian Healthy Infant Longitudinal Development (CHILD) and Family Atherosclerosis Monitoring In early life (FAMILY).
Maternal smoking methylation score (y-axis) was shown as a function of maternal smoking history (x-axis) in levels of severity for prenatal exposure for CHILD (A; n=347), and FAMILY (B; n=397). Each severity level was compared to the never-smoking group and the corresponding two-sample t-test p-value was reported. The analysis of variance via an F-test p-value was used to indicate whether a mean difference in methylation score was present among all smoking history categories. The area under the receiver operating characteristic curve (AUC) for each study was shown in the lower panel.
Figure 3—figure supplement 1
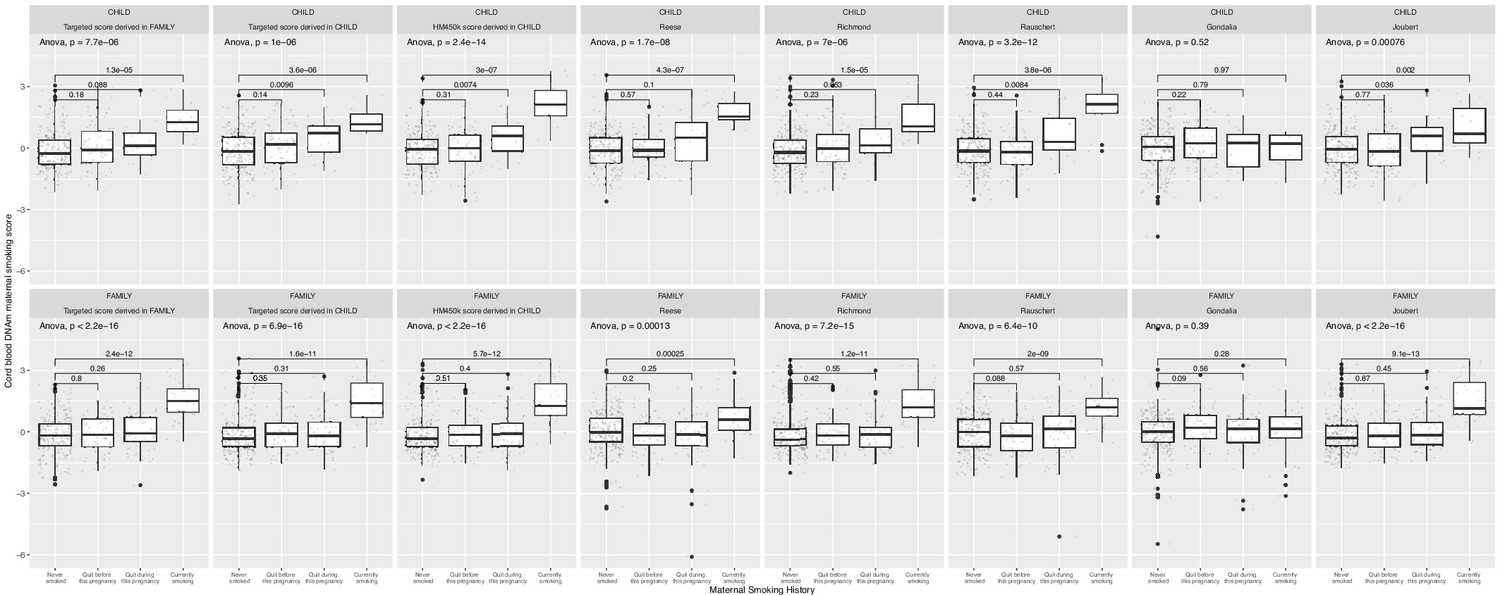
A comparison of results for derived and external maternal smoking methylation risk scores (MRSs).
Maternal smoking methylation score (y-axis) was shown as a function of maternal smoking history (x-axis) in levels of severity ([0]=never smoked; [1]=quit before this pregnancy; [2]=quit during this pregnancy; [3]=currently smoking) for prenatal exposure for each study. The scores shown were validated in (1) Canadian Healthy Infant Longitudinal Development (CHILD; n=347), (2) CHILD but restricted to cytosine–phosphate–guanines (CpGs) that were also present on the targeted array, (3) Family Atherosclerosis Monitoring In early life (FAMILY; n=397) using CpGs on the targeted array. Each severity level was compared to the never smoking group and the corresponding two sample t-test p-value was reported. An omnibus test p-value to test whether a mean difference in methylation score was present among all smoking history categories.
Figure 3—figure supplement 2
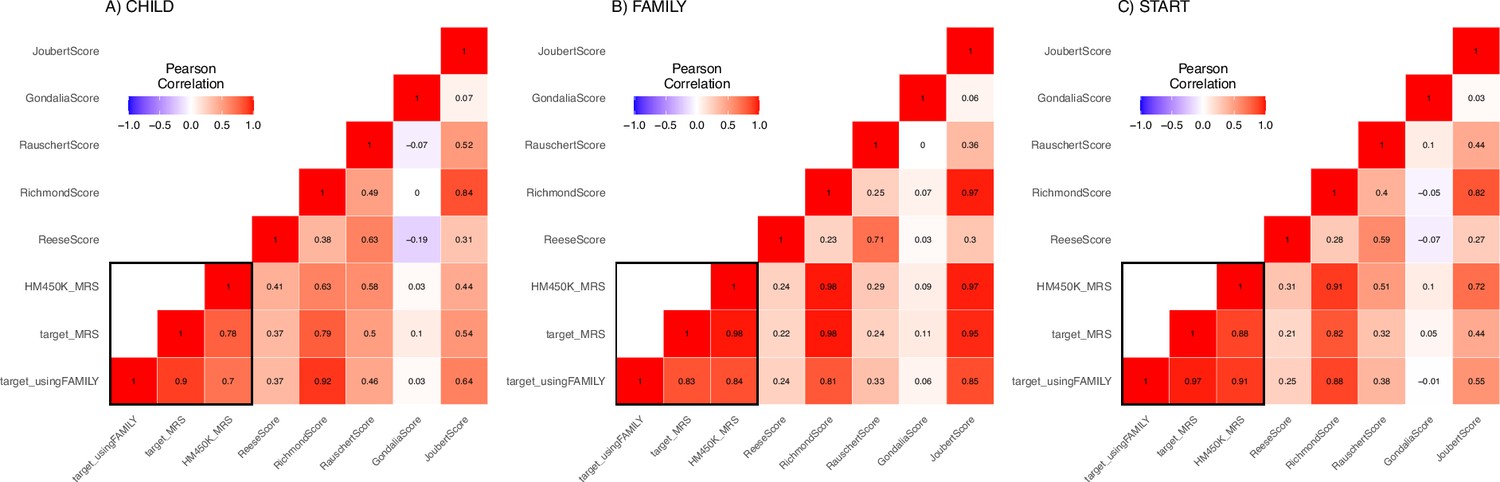
A heatmap of correlation between derived and external maternal smoking methylation risk score (MRSs).
This heatmap illustrates the pairwise correlation between MRSs calculated in (A) CHILD (n=352), (B) FAMILY (n=411), and (C) START (n=504). Each cell represents the correlation coefficient, ranging from –1–1, indicating the strength and direction of the association. A value of 1 signifies a perfect positive correlation, while –1 indicates a perfect negative correlation. Values closer to 0 suggest no correlation. The color gradient from deep blue (strong negative correlation), through white (no correlation), to deep red (strong positive correlation), visually encodes the strength of these relationships. The scores in the black box were derived using lassosum and internally validated. Note that these sample size included those with missing smoking history.
Figure 3—figure supplement 3
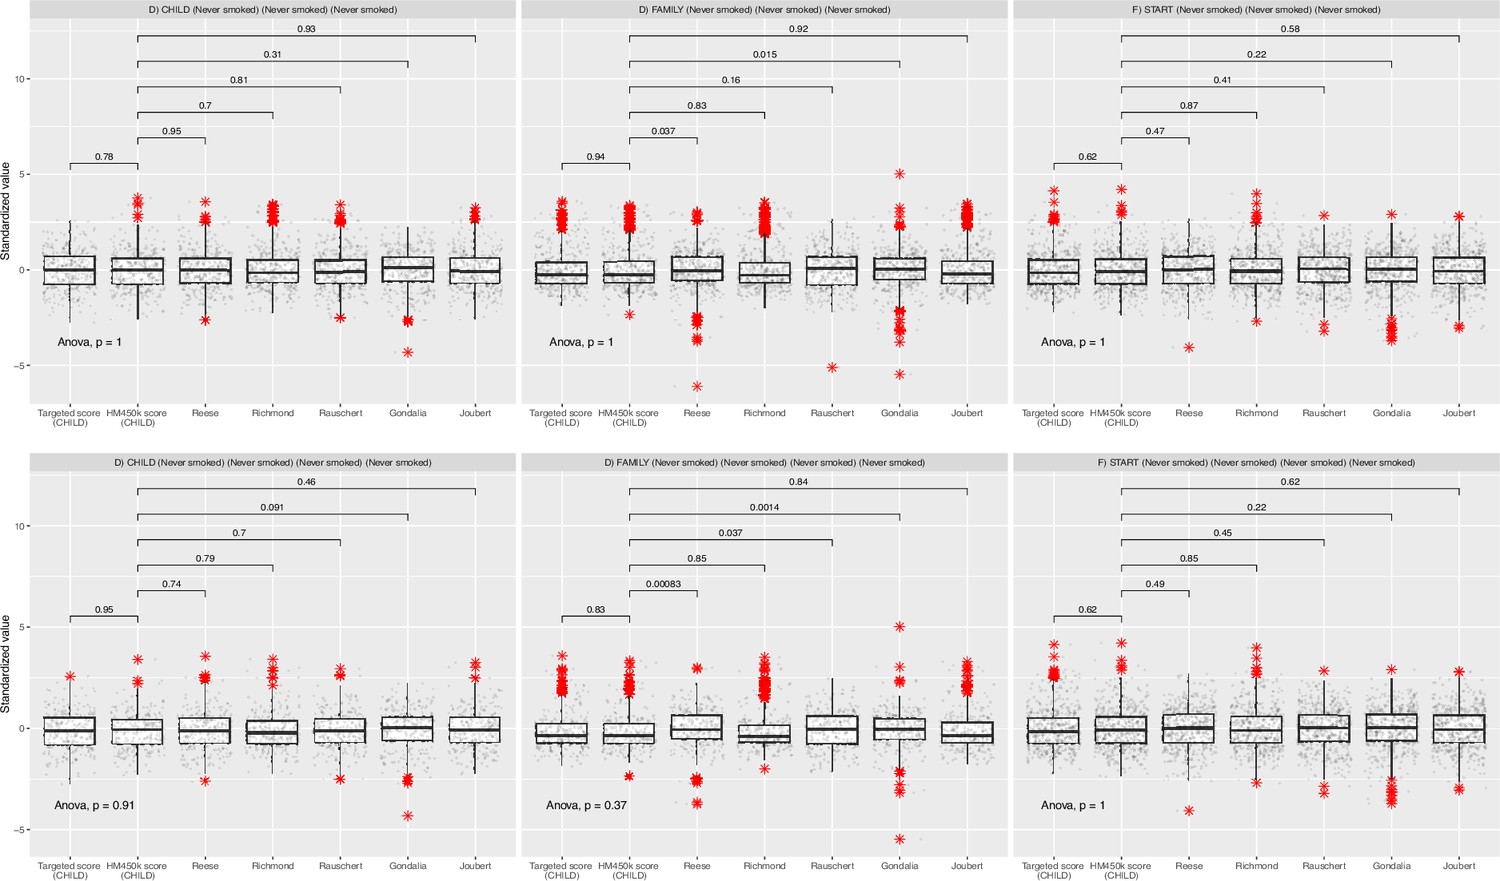
Comparison of all methylation scores stratified by study.
The boxplots captured the standardized maternal smoking methylation scores (y-axis) stratified by study. The top panels summarized results for all samples in Canadian Healthy Infant Longitudinal Development (CHILD; n=352), Family Atherosclerosis Monitoring In early life (FAMILY; n=411), and SouTh Asian biRth cohorT (START; n=504), while the bottom panels summarized results for only those in CHILD, FAMILY, and START that never smoked. The p-values indicate the significance for a mean difference for each pairwise comparison between the HM450K score validated in CHILD with other scores using two-sample t-tests.
Tables
Table 1
Characteristics of the epigenetic subsample (1267 mother–newborn pairs) from the CHILD, FAMILY, START cohorts.
| Phenotypes | CHILD | FAMILY | START | ANOVA F-test or Chi-squared test p-value for differences | |
|---|---|---|---|---|---|
| (n=352) | (n=411) | (n=504) | |||
| Mother | Smoking History | ||||
| never smoked | 247 (70.2%) | 253 (61.6%) | 501 (99.4%) | <0.001* | |
| quit before this pregnancy | 72 (20.5%) | 58 (14.1%) | 1 (0.2%) | ||
| quit during this pregnancy | 17 (4.8%) | 57 (13.9%) | 1 (0.2%) | ||
| currently smoking | 11 (3.1%) | 29 (7.1%) | 0 (0%) | ||
| Missing | 5 (1.4%) | 14 (3.4%) | 1 (0.2%) | ||
| Smoking Exposure (hr/week) | |||||
| Mean (SD) | 0.97 (±7.64) | 2.52 (±12.83) | 0.33 (±2.67) | <0.001 | |
| Missing | 12 (3.4%) | 5 (1.2%) | 42 (8.3%) | ||
| Gestational Diabetes Mellitus | |||||
| YES | 16 (4.5%) | 66 (16.1%) | 183 (36.3%) | <0.001 | |
| NO | 336 (95.5%) | 345 (83.9%) | 320 (63.5%) | ||
| Missing | 0 (0%) | 0 (0%) | 1 (0.2%) | ||
| Years of Education | <0.001 | ||||
| Mean (SD) | 16.96 (±3.08) | 16.85 (±3.39) | 15.81 (±2.41) | ||
| Missing | 7 (2.0%) | 3 (0.7%) | 0 (0%) | ||
| Mother’s Age | |||||
| Mean (SD) | 32.69 (±4.45) | 31.86 (±5.42) | 30.12 (±3.91) | <0.001 | |
| Missing | 4 (1.1%) | 0 (0%) | 0 (0%) | ||
| Parity | |||||
| Mean (SD) | 0.72 (±0.88) | 0.80 (±1.02) | 0.80 (±0.81) | 0.098 | |
| Missing | 2 (0.6%) | 0 (0%) | 13 (2.6%) | ||
| Pre-pregnancy BMI (kg/m2) | |||||
| Mean (SD) | 24.78 (±5.42) | 26.46 (±6.38) | 23.71 (±4.45) | <0.001 | |
| Missing | 132 (37.5%) | 16 (3.9%) | 2 (0.4%) | ||
| Newborn Sex | |||||
| Male | 194 (55.1%) | 211 (51.3%) | 239 (47.4%) | 0.083 | |
| Female | 158 (44.9%) | 200 (48.7%) | 265 (52.6%) | ||
| Plant-Based Diet | |||||
| Mean (SD) | –0.48 (±0.46) | 0.19 (±0.67) | 1.56 (±1.14) | <0.001 | |
| Missing | 23 (6.5%) | 36 (8.8%) | 16 (3.2%) | ||
| Health Conscious Diet | |||||
| Mean (SD) | 0.21 (±0.81) | –0.73 (±0.73) | –0.42 (±0.79) | <0.001 | |
| Missing | 23 (6.5%) | 36 (8.8%) | 16 (3.2%) | ||
| Western Diet | |||||
| Mean (SD) | –0.15 (±0.63) | 1.06 (±1.20) | –0.51 (±0.65) | <0.001 | |
| Missing | 23 (6.5%) | 36 (8.8%) | 16 (3.2%) | ||
| Newborn | Gestational Age (weeks) | ||||
| Mean (SD) | 39.53 (±1.38) | 39.44 (±1.47) | 39.20 (±1.32) | <0.001 | |
| Missing | 4 (1.1%) | 0 (0%) | 0 (0%) | ||
| Birth Length (cm) | |||||
| Mean (SD) | 51.68 (±2.52) | 50.20 (±2.16) | 51.44 (±2.69) | <0.001 | |
| Missing | 71 (20.2%) | 10 (2.4%) | 7 (1.4%) | ||
| Birth Weight (kg) | |||||
| Mean (SD) | 3.50 (±0.49) | 3.53 (±0.50) | 3.26 (±0.46) | <0.001 | |
| Missing | 6 (1.7%) | 0 (0%) | 1 (0.2%) | ||
| Newborn BMI (kg/m2) | |||||
| Mean (SD) | 13.11 (±1.41) | 13.94 (±1.29) | 12.31 (±1.39) | <0.001 | |
| Missing | 72 (20.5%) | 10 (2.4%) | 7 (1.4%) | ||
| Newborn Ponderal Index (kg/m3) | |||||
| Mean (SD) | 25.45 (±3.14) | 27.79 (±2.55) | 24.02 (±3.17) | <0.001 | |
| Missing | 72 (20.5%) | 10 (2.4%) | 7 (1.4%) | ||
| Estimated cell proportions | CD8T | ||||
| Mean (SD) | 0.01 (±0.01) | 0.04 (±0.03) | 0.02 (±0.02) | <0.001 | |
| CD4T | |||||
| Mean (SD) | 0.11 (±0.06) | 0.13 (±0.06) | 0.16 (±0.07) | <0.001 | |
| NK | |||||
| Mean (SD) | 0.02 (±0.02) | 0.03 (±0.03) | 0.02 (±0.03) | <0.001 | |
| Bcell | |||||
| Mean (SD) | 0.02 (±0.02) | 0.04 (±0.03) | 0.04 (±0.03) | <0.001 | |
| Mono | |||||
| Mean (SD) | 0.01 (±0.02) | 0.04 (±0.03) | 0.03 (±0.03) | <0.001 | |
| Gran | |||||
| Mean (SD) | 0.80 (±0.10) | 0.60 (±0.13) | 0.72 (±0.14) | <0.001 | |
| nRBC | |||||
| Mean (SD) | 0.08 (±0.08) | 0.12 (±0.11) | 0.07 (±0.11) | <0.001 | |
| MNLR | |||||
| Mean (SD) | 6.59 (±6.00) | 3.30 (±3.14) | 3.98 (±3.08) | <0.001 | |
| Missing | 6 (1.7%) | 0 (0%) | 3 (0.6%) | ||
| * comparison for CHILD and FAMILY only | |||||
Table 2
Meta-analysis results of the association between cytosine–phosphate–guanines (CpGs) and maternal smoking and smoking exposure that passed a marginal p<0.05 threshold after the false discovery rate correction in European cohorts.
| CHR | Position | CpG | UCSC reference gene | Meta-analysis (CHILD and FAMILY) | Cohort-specific association P-value | Reported Association EWAS catalog | ||||||
|---|---|---|---|---|---|---|---|---|---|---|---|---|
| Fixed effect | Standard error | Association p-value | p-value for effect heterogeneity | FDR adjusted the Association P-value | CHILD | FAMILY | ||||||
| Maternal Smoking | 1 | 92481269 | cg12876356 | GFI1 | –1.11 | 0.22 | 7.33E-07 | 0.51 | 0.0019 | 0.02 | 9.45E-06 | MS;S; AC; BW |
| 1 | 92482032 | cg09935388 | GFI1 | –1.15 | 0.24 | 2.26E-06 | 0.52 | 0.0029 | 0.02 | 2.71E-05 | MS;GA; S; AC; BMI; BW | |
| 1 | 92482405 | cg14179389 | GFI1 | –1.48 | 0.32 | 5.03E-06 | 0.73 | 0.0035 | 0.01 | 1.12E-04 | MS;S | |
| 1 | 92481144 | cg18146737 | GFI1 | –0.92 | 0.20 | 5.58E-06 | 0.50 | 0.0035 | 0.04 | 3.95E-05 | MS;S; AC; BW | |
| 1 | 92480576 | cg09662411 | GFI1 | –0.94 | 0.22 | 1.64E-05 | 0.29 | 0.0083 | 0.10 | 3.85E-05 | MS;S | |
| 1 | 92481479 | cg18316974 | GFI1 | –0.74 | 0.18 | 3.58E-05 | 0.33 | 0.0152 | 0.13 | 7.34E-05 | MS;S; AC; BW | |
| 17 | 2494783943 | cg01798813 | – | –0.83 | 0.21 | 1.09E-04 | 0.34 | 0.0395 | 0.02 | 0.0016 | A; GA; BMI | |
| Smoking Exposure | 1 | 92482032 | cg09935388 | GFI1 | –0.18 | 0.04 | 1.39E-05 | 0.23 | 0.04 | 0.15 | 2.45E-05 | MS;GA; S; AC; BMI; BW |
| 17 | 2494783943 | cg01798813 | – | –0.18 | 0.04 | 3.30E-05 | 0.13 | 0.04 | 0.00035 | 0.013 | A; GA; BMI | |
-
MS: maternal smoking; GA: gestational age; AC: alcohol consumption; BMI: body mass index; T2D: type 2 diabetes; A: age; BW: birth weight.
Table 3
Significant associations between maternal smoking methylation risk score and phenotypes in CHILD, FAMILY, and START.
| CHILD | FAMILY | START | |||||||
|---|---|---|---|---|---|---|---|---|---|
| Fixed effect | Standard error | Association p-value | Fixed effect | Standard error | Association p-value | Fixed effect | Standard error | Association P-value | |
| Smoking exposure (hr/week) | 1.64 | 0.40 | 5.40E-05 | 2.58 | 0.60 | 2.34E-05 | 0.07 | 0.12 | 0.58 |
| 1 year Smoking exposure (hr/week) | 0.44 | 0.15 | 0.0044 | – | – | – | – | – | – |
| 3 year Smoking exposure (hr/week) | – | – | – | 1.15 | 0.39 | 0.0033 | – | – | – |
| Gestational weight gain (kg) | –0.36 | 0.38 | 0.35 | –0.62 | 0.26 | 0.017 | –0.14 | 0.34 | 0.69 |
| Gestational age (weeks) | 1.64 | 0.40 | 6.32E-05 | 2.84 | 0.62 | 5.52E-06 | 0.07 | 0.12 | 0.59 |
| Birth weight (kg) | –0.06 | 0.03 | 0.016 | –0.04 | 0.02 | 0.096 | –0.03 | 0.02 | 0.094 |
| Birth length (cm) | –0.14 | 0.15 | 0.35 | –0.10 | 0.10 | 0.33 | –0.37 | 0.12 | 0.0023 |
| 1 year Height (cm) | –0.32 | 0.16 | 0.047 | –0.34 | 0.14 | 0.019 | –0.42 | 0.16 | 0.0079 |
| 2 year Height (cm) | –0.13 | 0.35 | 0.72 | –0.26 | 0.17 | 0.14 | –0.57 | 0.21 | 0.0067 |
| 5 year Height (cm) | –0.36 | 0.26 | 0.16 | –0.43 | 0.26 | 0.095 | –0.47 | 0.37 | 0.21 |
| 3 year Skinfold thickness | 0.48 | 0.19 | 0.014 | 0.94 | 0.26 | 3.46E-04 | 0.24 | 0.27 | 0.38 |
| 5 year Skinfold thickness | 0.56 | 0.24 | 0.019 | 0.68 | 0.37 | 0.068 | 0.12 | 0.42 | 0.77 |
Additional files
-
Supplementary file 1
Additional tables and summaries of results.
(A) Quality controls for the inclusion/exclusion of samples and methylation probes. (B) Characteristics of the overall sample include 5176 mother–newborn pairs from the Canadian Healthy Infant Longitudinal Development (CHILD), Family Atherosclerosis Monitoring In early life (FAMILY), and SouTh Asian biRth cohorT (START) cohorts. (C) A summary of available analyses and outcome variables in each cohort. (D) A summary of the DNA methylation (DNAm) maternal smoking score derivation design and results. (E) Characteristics of the epigenetic subsample from CHILD and FAMILY cohorts stratified by smoking status. (F) Score weights for external DNAm maternal smoking scores. (G) summary of cytosine–phosphate–guanines (CpGs) that contribute to the DNAm maternal smoking scores and their weights. (H) Association between maternal smoking methylation risk score and phenotypes in CHILD, FAMILY, and START. (I) Summary of mean difference in methylation risk scores between studies in overall samples and those never smoked.
- https://cdn.elifesciences.org/articles/93260/elife-93260-supp1-v1.xlsx
Download links
A two-part list of links to download the article, or parts of the article, in various formats.
Downloads (link to download the article as PDF)
Open citations (links to open the citations from this article in various online reference manager services)
Cite this article (links to download the citations from this article in formats compatible with various reference manager tools)
Maternal smoking DNA methylation risk score associated with health outcomes in offspring of European and South Asian ancestry
eLife 13:RP93260.
https://doi.org/10.7554/eLife.93260.4


