A hepatocyte-specific transcriptional program driven by Rela and Stat3 exacerbates experimental colitis in mice by modulating bile synthesis
- Immunometabolism Laboratory, National Institute of Immunology, India
- System Immunology Laboratory, National Institute of Immunology, India
- Department of GastroEnterology, All India Institute of Medical Sciences, India
- Center for Cellular and Molecular Biology, India
- Gaikwad Steroidomics Lab LLC, United States
- Department of Biology, Indian Institute of Science Education and Research, India
Figures
Figure 1 with 1 supplement
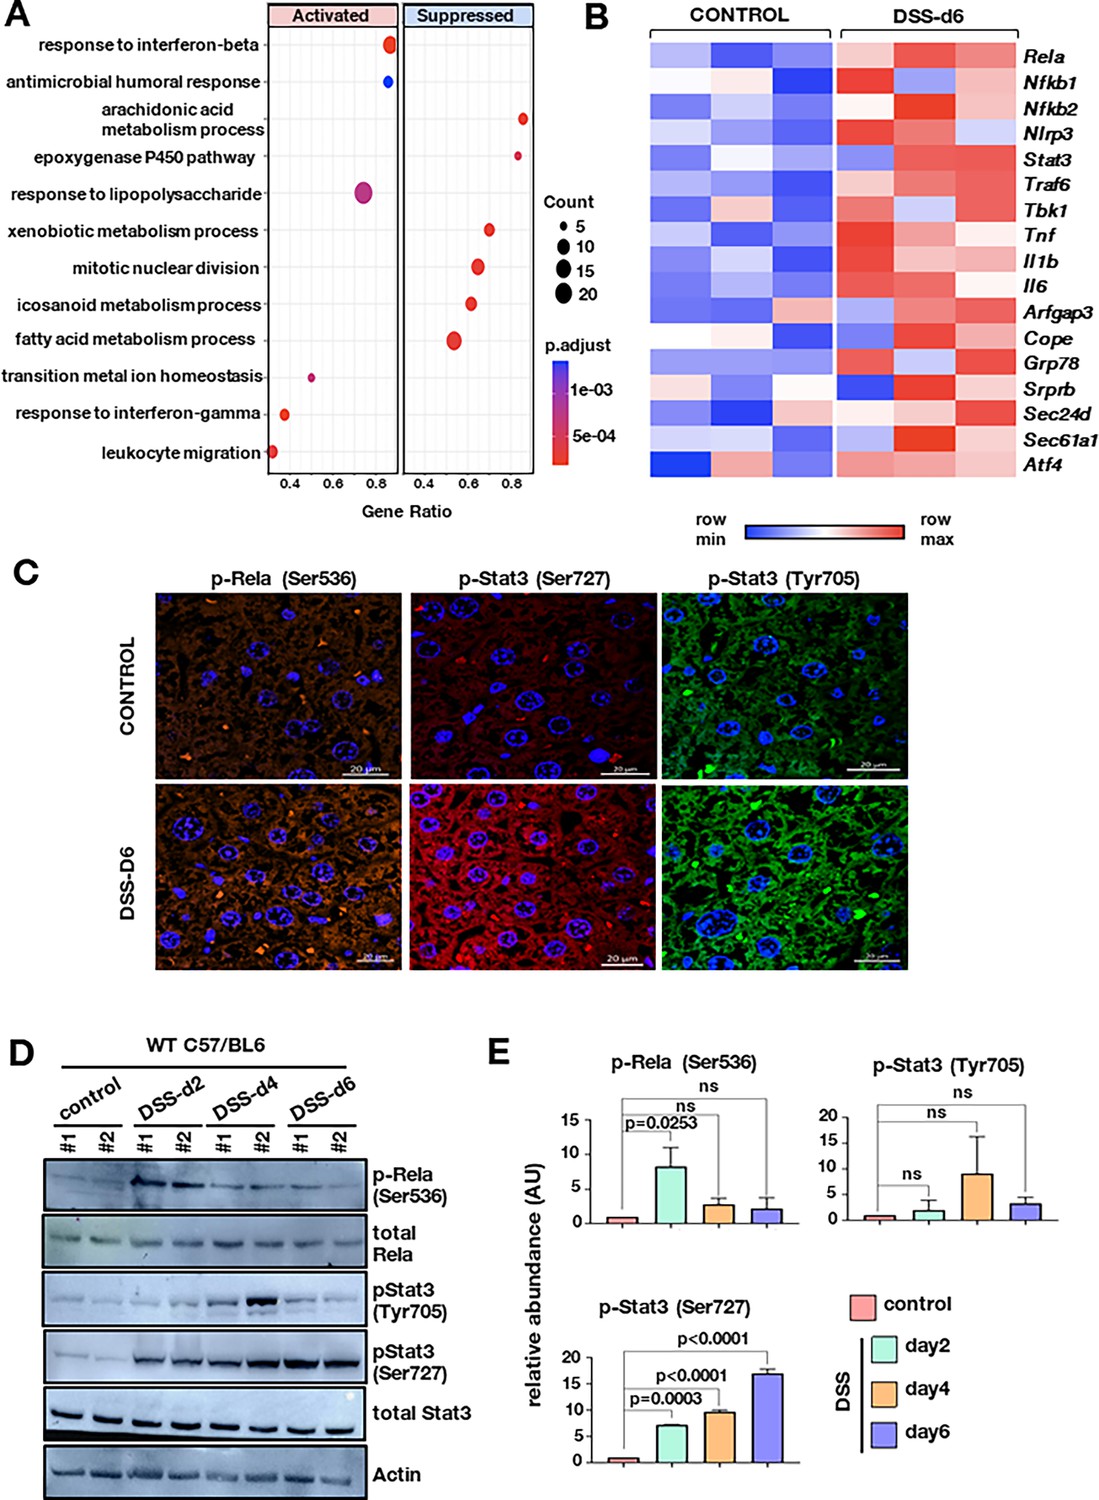
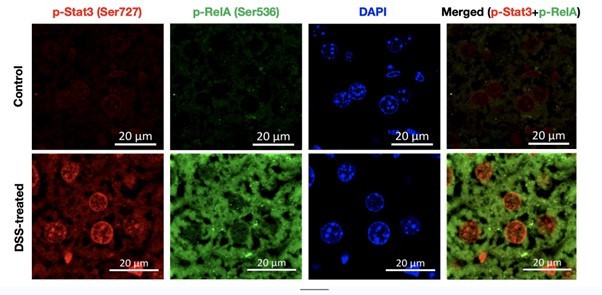
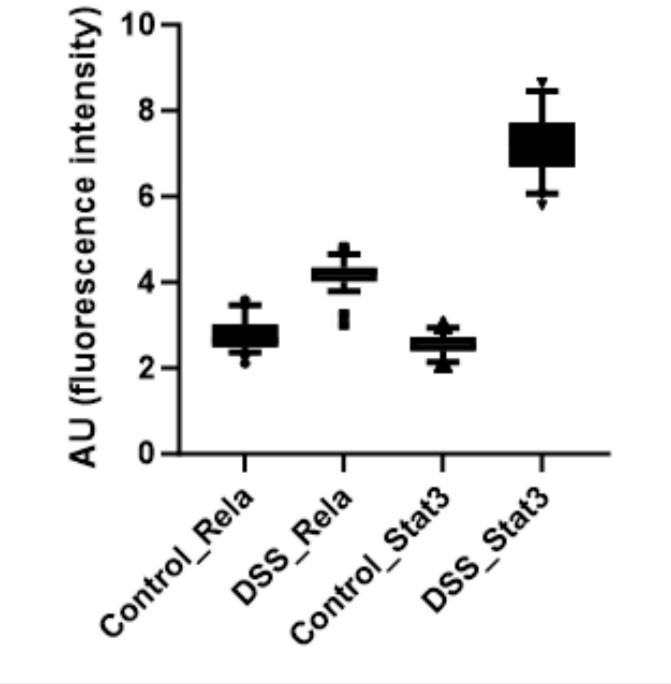
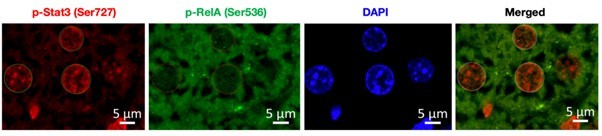
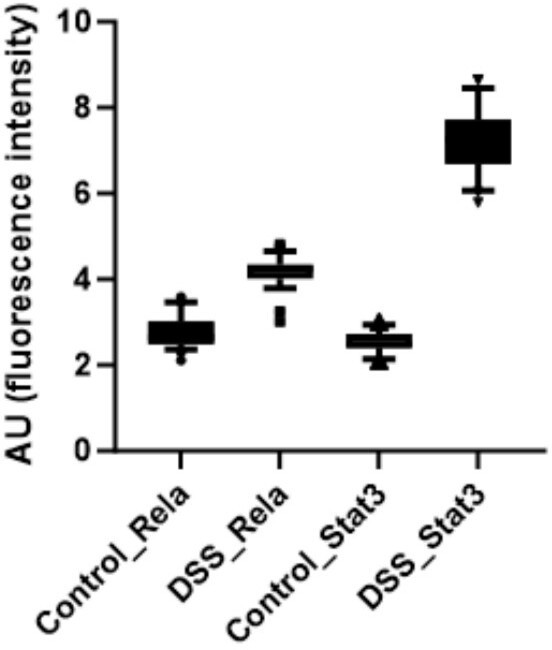
Initiation of colitis in mice leads to hepatic Rela and Stat3 activation.
(A) GO pathway enrichment analysis was done for DEGs with adjusted p-value <0.05 on day 6 post DSS treatment. Bubble plot depicts the enrichment of pathways on day 6 for different genotypes, where the coordinate on the x-axis represents gene ratio, size of bubble represents the gene count and color represents the p-value. (B) Heatmap represents the normalized transcript count of the Rela and Stat3 pathway obtained from the RNA-seq experiment of three biological replicates. Scale is normalized across each row and color from blue to red represents minimum and the maximum values, respectively. (C) Representative confocal microscopy images show Rela and Stat3 activation in untreated and 6 days DSS-treated liver tissue of C57BL/6 mice. Images were taken at 40 X. Scale is 20 μm. (D) Western blot revealing the abundance of total Rela and total Stat3, and their phosphorylated functionally active forms, in the liver extracts prepared from wild-type C57BL/6 mice either left untreated or subjected to dextran sodium sulfate (DSS) treatment for 2, 4, and 6 days, respectively. (E) The signal intensity of bands corresponding to the indicated phosphorylated proteins was quantified from western blots, normalized against beta-actin, and presented as a bar plot. The data represent the means of three biological replicates ± SEM.
-
Figure 1—source data 1
Table containing all the significantly regulated GO terms of which few are plotted in Figure 1A.
- https://cdn.elifesciences.org/articles/93273/elife-93273-fig1-data1-v1.docx
-
Figure 1—source data 2
Data used for generating graph in Figure 1E.
- https://cdn.elifesciences.org/articles/93273/elife-93273-fig1-data2-v1.docx
-
Figure 1—source data 3
Labeled and unedited blots shown in Figure 1D.
- https://cdn.elifesciences.org/articles/93273/elife-93273-fig1-data3-v1.pdf
-
Figure 1—source data 4
Zipped folder of the original blots shown in Figure 1D.
- https://cdn.elifesciences.org/articles/93273/elife-93273-fig1-data4-v1.zip
Figure 1—figure supplement 1
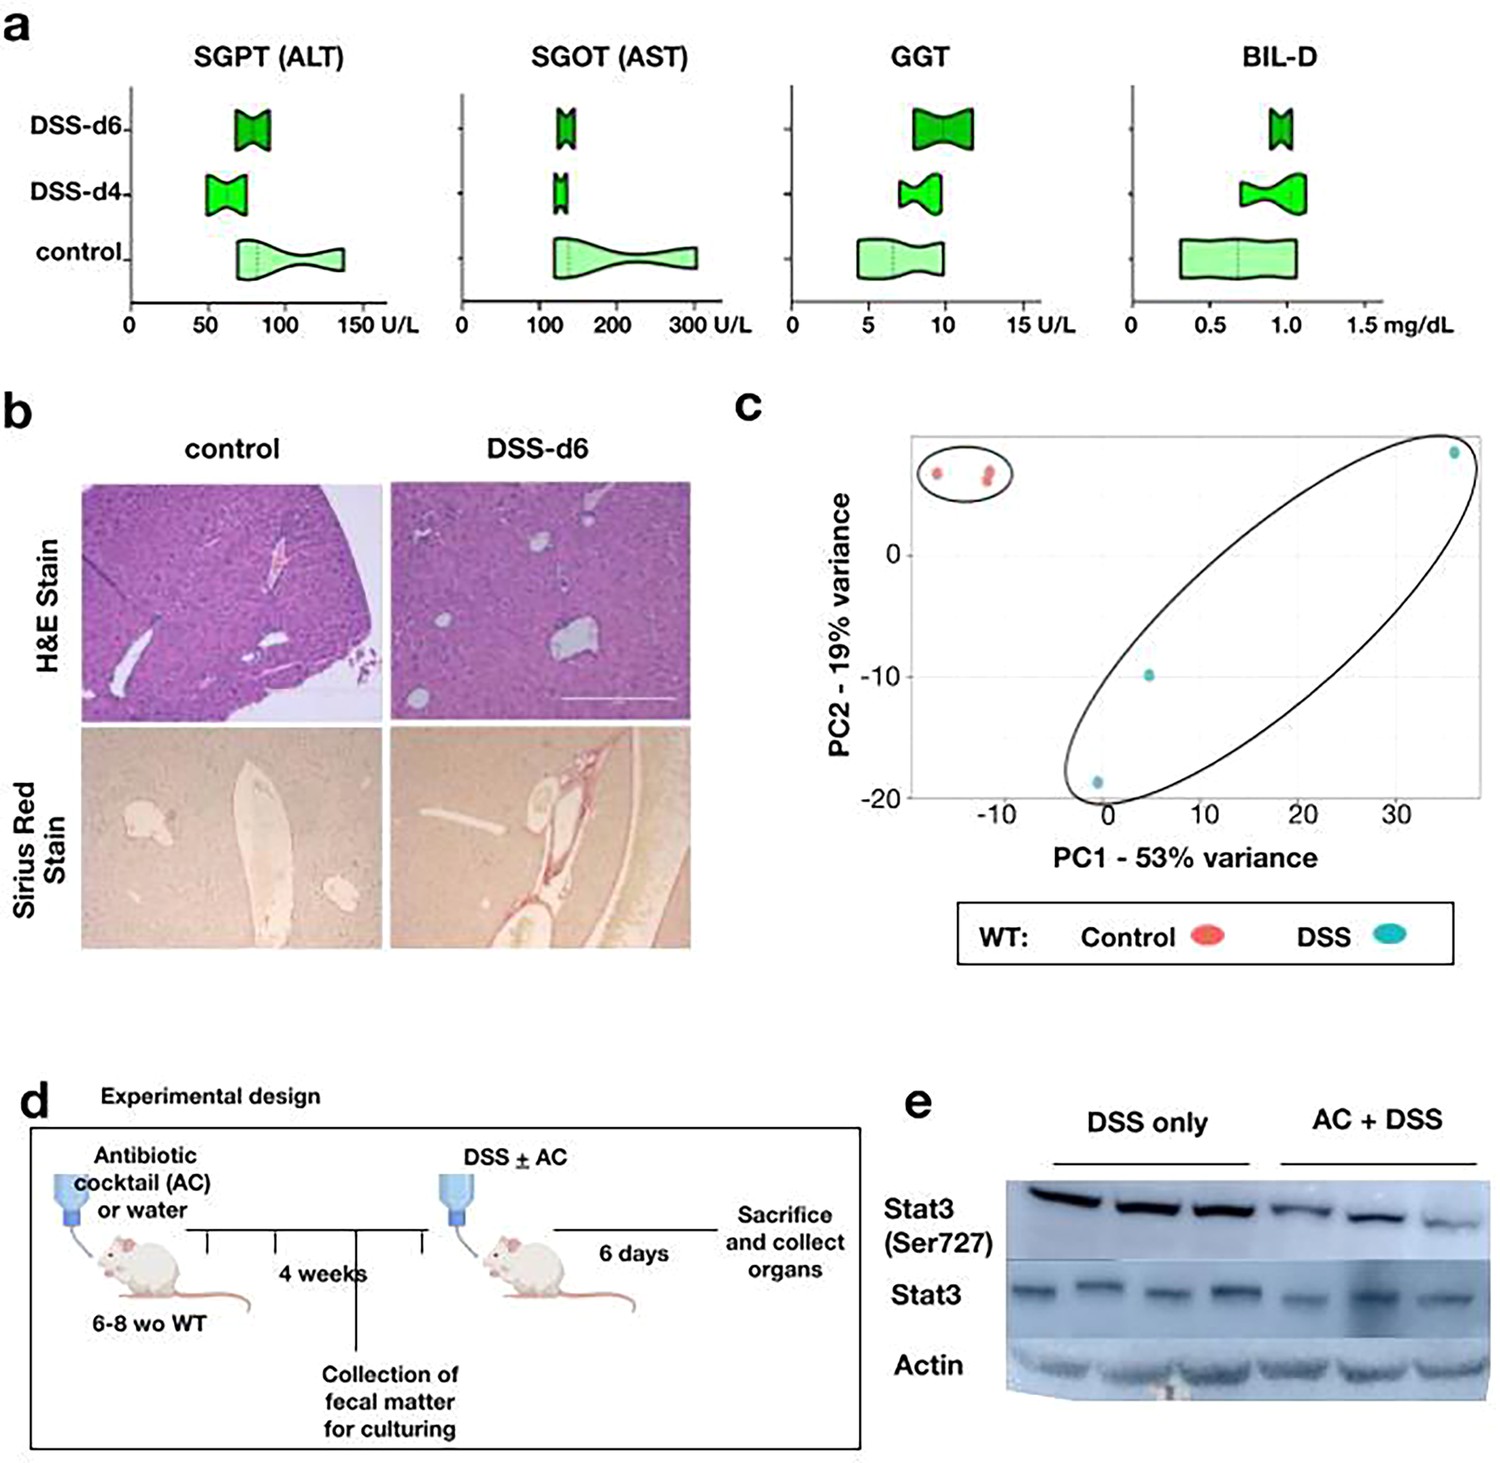
Biochemical, histological and molecular characterization of mice liver upon colitis induction.
(a) Violin plot comparing the clinical parameters in serum of untreated and dextran sodium sulfate (DSS)-treated wild-type mice (n=3) (b) Liver sections from untreated and DSS-treated wild-type mice were examined for histological features involving hematoxylin and eosin (H&E) staining [upper panel] and Sirius red staining [lower panel]. Data were obtained in 10 X magnification and represented three experimental replicates; two fields per section and a total of three sections from each set were examined. (c) Principal component analysis (PCA) plot illustrating the hepatic transcriptome, identified through global RNA-seq analyses, of untreated or DSS-treated-wild-type mice (n=3). (d) Schematic description of an experimental setup for gut sterilization by antibiotic treatment. (e) Western blot revealing the abundance of total Stat3 and it’s phosphorylated functionally active forms p-Stat3 (Ser727), in the liver extracts prepared from DSS-treated wild-type C57BL/6 mice with and without a prior antibiotic treatment for 4 weeks.
-
Figure 1—figure supplement 1—source data 1
Data used for generating graph in Figure 1—figure supplement 1a.
- https://cdn.elifesciences.org/articles/93273/elife-93273-fig1-figsupp1-data1-v1.docx
-
Figure 1—figure supplement 1—source data 2
Labeled and unedited blots shown in Figure 1—figure supplement 1e.
- https://cdn.elifesciences.org/articles/93273/elife-93273-fig1-figsupp1-data2-v1.pdf
-
Figure 1—figure supplement 1—source data 3
Zipped folder of the original blots in Figure 1—figure supplement 1e.
- https://cdn.elifesciences.org/articles/93273/elife-93273-fig1-figsupp1-data3-v1.zip
Figure 2 with 1 supplement
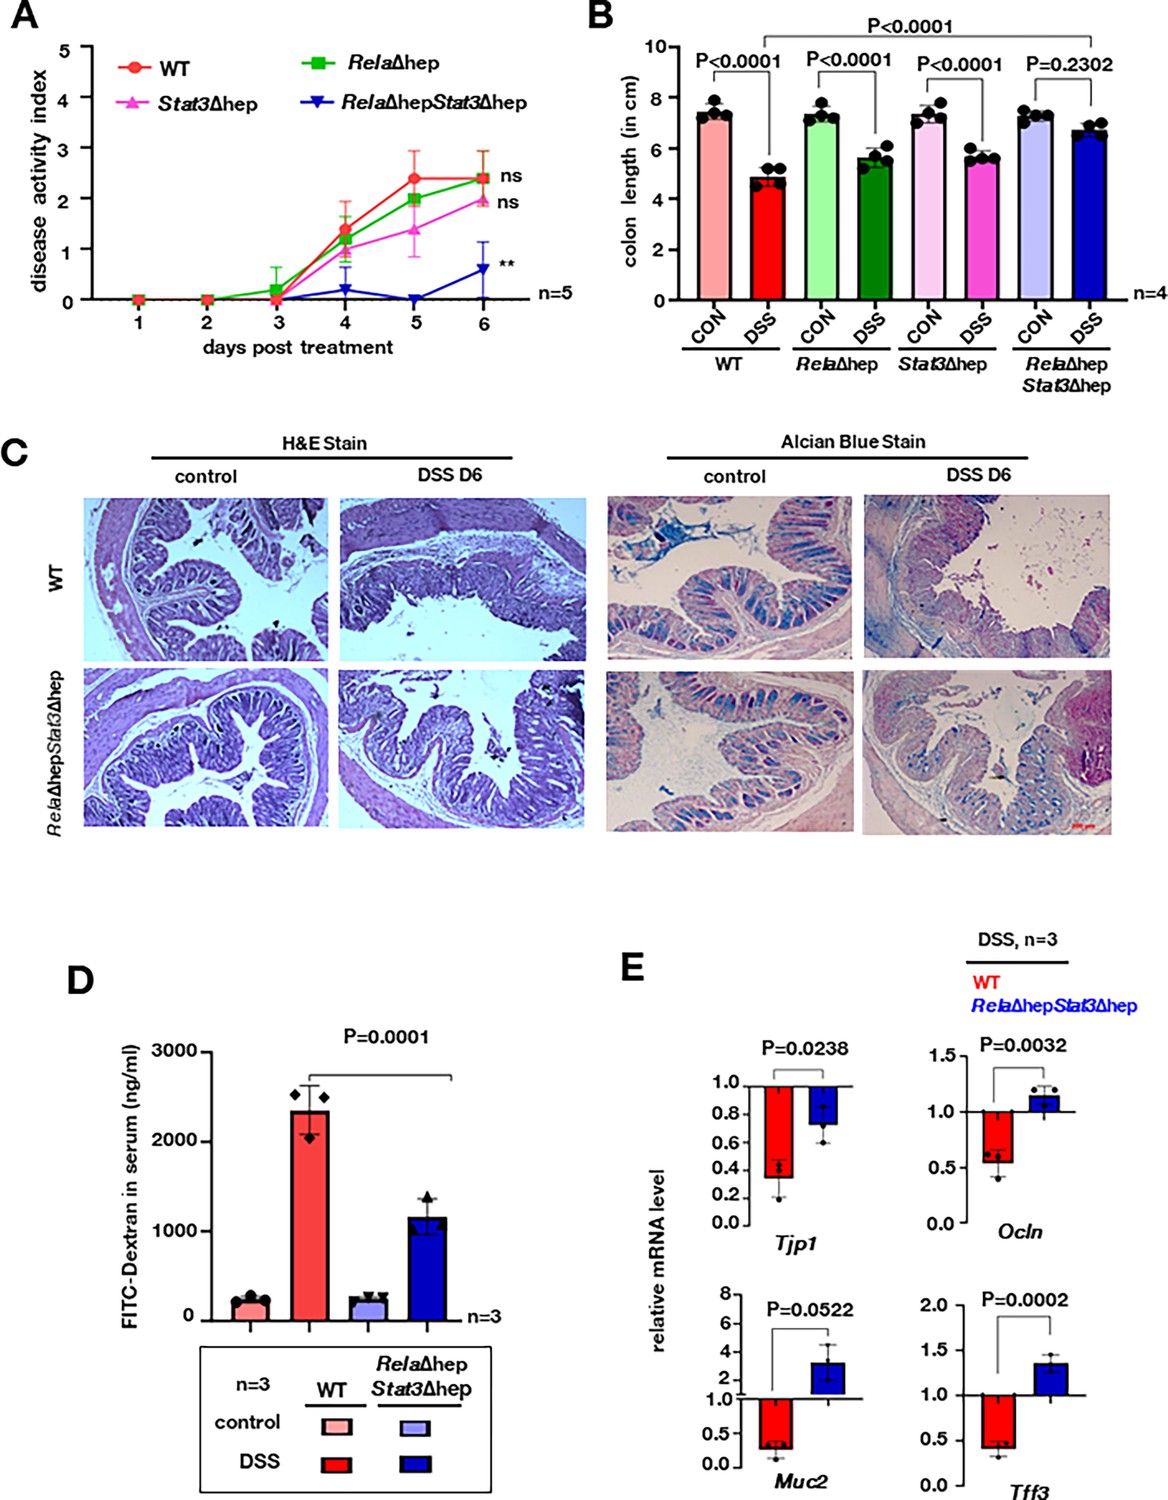
Rela and Stat3 deficiency in hepatocytes ameliorates dextran sodium sulfate (DSS)-induced acute colitis in mice.
(A) Line plot charting disease activity index of wild-type, RelaΔhep, Stat3Δhep, and RelaΔhepStat3Δhep littermate mice subjected to treatment with 2% DSS for 6 days. (B) Bar plot depicting colon length measured on day 6 post-onset of DSS treatment of mice of the indicated genotypes. Untreated wild-type littermates of corresponding genotypes were used as controls. (C) Colon sections from untreated and DSS-treated mice of the indicated genotypes were examined for histological features involving hematoxylin and eosin (H&E) staining [left panel] and alcian blue staining [right panel]. Data were obtained in 10 X magnification and represented three experimental replicates; two fields per section and a total of three sections from each set were examined. (D) Bar plot quantifying gut permeability of untreated and DSS-treated wild-type and RelaΔhepStat3Δhep mice. Briefly, the serum concentration of fluorescein isothiocyanate (FITC) was measured 6 hr after oral gavaging of the mice with FITC-dextran. (E) RT-qPCR reveals the relative abundance of the indicated mRNAs encoding broadly enterocyte-specific (above panel) or goblet cell-specific (below panel) markers in untreated or DSS-treated mice of the indicated genotypes.
-
Figure 2—source data 1
Data used for generating graph in Figure 2A.
- https://cdn.elifesciences.org/articles/93273/elife-93273-fig2-data1-v1.docx
-
Figure 2—source data 2
Data used for generating graph in Figure 2B.
- https://cdn.elifesciences.org/articles/93273/elife-93273-fig2-data2-v1.docx
-
Figure 2—source data 3
Data used for generating graph in Figure 2D.
- https://cdn.elifesciences.org/articles/93273/elife-93273-fig2-data3-v1.docx
-
Figure 2—source data 4
Data used for generating graph in Figure 2E.
- https://cdn.elifesciences.org/articles/93273/elife-93273-fig2-data4-v1.docx
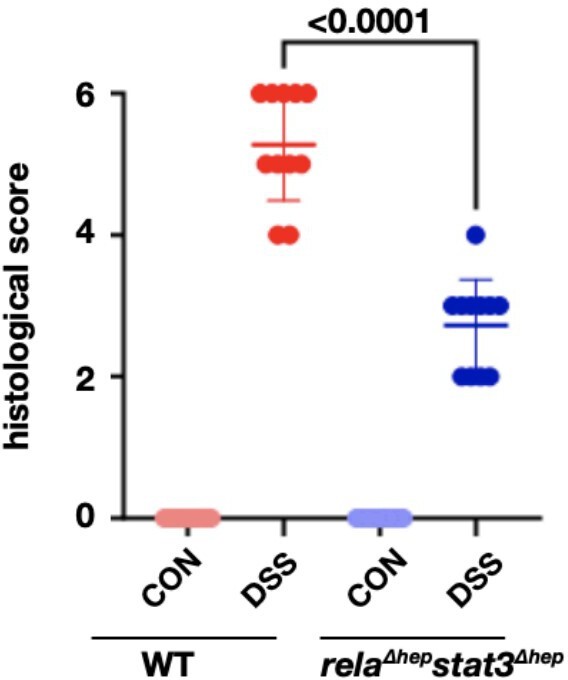
Figure 2—figure supplement 1
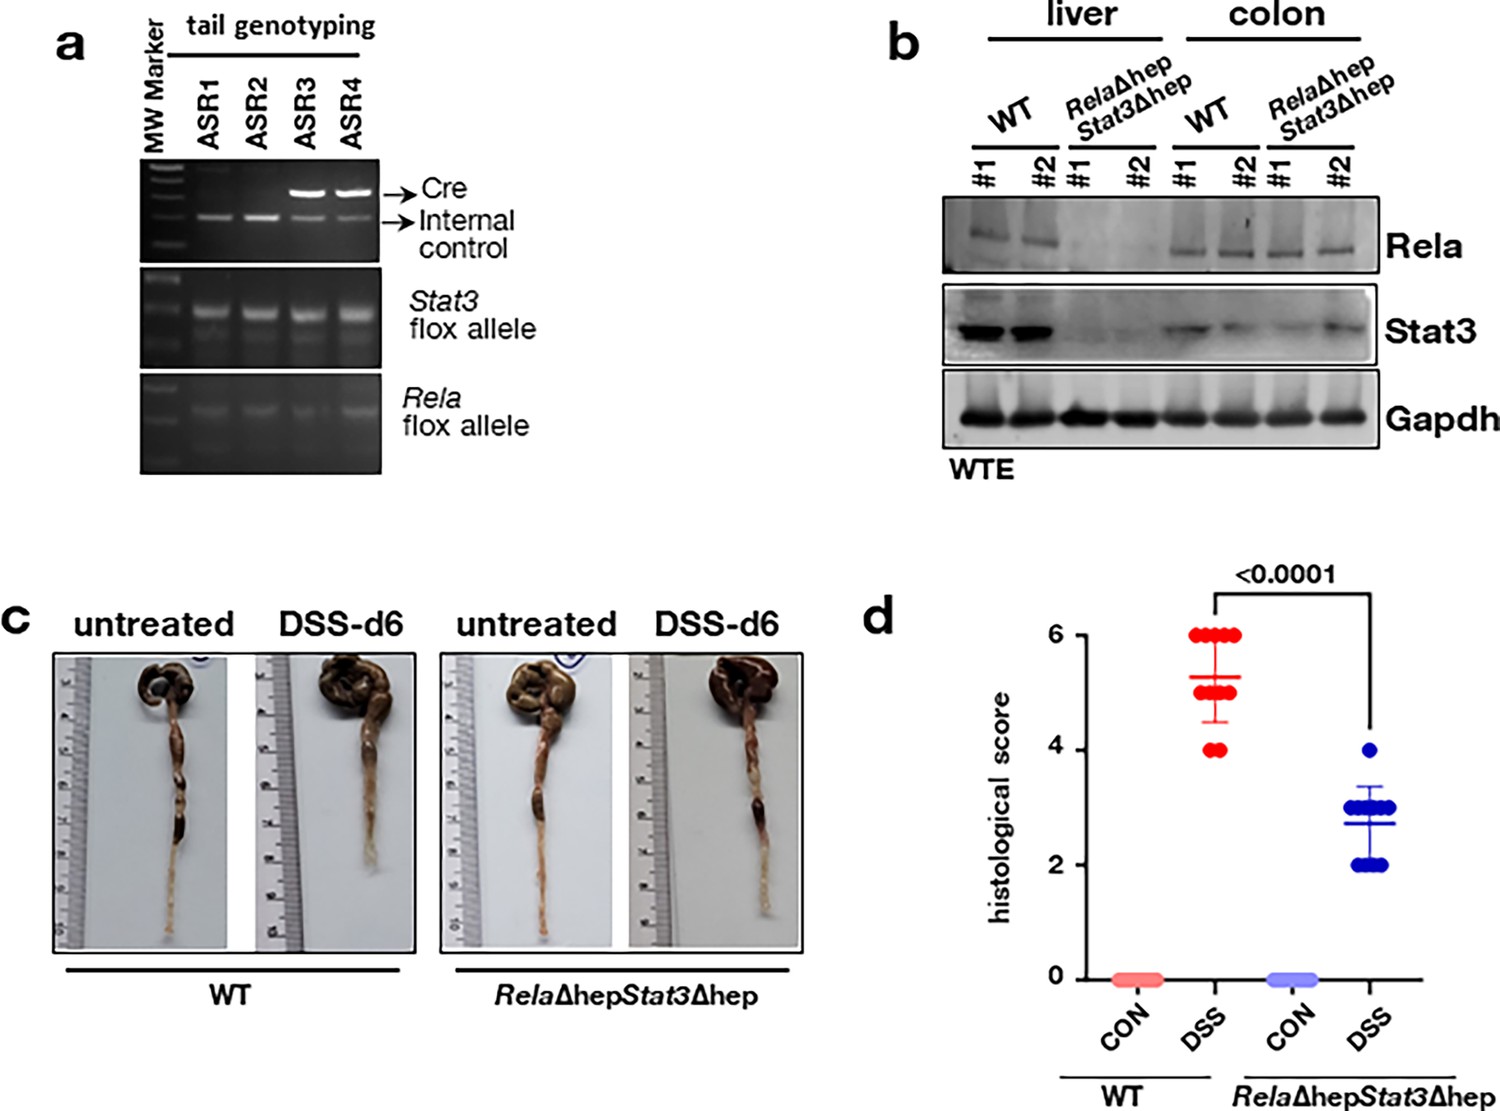
Methods for characterization of mice strain and analysis of colon pathology of colitogenic mice.
Characterization of mice strain by (a) genotyping and (b) western blotting; WTE - whole tissue extract. (c) Representative images of the colon from untreated and dextran sodium sulfate (DSS)-treated wild-type and RelaΔhepStat3Δhep mice. (d) Dot plot representing the histological score for hematoxylin and eosin (H&E) stained colon sections in Figure 2C, each dot represents the score for each field analyzed.
-
Figure 2—figure supplement 1—source data 1
Labeled and unedited gel shown in Figure 2—figure supplement 1a.
- https://cdn.elifesciences.org/articles/93273/elife-93273-fig2-figsupp1-data1-v1.pdf
-
Figure 2—figure supplement 1—source data 2
Zipped folder of the original gel shown in Figure 2—figure supplement 1a.
- https://cdn.elifesciences.org/articles/93273/elife-93273-fig2-figsupp1-data2-v1.zip
-
Figure 2—figure supplement 1—source data 3
Labeled and unedited blot shown in Figure 2—figure supplement 1b.
- https://cdn.elifesciences.org/articles/93273/elife-93273-fig2-figsupp1-data3-v1.pdf
-
Figure 2—figure supplement 1—source data 4
Zipped folder of the original blot shown in Figure 2—figure supplement 1b.
- https://cdn.elifesciences.org/articles/93273/elife-93273-fig2-figsupp1-data4-v1.zip
-
Figure 2—figure supplement 1—source data 5
Data used for generating graph in Figure 2—figure supplement 1d.
- https://cdn.elifesciences.org/articles/93273/elife-93273-fig2-figsupp1-data5-v1.docx
Figure 3 with 1 supplement
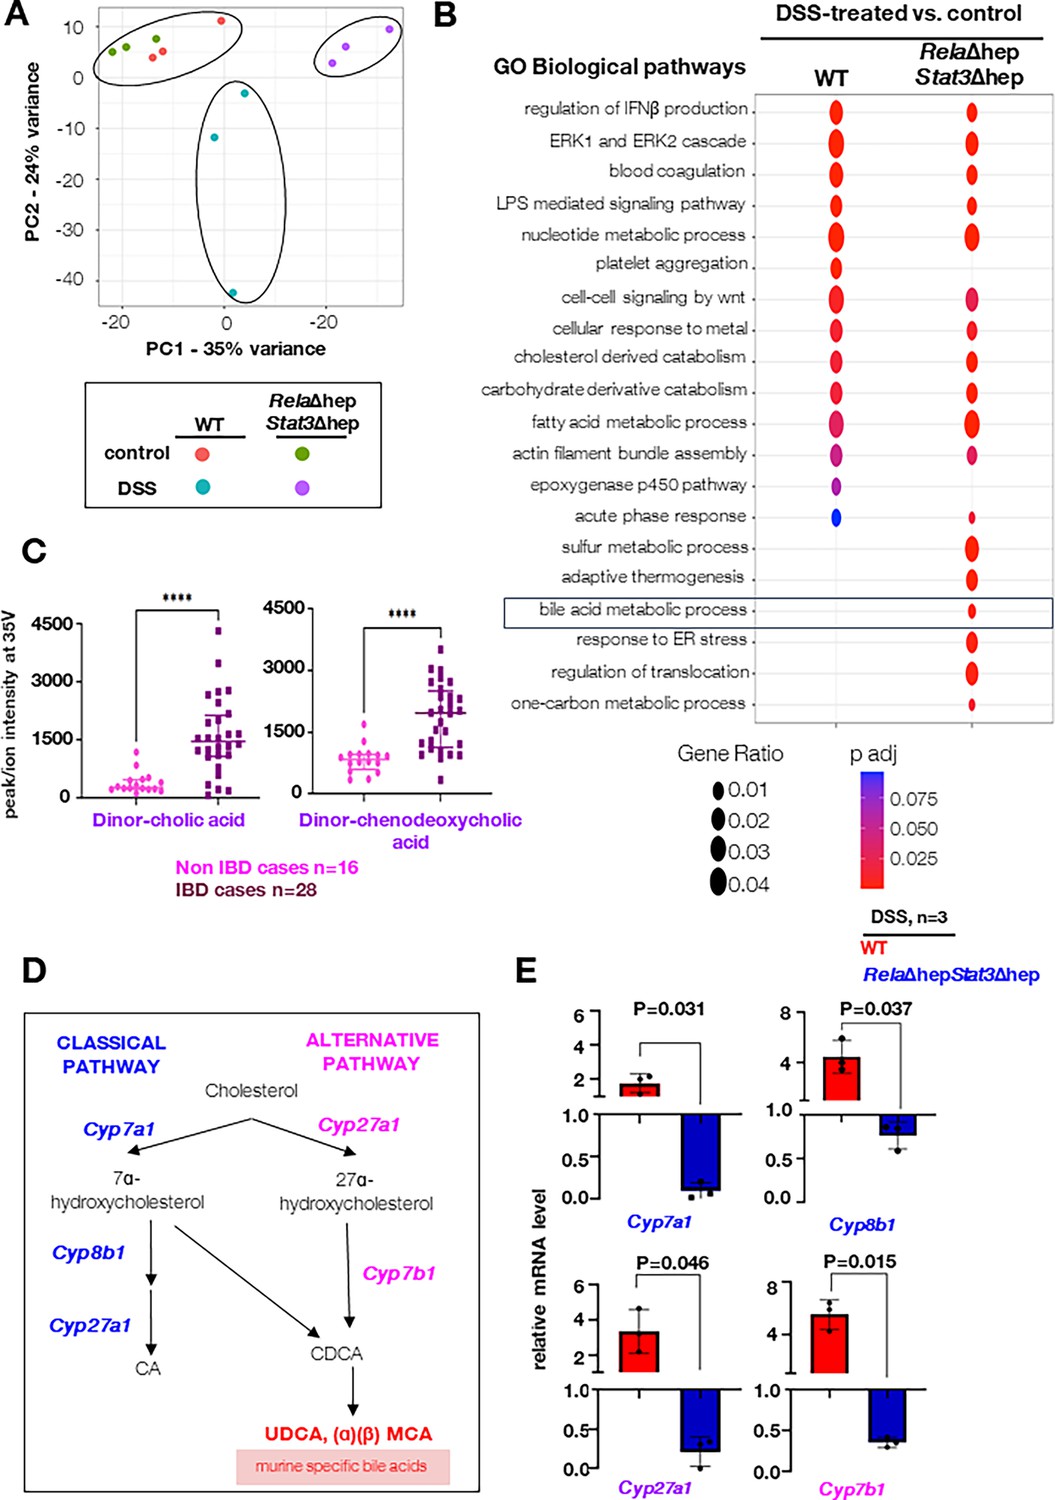
Charting hepatic gene expressions in colitogenic wild-type and RelaΔhepStat3Δhep mice.
(A) Principal component analysis (PCA) plot illustrating the hepatic transcriptome, identified through global RNA-seq analyses, of untreated or dextran sodium sulfate (DSS)-treated wild-type and RelaΔhepStat3Δhep mice (n=3). DSS treatment was carried out for 6 days. (B) Bubble plot depicting the relative enrichment of GO biological terms for differentially expressed genes in wild-type or RelaΔhepStat3Δhep mice. The gene ratio for a given term and the adjusted p-value associated with the enrichment score has been presented for the individual genetic backgrounds. (C) Dot plot of dinor-cholic acid and dinor-chenodeoxycholic acid as detected in an untargeted LC-MS-based quantification of bile acids in the mucosal biopsy samples from inflammatory bowel disease (IBD) and Non-IBD patients. (D) Schematic presentation of classical and alternate pathways of bile synthesis in mice liver tissue. CA, CDCA, MCA, and UDCA represent cholic, chenodeoxycholic, muricholic, and ursodeoxycholic acids, respectively. (E) RT-qPCR analyses comparing the hepatic abundance of indicated mRNAs encoding enzymes involved in bile metabolism in DSS-treated wild-type and RelaΔhepStat3Δhep mice (n=3). Fold change is relative to their corresponding wild-type littermates.
-
Figure 3—source data 1
Table containing all the significantly regulated GO terms of which few are plotted in Figure 3B.
- https://cdn.elifesciences.org/articles/93273/elife-93273-fig3-data1-v1.docx
-
Figure 3—source data 2
Data used for generating graph in Figure 3C.
- https://cdn.elifesciences.org/articles/93273/elife-93273-fig3-data2-v1.docx
-
Figure 3—source data 3
Data used for generating graph in Figure 3E.
- https://cdn.elifesciences.org/articles/93273/elife-93273-fig3-data3-v1.docx
-
Figure 3—source data 4
Table containing the demography of the control and UC patient for which the bile acids have been quantitated.
- https://cdn.elifesciences.org/articles/93273/elife-93273-fig3-data4-v1.docx
Figure 3—figure supplement 1
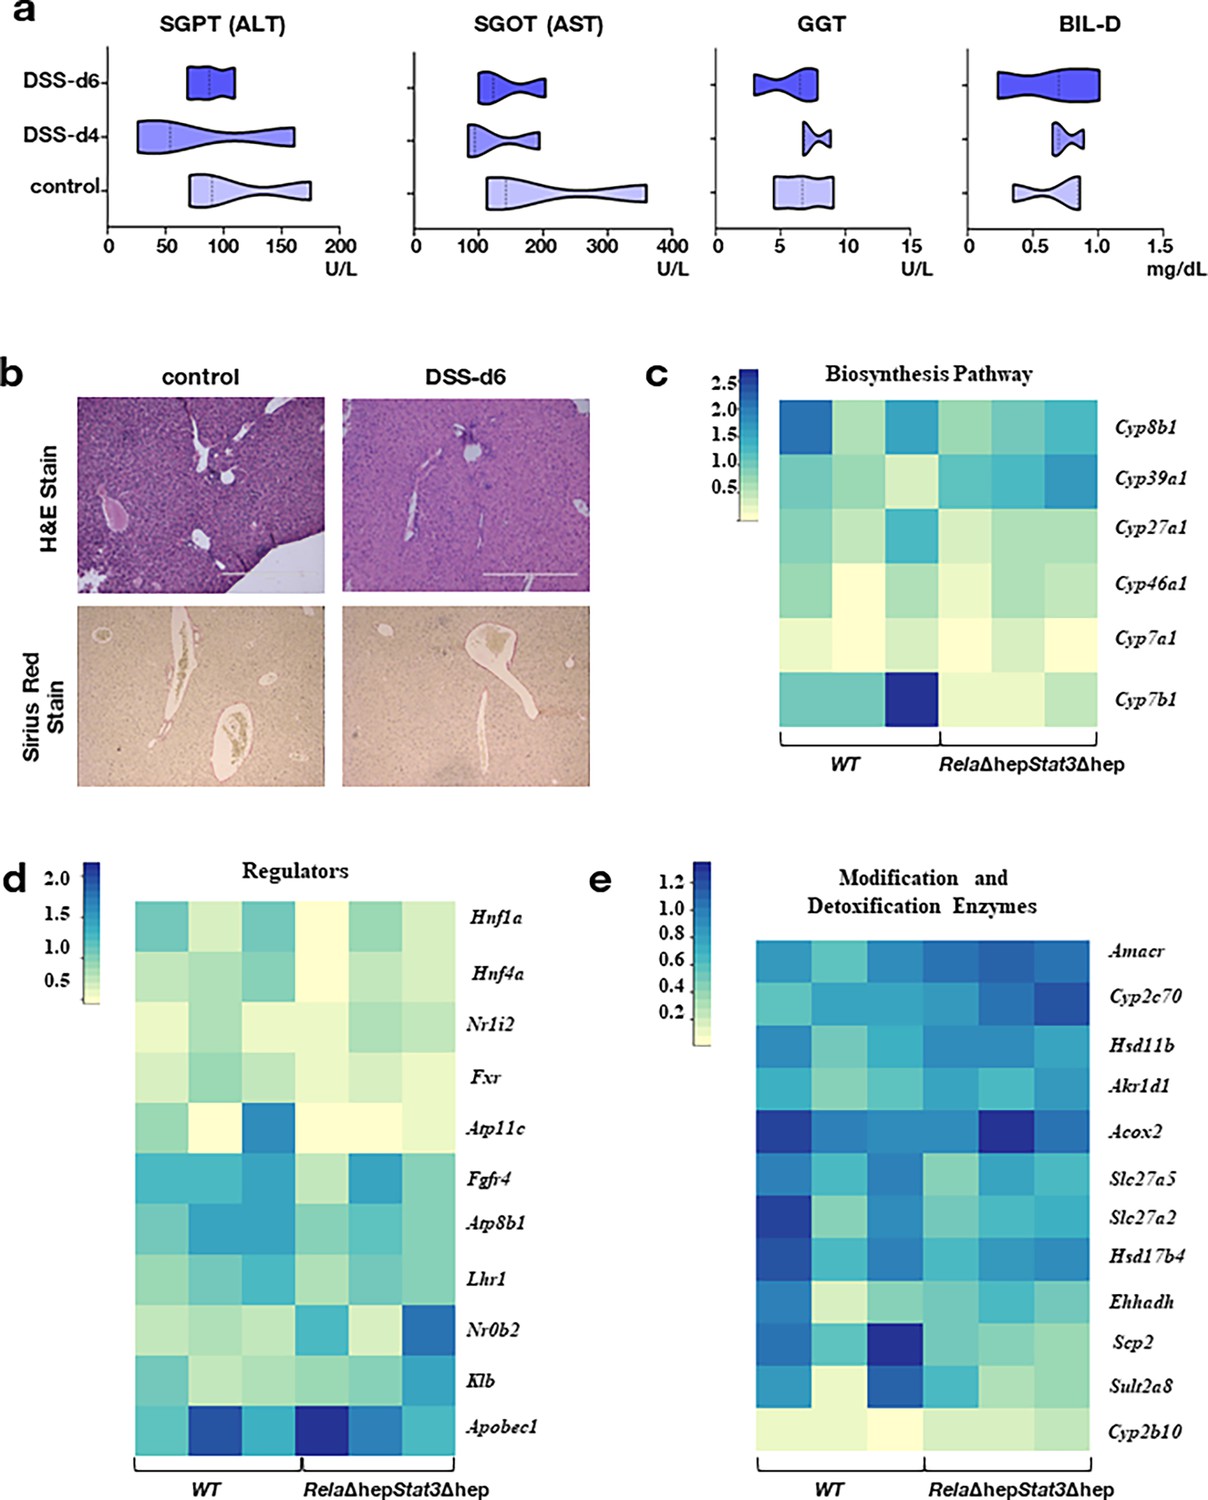
Analysis of biochemical and molecular parameters of colitogenic wildtype and RelaΔhepStat3Δhep mice.
(a) Violin plot comparing the clinical parameters in serum of untreated and dextran sodium sulfate (DSS)-treated RelaΔhepStat3Δhep mice (n=3) (b) Liver sections from untreated and DSS-treated RelaΔhepStat3Δhep mice were examined for histological features involving hematoxylin and eosin (H&E) staining [upper panel] and Sirius red staining [lower panel]. Data were obtained in 10 X magnification and represent three experimental replicates; two fields per section and a total of three sections from each set were examined. Heatmap represents relative transcript abundance of (c) biosynthesis pathway (d) regulators of bile acid metabolic pathways and (e) modification enzymes of bile acid metabolic pathway of indicated genotypes obtained from the RNA-seq experiment of three biological replicates.
-
Figure 3—figure supplement 1—source data 1
Data used for generating graph in Figure 3—figure supplement 1a.
- https://cdn.elifesciences.org/articles/93273/elife-93273-fig3-figsupp1-data1-v1.docx
Figure 4 with 1 supplement
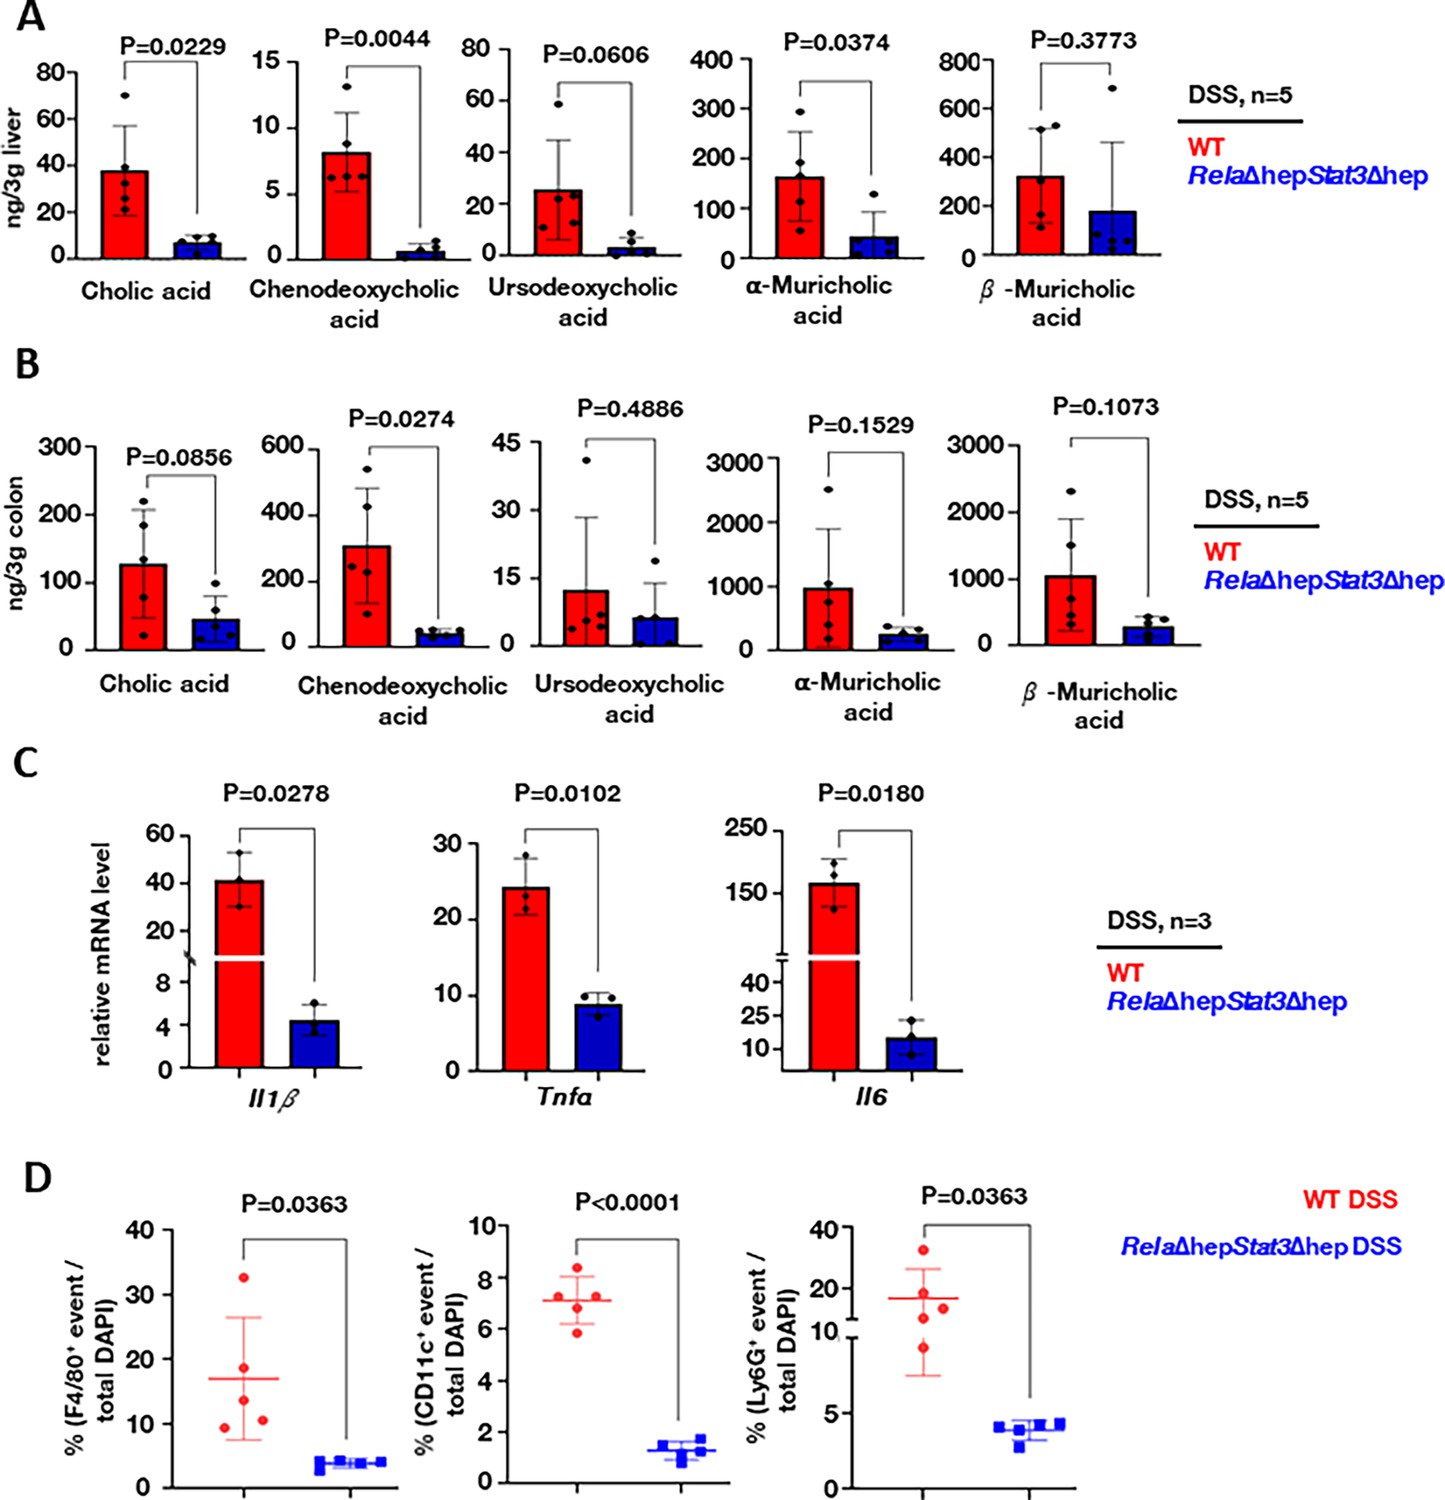
Altered accumulation of primary bile acids in RelaΔhepStat3Δhep mice accompanies a less severe inflammatory signature in the colitogenic gut.
Targeted LC-MS-based quantification of primary bile acid in the liver (A) and the colon (B) of dextran sodium sulfate (DSS)-treated wild-type and RelaΔhepStat3Δhep mice (n=5). (C) RT-qPCR analyses comparing the colonic abundance of indicated mRNAs encoding pro-inflammatory cytokines (n=3) for DSS-treated wild-type and RelaΔhepStat3Δhep mice. Fold change is relative to their corresponding wild-type littermates. (D) Dot-plot representing the frequency of F4/80+, CD11c+, and Ly6G+ cells among total DAPI-stained cells in the colon sections derived from DSS-treated wild-type and RelaΔhepStat3Δhep mice.
-
Figure 4—source data 1
Data used for generating graph in Figure 4A.
- https://cdn.elifesciences.org/articles/93273/elife-93273-fig4-data1-v1.docx
-
Figure 4—source data 2
Data used for generating graph in Figure 4B.
- https://cdn.elifesciences.org/articles/93273/elife-93273-fig4-data2-v1.docx
-
Figure 4—source data 3
Data used for generating graph in Figure 4C.
- https://cdn.elifesciences.org/articles/93273/elife-93273-fig4-data3-v1.docx
-
Figure 4—source data 4
Data used for generating graph in Figure 4D.
- https://cdn.elifesciences.org/articles/93273/elife-93273-fig4-data4-v1.docx
Figure 4—figure supplement 1
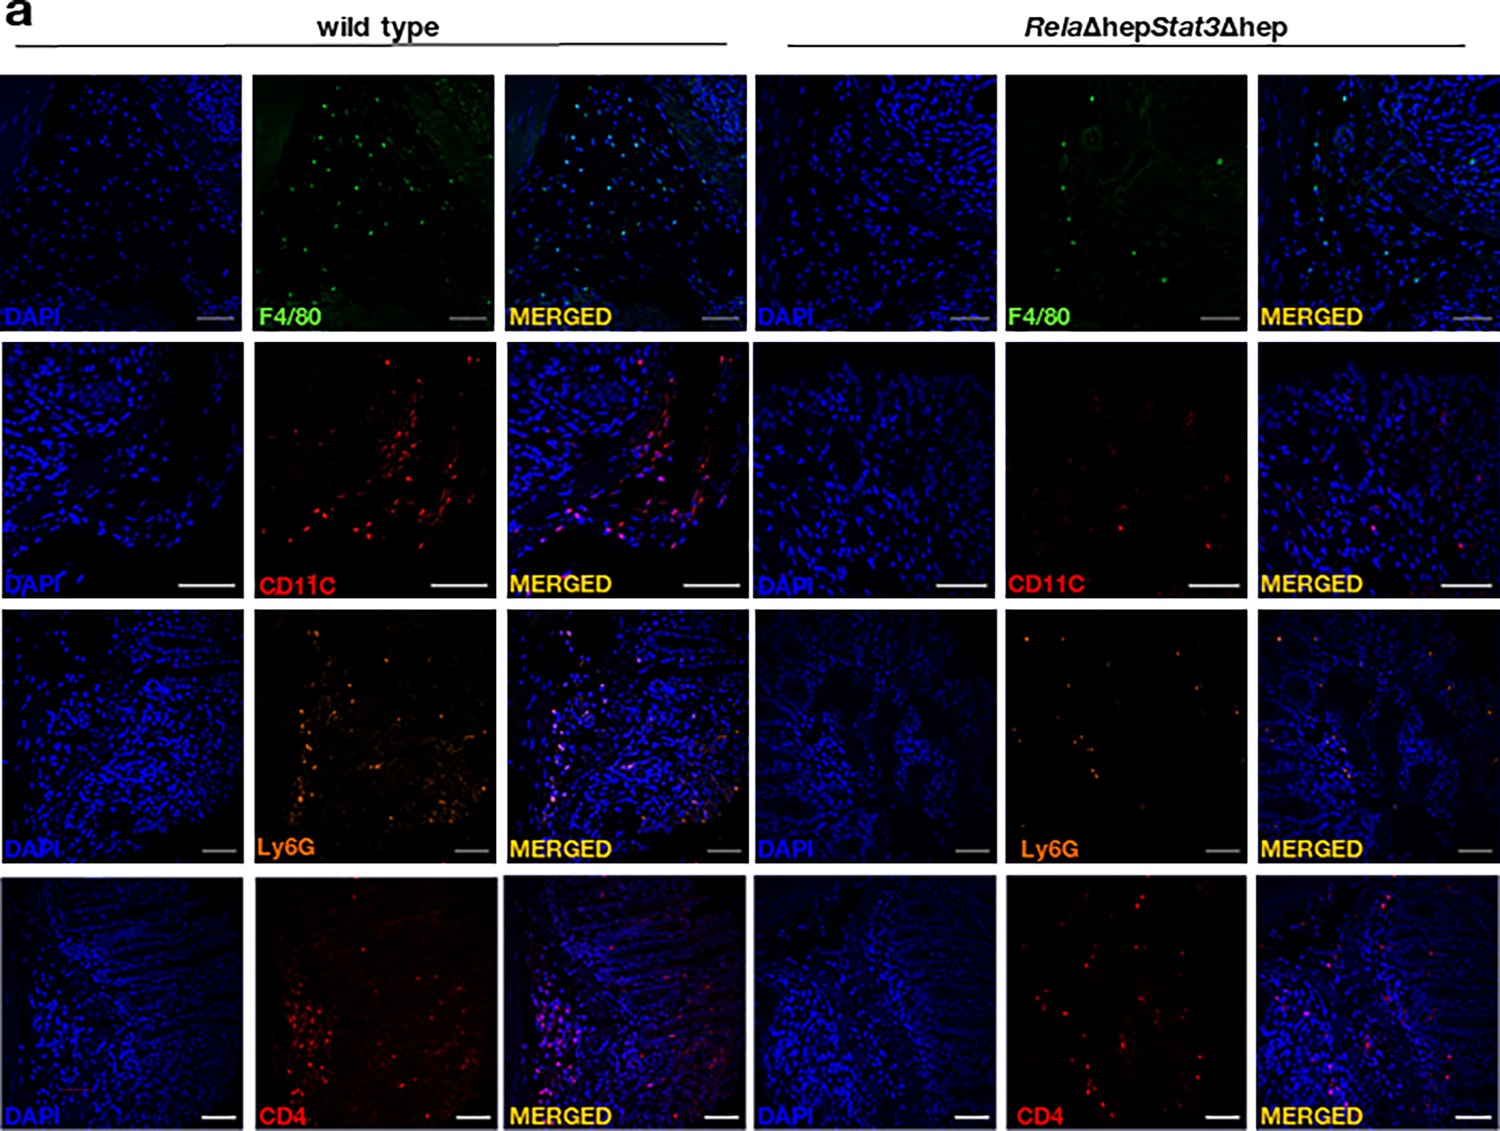
Microscopic analysis of immune cell infilteration in the colon of colitogenic mice.
(a) Representative images of colon tissue stained with indicated immune cell markers, DAPI, and merged section in the dextran sodium sulfate (DSS)-treated wild-type and RelaΔhepStat3Δhep mice. Scale represents 50 μm.
Figure 5 with 1 supplement
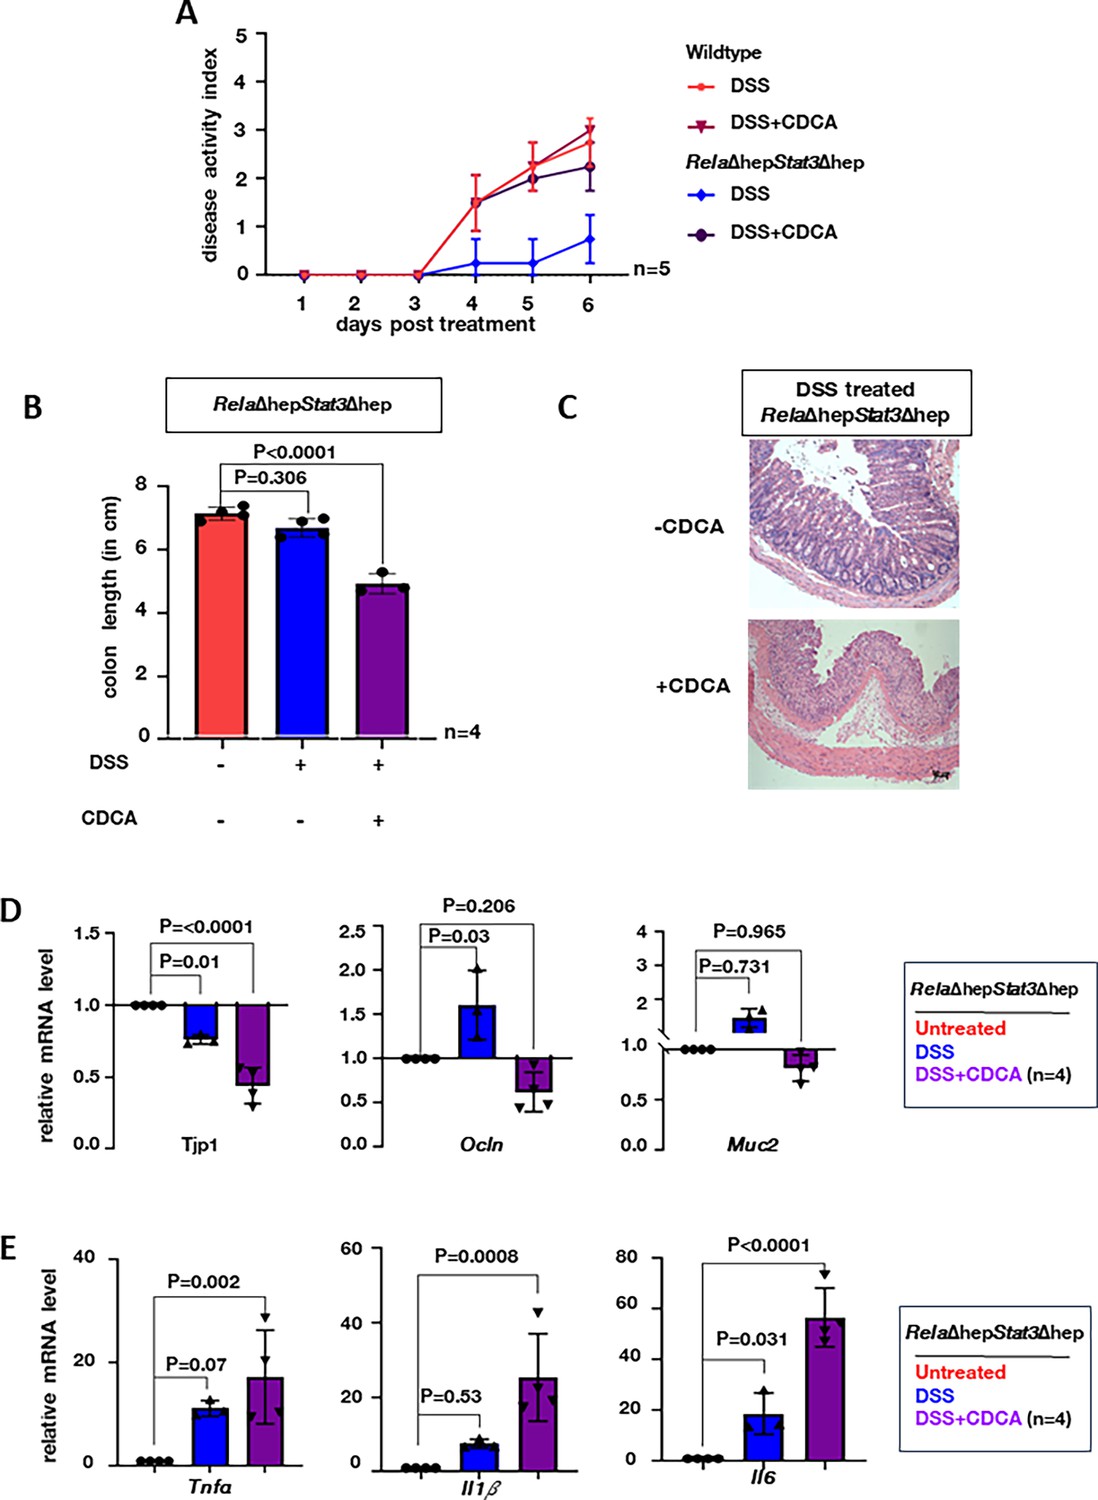
Supplementing chenodeoxycholic acid (CDCA) restores the colitogenic sensitivity in RelaΔhepStat3Δhep mice.
(A) Line plot charting the disease activity in a time course of wild-type and RelaΔhepStat3Δhep mice subjected to dextran sodium sulfate (DSS) treatment while being supplemented with 10 mg/kg CDCA daily. Mice devoid of CDCA supplementation were treated with DMSO as controls. (B) Bar plot comparing the colon length of RelaΔhepStat3Δhepmice subjected to DSS treatment for 6 days in the absence or presence of CDCA supplementation. (C) Hematoxylin and eosin (H&E) stained colon sections from DSS-treated RelaΔhepStat3Δhep mice with and without CDCA supplementation. Data were obtained in 10 X magnification, this is a representative of three experimental replicates and a total of four sections from each set were examined. RT-qPCR analyses comparing the colonic abundance of indicated mRNAs encoding (D) IEC-specific markers and (E) pro-inflammatory cytokines in mice subjected to DSS treatment for 6 days in the absence or presence of CDCA supplementation (n=4). Untreated RelaΔhepStat3Δhep mice were used as controls.
-
Figure 5—source data 1
Data used for generating graph in Figure 4A.
- https://cdn.elifesciences.org/articles/93273/elife-93273-fig5-data1-v1.docx
-
Figure 5—source data 2
Data used for generating graph in Figure 4B.
- https://cdn.elifesciences.org/articles/93273/elife-93273-fig5-data2-v1.docx
-
Figure 5—source data 3
Data used for generating graph in Figure 4D.
- https://cdn.elifesciences.org/articles/93273/elife-93273-fig5-data3-v1.docx
-
Figure 5—source data 4
Data used for generating graph in Figure 4E.
- https://cdn.elifesciences.org/articles/93273/elife-93273-fig5-data4-v1.docx
Figure 5—figure supplement 1
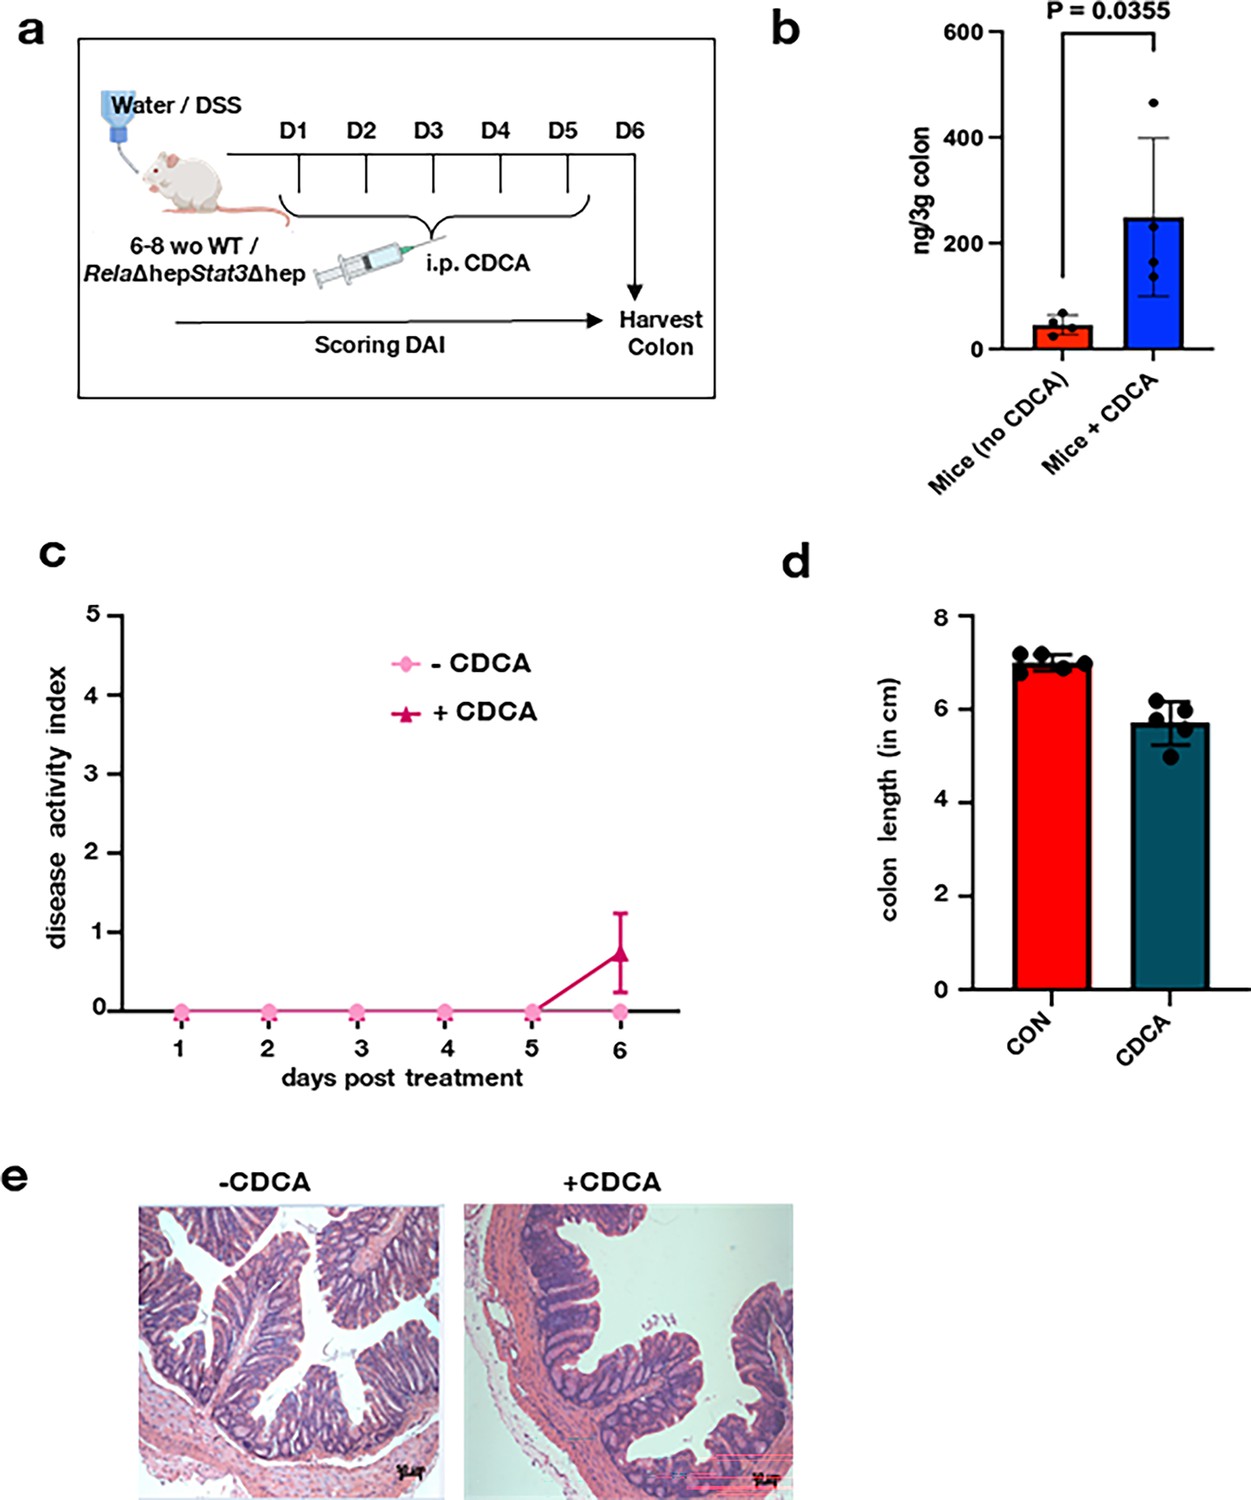
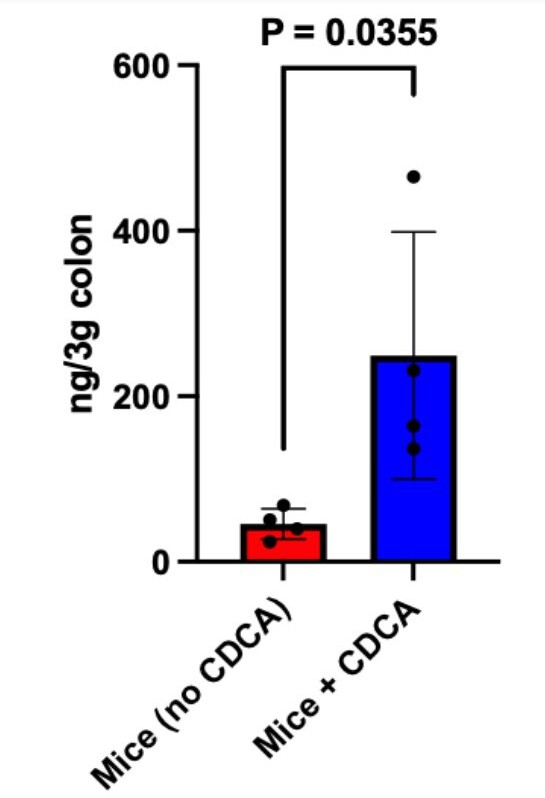
Supplementation of Chenodeoxycholic acid (CDCA) to the mice and its effect on gut.
(a) Schematic description of the experimental design describing the course of dextran sodium sulfate (DSS) treatment and chenodeoxycholic acid (CDCA) supplementation. (b) Quantification of CDCA in the colon of mice, that received intraperitoneal injection of either CDCA or DMSO (control), through targeted LC-MS experiments. (c) Line plot charting the disease activity in a time course of RelaΔhepStat3Δhep mice subjected to daily supplementation of 10 mg/kg CDCA. Mice devoid of CDCA supplementation were treated with DMSO as controls. (d) Bar plot comparing the colon length of RelaΔhepStat3Δhepmice subjected to CDCA supplementation. (e) Colon sections from RelaΔhepStat3Δhepmice supplemented with CDCA were examined by hematoxylin and eosin (H&E) staining.
-
Figure 5—figure supplement 1—source data 1
Data used for generating graph in Figure 5—figure supplement 1b.
- https://cdn.elifesciences.org/articles/93273/elife-93273-fig5-figsupp1-data1-v1.docx
-
Figure 5—figure supplement 1—source data 2
Data used for generating graph in Figure 5—figure supplement 1d.
- https://cdn.elifesciences.org/articles/93273/elife-93273-fig5-figsupp1-data2-v1.docx
Figure 6
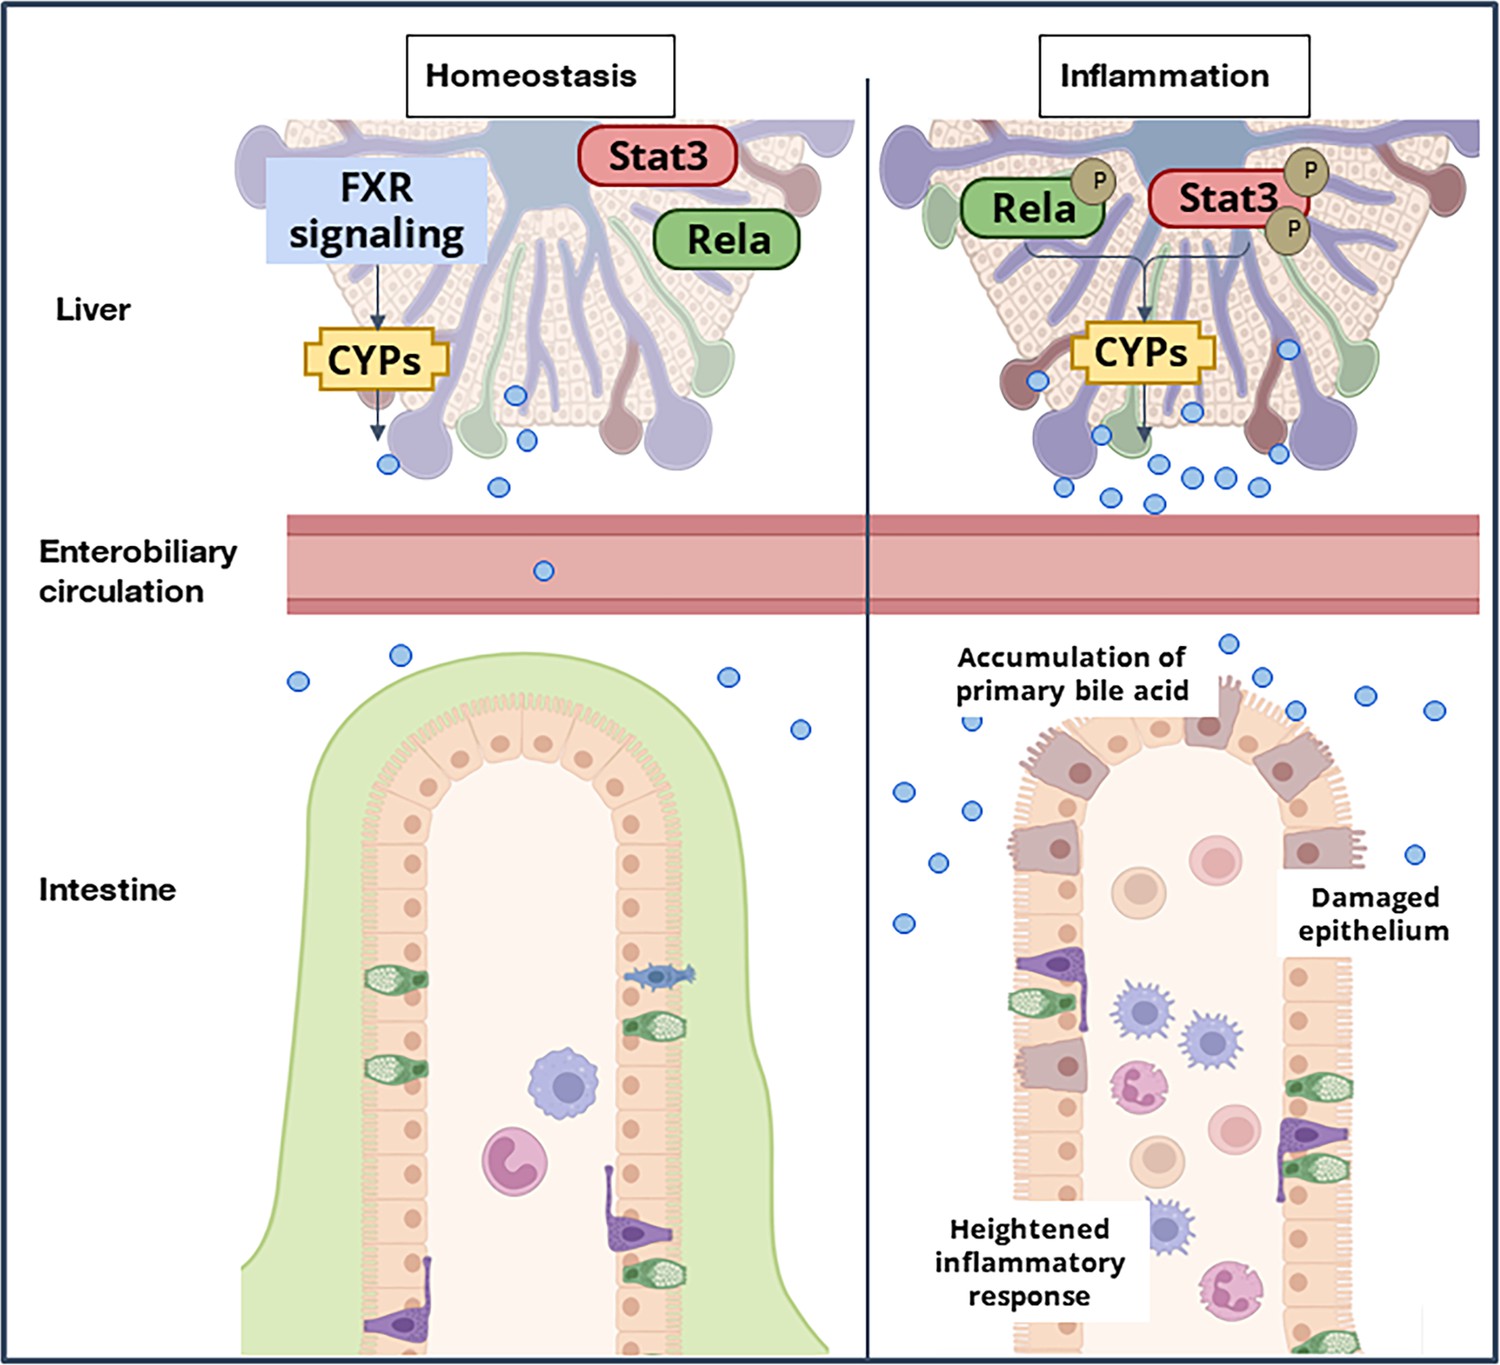
A model depicting the immuno-metabolic network linking the inflammation-induced hepatic signaling pathway to intestinal pathologies in mice.
Author response image 1
Author response image 2
Author response image 3
Author response image 4

Author response image 5

Author response image 6
Author response image 7
Author response image 8
Author response image 9

Tables
Key resources table
| Reagent type (species) or resource | Designation | Source or reference | Identifiers | Additional information |
|---|---|---|---|---|
| Strain, strain background (Mus musculus) | Alb-Cre Rela-/- Stat3-/- | A gift from Dr. Lee Quinton’s lab at Boston University | C57BL/6 | |
| Strain, strain background (Mus musculus) | Relafl/fl Stat3fl/fl | A gift from Dr. Lee Quinton’s lab at Boston University | C57BL/6 | |
| Strain, strain background (Mus musculus) | Alb-Cre Rela-/- | A gift from Dr. Lee Quinton’s lab at Boston University | C57BL/6 | |
| Strain, strain background (Mus musculus) | Relafl/fl | A gift from Dr. Lee Quinton’s lab at Boston University | C57BL/6 | |
| Strain, strain background (Mus musculus) | Alb-Cre Stat3-/- | A gift from Dr. Lee Quinton’s lab at Boston University | C57BL/6 | |
| Strain, strain background (Mus musculus) | Stat3fl/fl | A gift from Dr. Lee Quinton’s lab at Boston University | C57BL/6 | |
| Antibody | anti-mouse Ly-6G-PE (Rat monoclonal) | BD Biosciences | Cat# 551461, RRID: AB_394208 | IF (1:500) |
| Antibody | anti-mouse F4/80-FITC (Mouse Polyclonal) | BioLegend | Cat# 157309, RRID: AB_2876535 | IF (1:500) |
| Antibody | anti-mouse CD11c-PE (Hamster monoclonal) | BioLegend | Cat# 117308, RRID: AB_313777 | IF (1:500) |
| Antibody | anti-mouse CD4-PE (Rat monoclonal) | BioLegend | Cat# 100408, RRID: AB_312693 | IF (1:500) |
| Antibody | anti-mouse STAT3 (mouse monoclonal) | ThermoFisher Scientific | Cat# MA1-13042, RRID: AB_10985240 | IF (1:100) WB (1:1000) |
| Antibody | anti-mouse Rela (Rabbit polyclonal) | Santa Cruz Biotechnology | Cat# sc372, RRID: AB_632037 | IF (1:100) WB (1:1000) |
| Antibody | anti-mouse Phospho-Stat3 (Ser727) (Rabbit monoclonal) | Cell Signaling Technology | Cat# 34911, RRID: AB_2737598 | IF (1:100) WB (1:1000) |
| Antibody | anti-mouse Phospho-Stat3 (Ser727) (Rabbit monoclonal) | Cell Signaling Technology | Cat# 34911, RRID: AB_2737598 | IF (1:100) WB (1:1000) |
| Antibody | anti-mouse Phospho-Stat3 (Tyr705) (Rabbit monoclonal) | Cell Signaling Technology | Cat# 34911, RRID: AB_2737598 | IF (1:100)tjp WB (1:1000) |
| Antibody | anti-mouse Phospho-NF-κB p65 (Ser536) (Rabbit polyclonal) | Cell Signaling Technology | Cat# 3031, RRID: AB_330559 | WB (1:1000) |
| Antibody | anti-mouse GAPDH (Rabbit monoclonal) | Cell Signaling Technology | Cat# 2118, RRID: AB_561053 | WB (1:1000) |
| Antibody | anti-mouse β-Actin (Rabbit polyclonal) | Cell Signaling Technology | Cat# 4967, AB_330288 | WB (1:1000) |
| Antibody | anti-rabbit IgG (H+L) Secondary Antibody Alexa Fluor Plus 555 (Goat polyclonal) | Thermo Fisher Scientific | Cat# A32732, AB_2633281 | IF (1:2000) |
| Sequence-based reagent | Tjp1_F | This paper | PCR primer | GCTTTAGCGAACAGAAGGAGC |
| Sequence-based reagent | Tjp1_R | This paper | PCR primer | TTCATTTTTCCGAGACTTCACCA |
| Sequence-based reagent | Ocln_F | This paper | PCR primer | TGAAAGTCCACCTCCTTACAGA |
| Sequence-based reagent | Ocln_R | This paper | PCR primer | CCGGATAAAAAGAGTACGCTGG |
| Sequence-based reagent | Muc2_F | This paper | PCR primer | AGGGCTCGGAACTCCAGAAA |
| Sequence-based reagent | Muc2_R | This paper | PCR primer | CCAGGGAATCGGTAGACATCG |
| Sequence-based reagent | Tff3_F | This paper | PCR primer | TTGCTGGGTCCTCTGGGATAG |
| Sequence-based reagent | Tff3_R | This paper | PCR primer | TACACTGCTCCGATGTGACAG |
| Sequence-based reagent | Il1b_F | This paper | PCR primer | CATCCCATGAGTCACAGAGGATG |
| Sequence-based reagent | Il1b_R | This paper | PCR primer | ACCTTCCAGGATGAGGACATGAG |
| Sequence-based reagent | Tnf_F | This paper | PCR primer | CTGAACTTCGGGGTGATCGG |
| Sequence-based reagent | Tnf_R | This paper | PCR primer | GGCTTGTCACTCGAATTTTGAGA |
| Sequence-based reagent | Il6_F | This paper | PCR primer | CCCCAATTTCCAATGCTCTCC |
| Sequence-based reagent | Il6_R | This paper | PCR primer | GGATGGTGTTGGTCCTTAGCC |
| Sequence-based reagent | Gapdh_F | This paper | PCR primer | AGGTCGGTGTGAACGGATT |
| Sequence-based reagent | Gapdh_R | This paper | PCR primer | AATCTCCACTTTGCCACTGC |
| Sequence-based reagent | Cyp7a1_F | This paper | PCR primer | GCTGTGGTAGTGAGCTGTTG |
| Sequence-based reagent | Cyp7a1_R | This paper | PCR primer | GTTGTCCAAAGGAGGTTCACC |
| Sequence-based reagent | Cyp8b1_F | This paper | PCR primer | CCTCTGGACAAGGGTTTTGTG |
| Sequence-based reagent | Cyp8b1_R | This paper | PCR primer | GCACCGTGAAGACATCCCC |
| Sequence-based reagent | Cyp27a1_F | This paper | PCR primer | AGGGCAAGTACCCAATAAGAGA |
| Sequence-based reagent | Cyp27a1_R | This paper | PCR primer | TCGTTTAAGGCATCCGTGTAGA |
| Sequence-based reagent | Cyp7b1_F | This paper | PCR primer | TCCTGGCTGAACTCTTCTGC |
| Sequence-based reagent | Cyp7b1_R | This paper | PCR primer | CCAGACCATATTGGCCCGTA |
| Sequence-based reagent | Cre_F | This paper | PCR primer | GGTGAACGTGCAAAACAGGCTC |
| Sequence-based reagent | Cre_R | This paper | PCR primer | AAAACAGGTAGTTATTCGGATCATCAGC |
| Sequence-based reagent | Tcrd_F | This paper | PCR primer | CAAATGTTGCTTGTCTGGTG |
| Sequence-based reagent | Tcrd_R | This paper | PCR primer | GTCAGTCGAGTGCACAGTTT |
| Sequence-based reagent | Stat3flox_F | This paper | PCR primer | CCTGAAGACCAAGTTCATCTGTGTTGAC |
| Sequence-based reagent | Stat3flox_R | This paper | PCR primer | CACACAAGCCATCAAACTCTGGTCTCC |
| Sequence-based reagent | Relaflox_F | This paper | PCR primer | GAGCGCATGCCTAGCACCAG |
| Sequence-based reagent | Relaflox_R | This paper | PCR primer | GTGCACTGCATGCGTGCAG |
| Chemical compound, drug | Dextran sulphate sodium salt | Sigma-Aldrich | Cat# 42867 | |
| Chemical compound, drug | Fluorescein isothiocyanate-dextran | Sigma-Aldrich | Cat# 60842-46-8 | |
| Chemical compound, drug | Chenodeoxycholic acid | Sigma-Aldrich | Cat# C9377 | |
| Chemical compound, drug | DAPI | Sigma-Aldrich | Cat# D9542 | |
| Chemical compound, drug | PowerUp SYBR | Thermo Fisher Scientific | Cat# A25742 | |
| Chemical compound, drug | Fluorosheild | Sigma-Aldrich | Cat# F6182 | |
| Commercial assay or kit | NucleoSpin RNA | Macherey-Nagel | Cat# 74106 | |
| Commercial assay or kit | Primescript 1st strand cDNA synthesis kit | Takara Bio | Cat# 6110 A | |
| Software, algorithm | Prism 9 | GraphPad | 9.0 |
Author response table 1
| The total number of nuclei analyzed | 90th percentile of signal intensity for control samples | Nuclei of DSS-treated sections with signal intensity above the 90th percentile | Percentage overlap | |
|---|---|---|---|---|
| For Rela probed samples | 29 | 3.465 | 27 | 100 |
| For Stat3 probed samples | 29 | 2.935 | 29 | 93 |
Additional files
Download links
A two-part list of links to download the article, or parts of the article, in various formats.
Downloads (link to download the article as PDF)
Open citations (links to open the citations from this article in various online reference manager services)
Cite this article (links to download the citations from this article in formats compatible with various reference manager tools)
A hepatocyte-specific transcriptional program driven by Rela and Stat3 exacerbates experimental colitis in mice by modulating bile synthesis
eLife 12:RP93273.
https://doi.org/10.7554/eLife.93273.3


