The potential of inversions to accumulate balanced sexual antagonism is supported by simulations and Drosophila experiments
- Laboratory of Genetics, University of Wisconsin, United States
Figures
Figure 1
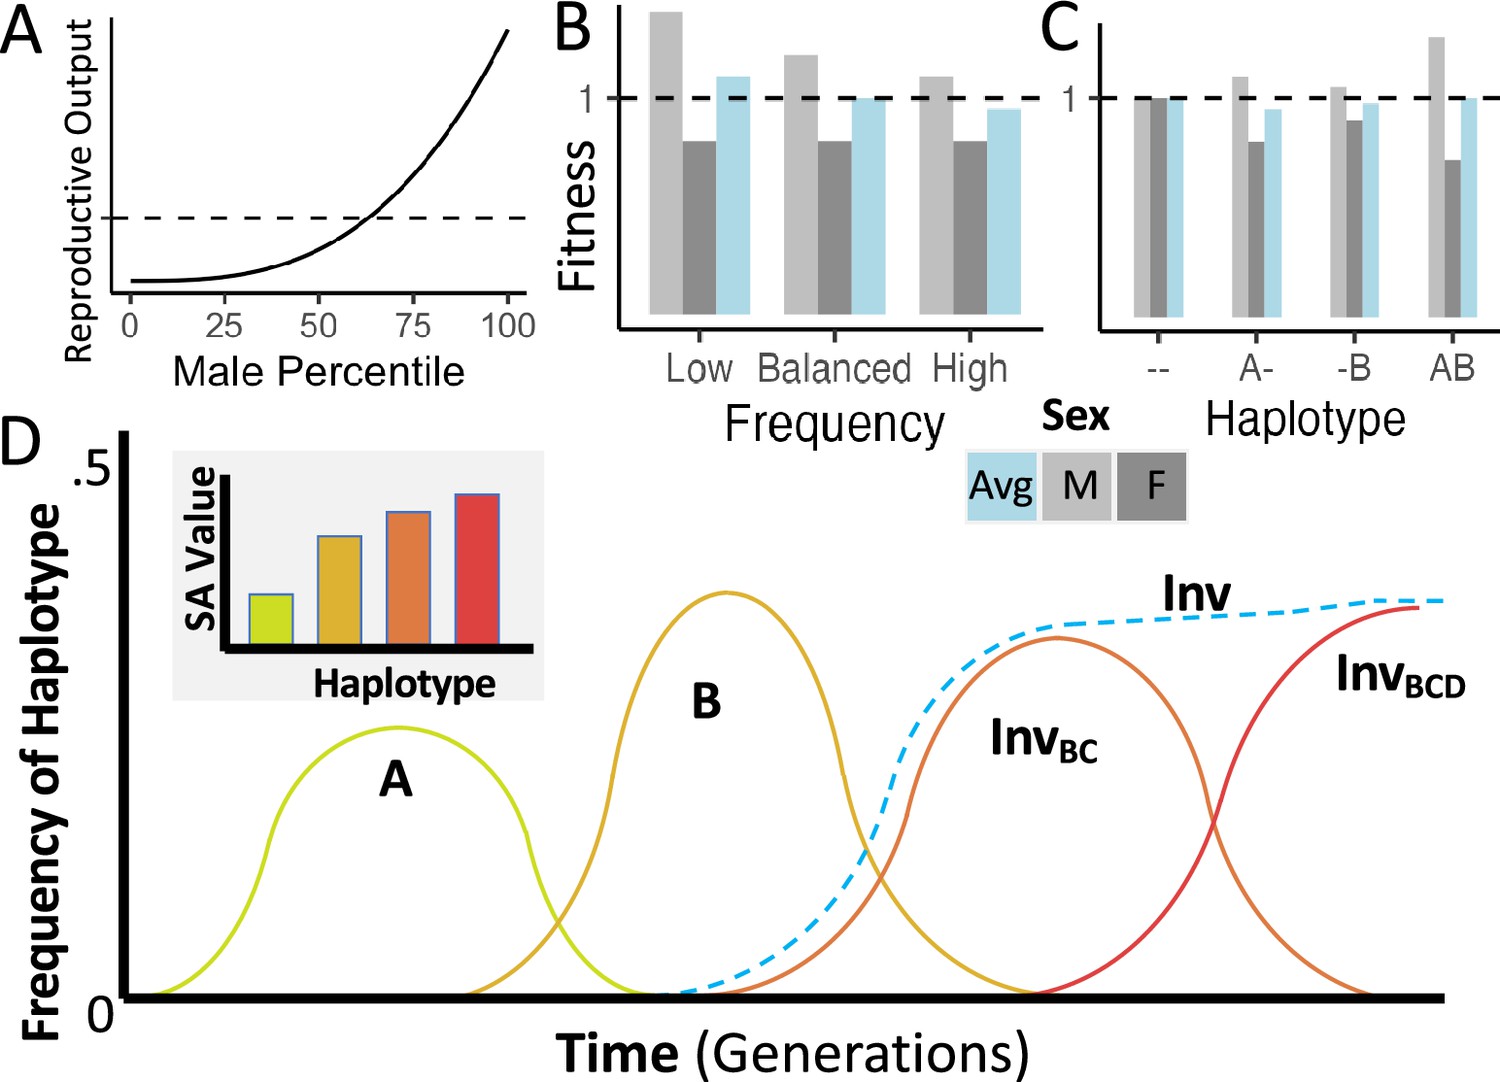
Conceptual representations of the proposed model of inversion-associated balanced sexual antagonism.
(A) Hypothetical skewed distribution of male mating success, yielding a greater variance in reproductive success for males than for females, such as expected under a ‘best of n’ mate choice model. (B) Fitnesses of display-favoring alleles under sexually antagonistic balancing selection, illustrating a pleiotropic variant that should rise in frequency when rare, but decline if frequency exceeds the balanced equilibrium value. (C) Fitnesses of display-favoring alleles at two haploid loci under the same model, illustrating synergistic epistasis between displaying-favoring alleles. (D) A hypothetical trajectory of four such mutations, in which B outcompetes A, an inversion links B and C to create a more strongly display-favoring haplotype, and then the addition of D to that haplotype furthers the accumulation of antagonistic variants, reaching an equilibrium frequency while displacing less extreme display-favoring haplotypes.
Figure 2
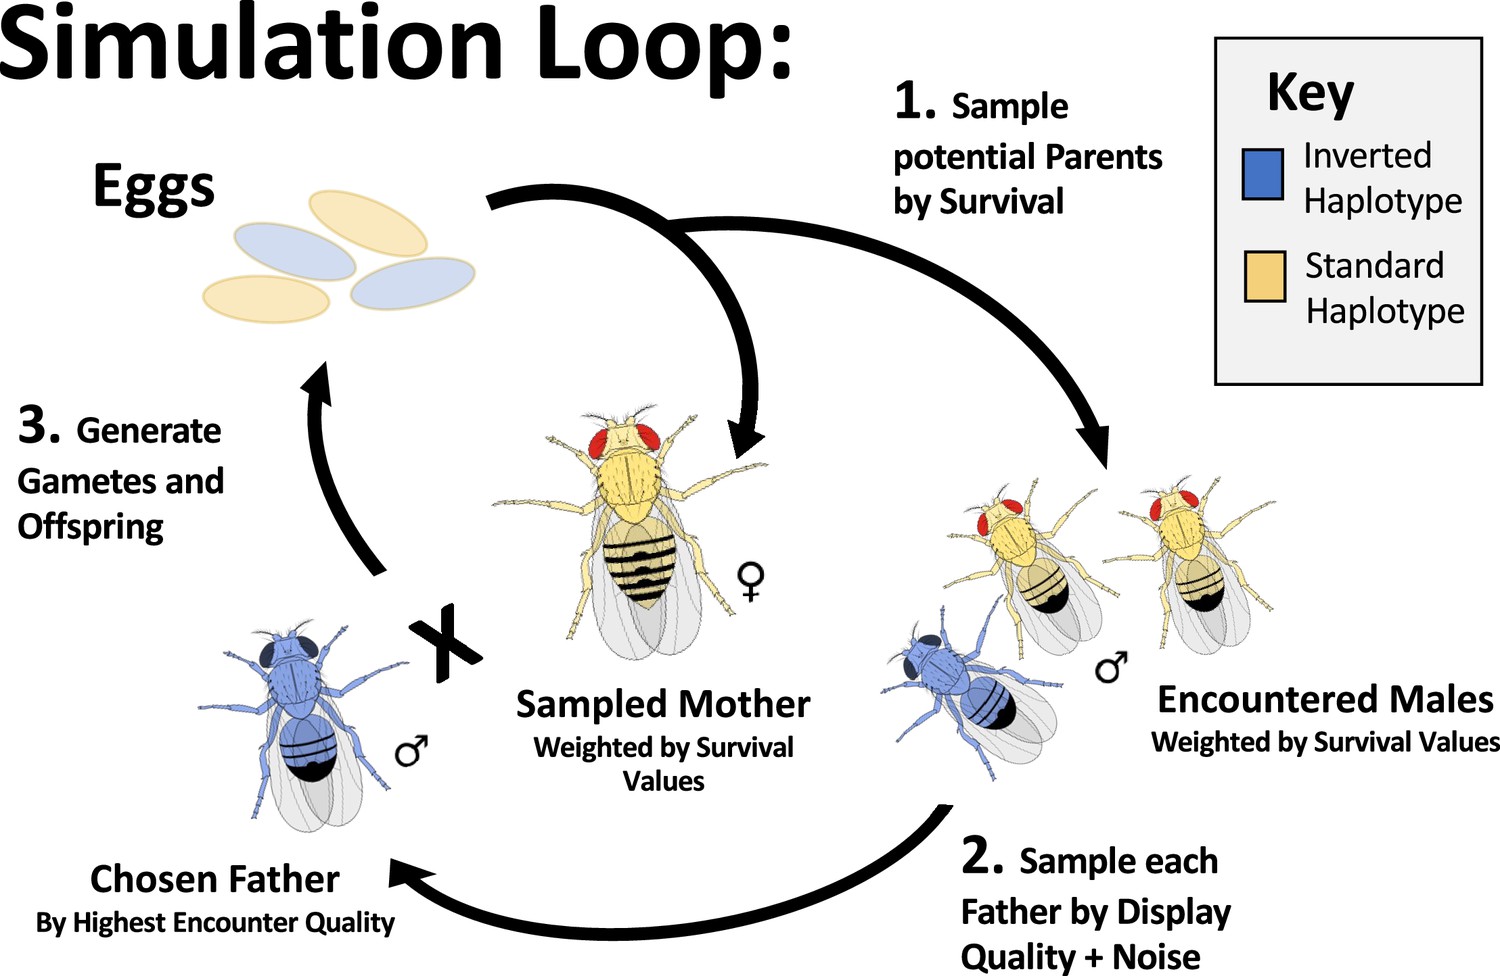
The layout of a single simulated generation.
Simulated individuals each reach the reproductive stage with probability in proportion to the product of the survival effects of their alleles. To generate each offspring in the next generation, a surviving female is first randomly sampled (with replacement) to be the mother. Then a specified number of surviving males are randomly sampled to generate the pool of males encountered by the sampled female for the best of n mate choice – without replacement for each pool and with replacement between pools. Unless otherwise noted, we defaulted to 100 encountered males in simulations presented here. For each encounter pool, each male is assigned an observed display quality as the sum of the display effects of its alleles, plus a normally distributed noise effect for each encounter. The highest quality male in the encounter pool is selected as the father, and the offspring genome is generated. The female gamete is generated with crossover and gene conversion events. Odd numbers of crossovers in the interior of an inversion are resampled from the same parent, to model the biology of an organism that eliminates aneuploid gametes during oogenesis or exhibits reproductive compensation. D. melanogaster males do not cross-over, and so males do not recombine in the simulations presented.
Figure 3 with 1 supplement
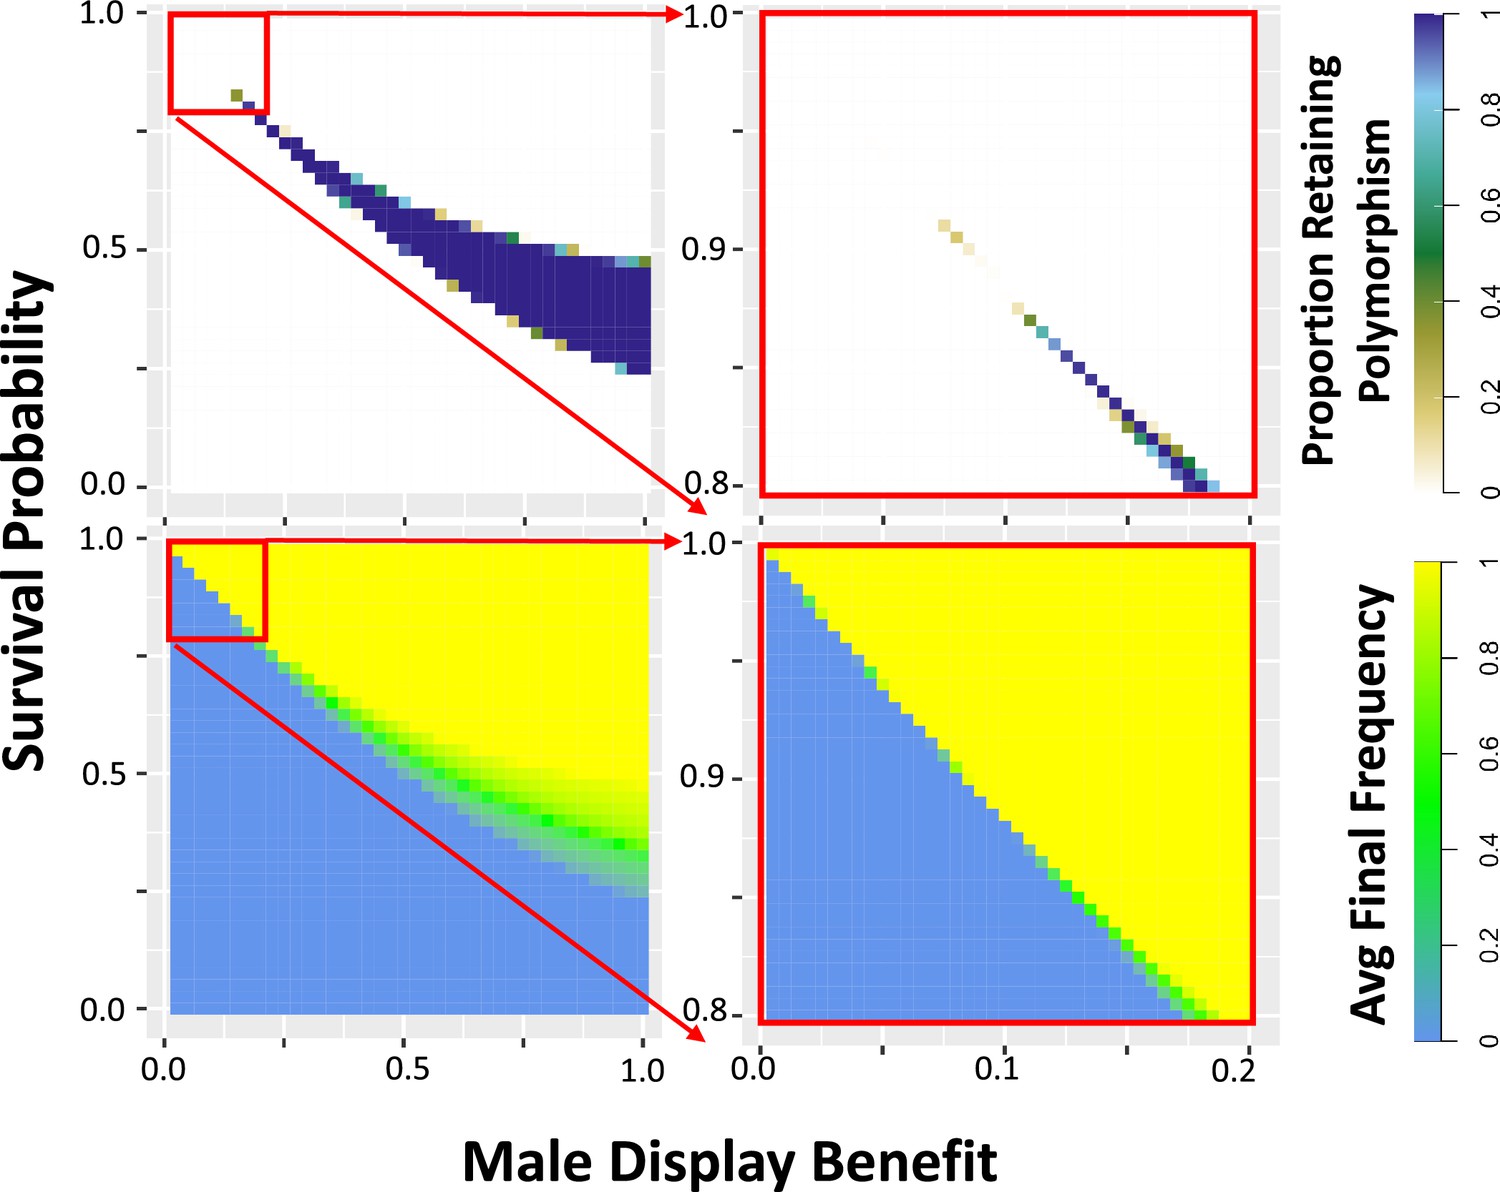
Simulations show that a balanced equilibrium frequency exists for certain sexually antagonistic variants.
The proportion of simulations retaining polymorphism (top) and the average final frequency (bottom) are plotted for a single locus at which there is one antagonistic allele with the indicated effects reducing survival proportion (of both sexes) and increasing male reproductive quality score, initiated at equal frequency with an alternative allele that has no such effects. Larger values of both effect sizes are plotted in the left panels, with values incrementing by 0.025, and smaller effect sizes (a subset of the larger) are plotted in greater detail in the right panels, with values incrementing by 0.005. Reproductive quality contributes to male success in a best of 100 mate competition with an added normally distributed noise effect of standard deviation 1 (Figure 2; Materials and methods). See Figure 3—figure supplement 1 for plots with sex-specific costs and differing encounter numbers in the best of n mate competition. Most parameters result in either all simulations retaining polymorphism (purple), or else all simulations losing polymorphism (white). However, simulations retaining polymorphism have a broad range of equilibrium frequencies (shades of green). For each parameter combination, 500 replicates were simulated for a diploid population of 1000 individuals evolving for 20,000 generations, with further details as indicated in the Materials and Methods.
Figure 3—figure supplement 1
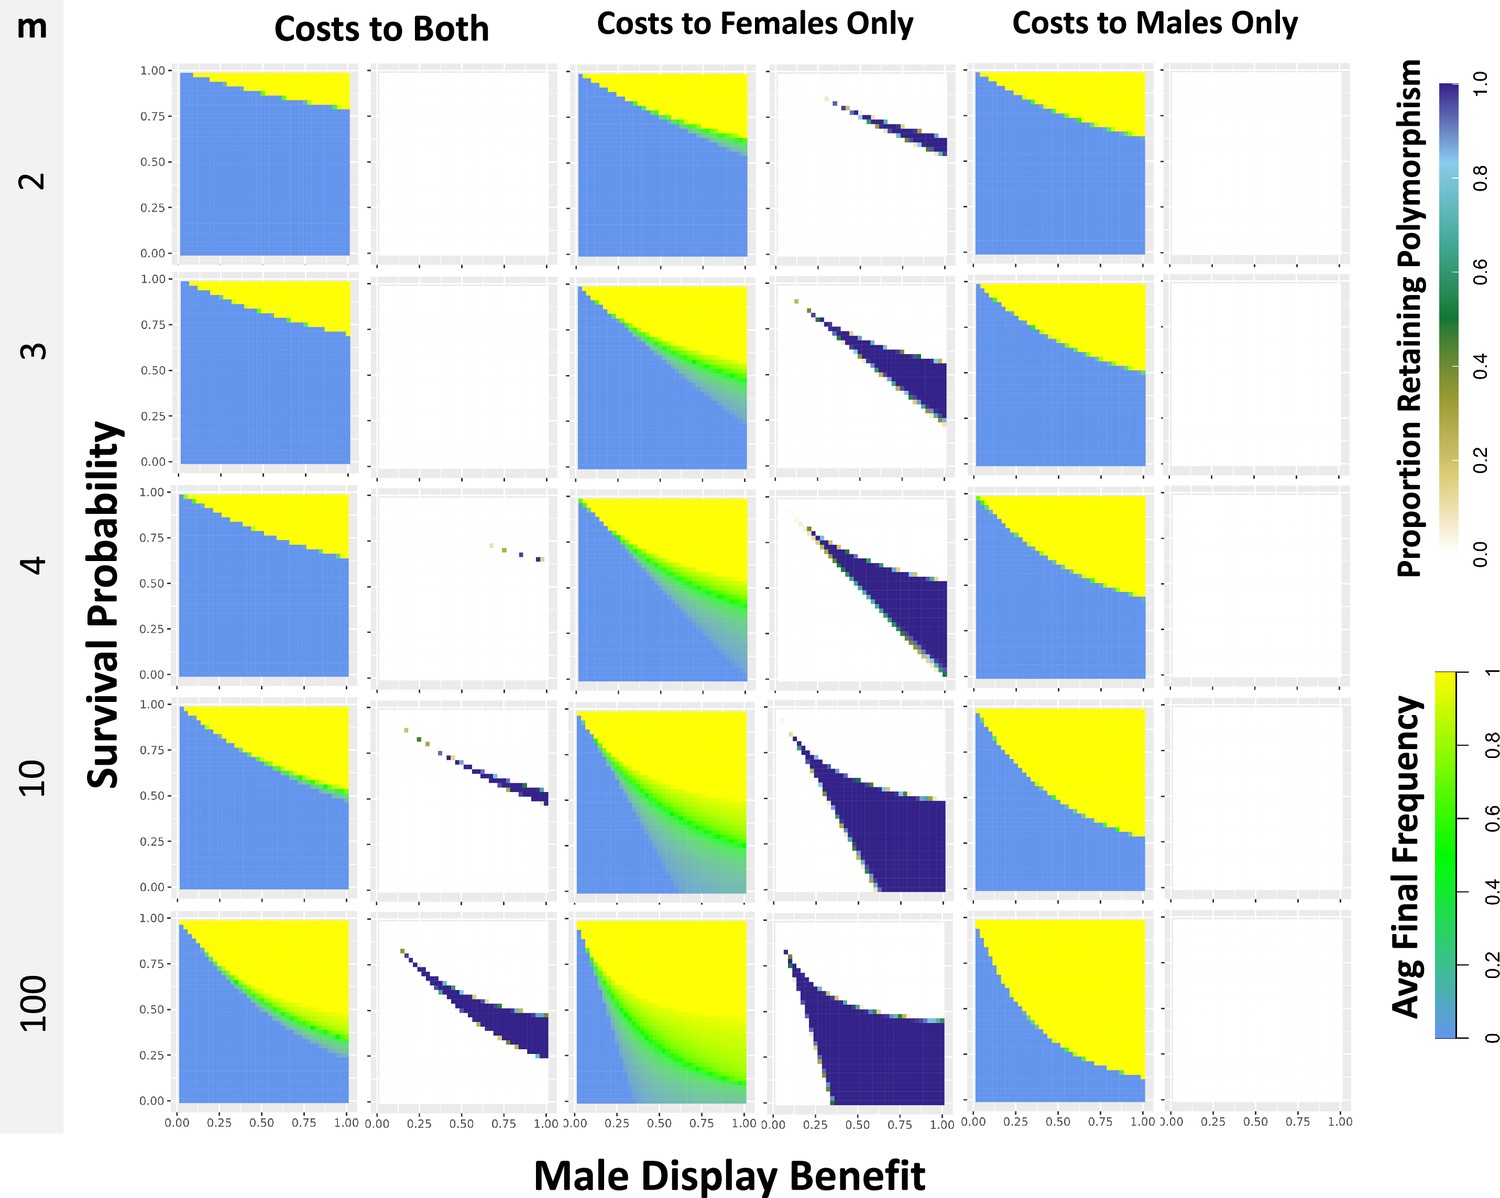
Single locus simulations under differing models exhibit shifts in the parameter combinations that produce balancing selection.
Each pixel in the heat-map plots represents 100 simulations of a population with a single polymorphic mutation of a given survival probability and display value that began at 0.5 frequency. Plots show either the average frequency of the mutation across simulations at 20 N generations (left panels; green indicates intermediate balanced frequencies), or the proportion of simulations retaining polymorphism at 20 N generations (right panels; dark blue indicates all or nearly all simulations retaining polymorphism). Plots are separated into columns based on whether the simulations assign survival costs to both sexes or to either sex individually. Plots are separated into rows by the number of males m encountered by each female during mate choice. Simulations have a population size of 1,000 individuals simulated for 20,000 generations, with further details as indicated in the Materials and methods.
Figure 4 with 1 supplement
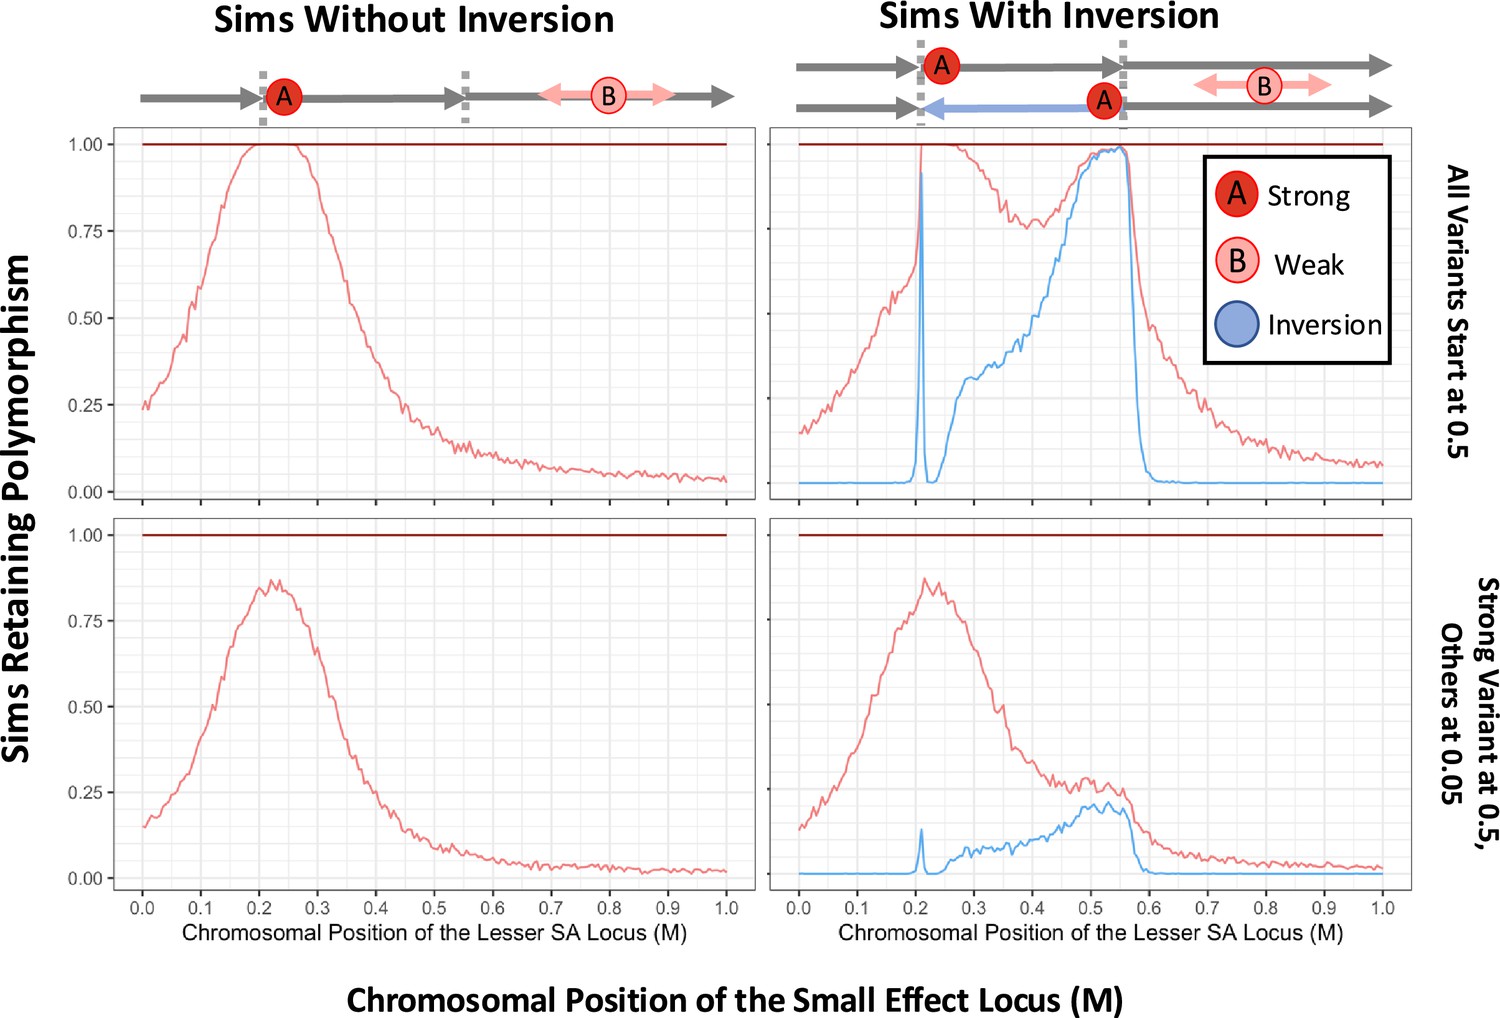
Simulated inversions may persist as polymorphisms when linked to sexually antagonistic, pleiotropic variants.
In turn, the presence of inversions facilitates the accumulation of antagonistic variation, demonstrating synergistic epistasis. Rates of long-term persistence are shown for simulations with two defined antagonistic variants alone (left panels) and with the additional presence of a defined inversion (right panels). To focus the potential addition of a second linked variant to an antagonistic haplotype, we begin with the stronger variant already at an intermediate frequency in the population (0.5). The weaker antagonistic variant and the inversion either both start at 0.5 frequency as well (upper row) or both start at a lower frequency of 0.05 (lower row), with all variants initially in linkage equilibrium. The 1 Morgan chromosomal segment is diagrammed above the plots, with the inversion breakpoints marked (0.21 M, 0.55 M), chosen to include space across and beyond the inverted region. The proportion of simulations in which the second, variably positioned weaker antagonistic variant (survival and reproductive values 0.86, 0.12) maintains polymorphism is shown (light red line), dependent on the recombination distance from a stronger allele (0.75, 0.3) at fixed position 0.225 M, which always persists (dark red line at 1 across the top of each plot). In the right panels, the proportion of replicates in which the inversion is retained is also plotted (blue line). Values for each parameter combination were averaged over 1000 replicate simulations, for populations of 1000 diploid individuals run for 20 N generations. Gene conversion occurs for each heterozygous variant at a probability of 10–2 per female meiosis with random direction. Crossover arrangements generating aneuploidy, where there are an odd number of crossovers within the inverted region of a heterokaryotypic parent, are resampled from the same parent to represent removal to polar bodies or reproductive compensation.
Figure 4—figure supplement 1
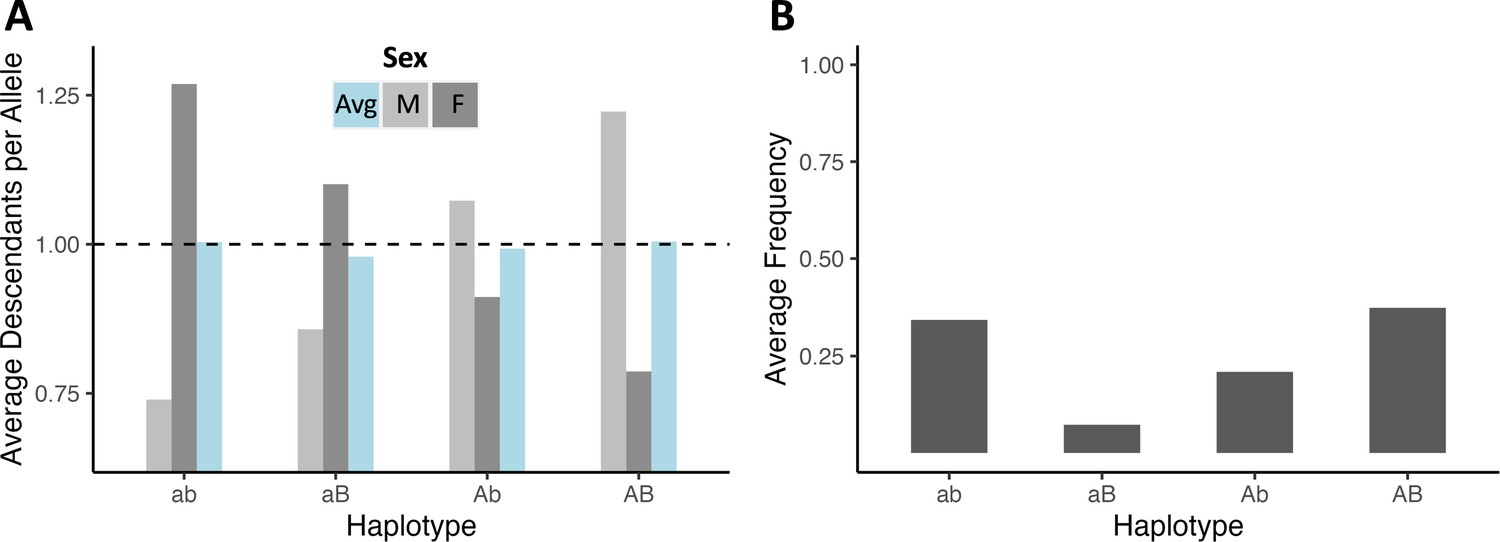
After 20 N generations of simulation, populations approach an equilibrium in which the haplotypes with both display-favoring or both survival-favoring variants are most fit, and selection removes recombinant haplotypes, maintaining high linkage.
(A) The number of descendant haplotypes per haplotype for each haplotype class averaged across all 1000 simulations, plotted for both sexes and within females and males separately. From the reproductive values across both sexes (1.0038, 0.9793, 0.9926, 1.0047) haplotypes with both display-favoring or survival-favoring variants are favored over haplotypes conveying intermediate trait values. (B) The average frequency of each haplotype class in its population across simulations. Haplotypes with intermediate trait values are maintained at low frequency under a balance of recombination and selection (0.3433, 0.0728, 0.2093, 0.3746), generating considerable linkage disequilibrium (r2=0.2139). These simulations reflect one of the scenarios depicted in Figure 4A, in which the larger and smaller effect alleles were positioned at 0.225 M and 0.250 M respectively, and no inversion was present.
Figure 5
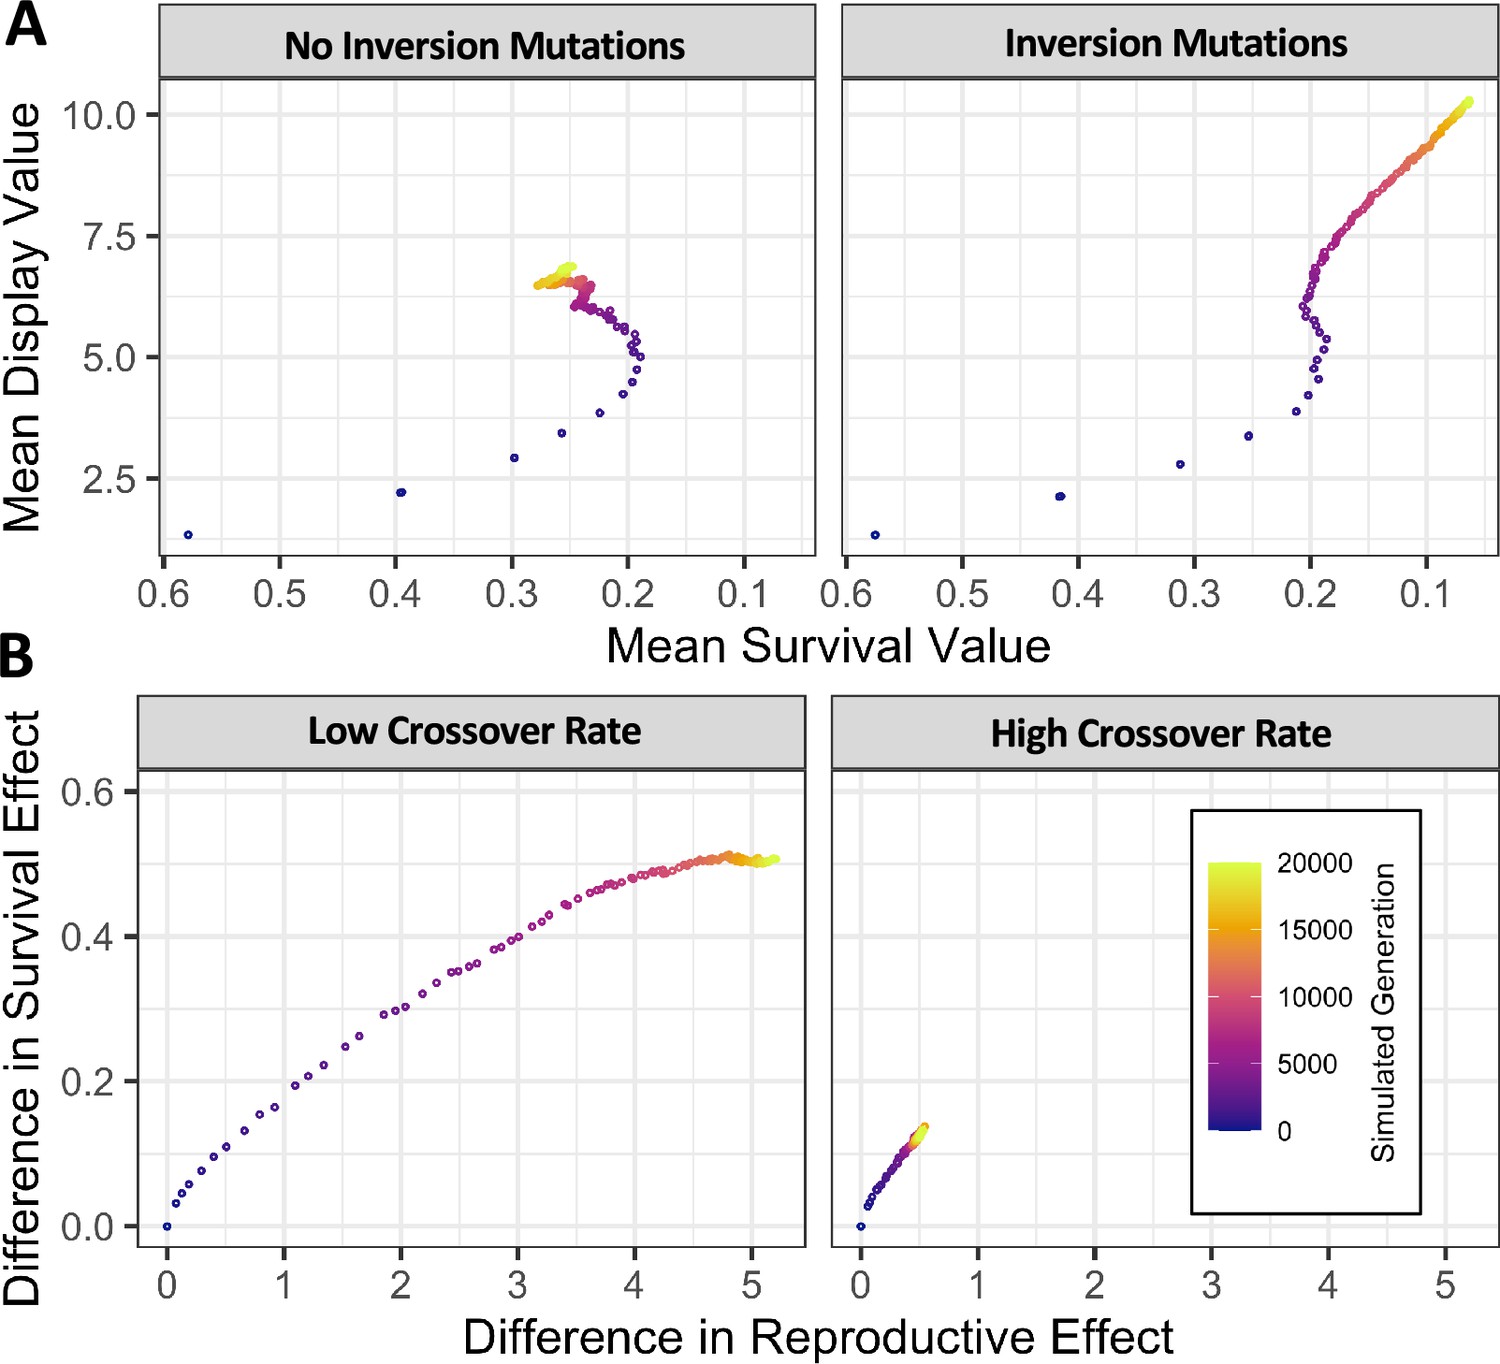
Simulated populations with stochastic mutation of new inversions and sexually antagonistic variants generate persistent inversion polymorphisms and accumulate linked sexually antagonistic variants.
(A) In simulated populations with stochastic mutation of new variants having pleiotropic effects on survival and male display, levels of antagonism increased with time before stabilizing at an intermediate value (left panel). Whereas simulations which also allowed the mutation of new inversions continued accumulating stronger antagonism throughout the simulated time interval (right panel). (B) In simulations which allowed the mutation of new inversions, a low crossover rate (left panel, 43.6 cM in females after scaling) allowed populations to accumulate larger differences between the most common karyotype and all others than when the rate of crossover was particularly high (right panel, 43.6 M in females after scaling). Gene conversion occurs at each heterozygous variant with a scaled probability of 0.1295 per heterozygous variant in both scenarios. Values given are the mean of 1000 replicate simulations of 1000 diploid individuals run for 20 N generations.
Figure 6 with 1 supplement

Antagonism-associated karyotypes reach predictable equilibrium frequencies in simulations with antagonistic and inversion mutations, when survival costs are shared between sexes.
(A) Histograms of the number of karyotypic arrangements at a specified frequency across all simulation replicates in females (left) and males (right), colored by how the average survival effect of that arrangement ranks compared to the others in its population. Ranks are normalized to be relative to the median arrangement value, to better account for rare arrangements and ties. These simulations reach an equilibrium with two predominant arrangements, with the more survival-focused arrangement around an overall frequency of 0.25 and more common in females, and the more male-competition-focused arrangement around a frequency of 0.75 and more common in males. (B) Because successful males tend to be homozygotes and successful females heterozygotes, the less frequent of the two major arrangements (which tends to favor survival) has homokaryotype frequencies far below the Hardy-Weinberg expectation, and there is an excess of heterokaryotypes. These genotype frequencies shift between zygote (left panel) and adult (right panel) populations as the genotype affects survival.
Figure 6—figure supplement 1
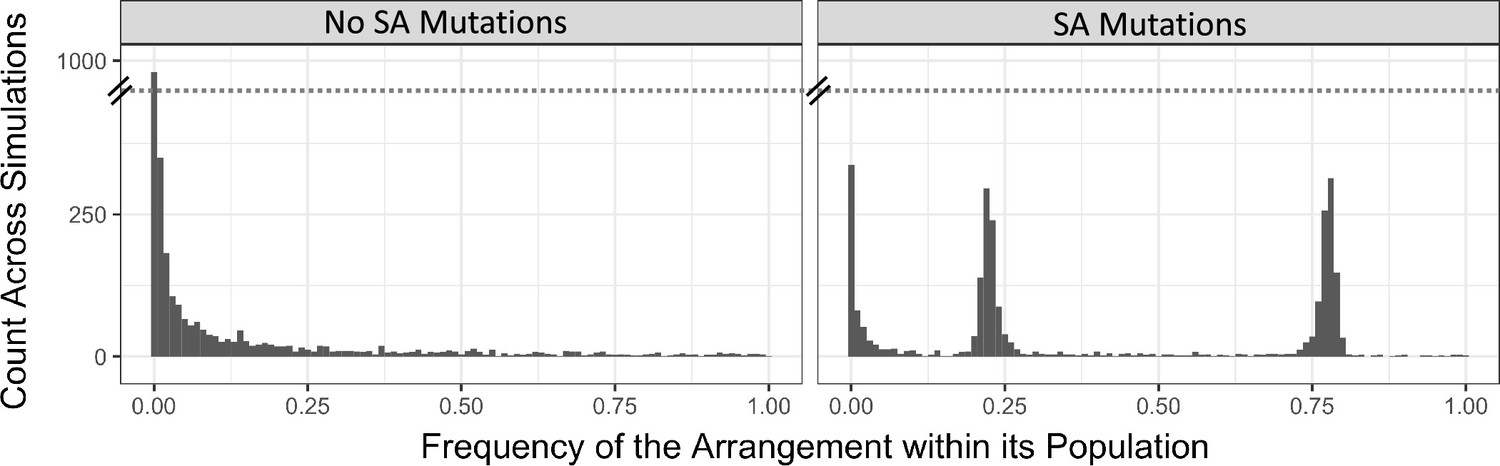
A histogram of the observed inversion frequencies in simulations with mutational generation of inversions with random position and length.
In these simulations, only one inversion was allowed per haplotype, to enable easier accounting of the average effects of variants associated with an arrangement. Without antagonistic mutations, or other fitness effects, the distribution of inversion frequencies across all simulation replicates reflects the distribution expected for a neutral variant (left panel), although this figure represents the frequency of inversions across all simulations instead of a single population because only a couple inversions are expected in each simulation run. With antagonistic mutations, inversions tend to cluster around frequencies near 0.25 and 0.75 (right panel), due to parental transmission dynamics resembling sex chromosomes.
Figure 7
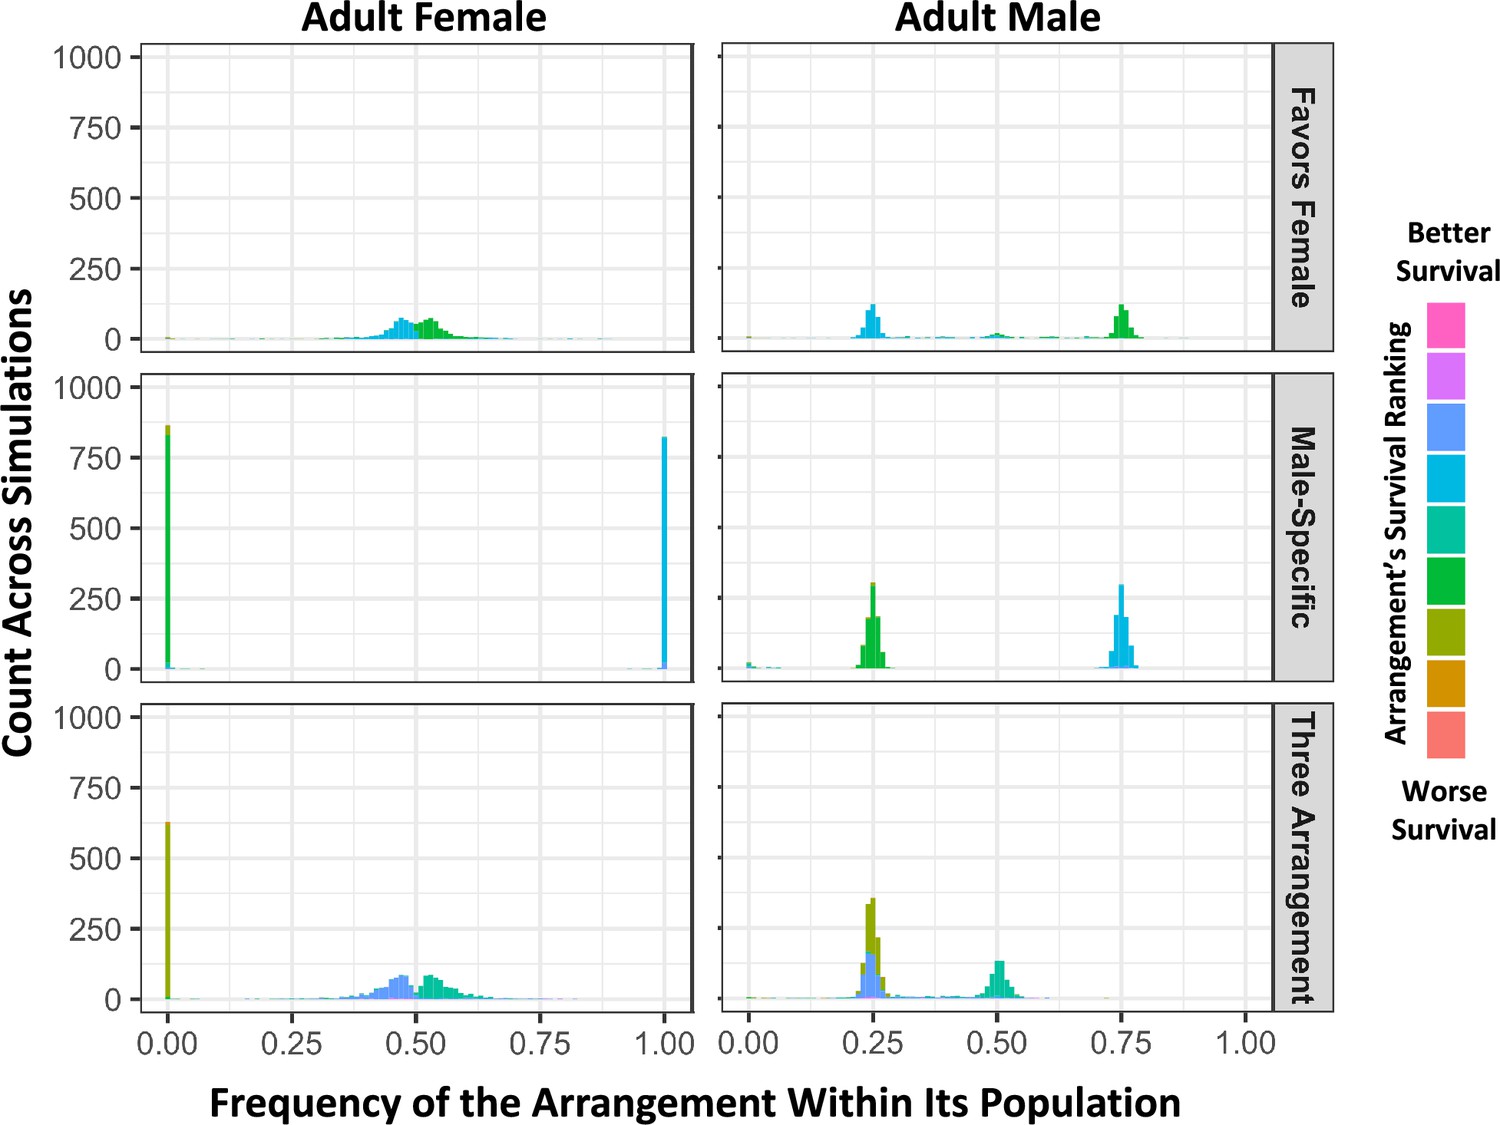
In simulations with female-limited survival costs, three distinct outcomes are observed involving either two or three balanced haplotypes.
From simulations with randomly occurring antagonistic and inversion mutations, histograms of inversion frequencies across simulations for surviving females (left) and males (right) are partitioned into three categories based on sex-specific haplotype frequency outcomes. The ‘Favors Female’ category (top) includes simulations in which there are exactly two arrangements with frequencies between 0.1 and 0.9 in both sexes (20.0% of replicates). The ‘Male-Specific’ category (middle) includes simulations in which there are two arrangements with whole-population frequencies between 0.1 and 0.9, but one arrangement is absent in adult females (37.0% of replicates). The ‘Three Arrangement’ category (bottom) includes simulations in which there are exactly three arrangements with whole-population frequencies between 0.1 and 0.9 frequency (40.6% of replicates). 2.3% of simulations did not fit in these categories and had only one predominant arrangement. As in Figure 6, inversions are colored by how the average survival effect of that arrangement ranks compared to the others in its population, and ranks are normalized to be relative to the median arrangement value, to better account for rare arrangements and ties.
Figure 8
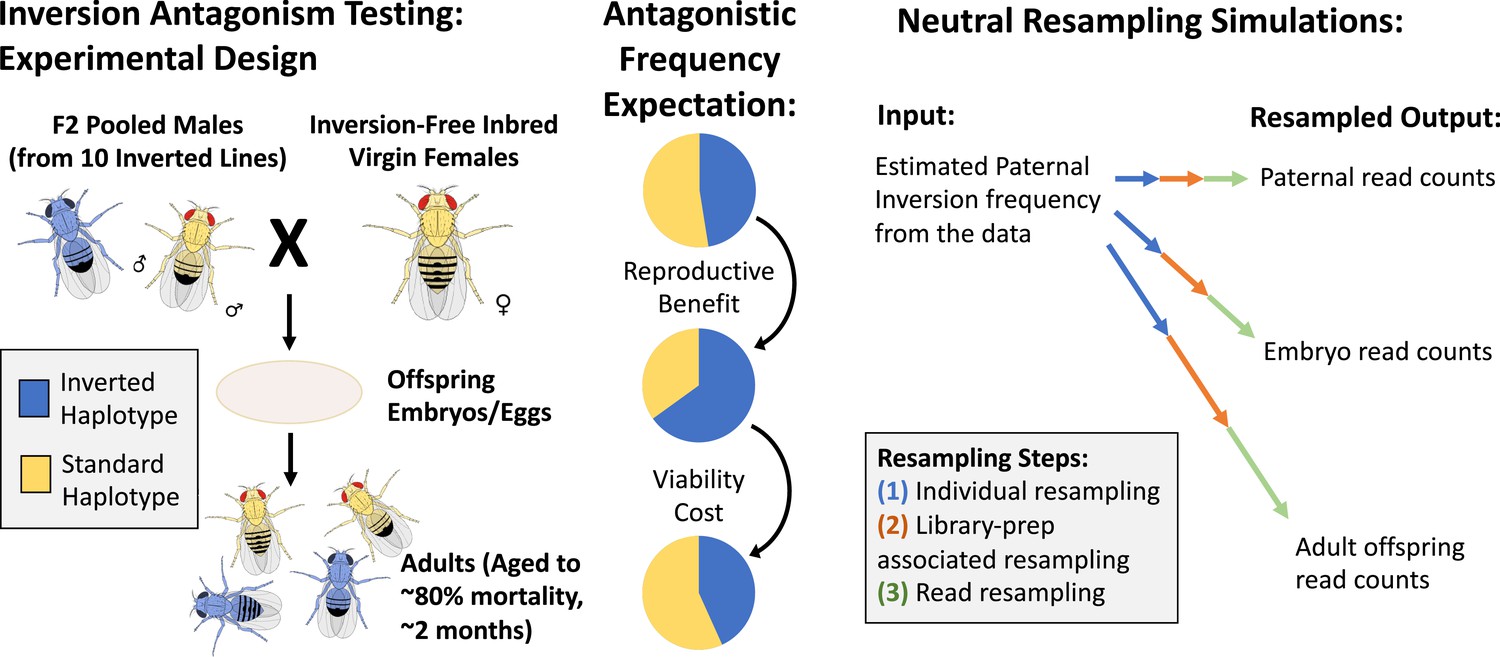
The layout and potential expectations of the laboratory evolution experiment.
We cross outbred males from a high-inversion population to inbred, non-inverted females from a specific inbred line, and collect DNA samples from the fathers, embryo offspring, and aged adult offspring for inversion frequency estimation via sequencing (left). We hypothesize from our antagonistic pleiotropy model that one or more of the four inversions present on separate chromosome arms in our experimental populations may experience opposing selection between fathers and embryos versus between embryos and aged adults (middle). To test the significance of observed frequency changes, we designed a resampling model to represent the sources of neutral variation expected in the experiment (right).
Figure 9 with 1 supplement
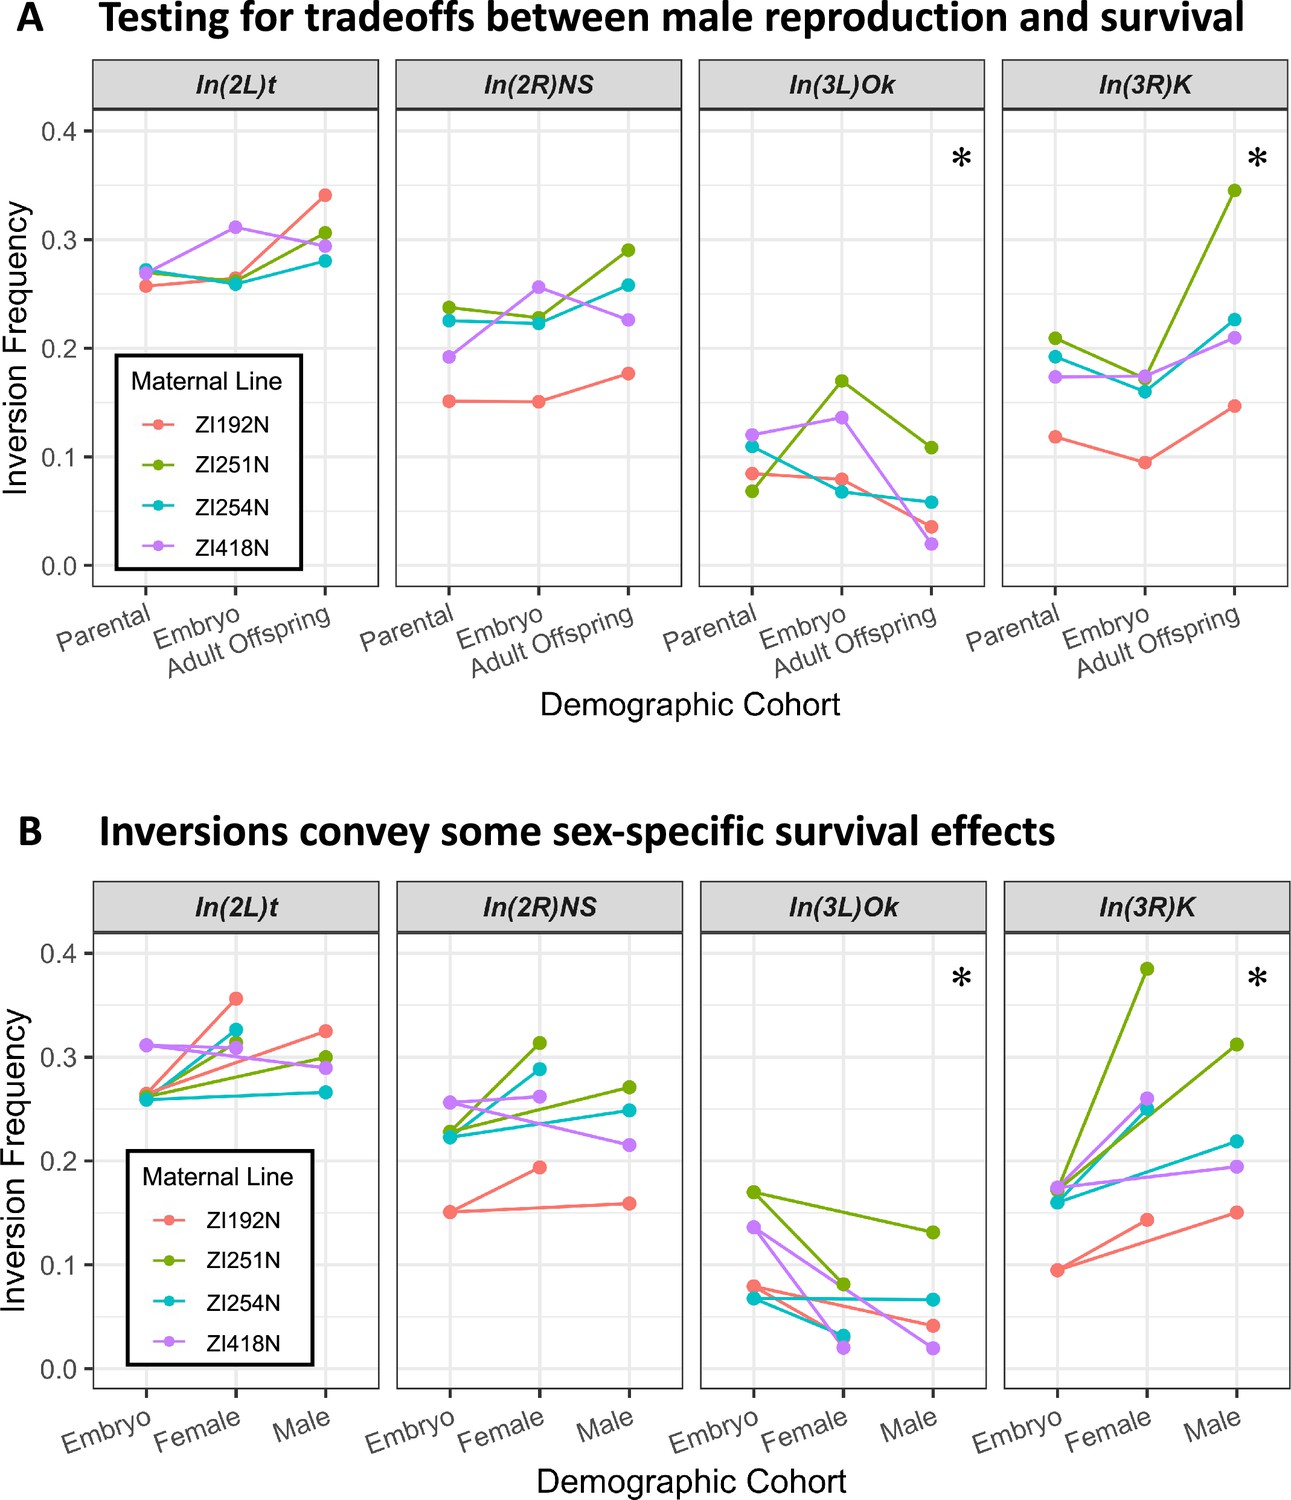
Some Drosophila inversions show evidence for antagonistic tradeoffs and sex-specific survival.
(A) Testing for antagonistic fitness effects on reproduction and survival (encompassing viability and longevity). Each inversion’s frequency in parents after collection (2–3 weeks from eclosion), embryo offspring, and aged adult offspring (10 weeks from eclosion) are shown for each maternal inbred line. Parental frequency is represented instead of paternal frequency for easier visual comparison, and is taken as the paternal frequency divided by two to account for the inversion-free inbred mothers. Adult offspring frequencies are taken from the sum of estimated allele counts across all adult offspring cohorts. * indicates p-value <0.05 for evidence of significant reversed frequency change from parental to embryo and from embryo to offspring, combined across all four maternal line crosses and corrected for multiple tests, when compared to neutral simulated experiments (details in Materials and methods). (B) Testing for evidence of sex-specific survival effects. The changes in inversion frequencies between embryos and the aged adult offspring are again illustrated, now separated by their sex. * indicates p-value <0.05 for significant differences in female versus male inversion frequency among adult offspring, combined across all four maternal crosses and corrected for multiple tests.
Figure 9—figure supplement 1
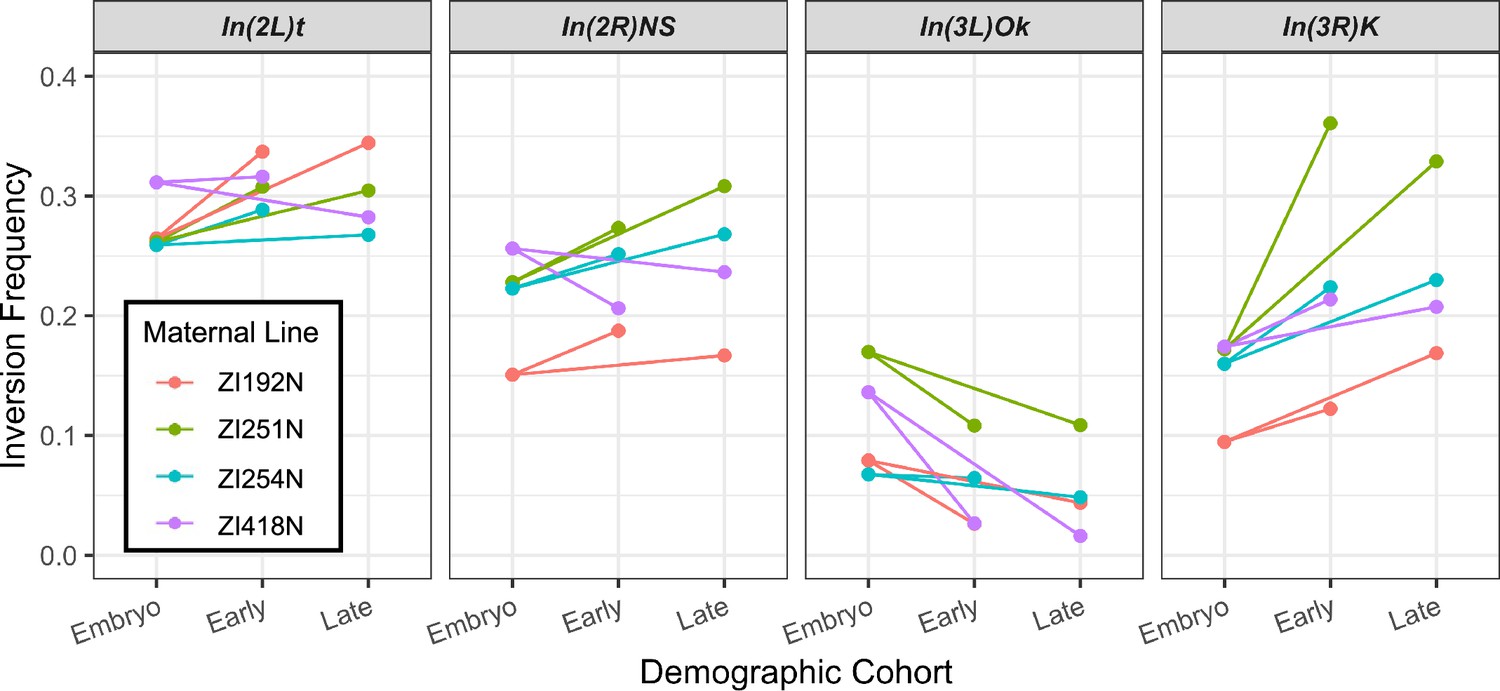
A plot of the observed inversion frequencies in early-eclosing and late-eclosing adult offspring cohorts, compared to the embryo frequencies.
Inversion frequency changes were largely parallel between these cohorts, and no significant effects of eclosion time were identified across maternal line cross replicates.
Additional files
-
Supplementary file 1
Tables containing information for experimental fly counts, primers, amplicons, inversion frequency calls, selection coefficient estimates, and p-values across the comparisons presented.
(a) Counts of D. melanogaster collected from different inbred Zambian lines to generate the F2 paternal pool. (b) Counts of D. melanogaster collected or used at the different stages of the experiments. (c) Primers and amplicon sequences used in assessing inversion frequency from genomic DNA in the D. melanogaster lab experiments. Coordinates follow D. melanogaster reference genome release 5. (d) A table of fixed differences between inversions identified from the haploid Zambia genomes from the Drosophila Genome Nexus, used for inversion frequency calling. Coordinates follow D. melanogaster reference genome release 5. (e) A table of p-values calculated for non-line-combined comparisons between each pair of male vs female cohorts. (f) A table of p-values calculated for non-line-combined comparisons between each pair of early vs late eclosing cohorts. (g) A table of p-values calculated for non-line-combined comparisons between each pair of paternal vs embryo cohorts. (h) A table of p-values calculated for non-line-combined comparisons between each pair of embryo vs aged offspring cohorts.(i) A table of p-values calculated for non-line-combined tests of an increase then decrease across paternal to embryo to aged offspring sets.(j) A table of p-values calculated for non-line-combined tests of a decrease then increase across paternal to embryo to aged offspring sets.(k) A table of p-values for increase-then-decrease tests of paternal-embryo-aged offspring which have been combined across experiments of different maternal inbred line by using fishers combined p-value across maternal lines, then multiple test corrected across tested inversions and directions.(l) A table of p-values for decrease-then-increase tests of paternal-embryo-aged offspring which have been combined across experiments of different maternal inbred line by using fishers combined p-value across maternal lines, then multiple test corrected across tested inversions and directions.(m) A table of p-values for male vs female comparisons combined across experiments of different maternal inbred line by using fishers combined p-value across maternal lines, then multiple test corrected across tested inversions.(n) A table of p-values for early vs late eclosing comparisons combined across experiments of different maternal inbred line by using fishers combined p-value across maternal lines, then multiple test corrected across tested inversions.(o) A table of selection estimates generated by modeling the experimental generation as a Wright-Fisher population (p) Data on the libraries generated from experimental cohorts to estimate the inversion frequencies. Library names represent the maternal line, the cohort, the inversion chromosome arm,.the library prep, and the sequencing run. (q) Data taken by summing the read counts from duplicate libraries generated from experimental cohorts to estimate the inversion frequencies. Pool names represent the maternal line, the cohort, the inversion chromosome arm. (r) Data on the replicate libraries generated from the DNA extractions of experimental cohorts used to estimate the sample-size independent variation introduced by the library preparation and sequencing. Library names represent the source sample or line.the fly pool.the inversion.the extraction and library prep replicate. (s) Data on further replicate libraries including multiple DNA extractions of different inbred fly pools with known inversion frequency, used to estimate bias and the sample-size independent variation introduced by the library preparation and sequencing. Library names represent the source sample or line.the fly pool.the inversion.the extraction and library prep replicate.
- https://cdn.elifesciences.org/articles/93338/elife-93338-supp1-v1.xlsx
-
MDAR checklist
- https://cdn.elifesciences.org/articles/93338/elife-93338-mdarchecklist1-v1.docx
Download links
A two-part list of links to download the article, or parts of the article, in various formats.
Downloads (link to download the article as PDF)
Open citations (links to open the citations from this article in various online reference manager services)
Cite this article (links to download the citations from this article in formats compatible with various reference manager tools)
The potential of inversions to accumulate balanced sexual antagonism is supported by simulations and Drosophila experiments
eLife 12:RP93338.
https://doi.org/10.7554/eLife.93338.4


