Loss of ninein interferes with osteoclast formation and causes premature ossification
- Molecular, Cellular and Developmental Biology, Centre de Biologie Intégrative, UMR5077, CNRS & Université Paul Sabatier, France
- Institut de Pharmacologie et de Biologie Structurale, UMR5089, CNRS & Université Paul Sabatier, France
- CIRIMAT, UMR5085, CNRS & Université Paul Sabatier, France
- International Research Project CNRS “MAC-TB/HIV”, France
Figures
Figure 1
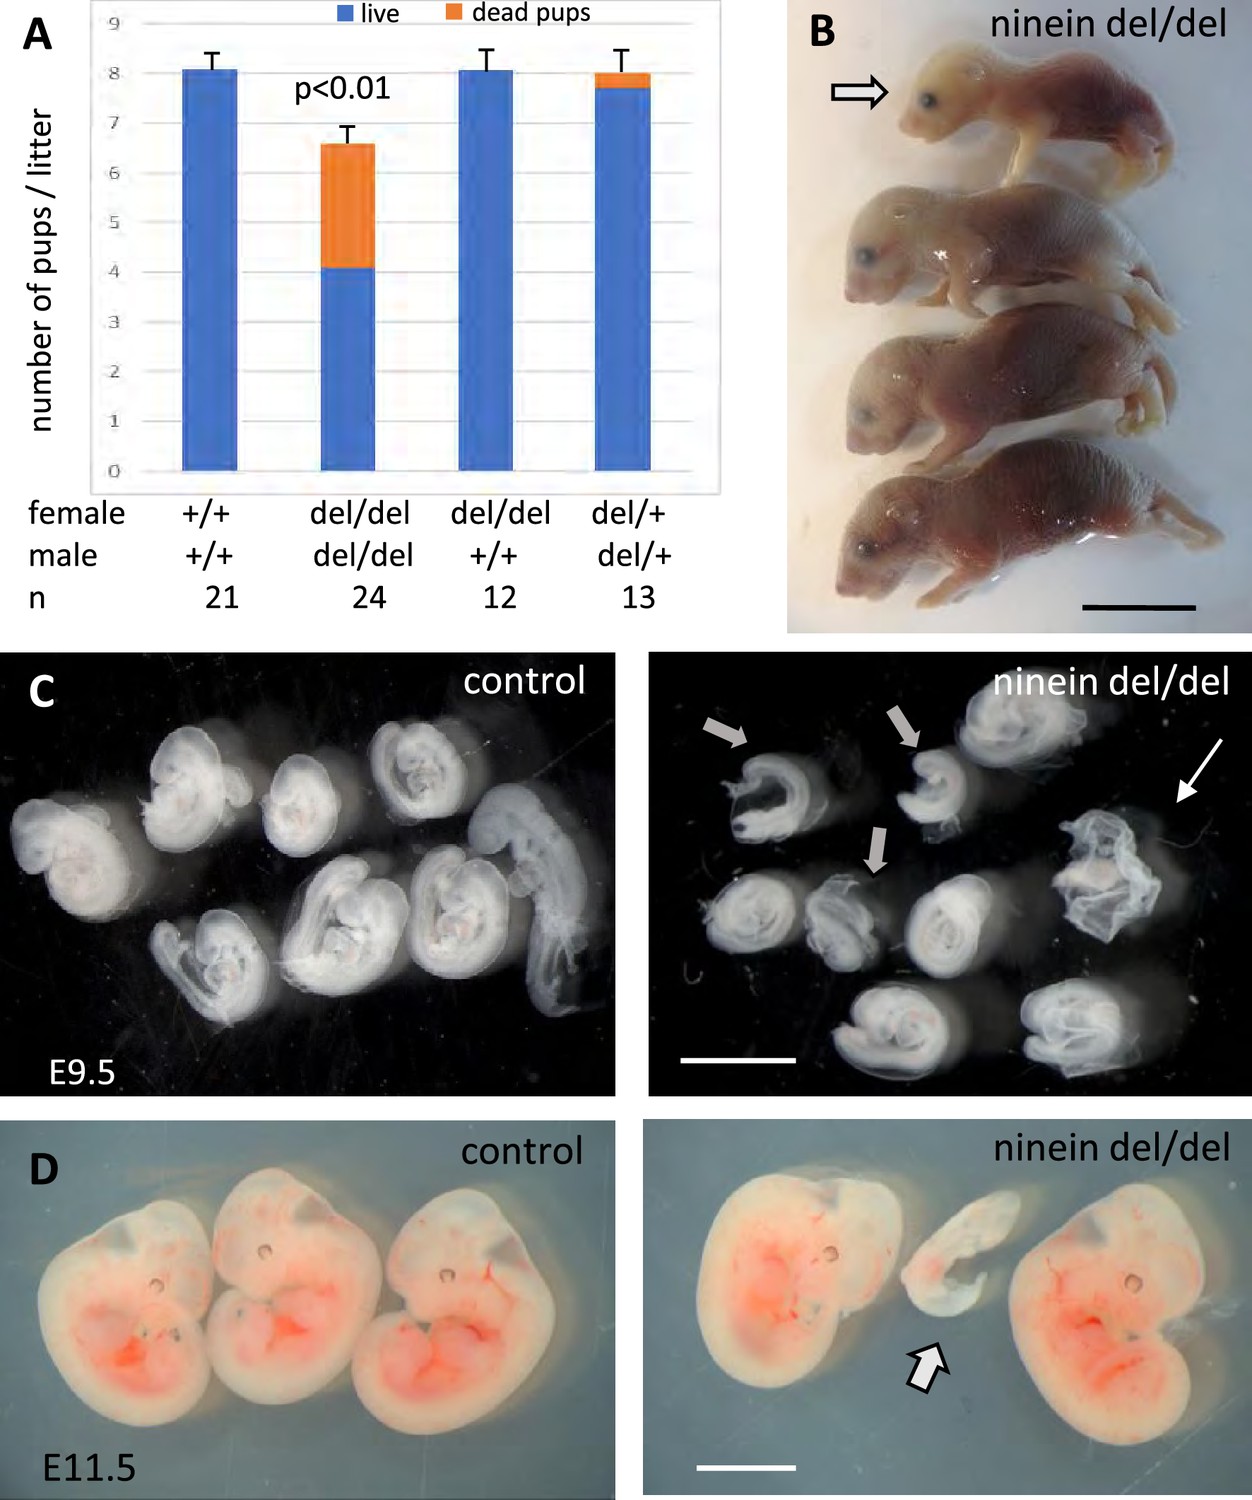
Ninein knock-out mice display reduced litter size upon a zygotic genotype.
(A) Litter size comparisons following crossings among control or ninein-deleted animals at birth. Blue-colored bars: live pups, orange-colored bars: dead pups. Crossing of males and females with homozygous deletion of ninein leads to systemic prenatal death as compared to control matings. The number of pups alive is reduced by nearly 50%. (B) Example of a litter with dead newborns, one of them being of very small size (arrow) is shown. (C, D) Examination of deciduae at mid-gestation, at E9.5 and E11.5, in control and ninein del/del embryos. Despite similar numbers of deciduae in both groups, some dissected deciduae of ninein del/del contained only small fetuses (arrows in C, D) or no fetus (thin arrow in C). Bars, (B) 1 cm, (C) 2 mm, (D) 5 mm.
Figure 2
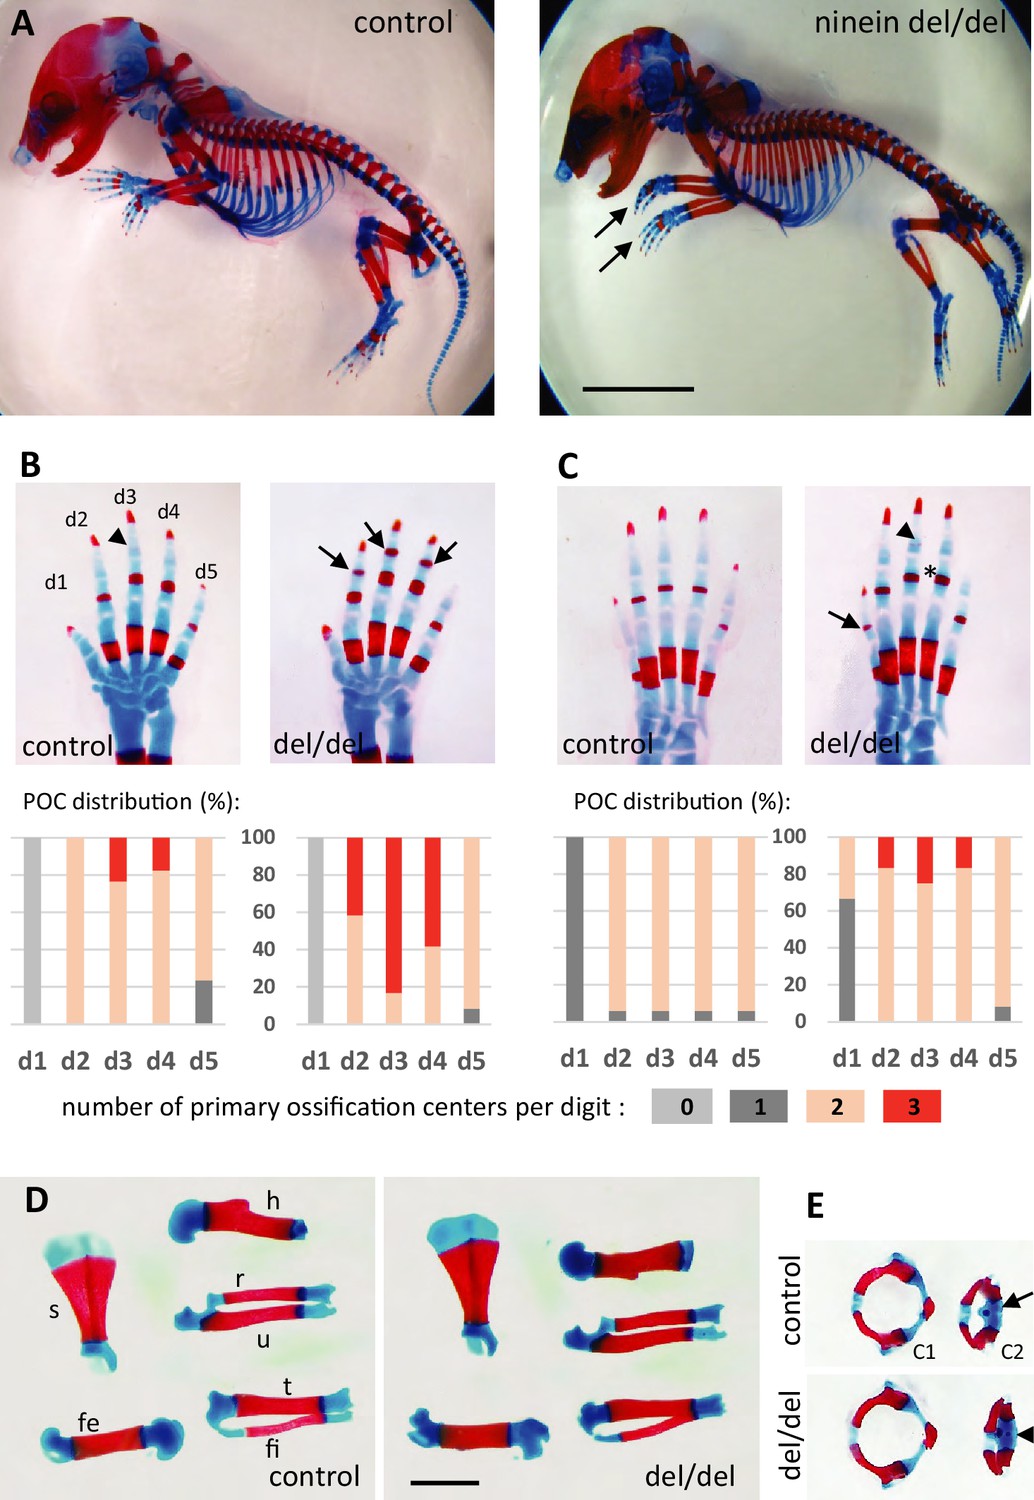
Advanced ossification in ninein-deleted mice.
(A) Whole skeleton preparations of E18.5 embryos using Alcian blue staining for cartilage and Alizarin red staining for mineralized bone. Left: control (heterozygous), right: ninein del/del embryo. At low magnification, only curved digits from the forelimb are noticeable in ninein-deleted embryos (arrows). (B, C) Closer examination of the digits (d1 to d5) of both (B) forelimb and (C) hindlimb is provided for controls and ninein (del/del) embryos. Forelimb and hindlimb digits d2 to d4 show enhanced mineralization in the ninein-deleted group. Arrows in B point towards mineralization in the intermediate phalange of digits 2–4 of the forelimb, which is barely seen in digit 3 of controls (arrowhead). In the hindlimb, proximal phalanges of digits 3–5 of ninein-deleted embryos display a more intense bone staining (asterisk in C) as compared to controls. In C, the arrow points towards mineralization of digit 1 and the arrowhead indicates bone collar detection in the intermediate phalange in ninein-deleted embryos, which are absent in controls. Graphs below B and C represent the distribution of the number of primary ossification centers (POC) found for each digit (in phalanges, meta-carpal, and metatarsal bones), in 16 controls and 12 ninein del/del E18.5 embryos. (D) Dissection of long bones reveal no size differences between control and ninein-deleted embryos (fe, femur; fi, fibula; h, humerus; r, radius; s, scapula; t, tibia; u, ulna). (E) The second cervical vertebrae (C2) display one ossification center in controls (arrow) whereas an additional center of ossification (arrowhead) is present within the vertebral body of C2 in the ninein-deleted embryo. (c1, first cervical vertebrae [atlas]; c2, second cervical vertebrae [axis]). Bars, (A) 5 mm, (D) 2 mm.
Figure 3 with 1 supplement
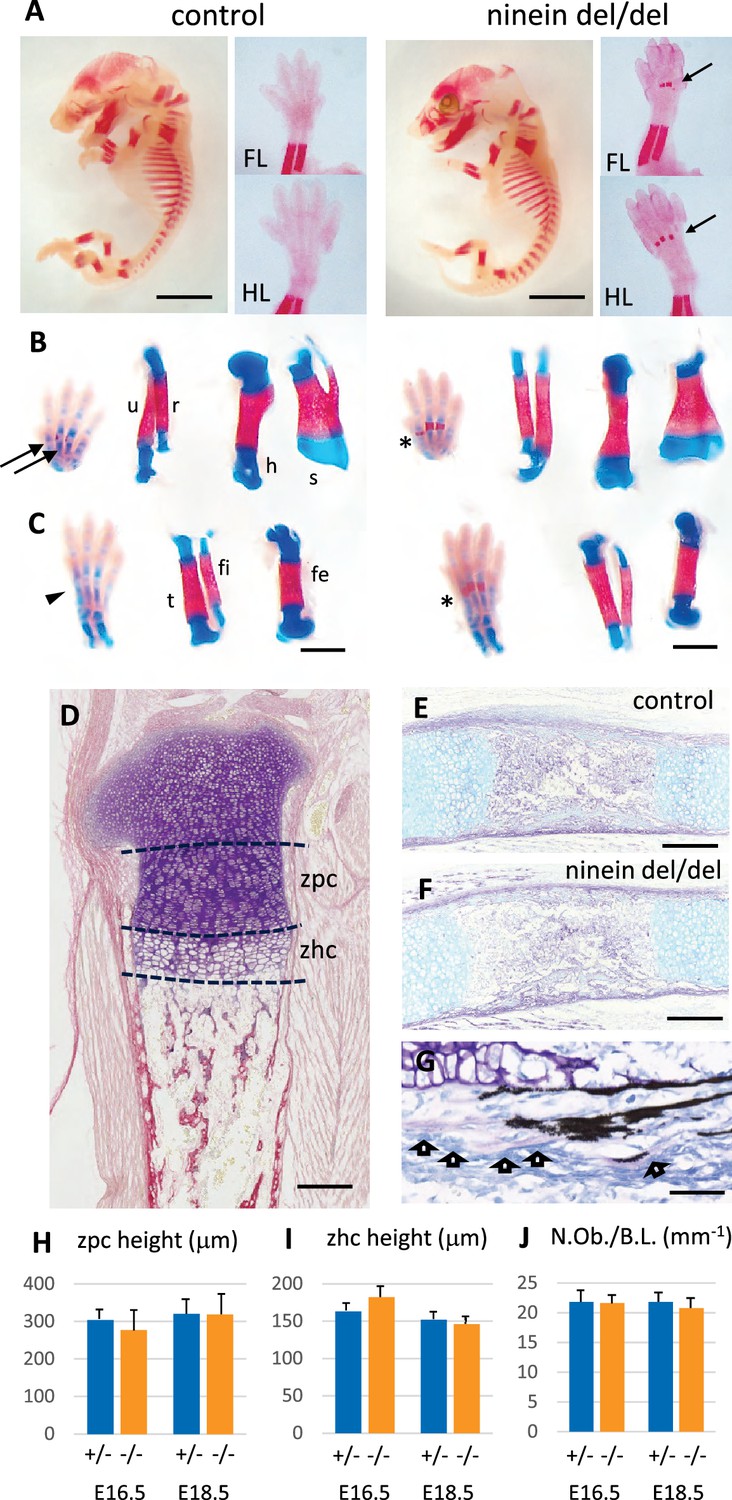
Advanced endochondral ossification in ninein-deleted mice.
(A) Whole skeleton preparation of E16.0 embryos, stained for mineralized bone using Alizarin red. Left, control heterozygous, right: ninein del/del embryo. Despite an overall similar staining, ossification centers are visible in ninein-deleted embryos in central metacarpal and metatarsal bones (arrows, right images) whereas they are not yet mineralized in controls (FL, forelimb; HL, hindlimb). At E16.5, dual staining for cartilage and bone was performed on whole embryos, and dissected FL and HL are shown in (B) and (C), respectively. In control feet, early signs of mineralization appear in central metacarpal (arrows in B) and metatarsal bones (arrowhead, C). A stronger mineralization is evident in ninein-deleted embryos in both forelimb and hindlimb feet (asterisks in B, C, right panel). Dissection of long bones reveals no size differences between control and ninein-deleted embryos (fe, femur; fi, fibula; h, humerus; r, radius; s, scapula; t, tibia; u, ulna). (D) Pentachrome staining of a tibia epiphysis of a control embryo at E16.5. (E, F) Alkaline phosphatase and alcian blue staining for osteoblasts and cartilage, respectively, revealing no differences in tibiae of control and mutant embryos. (G) Von-Kossa and toluidine-blue-stained section of a control embryo at E18.5. Arrows indicate osteoblasts. (H, I) Measurements of the zone of proliferating chondrocytes (zpc) and of the zone of hypertrophied chondrocytes (zhc), as shown in (D). +/- indicate heterozygous control mice, -/- indicate ninein del/del mice. Eight and ten embryos were used for each genotype at E16.5 and E18.5, respectively. (J) Quantification of the number of osteoblasts per bone length (N.Ob./B.L.), as displayed in (G). Six embryos/genotype were analyzed for each time point Bars, (A) 3 mm, (C) 1 mm, (E, F) 250 μm and (G) 150 μm.
Figure 3—figure supplement 1
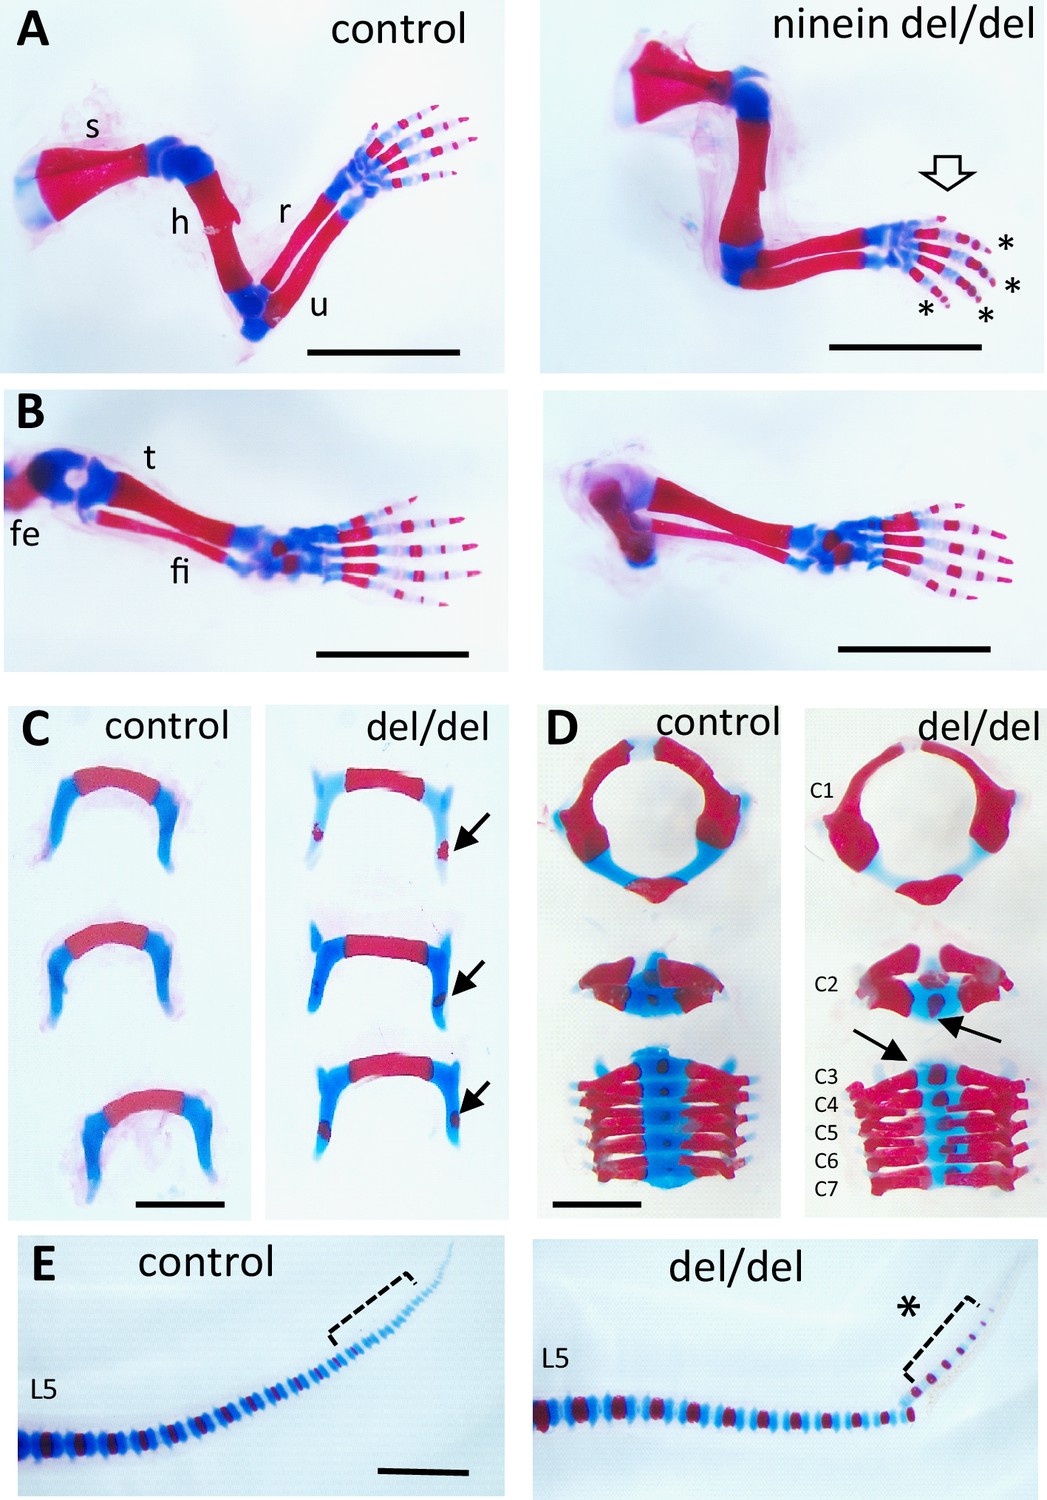
Early endochondral ossification is present at multiple sites of bone formation.
Skeleton staining of 21.5dpc pups using Alcian blue and Alizarin red. (A) Forelimbs and (B) hindlimbs from control (heterozygous) and ninein-deleted neonates. Note the advanced ossification in digits of the forelimb in ninein del/del (arrow, asterisks in A, right). Fe, femur; fi, fibula; h, humerus; r, radius; s, scapula; t, tibia; u, ulna (C) Hyoid bones of control and ninein del/del neonates. Advanced ossification in the hyoid bone of ninein del/del, with the presence of an ossification center within the greater horn (arrows, right). (D) Vertebral bodies of cervicals (C1-7). In ninein-deleted pups, C2 to 7 exhibited increased mineralization (arrows) as compared to controls. (E) Tails of neonate control and ninein del/del mice. Both groups have the same total number of vertebrae, but advanced ossification is clearly present at the tip of the tail in caudal vertebrae of ninein del/del pups (open bracket, asterisk, right). L5, fifth lumbar vertebrae. Bars (A, B) 5 mm, (C–E) 2 mm.
Figure 4
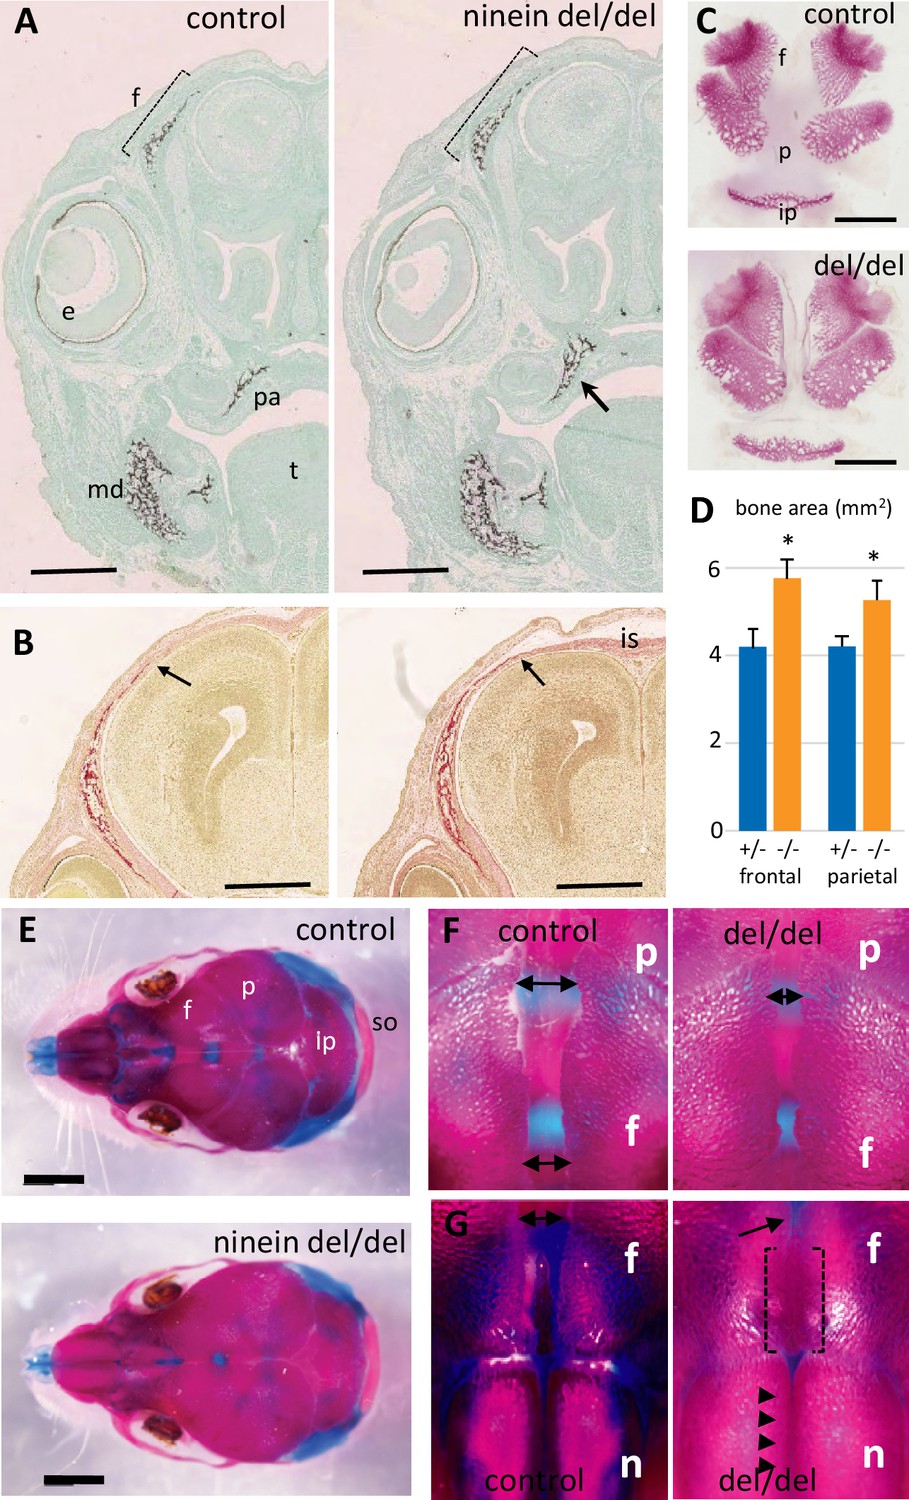
Early intramembranous ossification in ninein-deleted mice leads to premature suture closure.
(A, B) Coronal sections through E16.5 heads of control and ninein-deleted embryos (e, eye; f, frontal; is, interfrontal suture; md, mandible; pa, palatal; t, tongue). (A) Von Kossa staining revealed enhanced mineralization in skull lacking ninein, particularly visible for the frontal (dotted line) and palatal bones (arrow, right). (B) Alizarin red S staining highlighted an enhanced trabecular frontal bone towards the interfrontal suture (arrow, right). (C) Dissected frontal and parietal bones from control and ninein-deleted embryos at E16.5 (ip, intraparietal; p, parietal). (D) Measurements of (C), indicating increased bone areas in ninein-deleted skulls. +/- represent heterozygous controls, -/- represent ninein del/del embryos. *, p<0.05, as compared to controls (n=4 in each group). (E) E21.5dpc skulls stained with Alcian blue and Alizarin red (n, nasal; so, supraoccipital). Top: control, bottom: ninein del/del. (F) High magnification of skulls, close to the parietal bones: a clear reduction in the space between frontal bones is observed in ninein-deleted embryos (compare double arrows left and right). (G) More anterior position of the skull. The interfrontal suture is closed in ninein del/del skulls (open brackets, right), and almost closed between nasal bones (arrowheads, right) as compared to controls. Bars, (A, B) 500 μm, (C) 2 mm, (E) 5 mm.
Figure 5
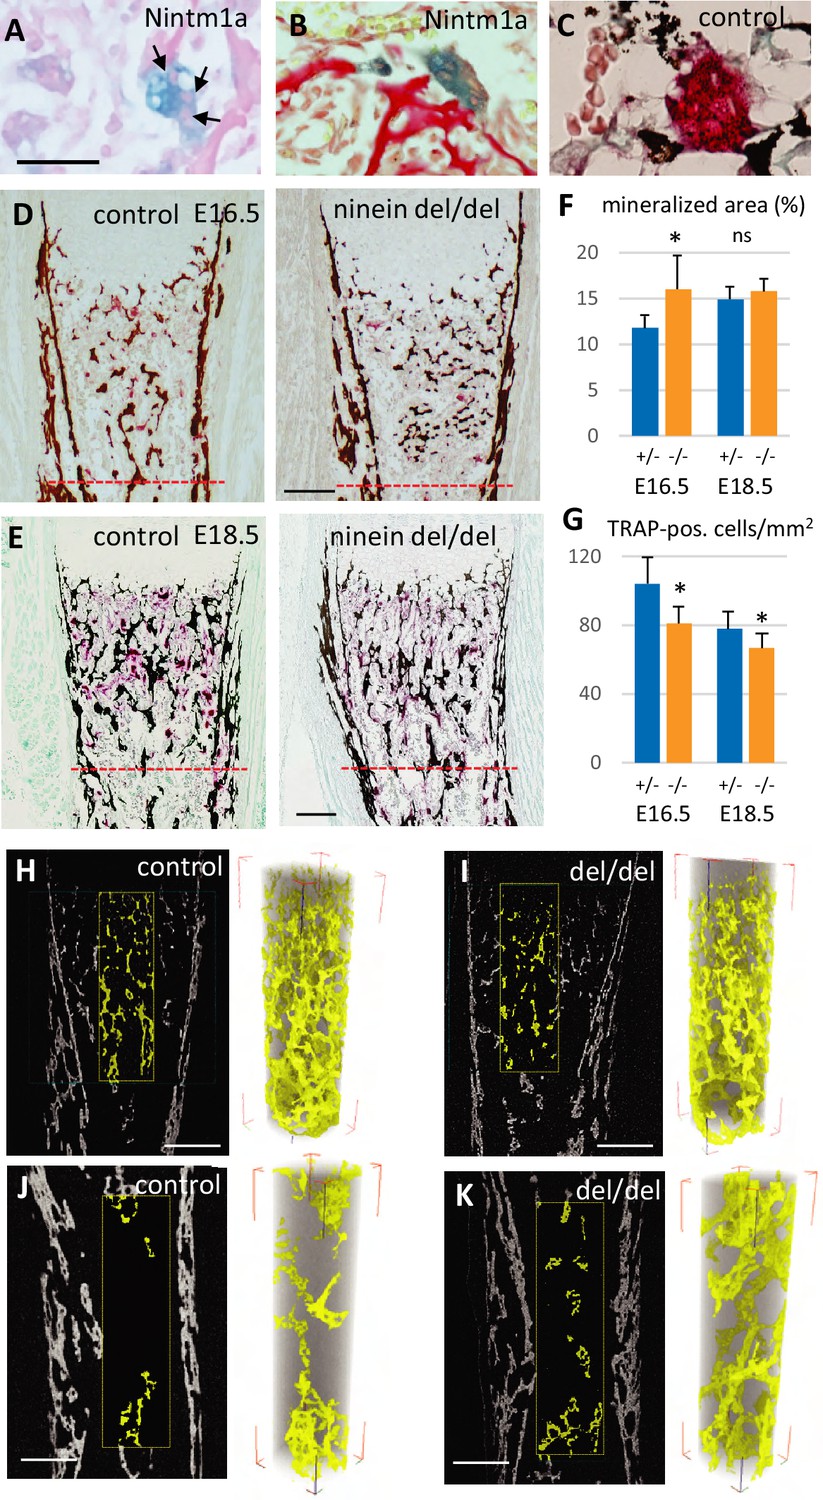
Reduced osteoclast density affects long bone internal structure at E18.5.
(A) Histology of E16.5 heterozygous Nintm1a mice revealed high expression of β-galactosidase (blue) in multinucleated cells (arrows). (B) These β-galactosidase-positive syncytia line close to alizarin red stained material. (C) The syncytia are positive for TRAP (red), an osteoclast-specific enzymatic reaction. Black color represents von Kossa-staining. (D) Tibiae from E16.5 and (E) E18.5, left: control, right: ninein del/del. Images depict von Kossa staining (black), followed by TRAP enzymatic reaction (red). (F) Analysis of the mineralized bone area was performed within 400 μm and 600 μm below the zone of hypertrophied chondrocytes, limits represented by the red dotted lines in (D, E). +/- represent heterozygous controls, -/- represent ninein del/del embryos. (G) In the same area, TRAP-positive cells were quantified. A significant reduction in the number of osteoclasts per square millimeter was observed in ninein del/del embryos. An increase in the mineralized bone was detected in ninein del/del samples only at E16.5. *, p<0.05 as compared to controls. ns, statistically not significant. Data on E16.5 tibiae (F) were from 7 controls and 8 ninein-deleted embryos. Data on E18.5 tibiae (G) were from 9 controls and 9 ninein-deleted embryos. (H, J) X-ray microtomography was performed on E18.5 control and (I, K) ninein-deleted whole microdissected tibiae. The upper parts of the mineralized tibiae area (yellow colored) were of the same density in both groups. Within the middle part of the tibiae, the central core of mineralization represented in yellow was denser in ninein del/del tibia as compared to control. Bars, (D) 100 μm, (E) 150 μm, (H–K) 200 μm.
Figure 6 with 1 supplement
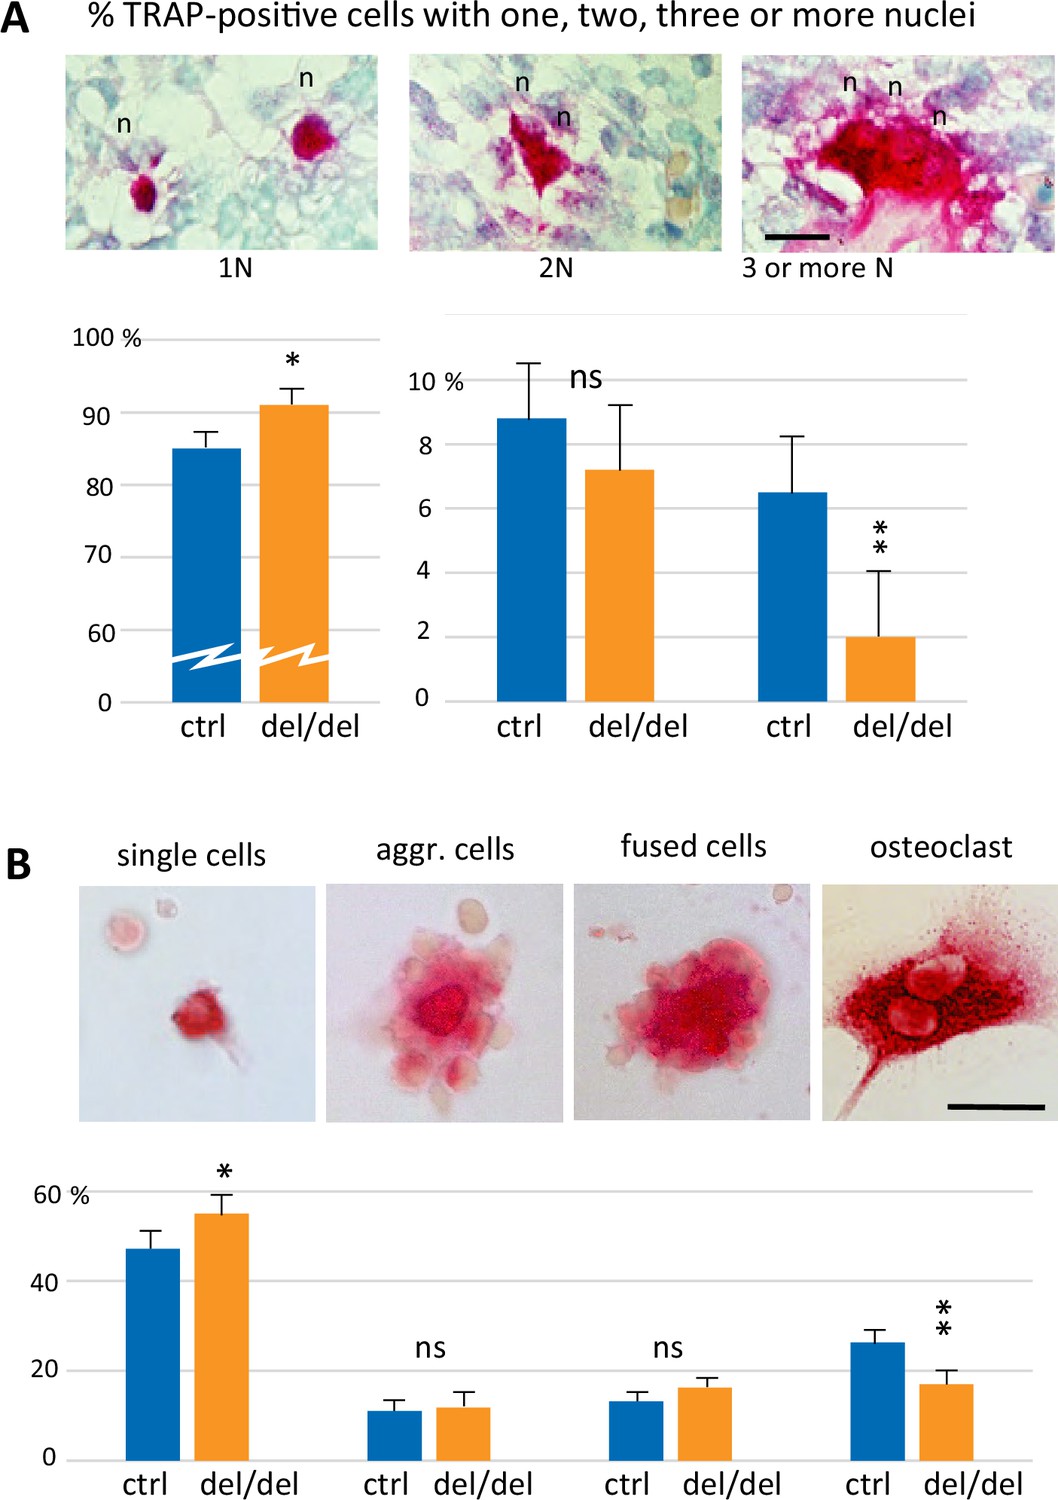
Reduced cell fusion of osteoclast precursors during osteoclastogenesis.
(A) Focus on mandible development from sections of E14.5 control and ninein-deleted embryos. Examination of TRAP-positive cells within the mandible area, revealing the presence of mononucleated cells (1 N), binucleated cells (2 N), and cells with three or more nuclei (3 N; n, nucleus). Graphs indicate the percentage of TRAP-positive cells with one, two or ≥three nuclei. 1300 cells were analyzed for each genotype (control [ctrl], ninein del/del). * and **, p<0.05 and p<0.01, respectively, by comparison of ninein del/del to controls (n=8 controls and 7 ninein-deleted embryos; ns, statistically not significant). (B) Neonatal bone marrow cells cultured for one hour and stained for TRAP. TRAP-positive cells are classified in four groups: single cells, aggregated cells (aggr. cells), clusters of fused cells, and osteoclasts. The percentage of cells in each category is presented below each image. In samples from ninein del/del bone marrow (dark blue bars), an increased percentage of mononucleated TRAP-positive cells, and a reduced percentage of mature osteoclasts are detected (* and **, p<0.05 and p<0.01, respectively, as compared to controls (ctrl, light blue bars). Data are from 16 controls and 15 ninein-deleted neonates; ns, statistically not significant). Bars, (A, B) 25 μm.
Figure 6—figure supplement 1
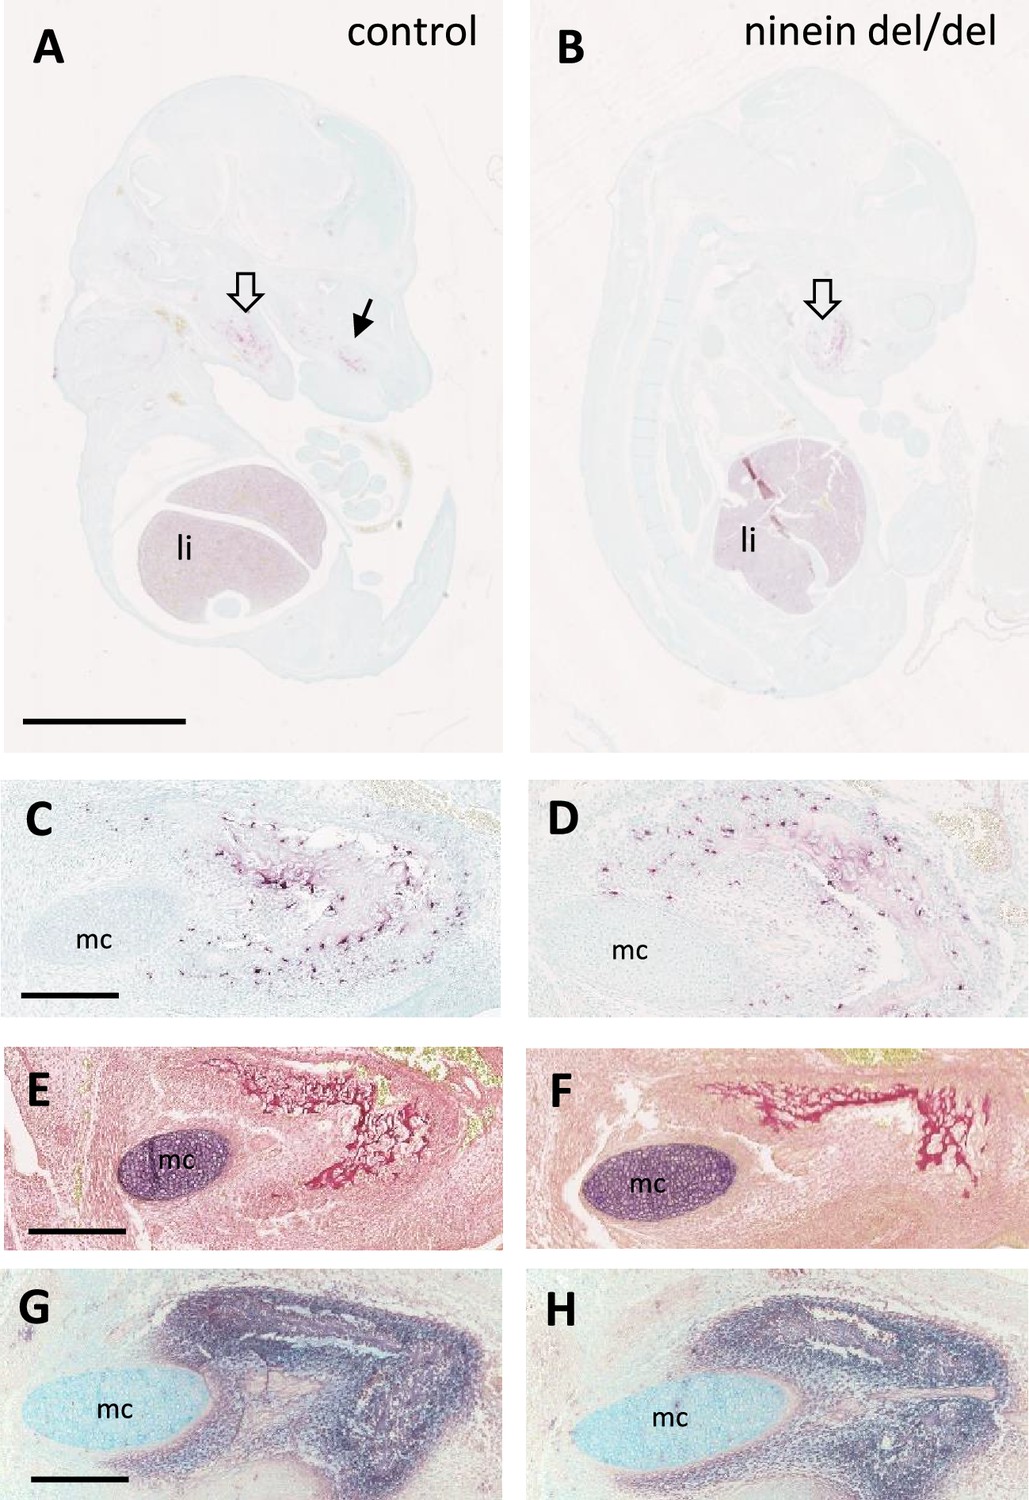
Early osteoclastogenesis from erythro-myeloid progenitors.
(A, B) Early bone development at E14.5, examined by von-Kossa-staining of longitudinal sections of whole control and ninein-deleted embryos. The absence of silver deposit in either group indicates that bone mineralization has not started yet. TRAP reaction (red) reveals abundant positive cells in the liver and in the area of the mandibles (large hollow arrows), and maxilla (arrow in A) (li, liver). (C, D) High magnifications of TRAP-positive osteoclast progenitors near the Meckel’s cartilage (mc). (E, F) Sirius red staining of E14.5 mandibles to detect collagen deposit. (G, H) Alkaline phosphatase staining, indicating the presence of osteoblasts within the developing mandibles. Bars, (A) 2.5 mm, (C, E, G) 250 μm.
Figure 7 with 1 supplement
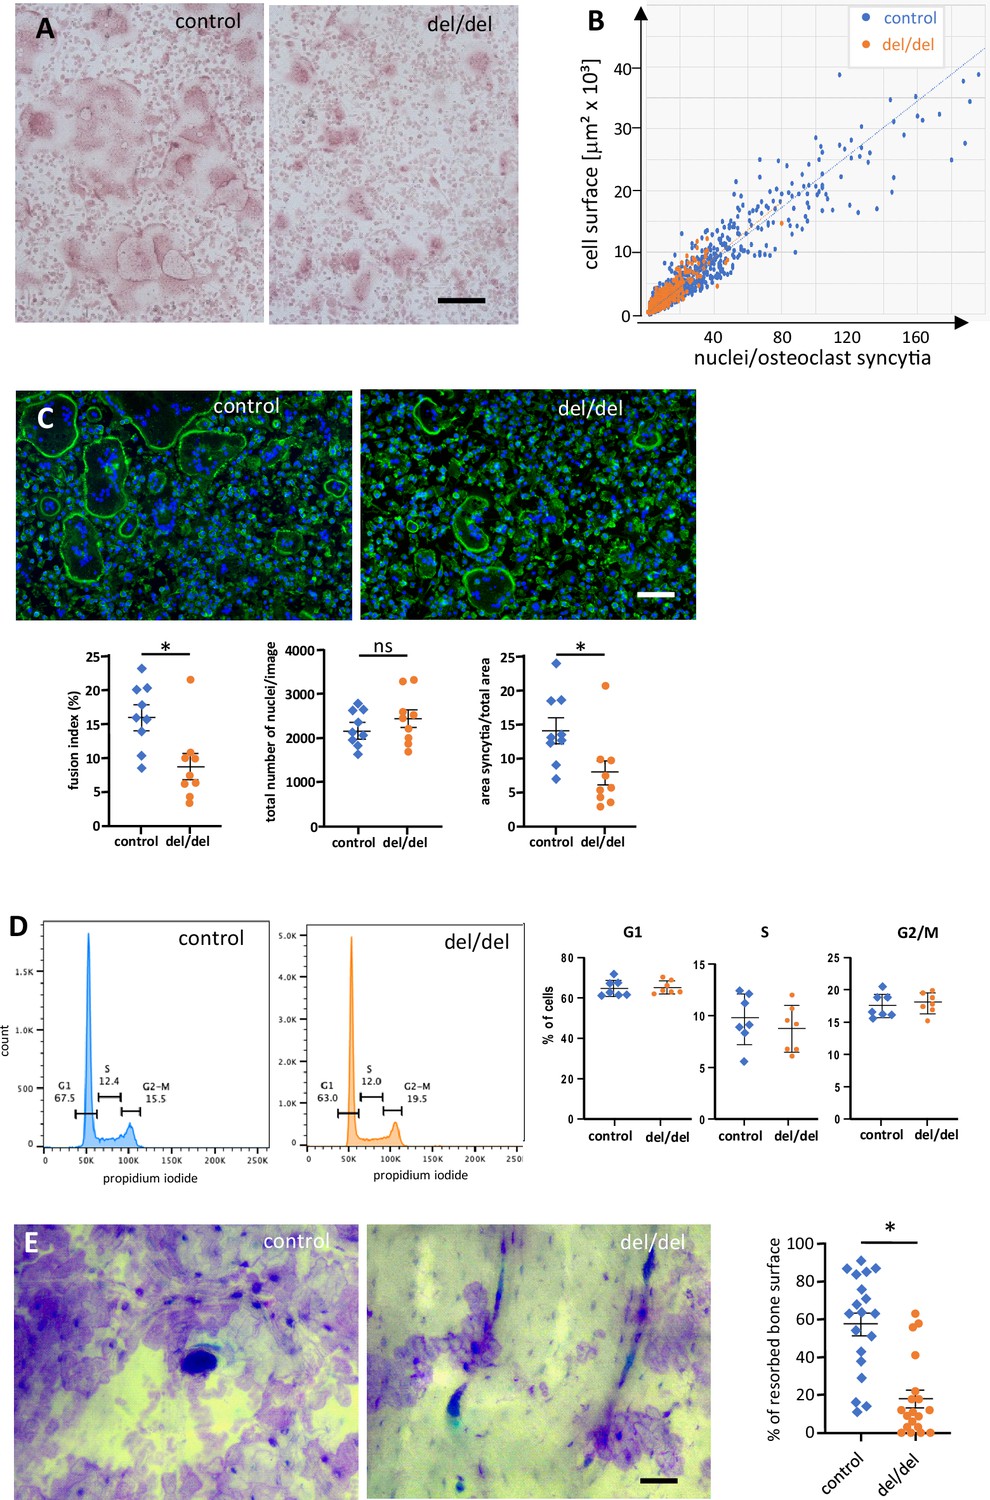
Reduced cell fusion of osteoclast precursors from cultured bone marrow cells.
(A) TRAP staining of osteoclasts from adult mouse bone marrow at day 3 of culture, revealing size differences between controls and ninein del/del. (B) Fusion of precursors cells from bone marrow into osteoclasts, as seen in (A). Correlation of the cell surface with the number of nuclei/syncytium. Large syncytia are significantly less abundant in ninein del/del samples (orange dots). (C) Fusion assay of osteoclast precursors in culture. Representative images of cultures from control and ninein del/del mice, stained with phalloidin-Alexa 488 (F-actin, green) and DAPI (DNA, blue). Corresponding graphs depict the fusion index (number of nuclei in syncytia relative to the total number of nuclei), the total number of nuclei/image, and the area covered by syncytial osteoclasts/total area. For each graph, 3 fields of view (1,700,000 μm2) of each culture from 3 mice were quantified for each genotype. The data were tested for normality using a Shapiro-Wilk test, and a Mann-Whitney test was applied to the quantification of the fusion index and of the syncytial area. Mean ± SEM are indicated. *, p<0.05, ns: not significant. (D) Flow cytometry analysis of osteoclast precursors from bone marrow, one day prior to fusion. Right: quantification of propidium iodide staining in G1, S, and G2/M phases was performed from samples from 3 mice/genotype (to limit pipetting errors, two to three samples were analyzed from each mouse). (E) In vitro-bone-resorption assays. Left: resorption pits from osteoclast cultures from control and ninein del/del mice. Right: quantification of the resorption areas, from image analysis of 6–7 fields of view of each culture from 3 mice/genotype. *, p<0.05. Bars, (A, C) 100 μm, (E) 50 μm.
Figure 7—figure supplement 1
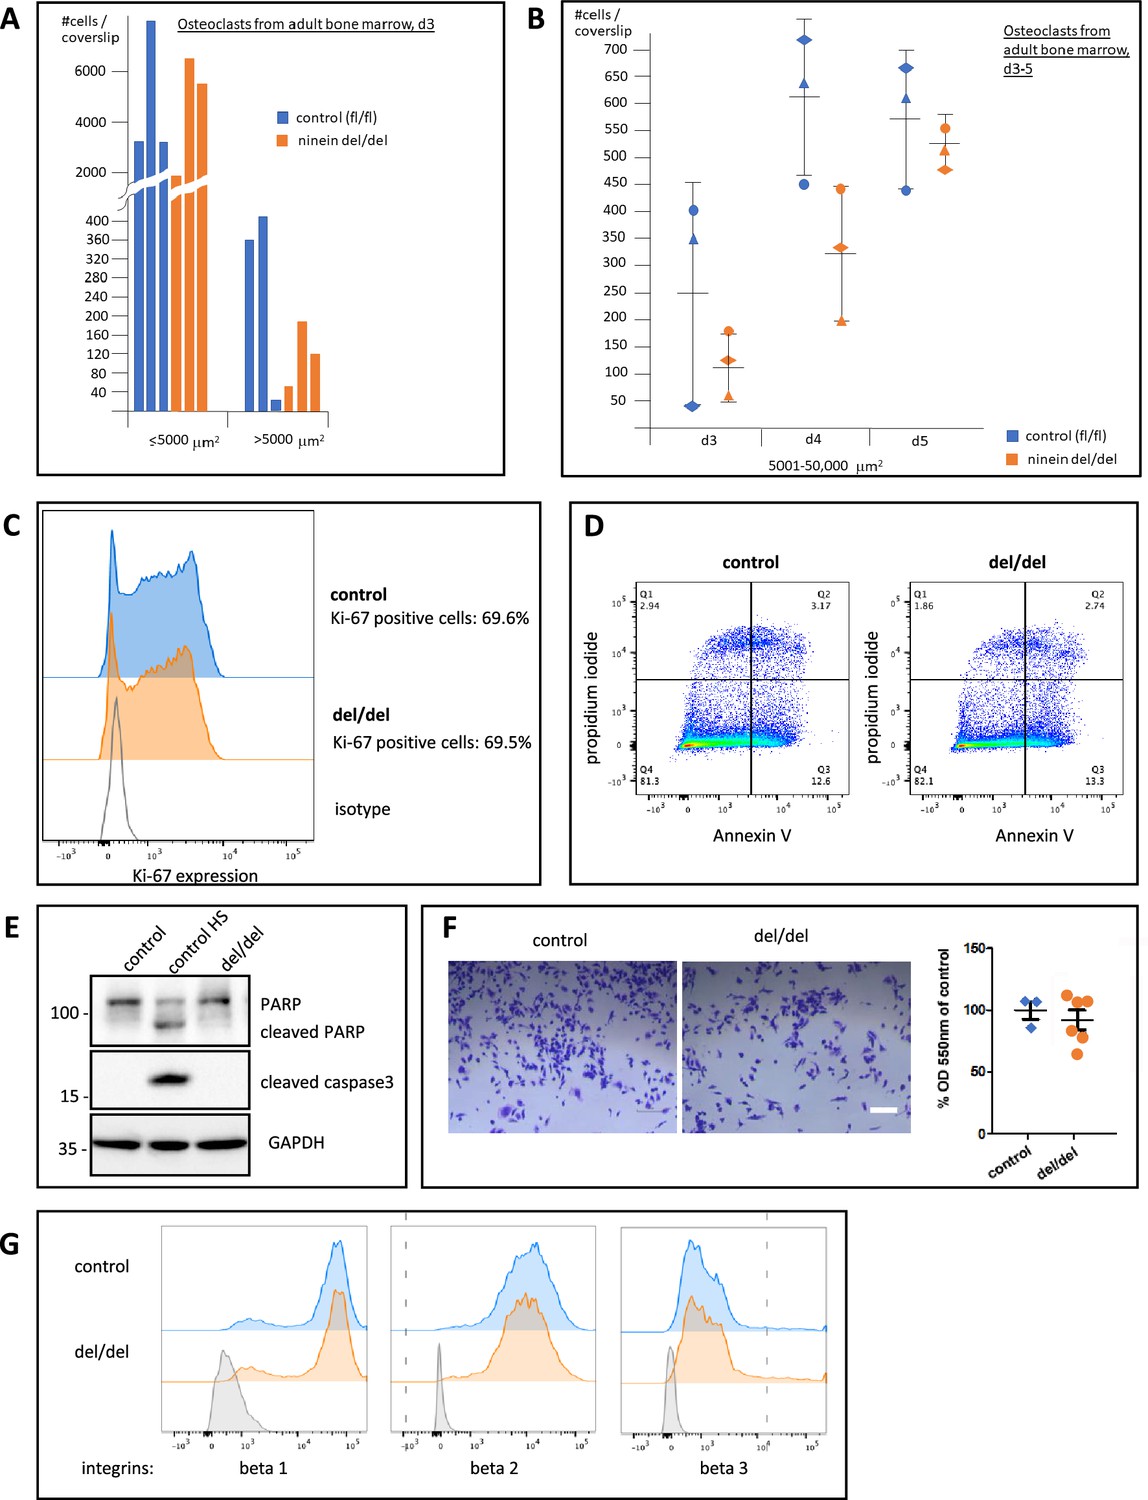
Time course of osteoclast fusion, and rates of proliferation, viability, and cell adhesion of precursor cells.
(A) The surface of TRAP-positive syncytia (≥2 nuclei) was determined on entire coverslips (Ø 12 mm), and categories of syncytia up to 5000 μm2 and above were established. Cell numbers for 3 different mice/genotype are shown on day 3 of culture in the presence of RANK-L. (B) Experiment as in (A), showing the number of large osteoclasts with a surface between 5001 and 50,000 μm2, on days 3, 4, 5 of culture in the presence of RANK-L. (C) Osteoclast precursors from cultures of bone marrow from control and ninein del/del mice, one day before fusion, were stained with antibody against Ki-67 and subjected to flow cytometry. Bottom: staining with isotype control. Representative graph of two experiments. (D) Representative plots of Annexin V-FITC/propidium iodide staining of osteoclast precursors, one day before fusion. Percentages of early apoptotic cells (bottom right quadrant), late apoptotic cells (upper right quadrant) and necrotic cells (upper left quadrant) are shown. Representative graphs of two experiments. (E) Immunoblots of osteoblast precursors from control and ninein del/del mice, one day before fusion, probed with antibodies against poly-(ADP-ribose)-polymerase (PARP) and cleaved caspase 3, to detect apoptotic cells. Antibody against Glyceraldehyde-3-phosphate dehydrogenase (GAPDH) was used as a loading control. The middle lane shows staining of positive control cells following heat shock treatment (45 °C), to induce the cleavage of PARP and caspase 3. (F) The number of osteoclast precursors adhering to multi-well plates one day prior to fusion was quantified by staining cells with crystal violet (left), followed by solubilization of the absorbed dye and measurement at 550 nm. Samples from control and ninein del/del mice were analyzed (n=3 or n=6, respectively). The average of the control measurements was set at 100%, and values from del/del samples were expressed as a percentage of the controls. (G) Analysis of the expression of β-integrins 1, 2, and 3 in osteoclast precursors from control and ninein del/del mice. Cells were stained with surface antibodies and analyzed by flow cytometry. Representative histograms for cell surface integrin expression are shown. Bottom (grey): isotype antibody control. Bar, (F) 100 μm.
-
Figure 7—figure supplement 1—source data 1
Immunoblots of osteoblast precursors from control and ninein del/del mice, one day before fusion, probed with antibodies against poly-(ADP-ribose)-polymerase (PARP) and cleaved caspase 3, and probed with antibody against Glyceraldehyde-3-phosphate dehydrogenase (GAPDH) as a loading control.
- https://cdn.elifesciences.org/articles/93457/elife-93457-fig7-figsupp1-data1-v2.pdf
Figure 8
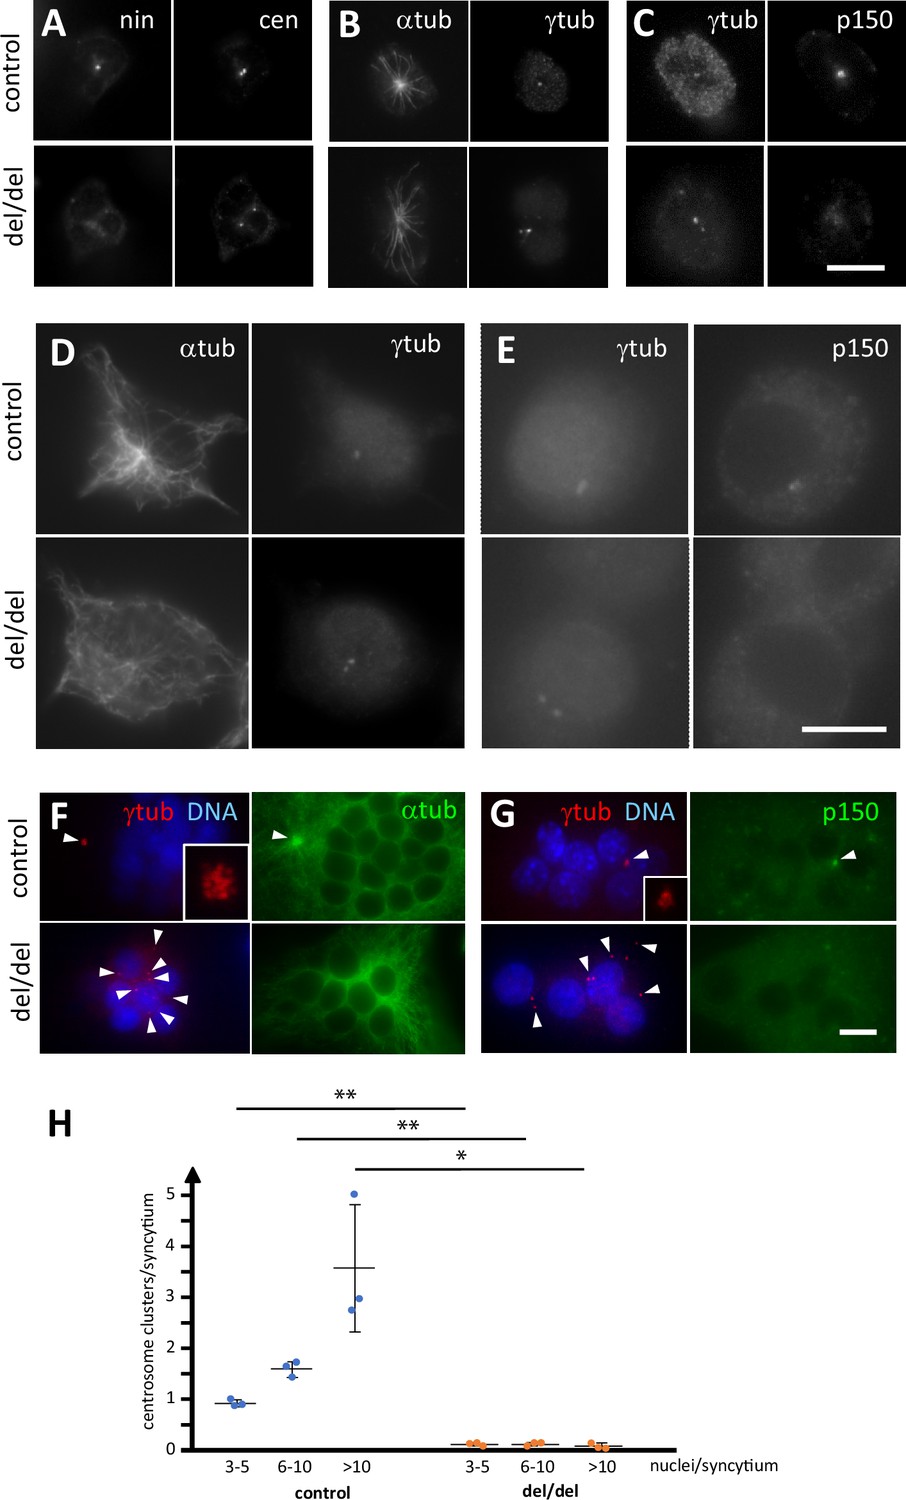
Abnormal centriole clustering in osteoclast cultures from ninein-deleted animals.
(A) Double immunofluorescence of neonatal osteoclast progenitors for ninein (nin) and centrin (cen), (B) α and γ-tubulin, and (C) γ-tubulin and dynactin-subunit p150. Controls (upper images) and ninein-deleted cells (lower images, del/del) are shown. (D, E) Osteoclast precursors obtained from adult bone marrow cell culture, after 2 days in the presence of M-CSF and RANKL, labelled for (D) α and γ-tubulin, or (E) γ-tubulin and dynactin p150. Controls (upper images) and ninein-deleted cells (lower images, del/del) are shown. (F) In vitro-differentiated osteoclasts obtained from the culture of adult bone marrow cells after 3 days, labelled for α and γ-tubulin, or (G) γ-tubulin and dynactin p150, and nuclei stained with DAPI (DNA). The lower panels are from ninein del/del adult bone marrow and display lack of clustering of centrioles (arrowheads), as compared to controls that show clustering of the majority of centrioles in a single focus. Microtubules are focused in the area of centriole clustering (F, single arrowhead), and dynactin p150 is enriched in the cluster (G) in controls only (single arrowhead). Insets show enlarged views of the centriole clusters. (H) The average number of centriole clusters in differentiated osteoclast cultures was determined. Clusters were defined as having 3 or more signals of γ-tubulin within 1 μm of each other. Three categories of osteoclasts were distinguished: small (3–5 nuclei), medium (6–10 nuclei), and large ones (>10 nuclei). The average number of clusters/syncytium is shown for each mouse by blue or orange circles, from cultures of n=3 mice/genotype (approximately 300 osteoclasts/coverslip were analyzed). *, p<0.01; **, p<0.05. Bars, (A–F) 10 μm.
Additional files
-
Supplementary file 1
Forelimb and hindlimb bone characteristics in control and ninein-deleted mice.
Table, indicating the lengths of various bones from embryos at E16.5 and E18.5, from control and ninein del/del embryos.
- https://cdn.elifesciences.org/articles/93457/elife-93457-supp1-v2.docx
-
MDAR checklist
- https://cdn.elifesciences.org/articles/93457/elife-93457-mdarchecklist1-v2.pdf
Download links
A two-part list of links to download the article, or parts of the article, in various formats.
Downloads (link to download the article as PDF)
Open citations (links to open the citations from this article in various online reference manager services)
Cite this article (links to download the citations from this article in formats compatible with various reference manager tools)
Loss of ninein interferes with osteoclast formation and causes premature ossification
eLife 13:e93457.
https://doi.org/10.7554/eLife.93457


