Experimental evolution for the recovery of growth loss due to genome reduction
- School of Life and Environmental Sciences, University of Tsukuba, Japan
Figures
Figure 1 with 2 supplements

Fitness increase of the reduced genome mediated by experimental evolution.
(A) Temporal changes in growth rate. Color variation indicates the nine evolutionary lineages. (B) Growth rate and maximal population size of the reduced genome. Blue and pink indicate the common ancestor and the nine evolved populations, respectively. Standard errors are shown according to the biological replications (N = 4–6). (C) Boxplots of growth rate and maximum. Cross and open circles indicate the mean and individual values, respectively. Statistical significance evaluated by Mann–Whitney U tests is indicated. (D) Correlation between growth rate and maximum. Spearman’s rank correlation coefficient and p-value are indicated.
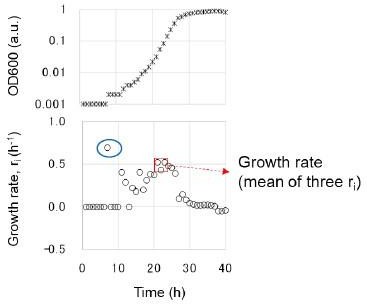
Figure 1—figure supplement 1
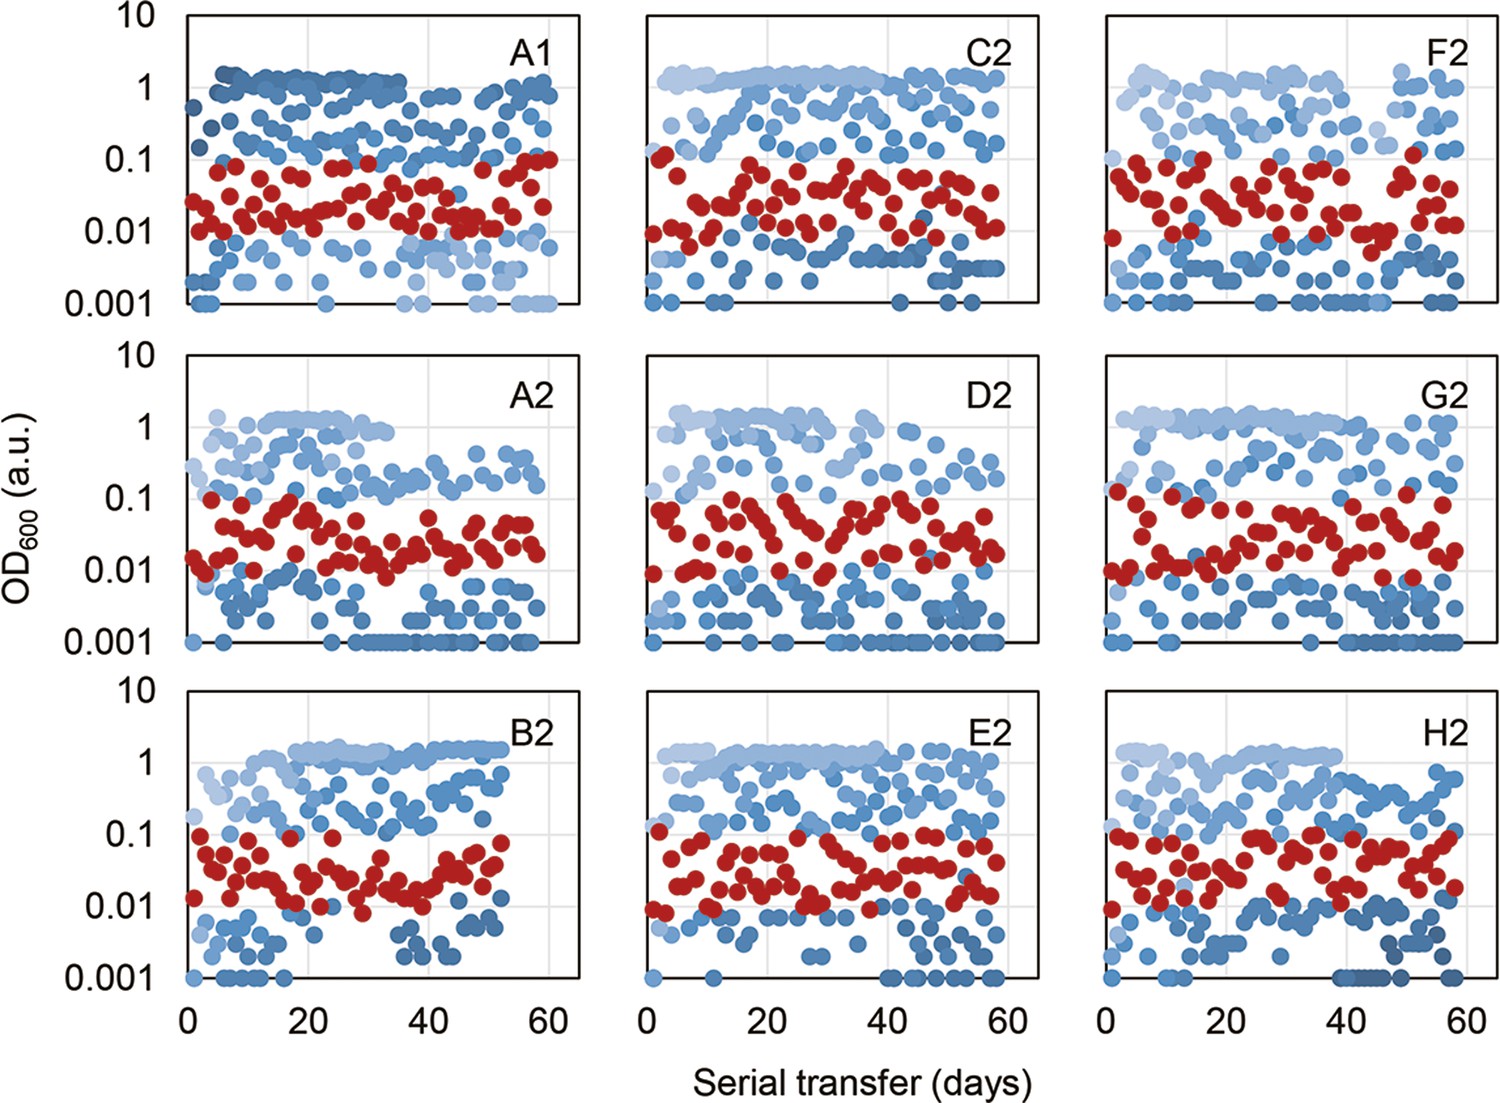
Temporal OD600 records of the overnight cultures.
Four different dilution rates of serial transfer were made for each evolutionary lineage, indicated in the blue gradation. Only one of the four overnight cultures in the exponential growth phase (OD600 = 0.01–0.1) was chosen for the following serial transfer, highlighted in red.
Figure 1—figure supplement 2
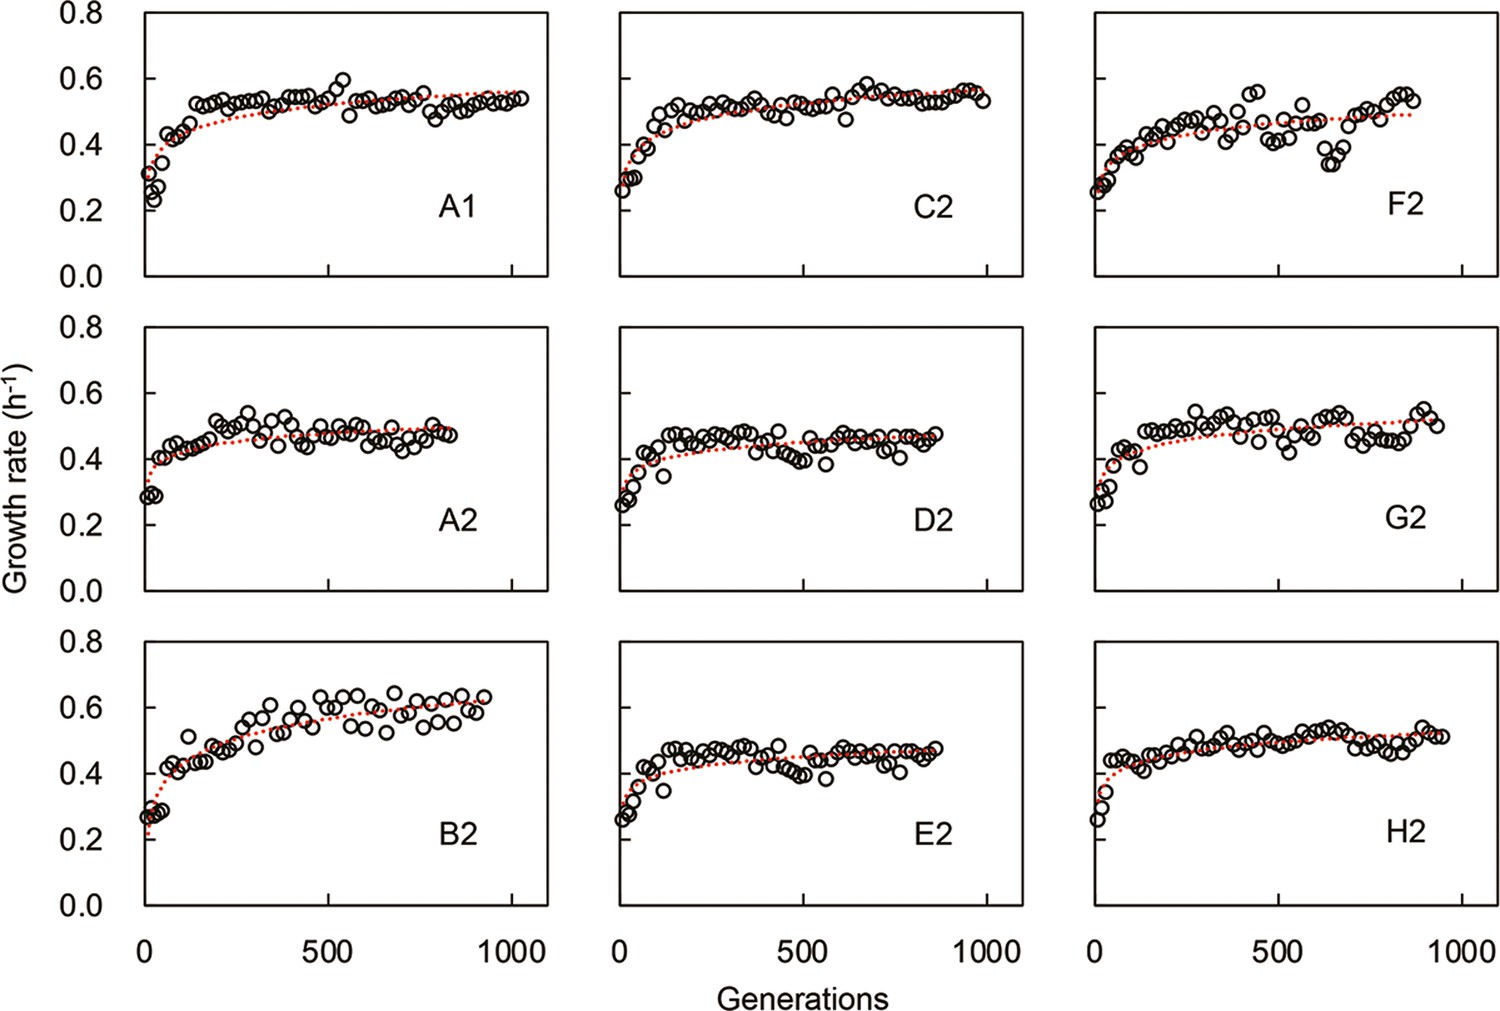
Temporal changes in growth rate during experimental evolution.
The nine evolutionary lineages are shown separately, equivalent to Figure 1A. The red lines are the logarithmic regression of the changing growth rates.
Figure 2
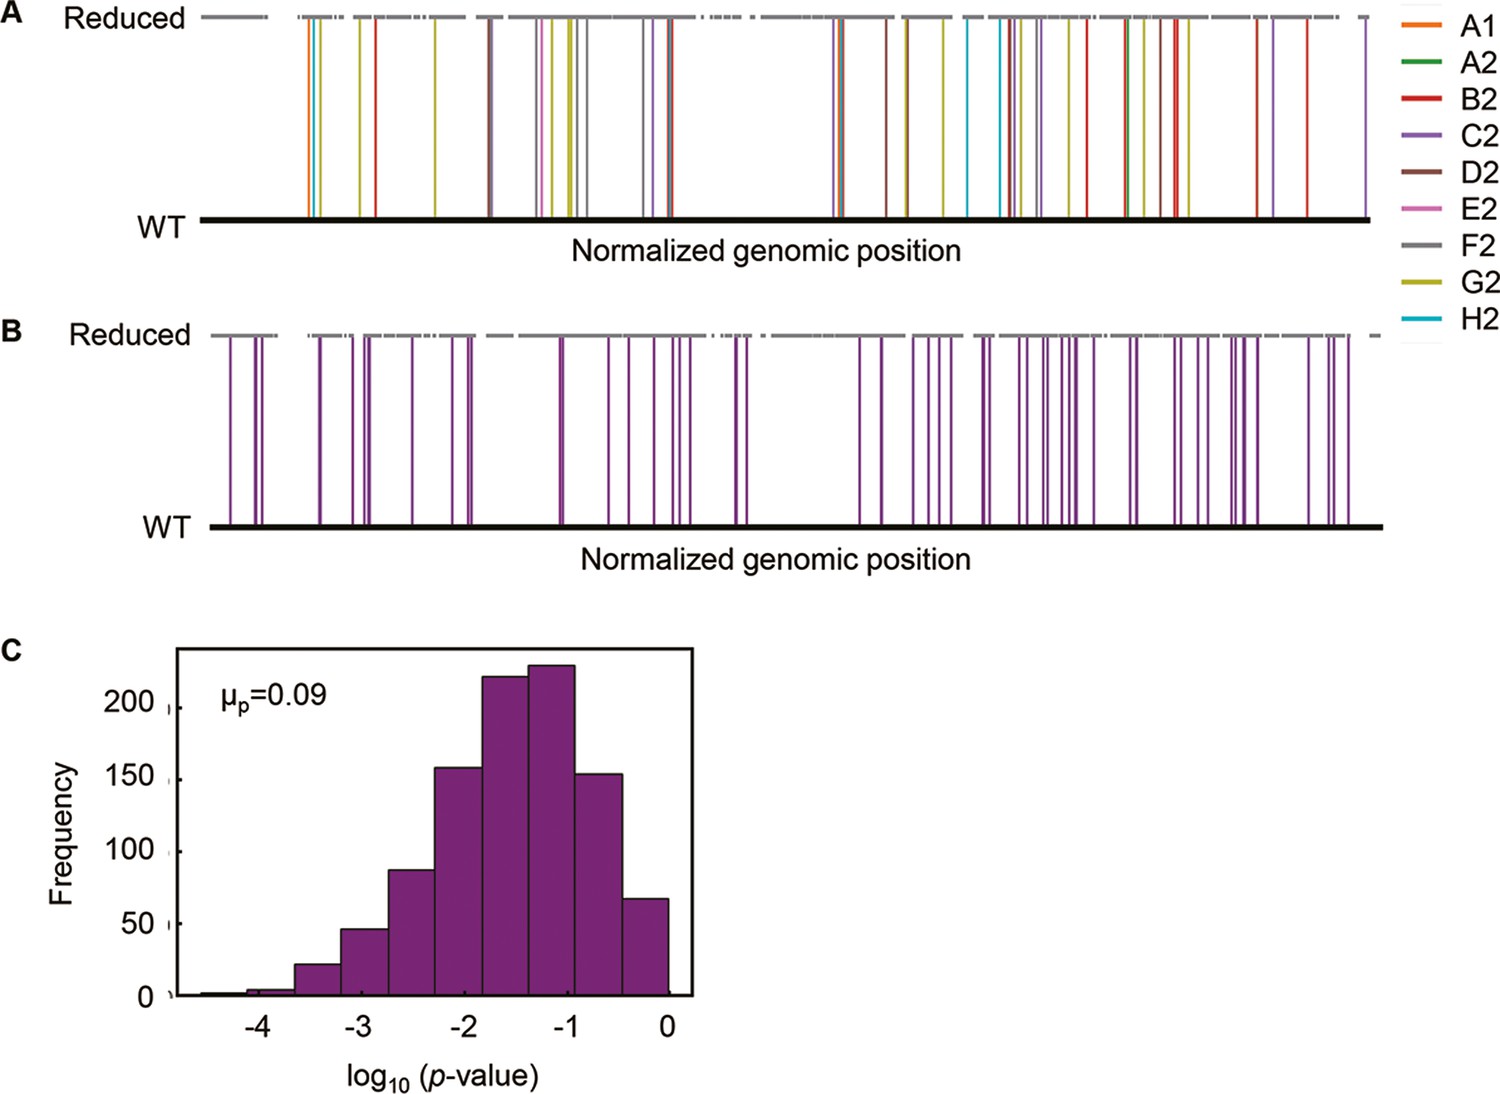
Genomic localization of mutations.
(A) Normalized genomic positions of all mutations. The vertical lines highlight the total 65 mutations fixed in the nine Evos. Color variation indicates the nine Evos. WT and reduced represent the wild-type and reduced genomes used in the present study. (B) Normalized genomic positions of random mutations. The simulation of 65 mutations randomly fixed in the reduced genome was performed 1000 times. As an example of the simulation, the genomic positions of 65 random mutations are shown. The vertical lines in purple indicate the mutations. (C) Statistical significance of the genome locational bias of mutations. The distance from the mutated location to the nearest genomic scar caused by genome reduction was calculated. The mutations accumulated in the nine Evos and the 1000-time random simulation were all subjected to the calculation. The significance of genome locational bias of the mutations in Evos was evaluated by Welch’s t-test. The histogram of 1000 tests for 1000 simulated results is shown. The mean of p-values (μp) is indicated, which is within the 95% confidence interval (0.07 < μp < 0.09).
Figure 3

Chromosomal periodicity of transcriptome and mutated gene expression.
(A) Chromosomal periodicity of transcriptomes. The transcriptomes of the nine Evos are shown. Black lines, red curves, and red vertical lines indicate the gene expression levels, fitted periods, and locations of mutations, respectively. Ori and dif are indicated with the vertical broken lines. (B) Boxplot of gene expression levels. Gene expression levels of the 49 mutated genes in the nine Evos and the remaining 3225 genes are shown. Statistical significance evaluated by Welch’s t-test is indicated.
Figure 4 with 2 supplements

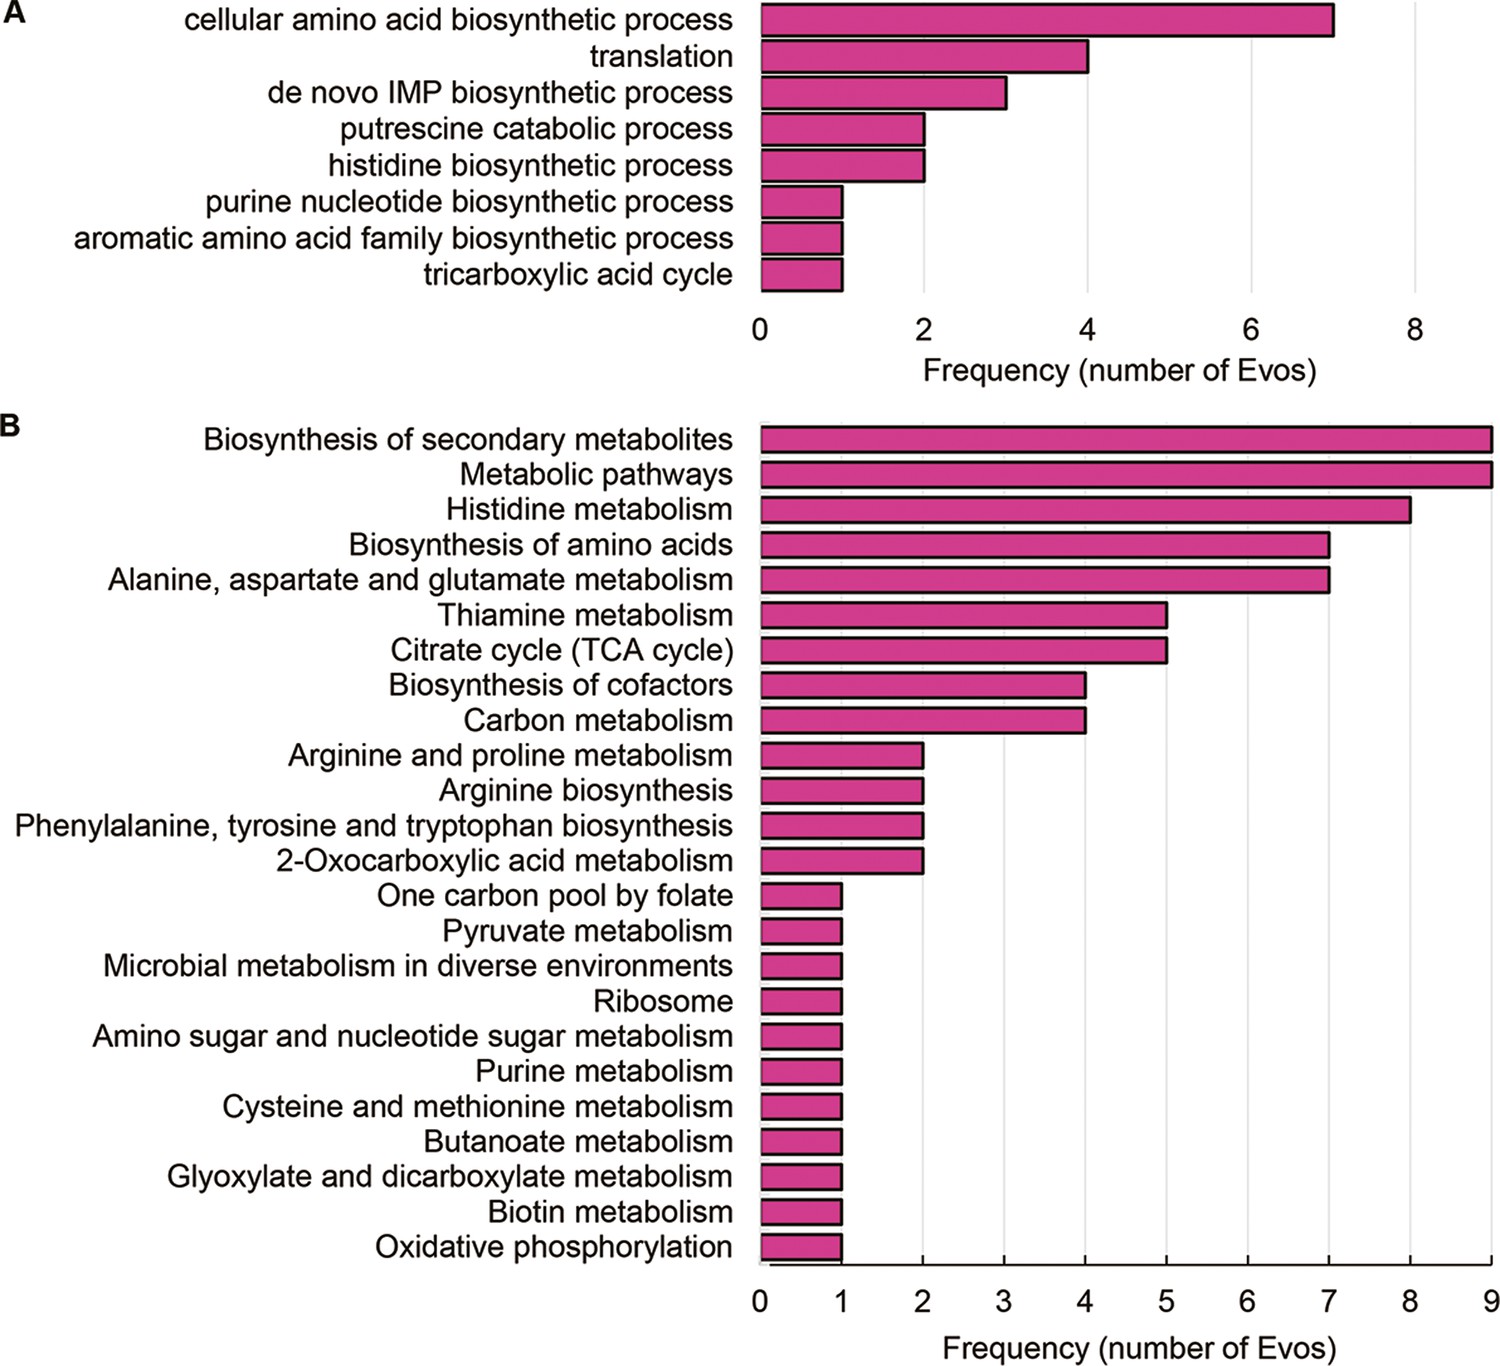
Differentially expressed genes (DEGs) and their enriched functions.
(A) Commonality of DEGs in the nine Evos. Closed circles represent the combinations of the Evos. Vertical and horizontal bars indicate the number of the overlapped DEGs in the combinations and the number of all DEGs in each Evos, respectively. The combinations with more than 20 DEGs in common are shown. (B) The number of DEGs overlapped among the Evos. The numbers of DEGs overlapped across 2–9 Evos are shown. The number of Evos detected in the single Evos is indicated as 1. (C) Enriched function in common. The Kyoto Encyclopedia of Genes and Genomes (KEGG) and Gene Ontology (GO) terms enriched in the common DEGs across the nine Evos are shown. The statistical significance (false discovery rate [FDR]) of the enriched pathways and biological processes is shown on a logarithmic scale represented by color gradation.
Figure 4—figure supplement 1
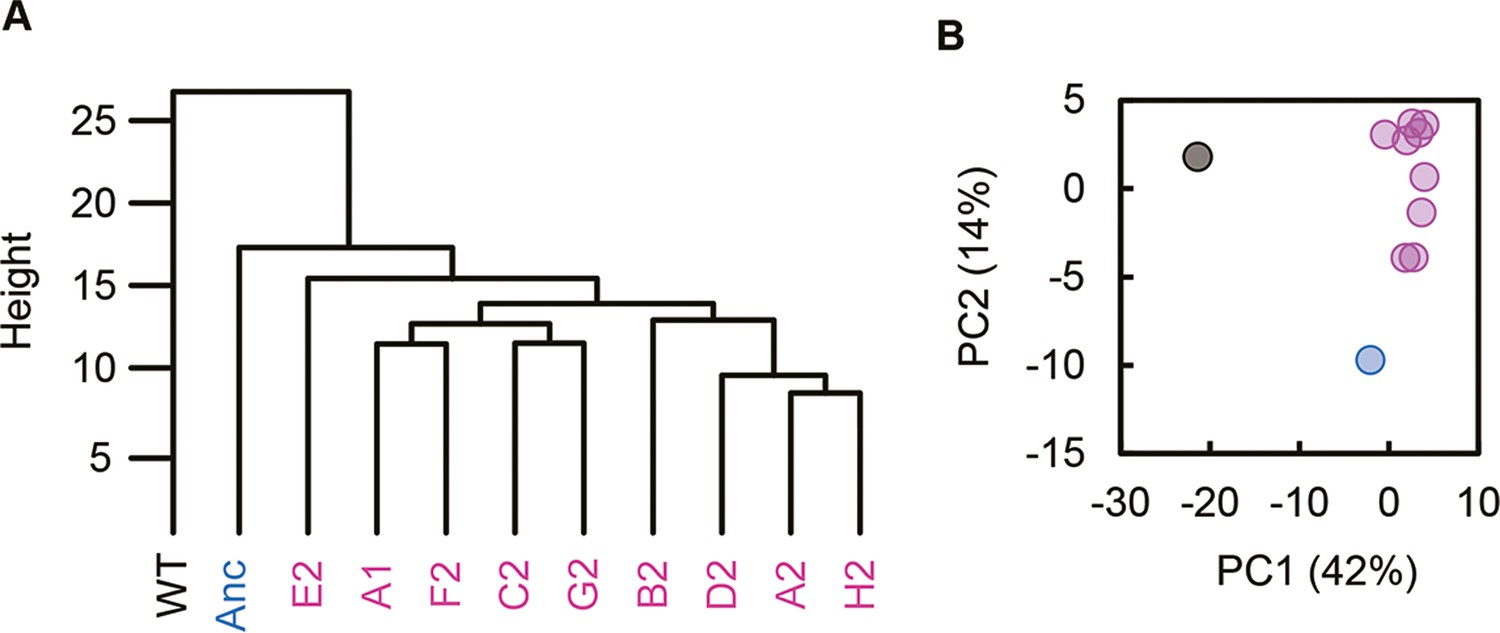
Clustering and principal component analysis of transcriptomes.
(A) Hierarchical clustering. (B) Principal component analysis. PC1 and PC2 components are shown. Black, blue, and pink represent the wild-type, reduced, and evolved genomes, respectively.
Figure 4—figure supplement 2
Enriched functions of differentially expressed genes (DEGs) in Evos.
(A) Kyoto Encyclopedia of Genes and Genomes (KEGG) pathways. (B) Gene Ontology (GO) terms. The number of the Evos sharing the same enriched functions is shown.
Figure 5 with 2 supplements
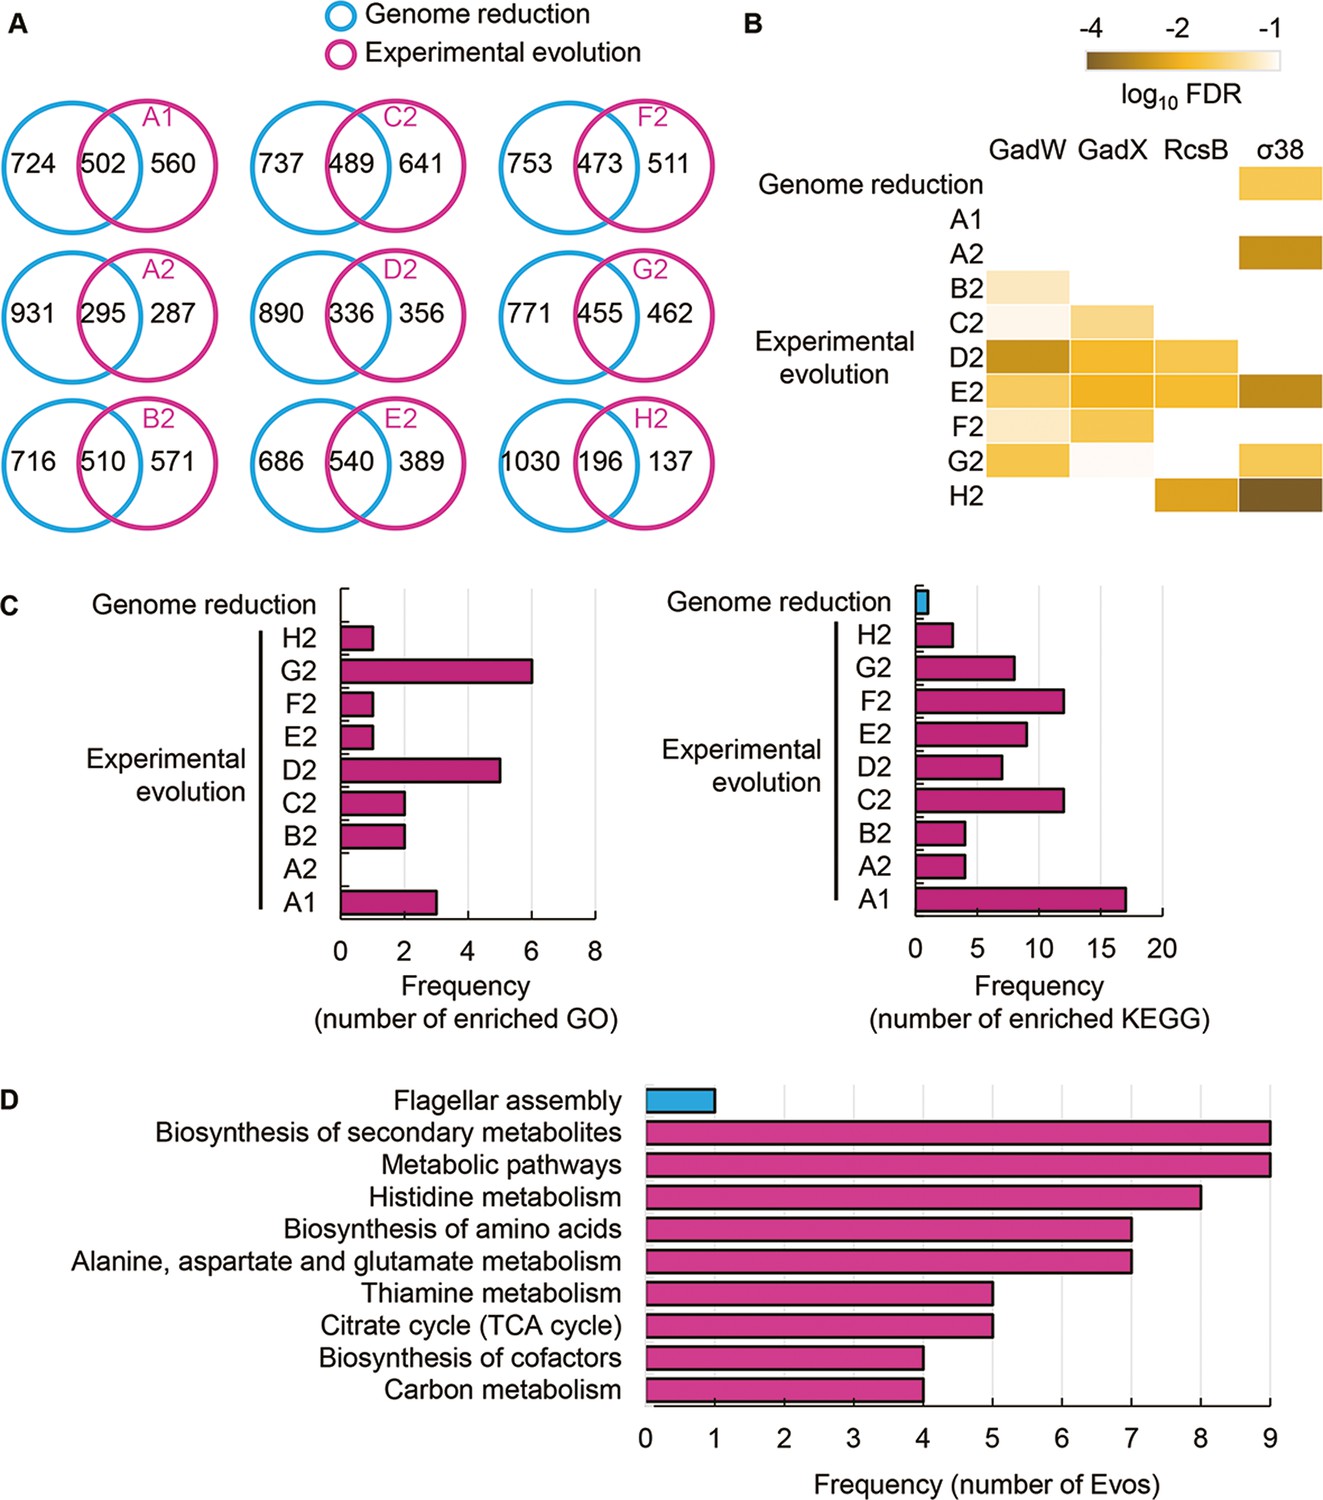
Transcriptome comparison between genome reduction and evolution.
(A) Venn diagrams of differentially expressed genes (DEGs) induced by genome reduction and evolution. The number of individual and overlapped DEGs is indicated. (B) Heatmap of enriched regulons. Statistically significant regulons are shown with the false discovery rate (FDR) values on a logarithmic scale. (C) Number of enriched functions in common. Left and right panels indicate the numbers of enriched Gene Ontology (GO) terms and Kyoto Encyclopedia of Genes and Genomes pathways caused by genome reduction and evolution, respectively. (D) Enriched functions in common. The overlapped GO terms enriched in the nine Evos and genome reduction are shown. Blue and pink represent genome reduction and evolution, respectively.
Figure 5—figure supplement 1
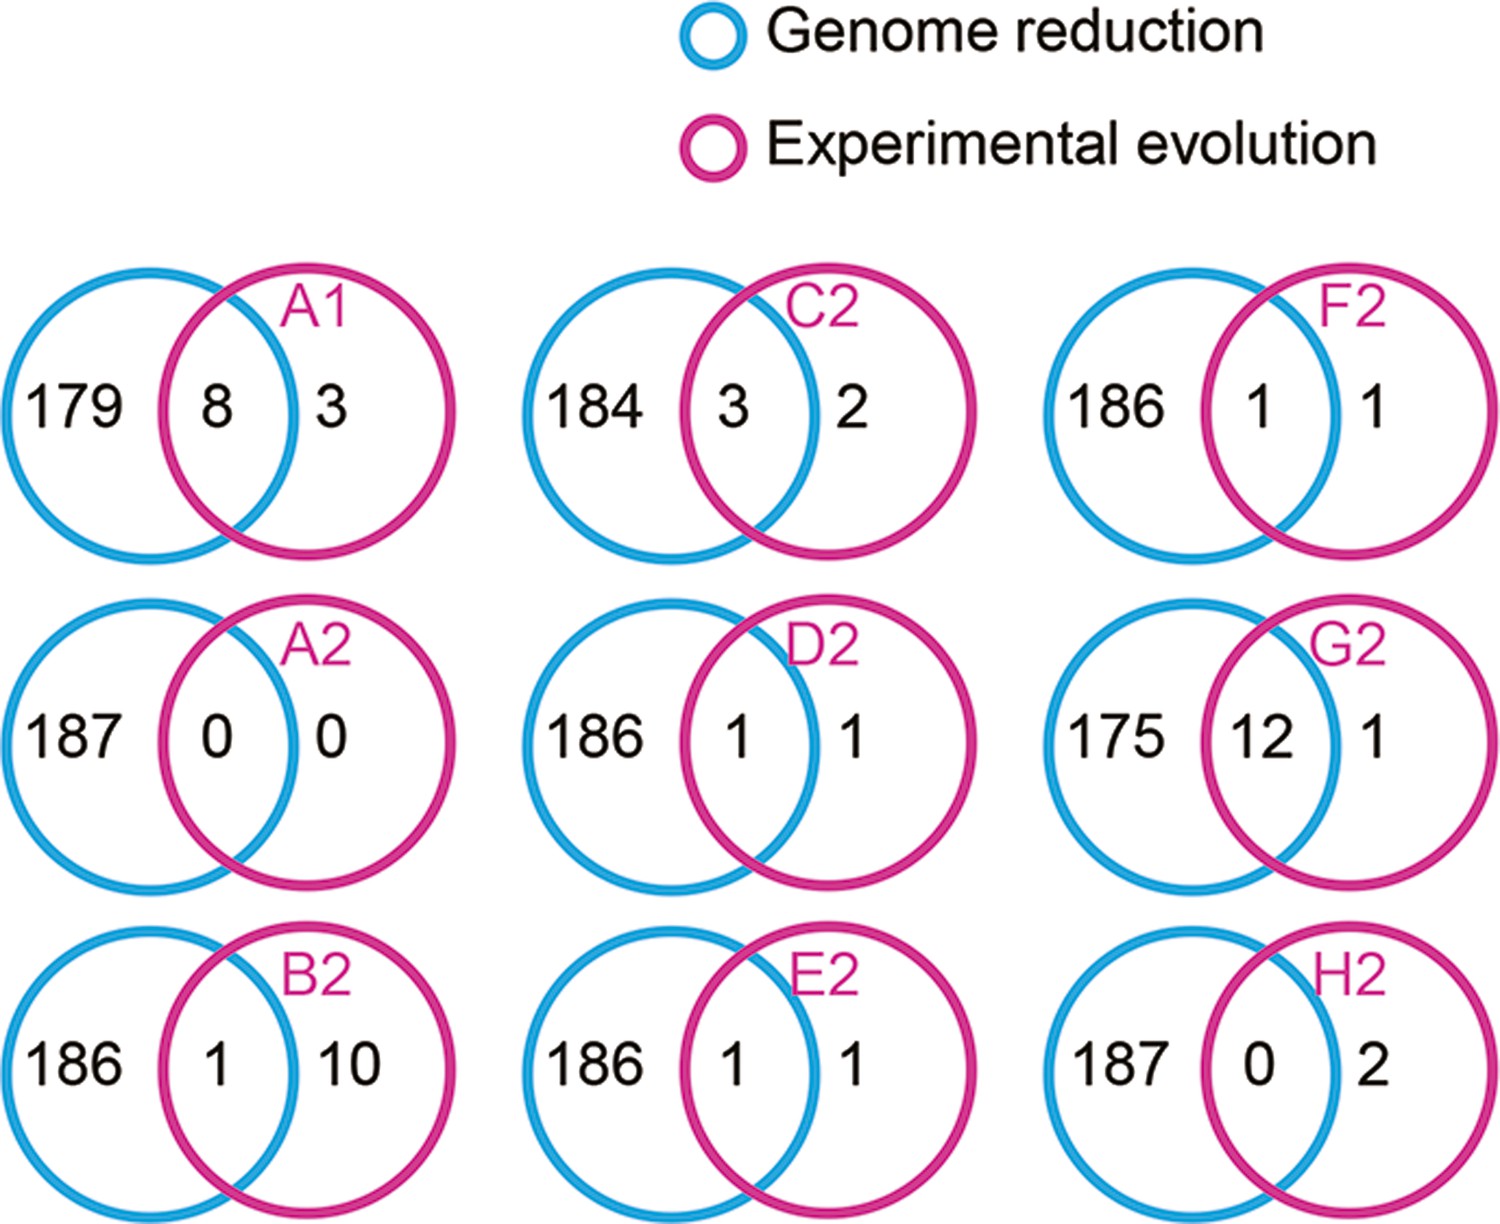
Venn diagrams of the differentially expressed genes (DEGs) determined by RankProd.
The number of individual and overlapped DEGs induced by genome reduction and evolution is indicated.
Figure 5—figure supplement 2
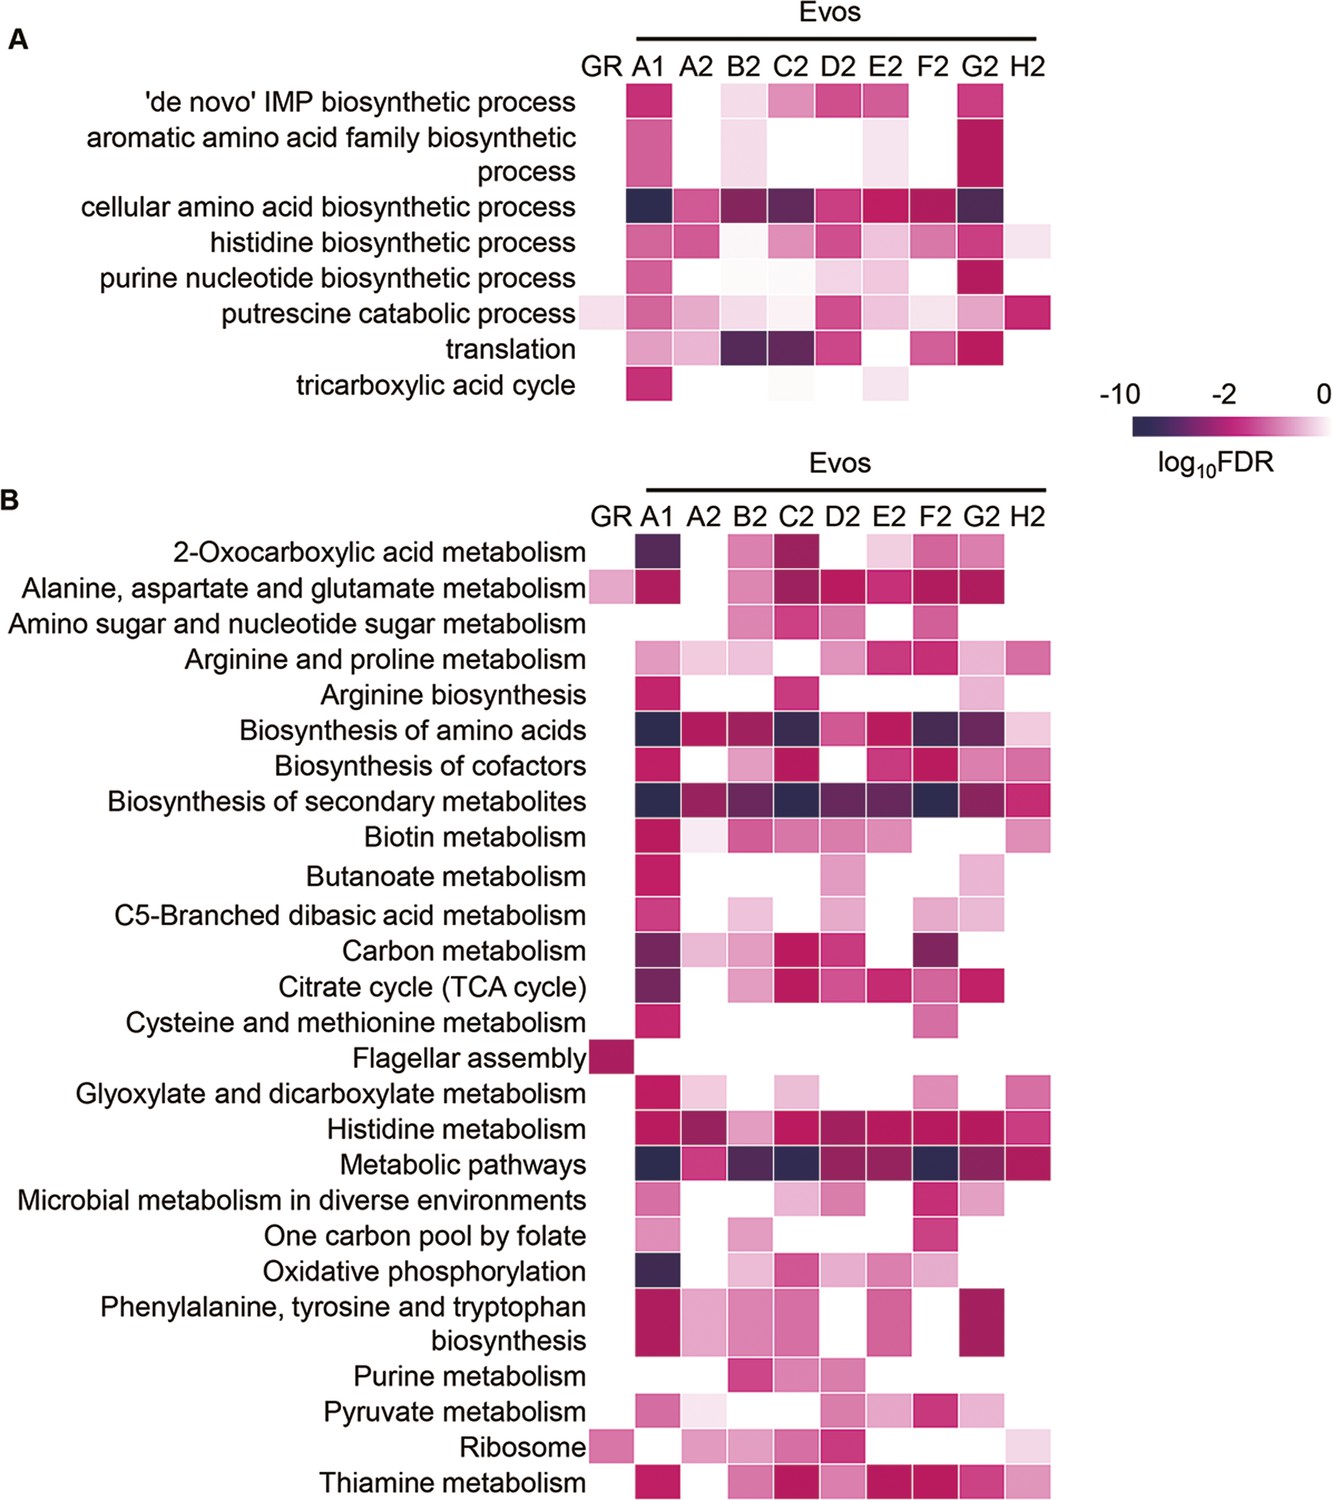
Heatmap of the significance of enriched functions.
(A) Kyoto Encyclopedia of Genes and Genomes (KEGG) pathway. (B) Gene Ontology (GO) term. GR and Evos indicate the genome reduction and evolution, respectively. The statistical significance (false discovery rate [FDR]) of the enriched pathways and biological processes is shown on a logarithmic scale represented by color gradation.
Figure 6 with 1 supplement

Reconstructed gene modules.
(A) Cluster dendrogram of the gene modules reconstructed by weighted gene co-expression network analysis (WGCNA). A total of 21 gene modules (M1–M21) were reconstructed. The significance of the correlation coefficients of the gene modules to growth, mutation, and expression is represented in purple gradation. From light to dark indicates the logarithmic p-values from high to low. (B) Enriched functions of gene modules and deletion. Enriched gene categories, regulons, and GO terms are shown from left to right. The number of the genes assigned in the three gene modules and the genomic deletion for genome reduction is indicated in the brackets. Color gradation indicates the normalized p-values on a logarithmic scale.
Figure 6—figure supplement 1

Reconstruction of gene modules according to transcriptomes.
(A) Gene modules clustered by weighted gene co-expression network analysis (WGCNA). (B) Gene modules reconstructed by WGCNA. A total of 21 modules newly constructed are represented in gradation. The number of genes assigned in each module is indicated.
Figure 7
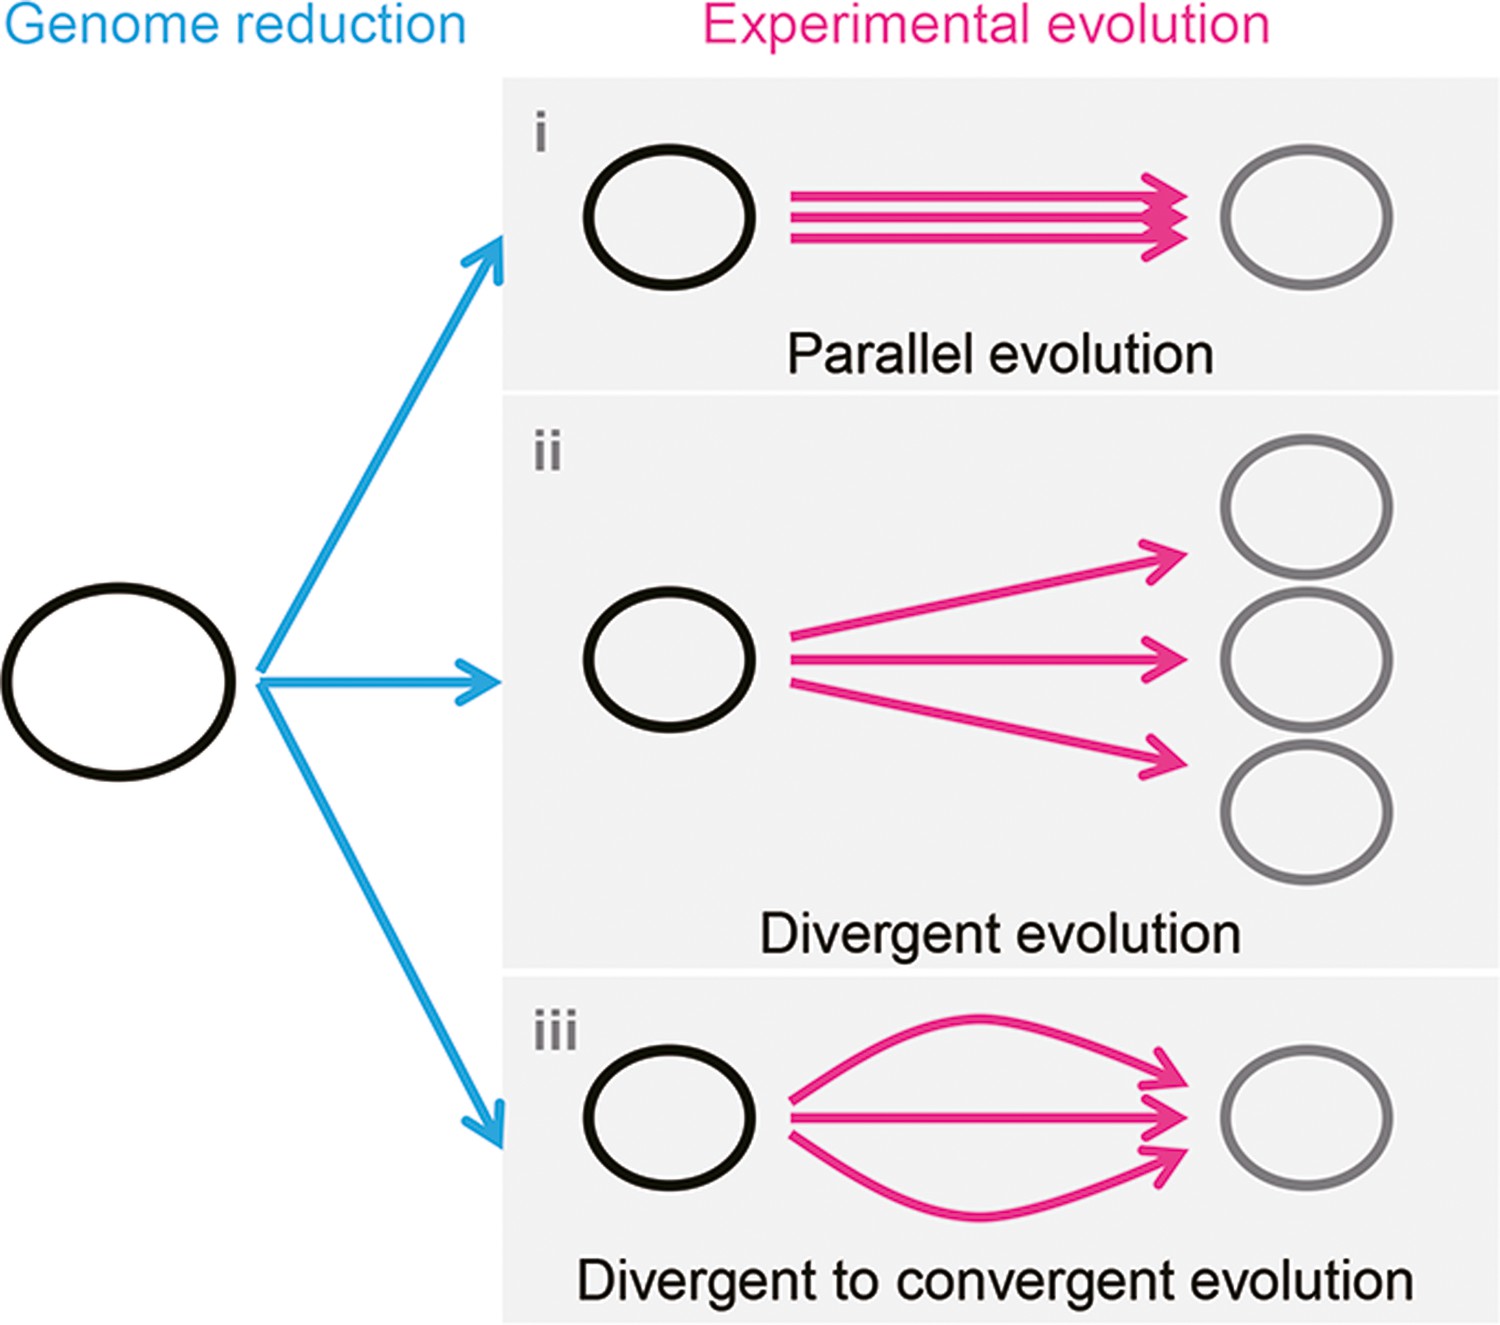
Schematic drawing of evolutionary approaches for the reduced genome.
Three evolutionary strategies are proposed. Pink and blue arrowed lines indicate experimental evolution and genome reduction, respectively. The size of the open cycles represents the genome size. Black and gray indicate the ancestor and evolved genomes, respectively.
Author response image 1

Author response image 2
Author response image 3
Tables
Table 1
Overview of fixed genome mutations.
The number of mutations in the nine Evos is shown separately and summed. SNP, N, and S indicate single nucleotide substitution, nonsynonymous, and synonymous SNP, respectively.
| Evos | All | Intergenic | Genic | Genic SNP | ||
|---|---|---|---|---|---|---|
| Indel | SNP | N | S | |||
| A1 | 3 | 0 | 0 | 2 | 1 | 1 |
| A2 | 2 | 1 | 0 | 1 | 1 | 0 |
| B2 | 13 | 0 | 1 | 11 | 9 | 2 |
| C2 | 11 | 1 | 0 | 9 | 8 | 1 |
| D2 | 7 | 0 | 1 | 5 | 4 | 1 |
| E2 | 3 | 1 | 0 | 1 | 1 | 0 |
| F2 | 8 | 1 | 0 | 6 | 5 | 1 |
| G2 | 12 | 2 | 2 | 6 | 4 | 2 |
| H2 | 6 | 0 | 2 | 4 | 3 | 1 |
| Sum | 65 | 6 | 6 | 45 | 36 | 9 |
Additional files
-
Supplementary file 1
Daily records of experimental evolution.
The time and OD600 of overnight culture, the well (dilution rate) used for the serial transfer, and the calculated generation and growth rate are shown. All nine evolutionary lineages are summarized.
- https://cdn.elifesciences.org/articles/93520/elife-93520-supp1-v1.xlsx
-
Supplementary file 2
Statistics of genome sequencing.
The parameters acquired in the genome resequencing, which represent the goodness of the sequencing, are summarized.
- https://cdn.elifesciences.org/articles/93520/elife-93520-supp2-v1.xlsx
-
Supplementary file 3
List of genome mutations.
The total 65 mutations fixed in the Evos are summarized. The type of mutation, the position in the reduced genome, distance to the nearest genomic scar, changes in DNA and amino acid, gene function, essentiality (e, essential; n, nonessential), gene category, etc., are indicated. Note that the entire population held the mutations, i.e., 100% frequency in DNA sequencing.
- https://cdn.elifesciences.org/articles/93520/elife-93520-supp3-v1.xlsx
-
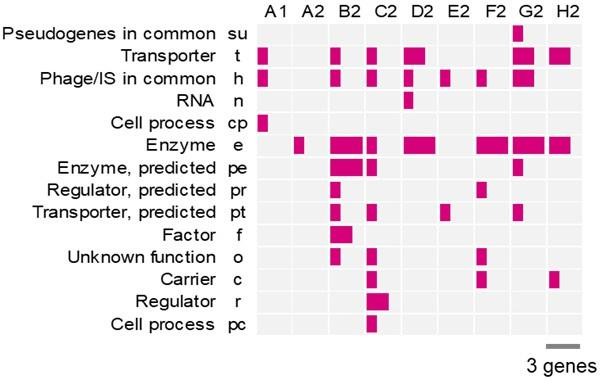
Supplementary file 4
Gene categories comprising the mutated genes.
The full names and abbreviations of the gene categories are shown. The number of mutated genes in each gene category is tallied for each Evos.
- https://cdn.elifesciences.org/articles/93520/elife-93520-supp4-v1.xlsx
-
Supplementary file 5
Statistics of chromosomal periodicity of transcriptomes.
The maximal peak (wavelength) acquired by the Fourier transform, the number of periods resulting from the curve fitting, the Fisher’s g test, and the p-values are summarized.
- https://cdn.elifesciences.org/articles/93520/elife-93520-supp5-v1.xlsx
-
Supplementary file 6
List of the overlapped DEGs.
A total of 108 DEGs are summarized. Gene ID, gene name, and gene function are indicated.
- https://cdn.elifesciences.org/articles/93520/elife-93520-supp6-v1.xlsx
-
Supplementary file 7
Datasheet of normalized gene expression.
Gene expression levels are shown in the logarithmic value of FKPM. Gene ID, gene name, strain name, and nine evolutionary lineages are indicated. N0 and N28 represent the wild-type and reduced genomes, respectively.
- https://cdn.elifesciences.org/articles/93520/elife-93520-supp7-v1.xlsx
-
MDAR checklist
- https://cdn.elifesciences.org/articles/93520/elife-93520-mdarchecklist1-v1.docx
Download links
A two-part list of links to download the article, or parts of the article, in various formats.
Downloads (link to download the article as PDF)
Open citations (links to open the citations from this article in various online reference manager services)
Cite this article (links to download the citations from this article in formats compatible with various reference manager tools)
Experimental evolution for the recovery of growth loss due to genome reduction
eLife 13:RP93520.
https://doi.org/10.7554/eLife.93520.3


