Random genetic drift sets an upper limit on mRNA splicing accuracy in metazoans
- Laboratoire de Biometrie et Biologie Evolutive, CNRS, Universite Lyon 1, France
Figures
Figure 1
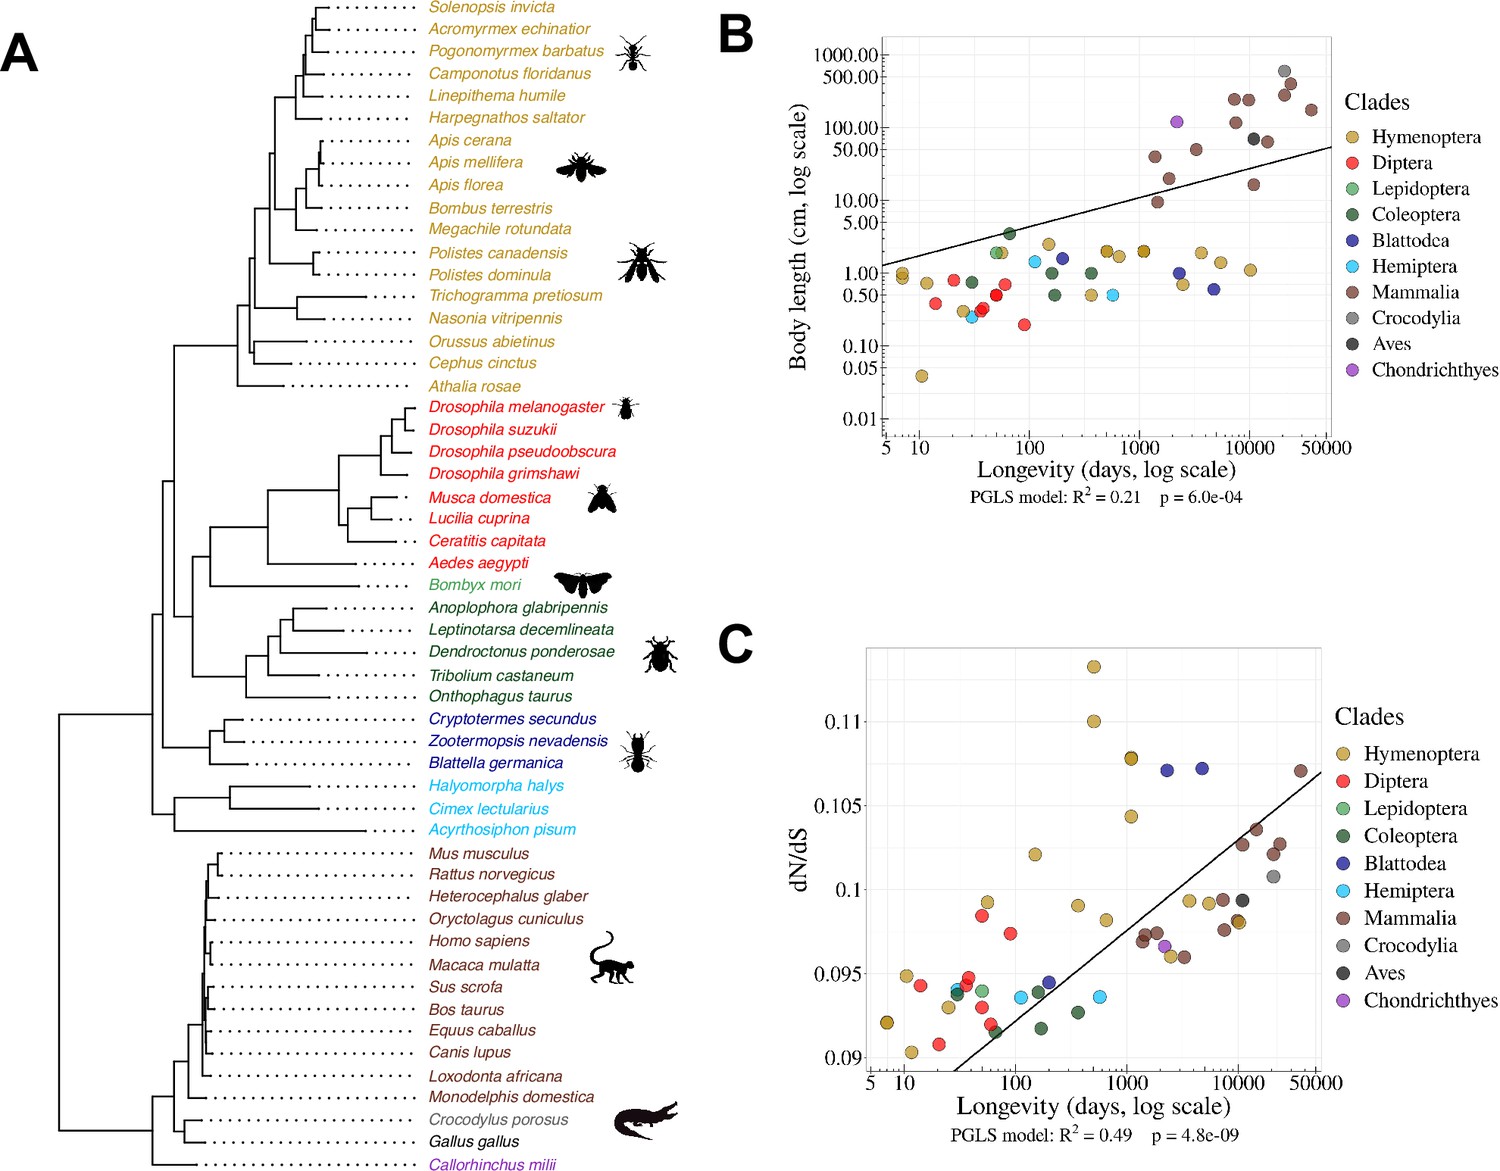
Species phylogeny and Ne proxies.
(A) Phylogenetic tree of the 53 studied species (15 vertebrates and 38 insects). (B) Relationship between body length (cm, log scale) and longevity (days, log scale) of the organism. Each dot represents one species (colored by clade, as in the species tree in panel A). (C) Relationship between longevity (days, log scale) and the ratio on terminal branches of the phylogenetic tree (Materials and methods). (B,C) PGLS stands for Phylogenetic Generalized Least Squared regression, which takes into account phylogenetic inertia (Materials and methods).
-
Figure 1—source data 1
Summary of the main features of the samples analyzed in this study.
- https://cdn.elifesciences.org/articles/93629/elife-93629-fig1-data1-v1.zip
-
Figure 1—source data 2
Longevity and body lenth across the 53 metazoans studied.
- https://cdn.elifesciences.org/articles/93629/elife-93629-fig1-data2-v1.zip
Figure 2 with 3 supplements
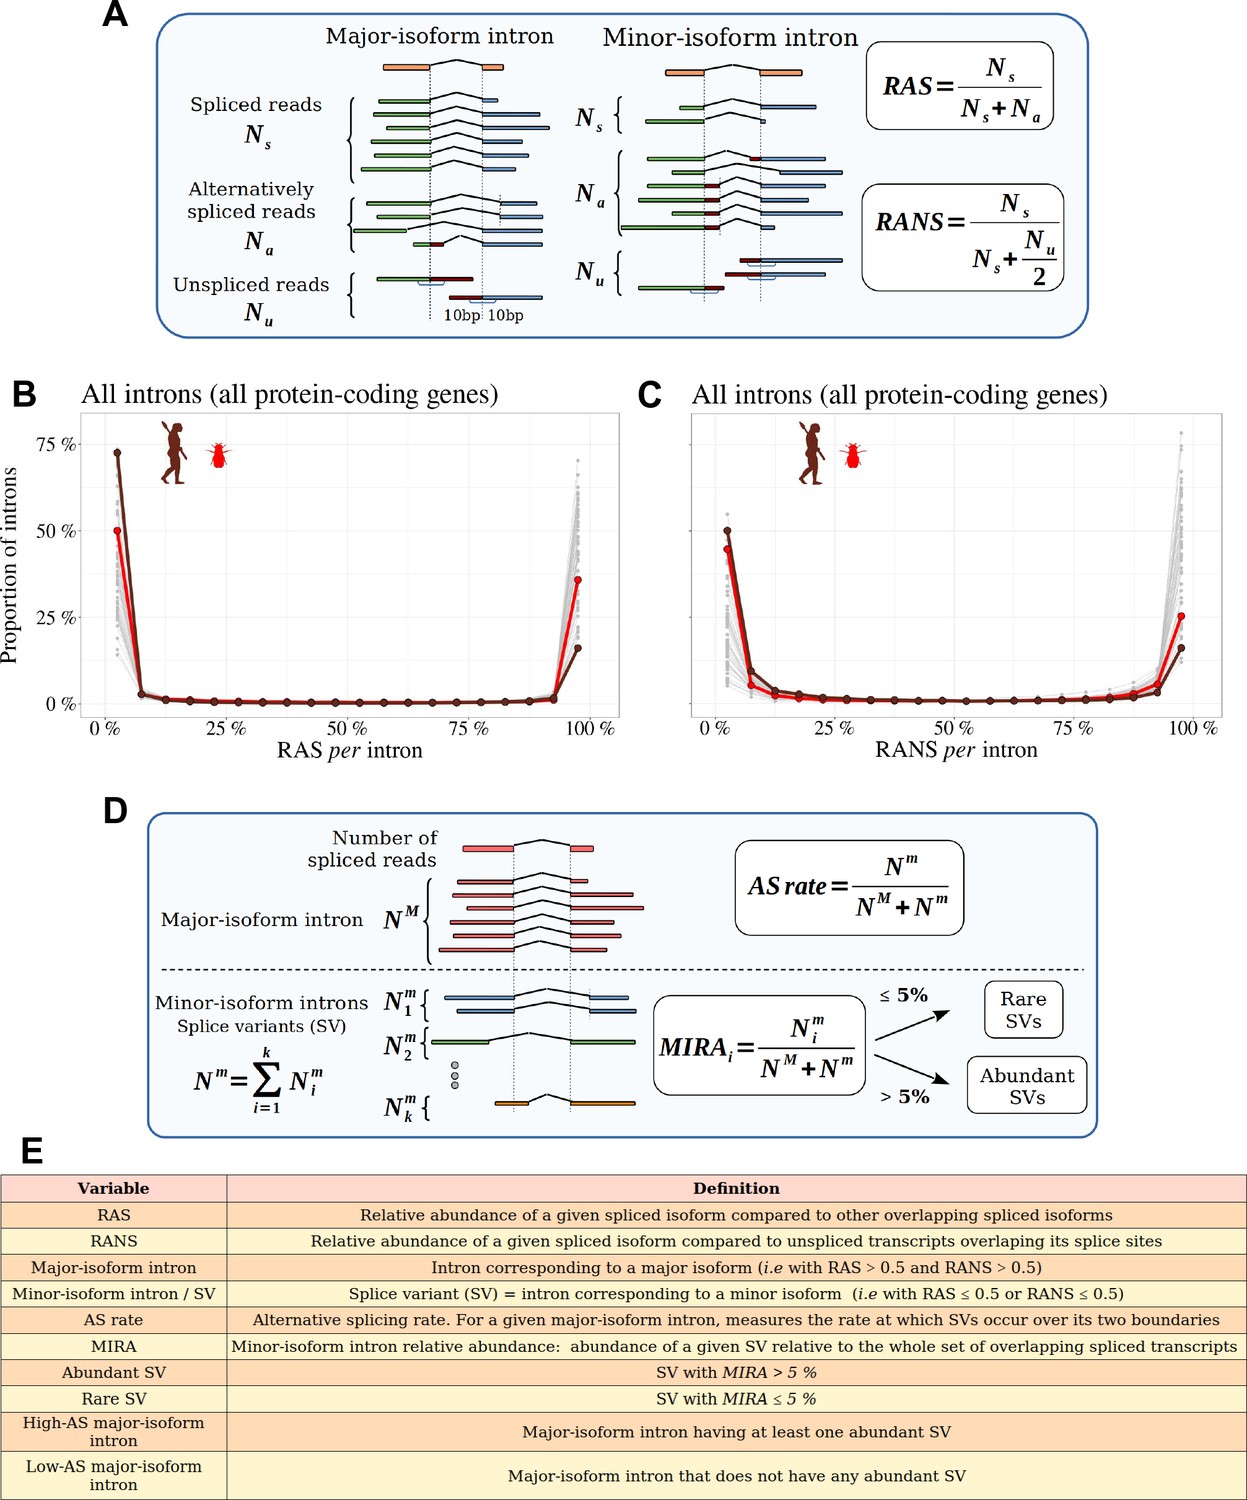
Distinguishing major and minor-isoform introns and measuring the rate of alternative splicing.
(A) Definition of the variables used to compute the relative abundance of a spliced isoform compared to other transcripts with alternative splice boundaries (RAS) or compared to unspliced transcripts (RANS): : number of spliced reads corresponding to the precise excision of the focal intron; : number of reads corresponding to alternative splice variants relative to this intron (i.e. sharing only one of the two intron boundaries); : number of unspliced reads, co-linear with the genomic sequence. (B,C) Histograms representing the distribution of RAS and RANS values (divided into 5% bins), for protein-coding gene introns. Each line represents one species. Two representative species are colored: Drosophila melanogaster (red), Homo sapiens (brown). (D) Description of the variables used to compute the AS rate of a given a major-isoform intron, and the ’minor-isoform intron relative abundance’ (MIRA) of each of its splice variants (SVs): : number of spliced reads corresponding to the excision of the major-isoform intron; : number of spliced reads corresponding to the excision of a minor-isoform intron (i); : total number of spliced reads corresponding to the excision of minor-isoform introns. (E) Definitions of the main variables used in this study.
Figure 2—figure supplement 1
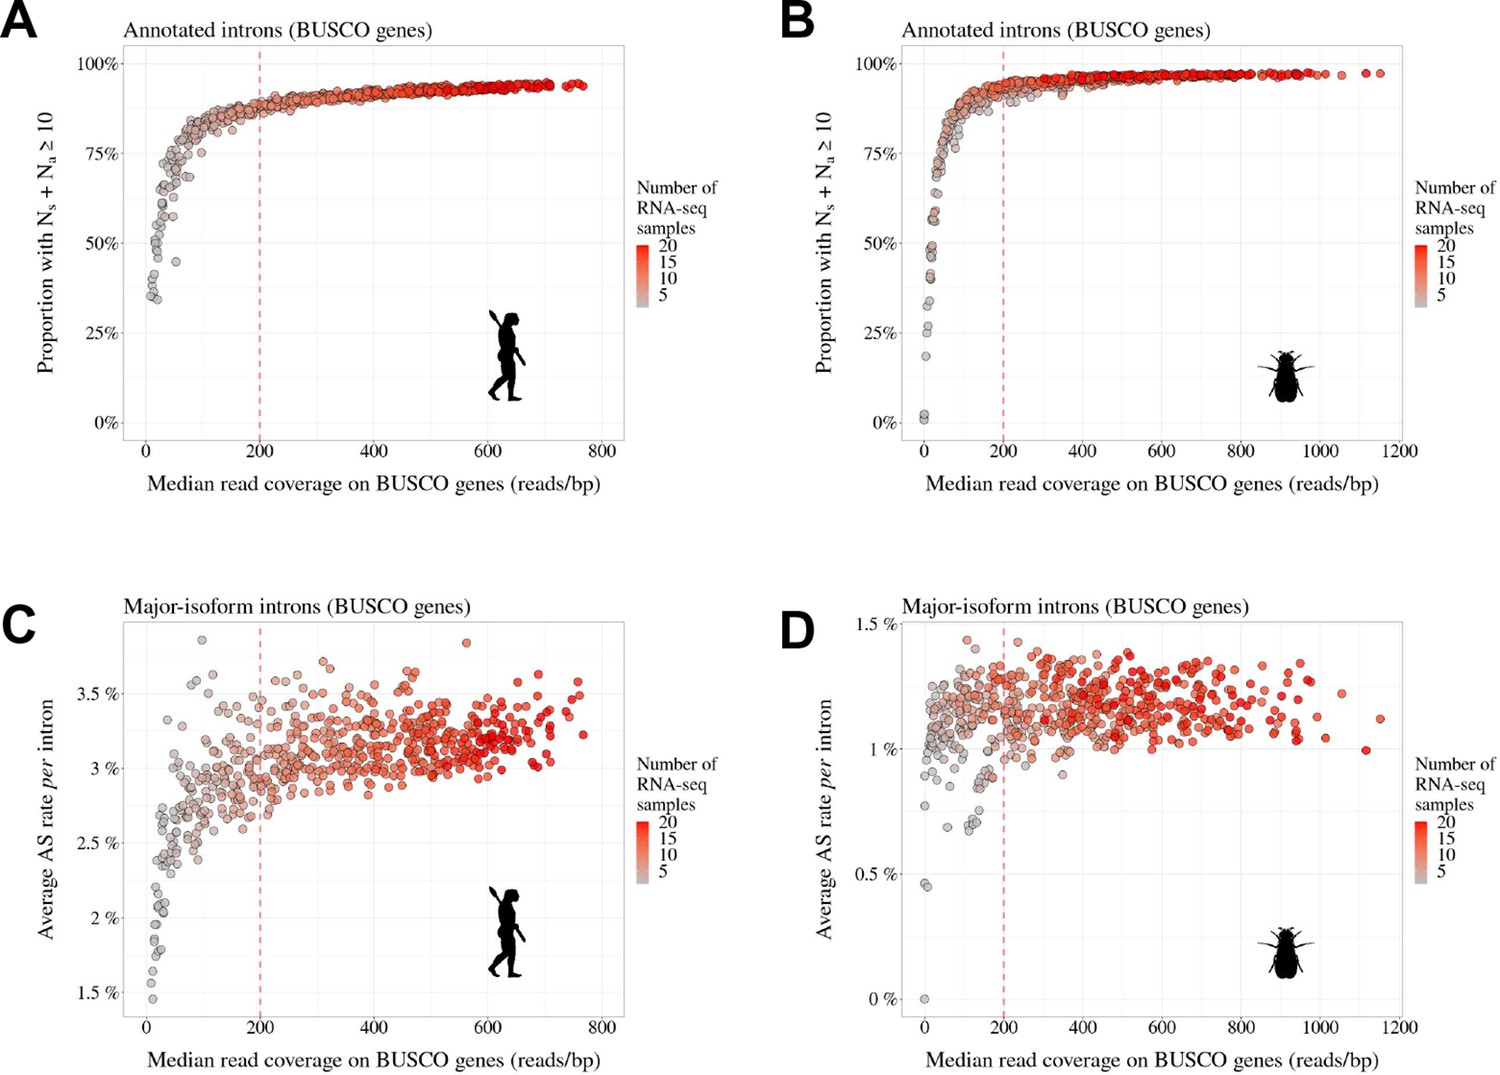
Transcriptome sequencing depth affects intron detection power and AS rate estimates.
To assess the impact of sequencing depth on AS detection, we conducted a pilot analysis with two species (A,C: Homo sapiens and B,D: Drosophila melanogaster) for which hundreds of RNA-seq samples are available (; refer to Data10-supp.tab in the Zenodo data repository). We randomly drew 1–20 RNA-seq samples and, for each draw, we computed the median read coverage across BUSCO gene exons (to get a measure of transcriptome sequencing depth that is comparable across species). We also computed for each draw the average AS rate and the fraction of introns supported by at least 10 RNA-seq reads, out of all introns annotated for BUSCO genes (Materials and methods). We repeated this procedure 30 times. As expected, the fraction of BUSCO introns that are supported by at least 10 reads (i.e. ) increases with sequencing depth (A,B). More importantly, we observed that when sequencing depth is limited, the mean AS rate of BUSCO introns is very variable across draws (C,D). However, AS rate estimates converge when sequencing depth exceeds 200. We therefore kept for further analysis those species for which the median read coverage across exonic regions of BUSCO genes was above this threshold.
Figure 2—figure supplement 2
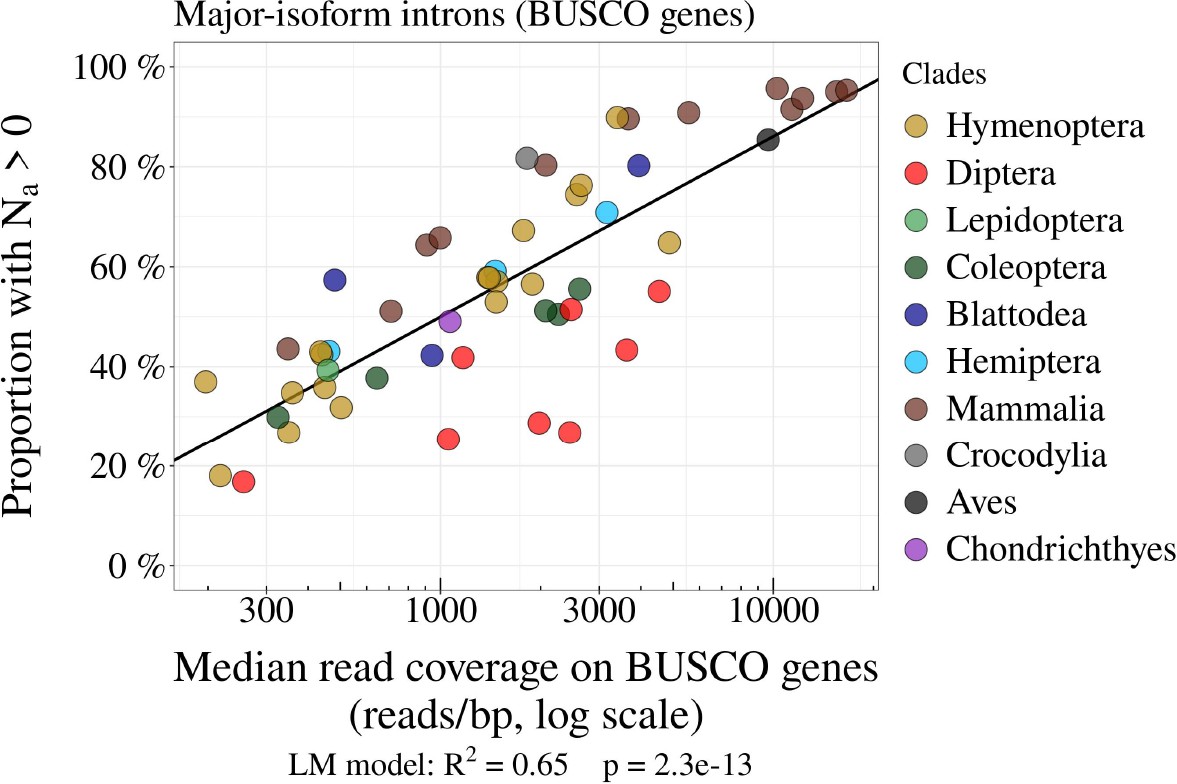
The power to detect AS events is positively correlated with transcriptome sequencing depth.
Relationship between the proportion of major-isoform introns that have at least one read corresponding to splice variants (i.e.Na>0; see Figure 2), and the median per-base read coverage computed on BUSCO gene exons, across metazoans. Each dot represents one species, colored by taxonomic clade.
Figure 2—figure supplement 3
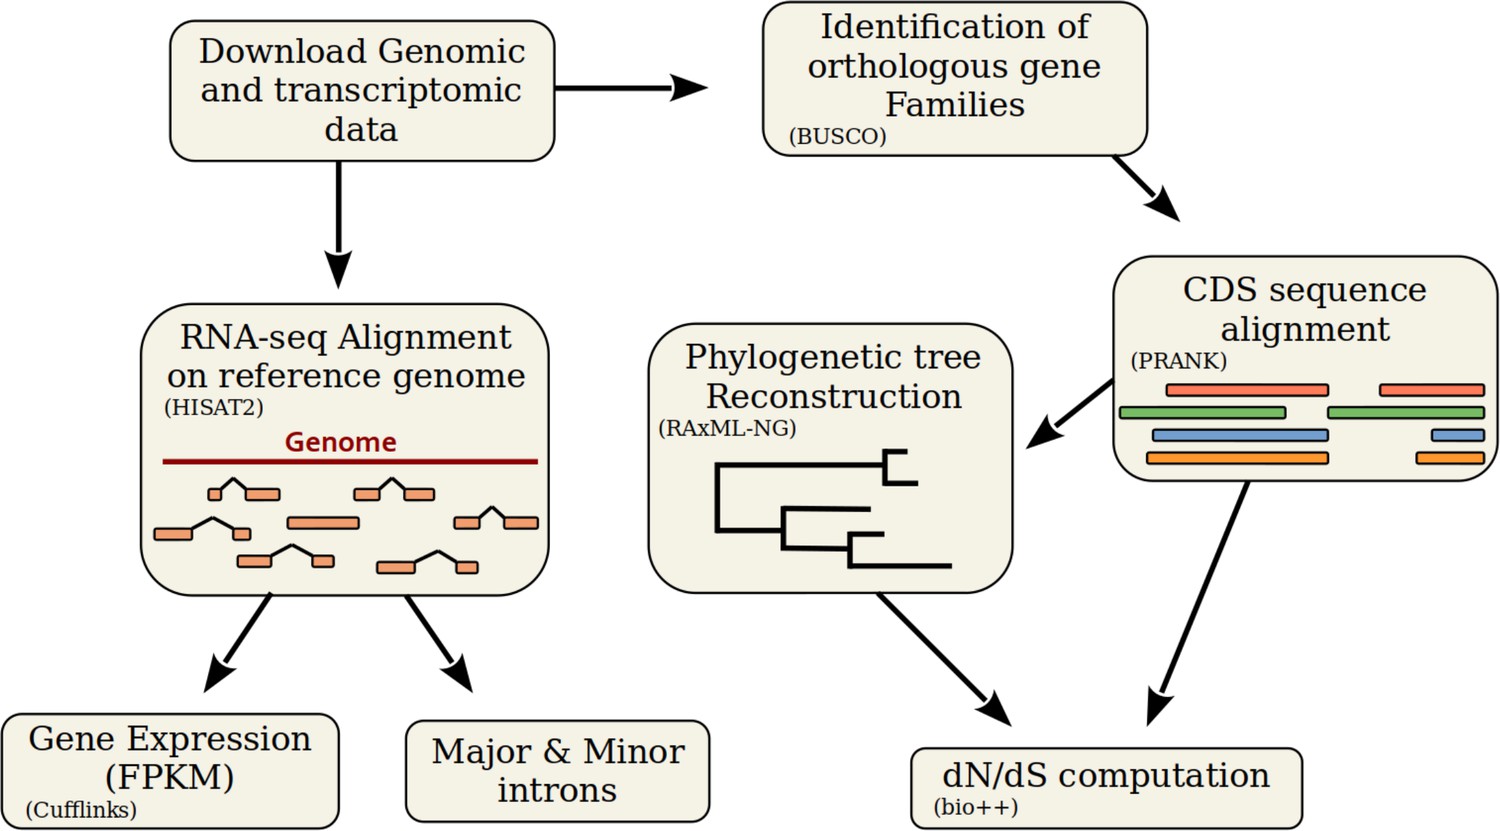
Description of the bioinformatic analyses pipeline.
First, we retrieved genomic sequences and annotations from the NCBI Genomes database. We aligned RNA-seq reads with HISAT2 on the corresponding reference genomes, to analyze various variables (see Figure 2), to compute the AS rate, and to estimate gene expression using Cufflinks. To compute , we first identified BUSCO genes with BUSCOv3 and aligned their coding sequences (CDS) using PRANK (codon model). We reconstructed a phylogenetic tree using RAxML-NG with 461 multiple alignments. Using bio++, we estimated along the phylogenetic tree on concatenated alignments.
Figure 3 with 4 supplements
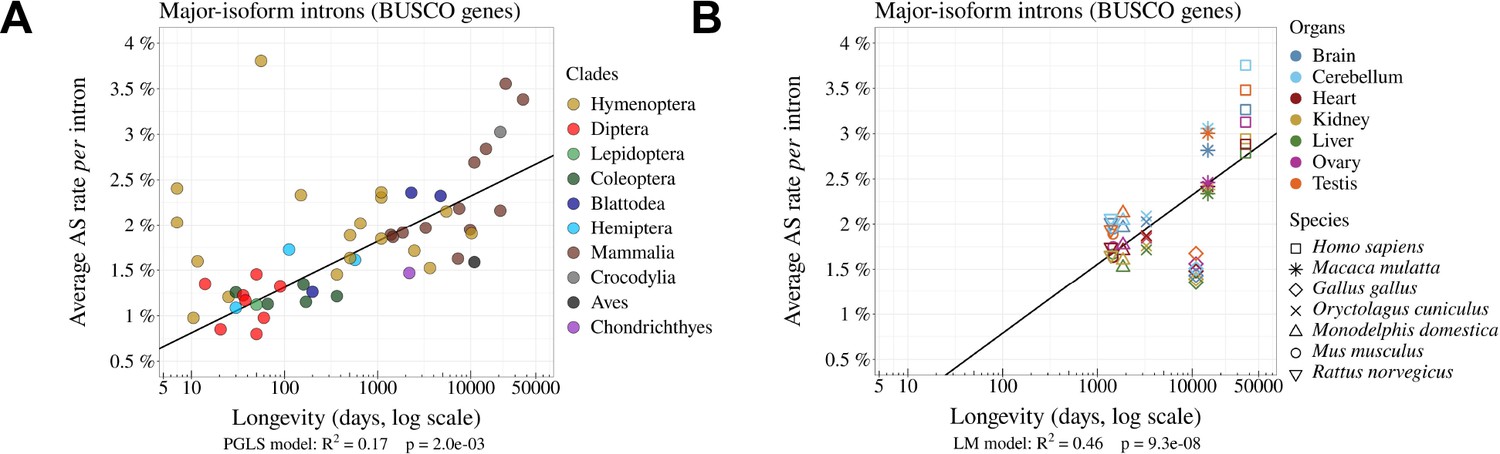
The rate of alternative splicing correlates with life history traits across metazoans.
(A) Relationship between the per intron average AS rate of an organism and its longevity (days, log scale). (B) Variation in average AS rate across seven organs (brain, cerebellum, heart, liver, kidney, testis, and ovary) among seven vertebrate species (RNA-seq data from Cardoso-Moreira et al., 2019). AS rates are computed on major-isoform introns from BUSCO genes (Materials and methods).
Figure 3—figure supplement 1
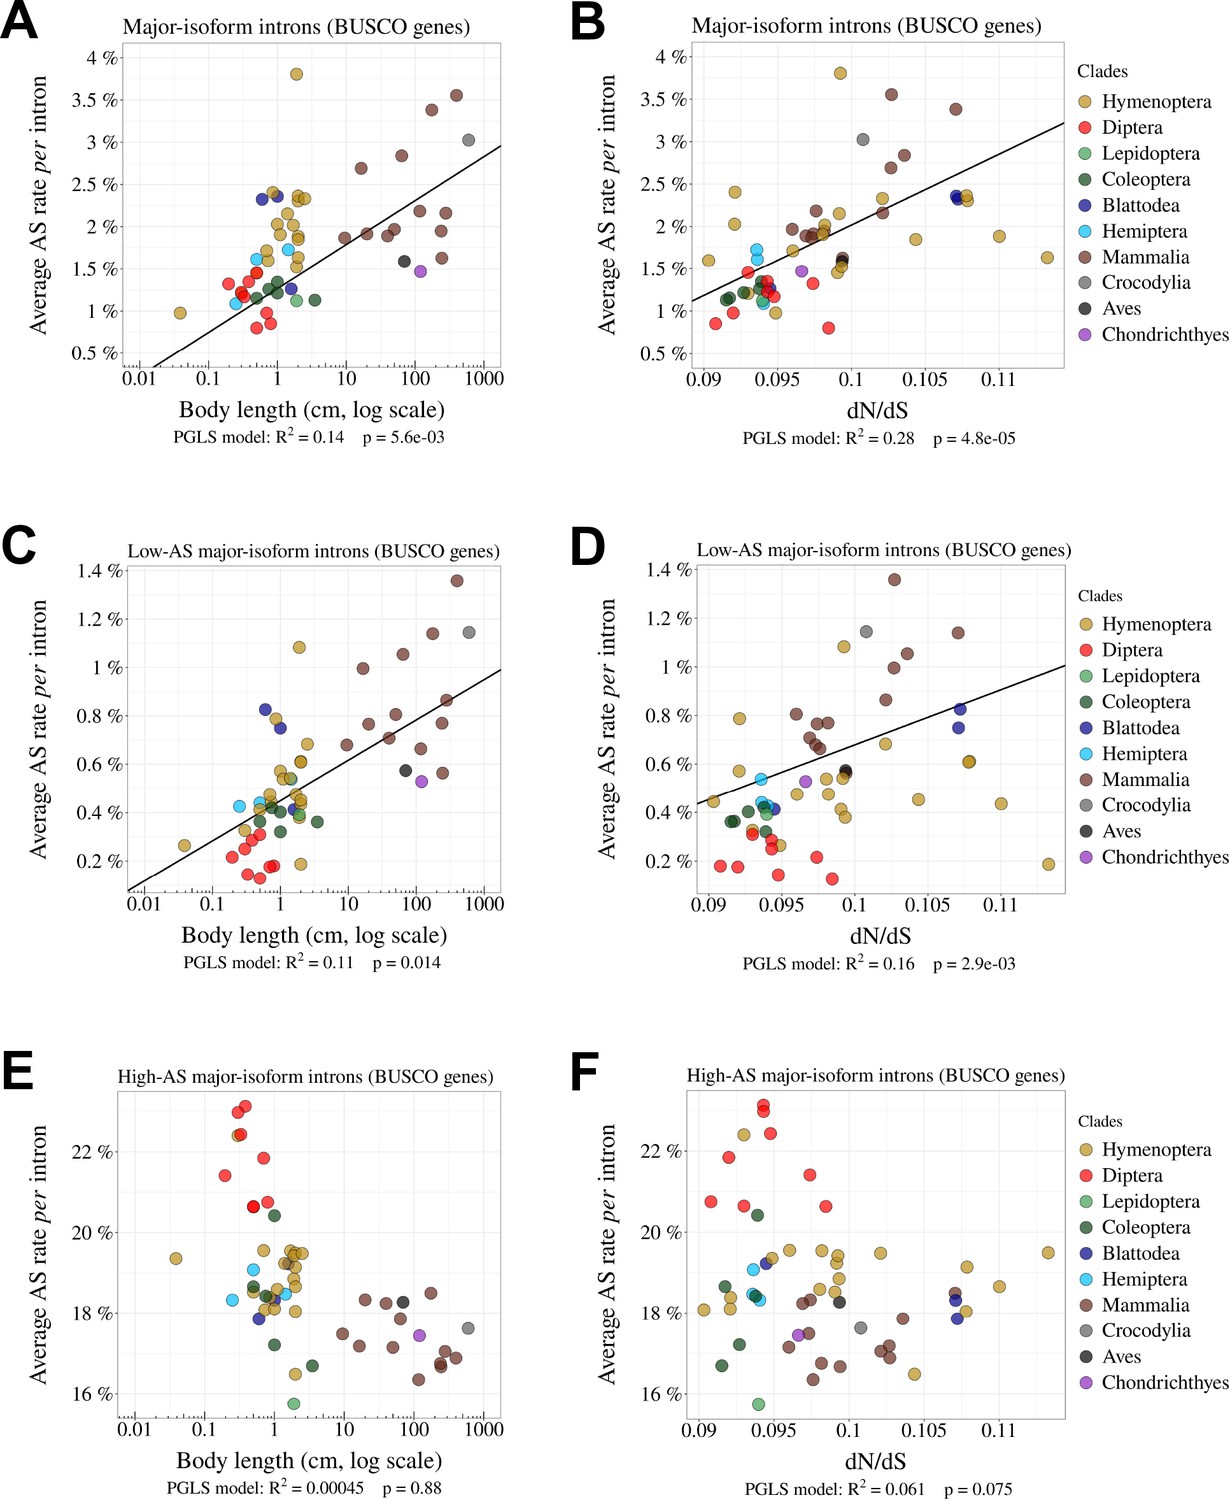
Relationship between AS rates and other Ne proxies.
(A, B) Correlation between the average AS rate per intron and the body length of each species (cm, log scale) (A) or the ratio on terminal branches of the phylogenetic tree (B). (C, D, E, F) Relationship between the average AS rate per intron and the body length (cm, log scale) (C, E) or the ratio (D, F). (C, D) Low-AS major-isoform introns (i.e. major-isoform introns that do not have any abundant SV). (E, F) High-AS major-isoform introns (i.e. major-isoform introns having at least one abundant SV). Only BUSCO genes were used in the analysis.
Figure 3—figure supplement 2
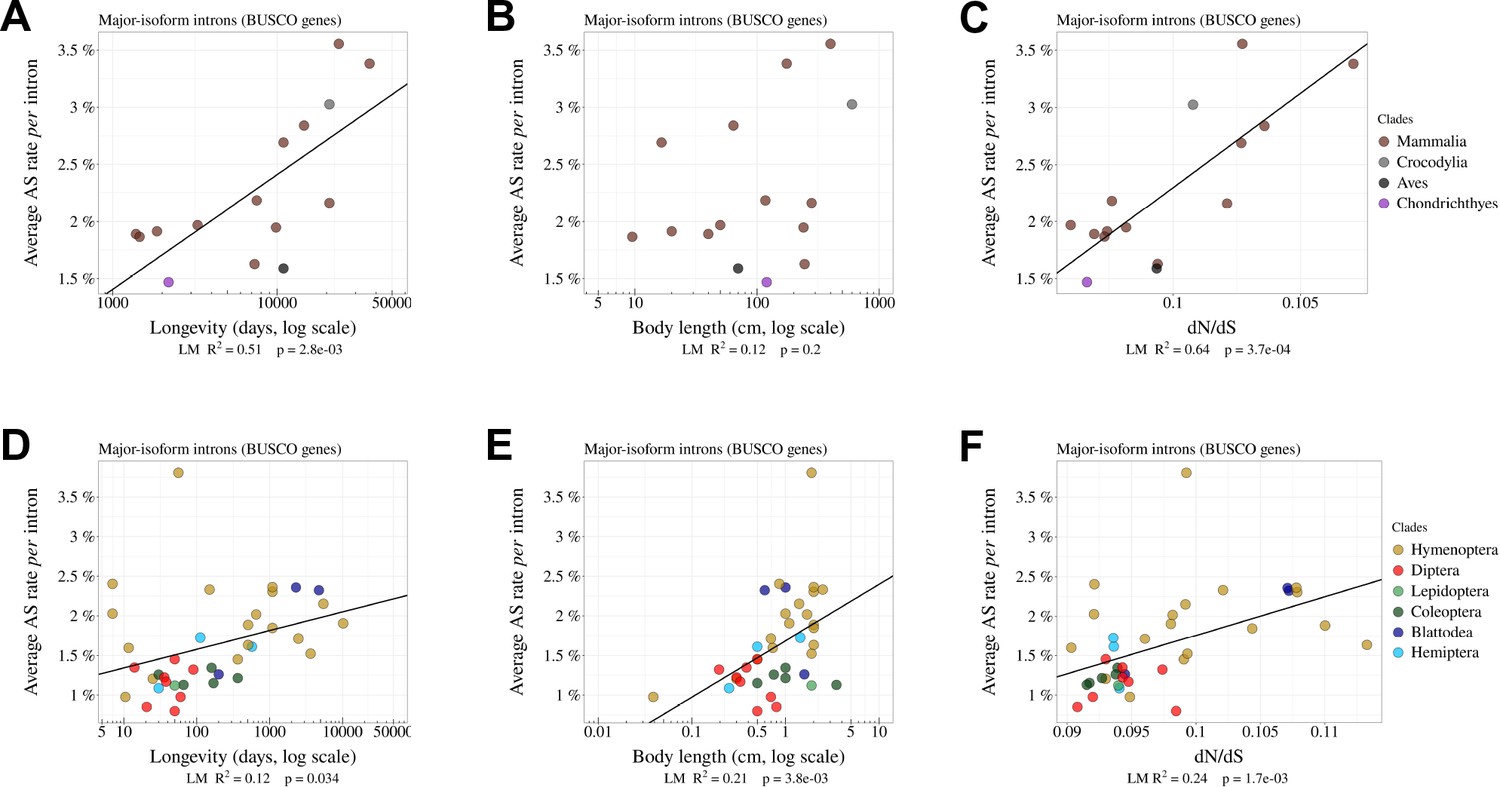
The rate of alternative splicing correlates with life history traits in both vertebrates and insects.
Correlation between the average AS rate per intron and longevity of each species (days, log scale) (A, B), body length (cm, log scale) (B, E), or the dN/dS ratio on terminal branches of the phylogenetic tree (C, F). In vertebrates (A, B, C) and insects (C, D,E). Only the BUSCO genes were included in the analysis.
Figure 3—figure supplement 3

The variation in AS rates between species is not explained by organ differences.
Variation in average AS rate across seven organs (brain, cerebellum, heart, liver, kidney, testis, and ovary) among seven vertebrate species (RNA-seq data from Cardoso-Moreira et al., 2019) and across three organs (ovary, testis, and head) for one insect (Dendroctonus ponderosae, Coleoptera). AS rates were computed for the major-isoform introns from BUSCO genes (Materials and methods).
Figure 3—figure supplement 4
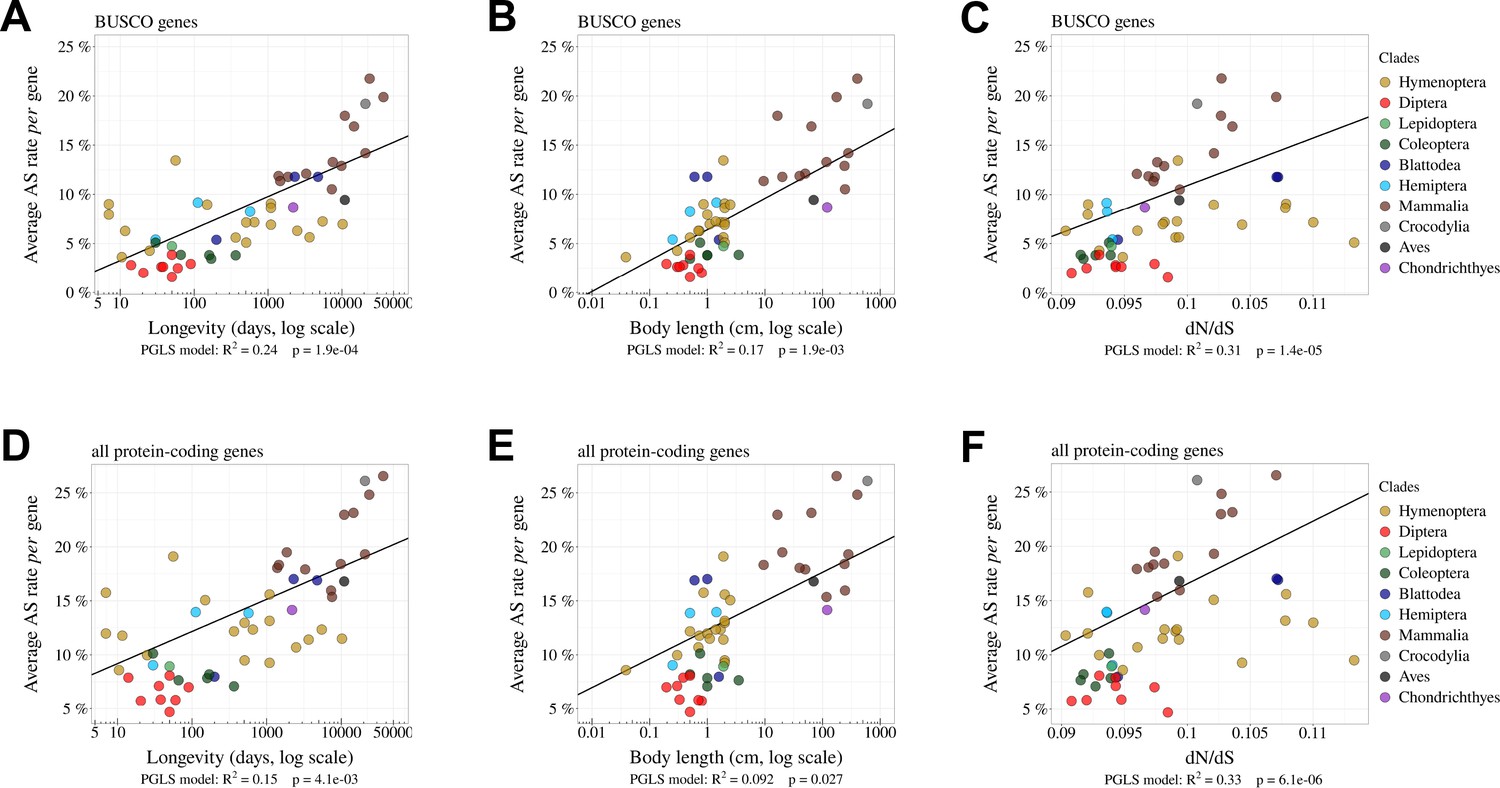
The per-gene AS rate is negatively correlated with Ne.
Relationship between per-gene average AS rates and Ne proxies. We use as inverse Ne proxies the longevity (days, log scale) (A, D) or the body length (cm, log scale) (B, E) or the ratio (C, F). The analysis was done on BUSCO genes (A, B, C) and on all protein-coding genes (D, E, F).
Figure 4 with 2 supplements
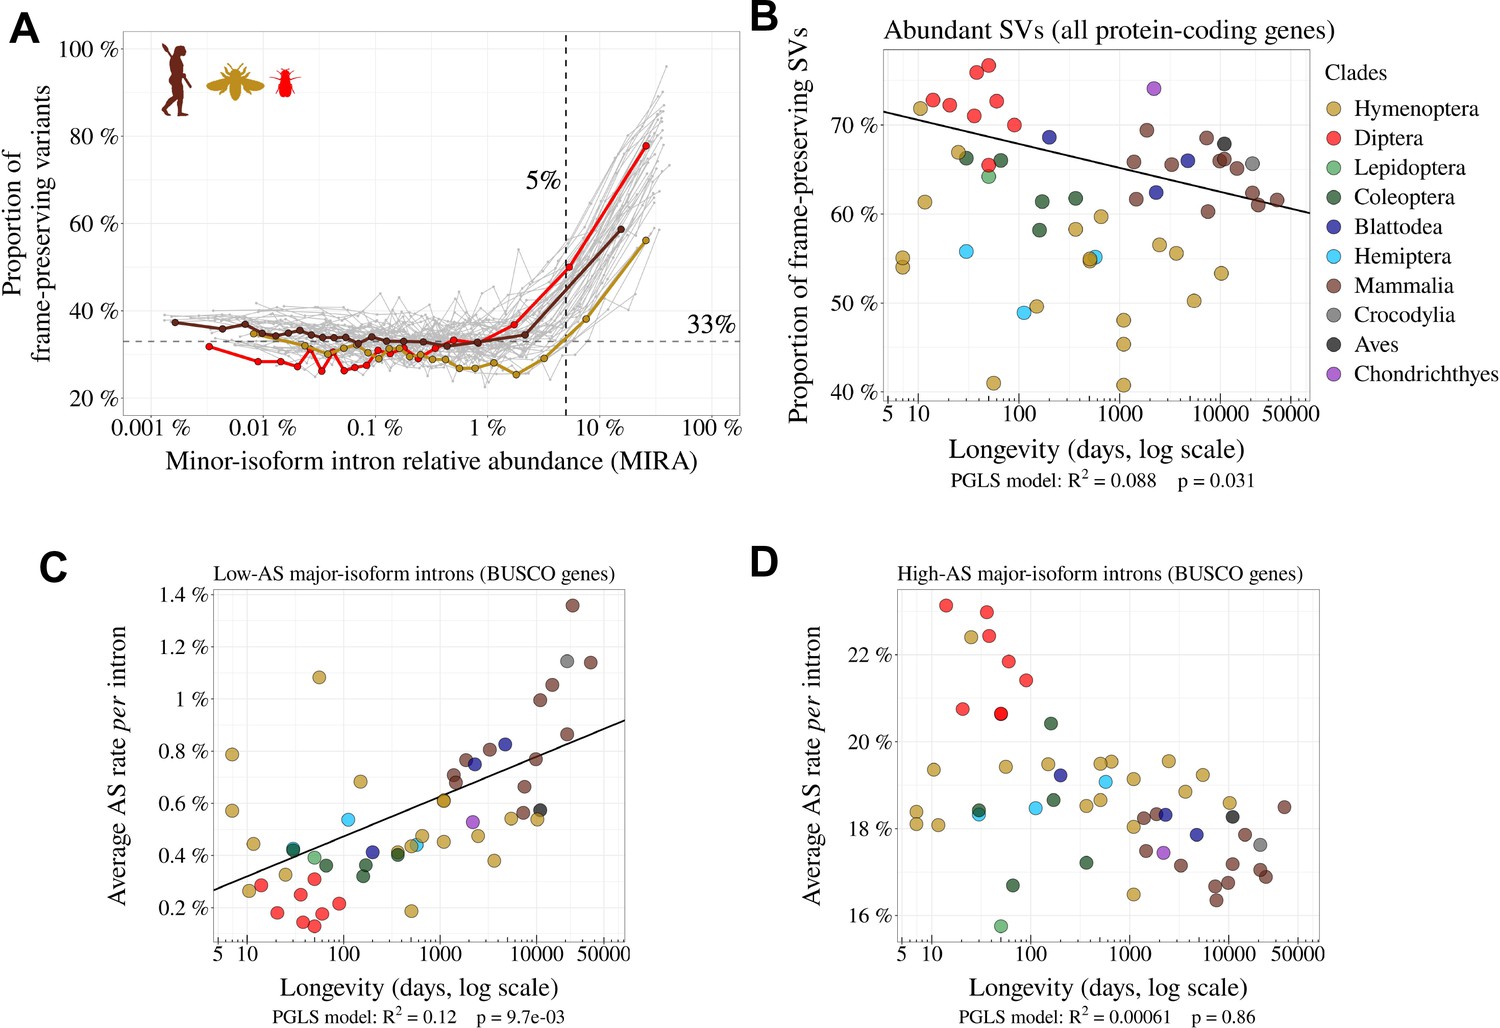
Variation in AS rate across metazoans: distinguishing abundant splice variants (enriched in functional variants) from rare splice variants.
(A) Frame-preserving isoforms are strongly enriched among abundant splice variants (SVs). For each species, SVs were classified into 20 equal-size bins according to their abundance relative to the major isoform (MIRA, see Materials and Methods), and the proportion of frame-preserving SVs was computed for each bin. Each line represents one species. Three representative species are colored: red: Drosophila melanogaster, brown: Homo sapiens, yellow: Apis mellifera. We used a threshold MIRA value of 5% to define ‘abundant’ vs. ‘rare’ SVs. (B) Proportion of frame-preserving SVs among abundant SVs across metazoans. Each dot represents one species. All annotated protein-coding genes are used in the analysis. (C,D) Relationship between the average per intron AS rate of an organism and its longevity (days, log scale). Only BUSCO genes are used in the analysis. (C) Low-AS major-isoform introns (i.e. major-isoform introns that do not have any abundant SV), (D) High-AS major-isoform introns (i.e. major-isoform introns having at least one abundant SV).
Figure 4—figure supplement 1
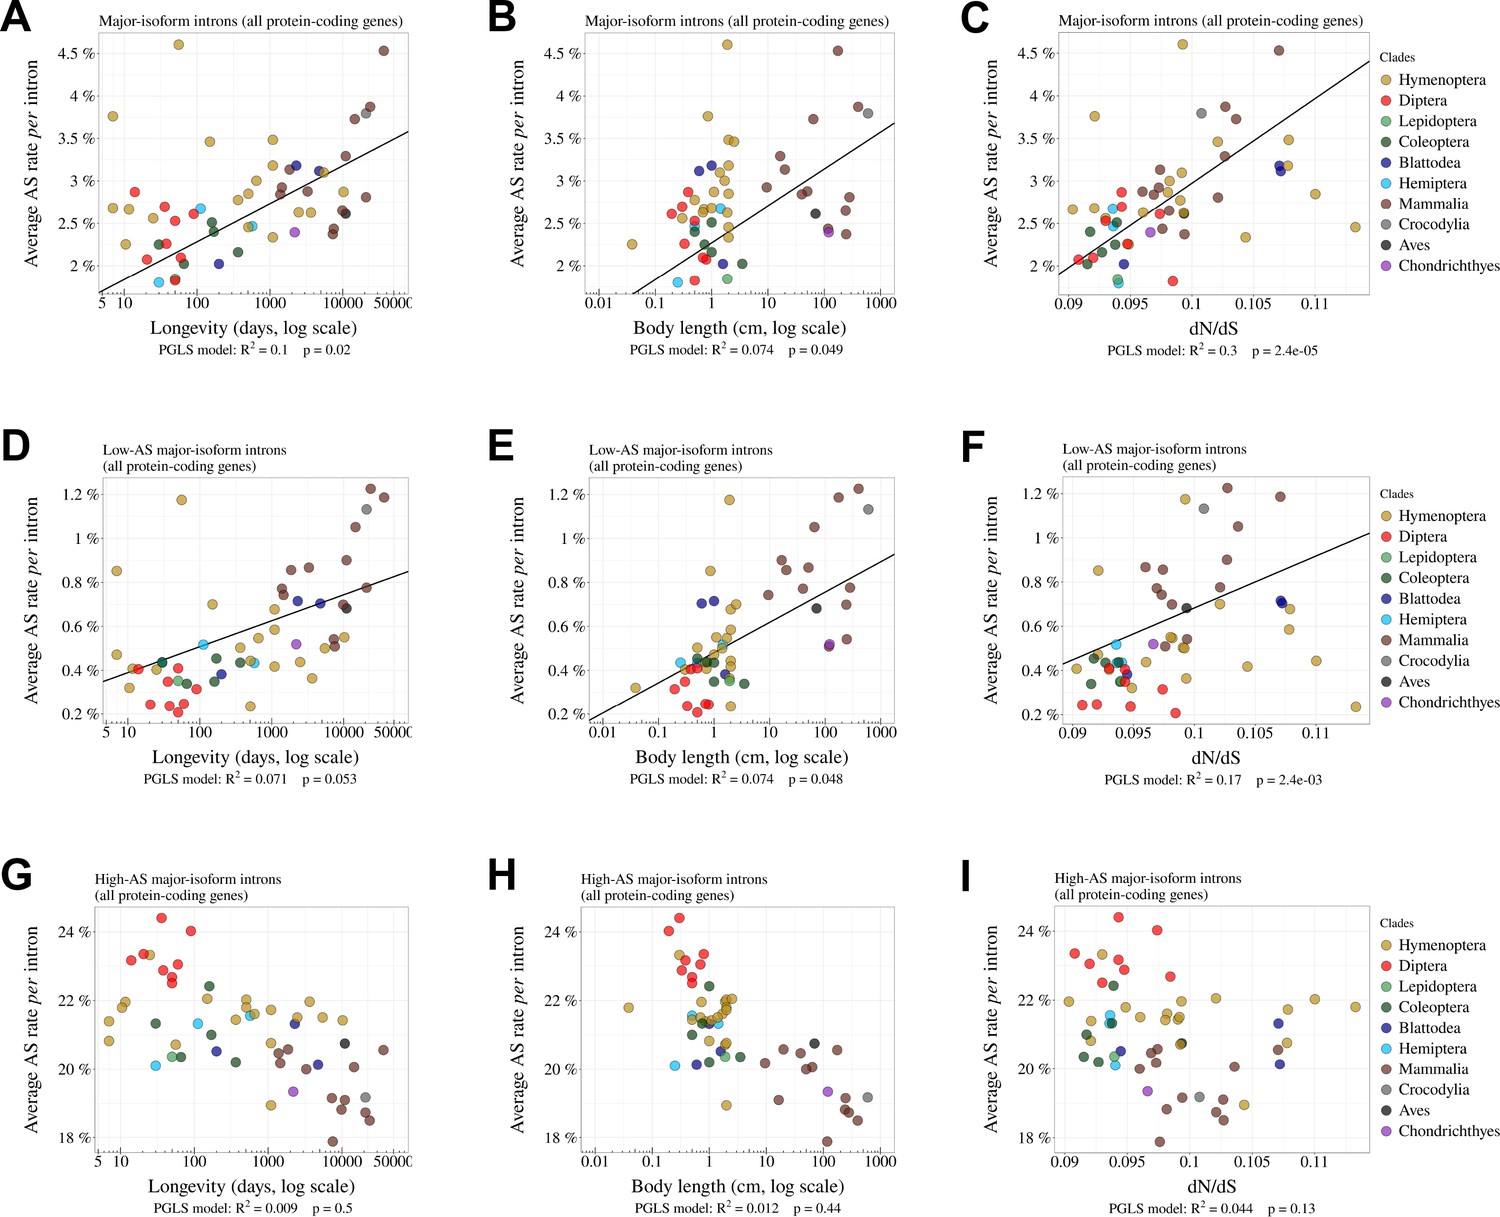
Relationship between AS rates and Ne proxies, for all major-isoform introns, low-AS major-isoform introns (i.e. major-isoform introns that do not have any abundant spliced variants) and high-AS major-isoform introns (i.e. major-isoform introns having at least one abundant spliced variants).
Relationship between the average AS rate of all major-isoform introns (A,B,C) or low-AS major-isoform introns (D,E,F) or high-AS major-isoform introns (G,H,I) and longevity (days, log scale) (A,D,G) or body length (cm, log scale) (B,E,H) or the ratio (C,F,I).
Figure 4—figure supplement 2
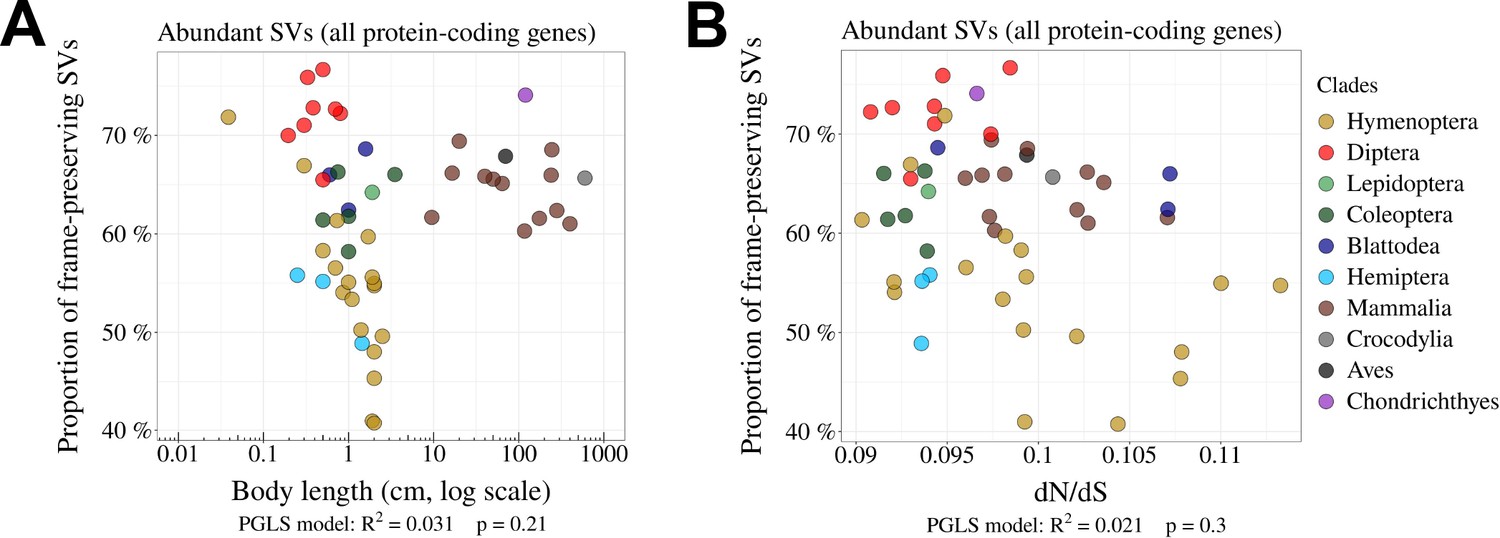
Relationship between the proportion of frame-preserving SVs and Ne proxies.
(A,B) Relationship between the proportion of frame-preserving SVs among abundant SVs, and the body length (cm, log scale) of the organism (A) or the ratio (B). Each dot represents one species. All protein-coding genes were used in the analysis.
Figure 5 with 1 supplement
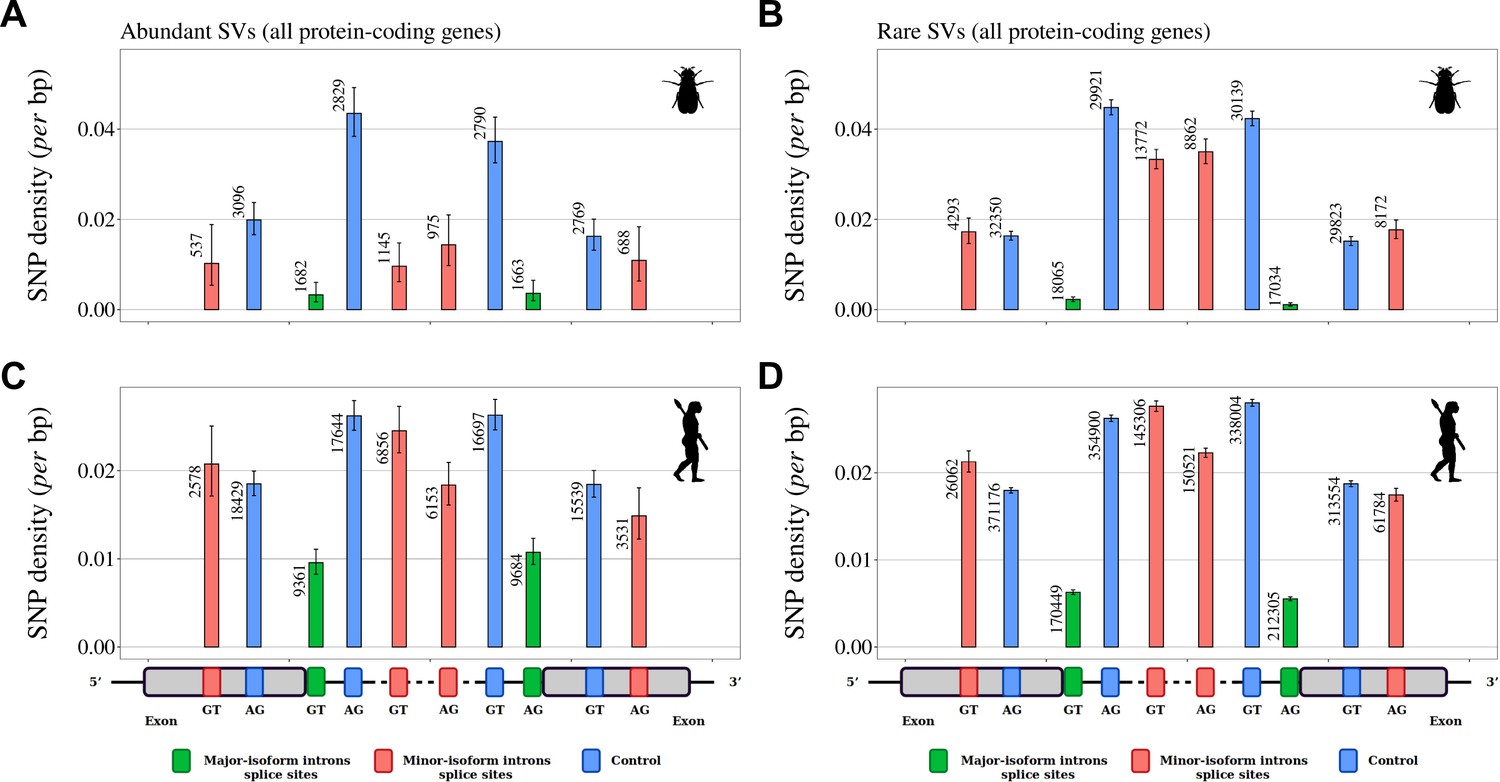
Variation in selective constraints on alternative splice signals from rare and abundant SVs.
For each minor-isoform intron sharing one boundary with a major-isoform intron, we measured the SNP density at its minor splice site (red), and at the corresponding major splice site (green). We distinguished minor splice sites that are located in an exon or in an intron of the major isoform. As a control (blue), we selected AG or GT dinucleotides that are unlikely to correspond to alternative splice sites, namely: AG dinucleotides located toward the end of the upstream exon or the beginning of the intron (unlikely to correspond to a genuine acceptor site), and GT dinucleotides located toward the beginning of the downstream exon or the end of the intron (unlikely to correspond to a donor site). To increase the sample size, we analyzed data from all annotated protein-coding genes (and not only the BUSCO gene set). The number of sites studied is shown at the top of each bar. Error bars represent the 95% confidence interval of the proportion of polymorphic sites (proportion test). (A,B) SNP density in Drosophila melanogaster (polymorphism data from 205 inbred lines derived from natural populations, N=3,963,397 SNPs Huang et al., 2014; Mackay et al., 2012). (C,D) SNP density in Homo sapiens (polymorphism data from 2504 individuals, N=80,868,061 SNPs Auton et al., 2015). We excluded dinucleotides affected by CpG hypermutability (Materials and methods, see Figure 5—figure supplement 1 for CpG sites). (A,C) Abundant SVs (MIRA > 5%). B,D: Rare SVs (MIRA ≤ 5%).
Figure 5—figure supplement 1
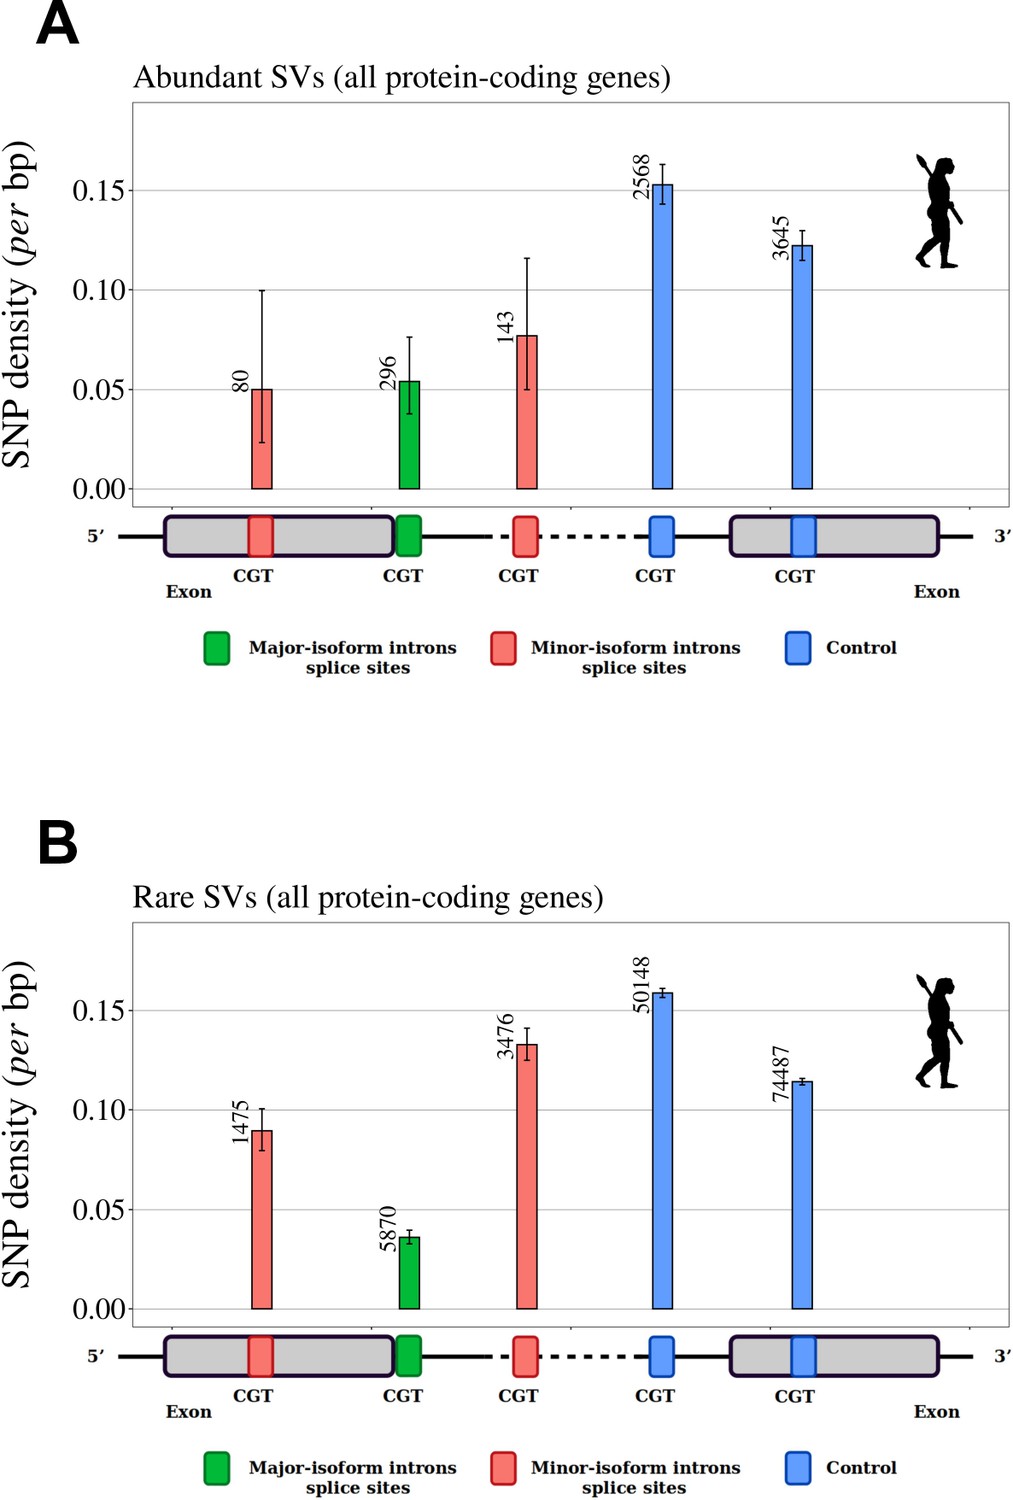
SNP density in human splice signals, for dinucleotides affected by CpG hypermutability.
Density of SNPs on splice signals for major-isoform introns and for SVs that have their minor splice site within the adjacent exon or in the major-isoform intron. The number of introns studied is shown at the top of each bar. (A,B) SNP data from the human 1000 Genomes project (Auton et al., 2015). We included only dinucleotides affected by CpG hypermutability (Materials and methods). Error bars represent the 95% confidence interval of the proportion of polymorphic sites (proportion test). (A): Abundant SVs (MIRA > 5%). (B): Rare SVs (MIRA ≤ 5%). green: major splice sites; red: minor splice sites; blue: control dinucleotides.
Figure 6 with 1 supplement
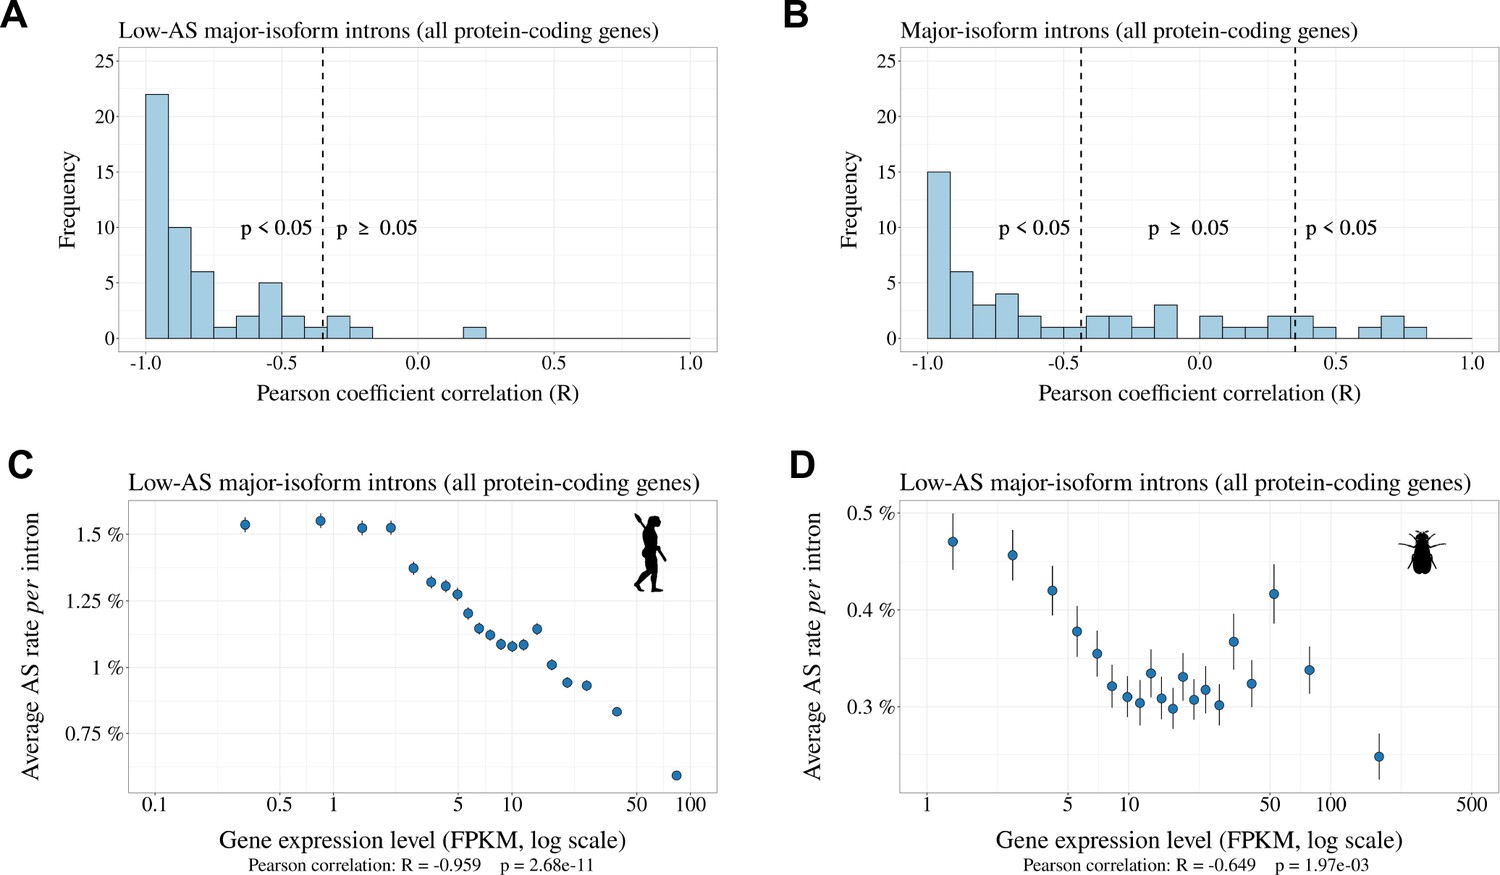
Relationship between AS rate and gene expression level.
For each species, we selected major-isoform introns with a sufficient sequencing depth to have a precise measure of their AS rate (). We divided major-isoform introns into 5% bins according to their gene expression level and computed the correlation between the average AS rate and median expression level across the 20 bins. To increase sample size, these analyses were based on all annotated protein-coding genes (and not only the BUSCO gene set). (A) Distribution of Pearson correlation coefficients (R) between the AS rate and expression level observed in the 53 metazoans. The vertical dashed lines indicates the thresholds under and above which correlations are significant (i.e. p-value < 0.05). (B): Distribution of Pearson correlation coefficients computed on the subsets of low-AS major-isoform introns (i.e. after excluding major-isoform introns with abundant SVs). (C,D) Two representative species illustrating the negative relation between the average AS rate of low-AS major-isoform introns and the expression level of their gene. Error bars represent the standard error of the mean. (C) N=127,599 low-AS major-isoform introns from Homo sapiens, (D) N=31,357 low-AS major-isoform introns from Drosophila melanogaster.
Figure 6—figure supplement 1
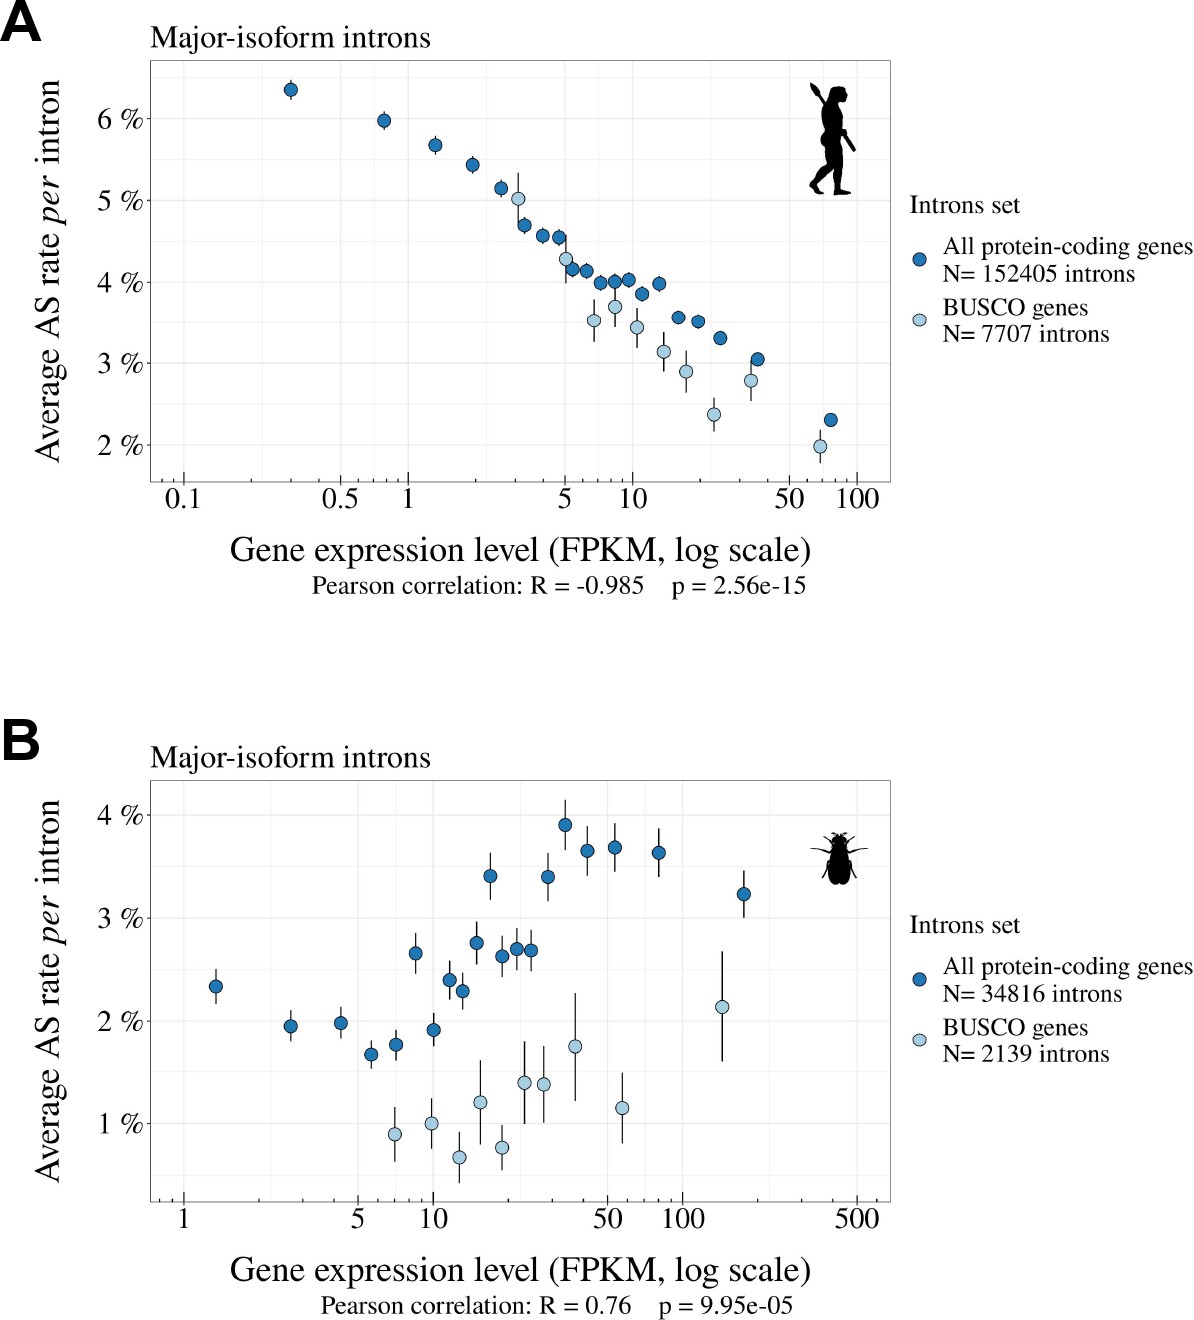
Correlations between gene expression levels and AS rates differ among species.
(A,B) Relationship between the average AS rate of major-isoform introns (with , see Figure 2) and the expression levels of the corresponding genes (FPKM, log scale). We divided major-isoform introns into 5% bins according to the expression level of the corresponding genes and computed for each bin the average AS rate and the median expression level. Error bars represent the standard error of the mean. (A) Homo sapiens, (B) Drosophila melanogaster. This analysis was performed on all protein-coding genes (blue) and BUSCO genes (light blue). Pearson correlation presented here was computed on protein-coding genes.
Figure 7
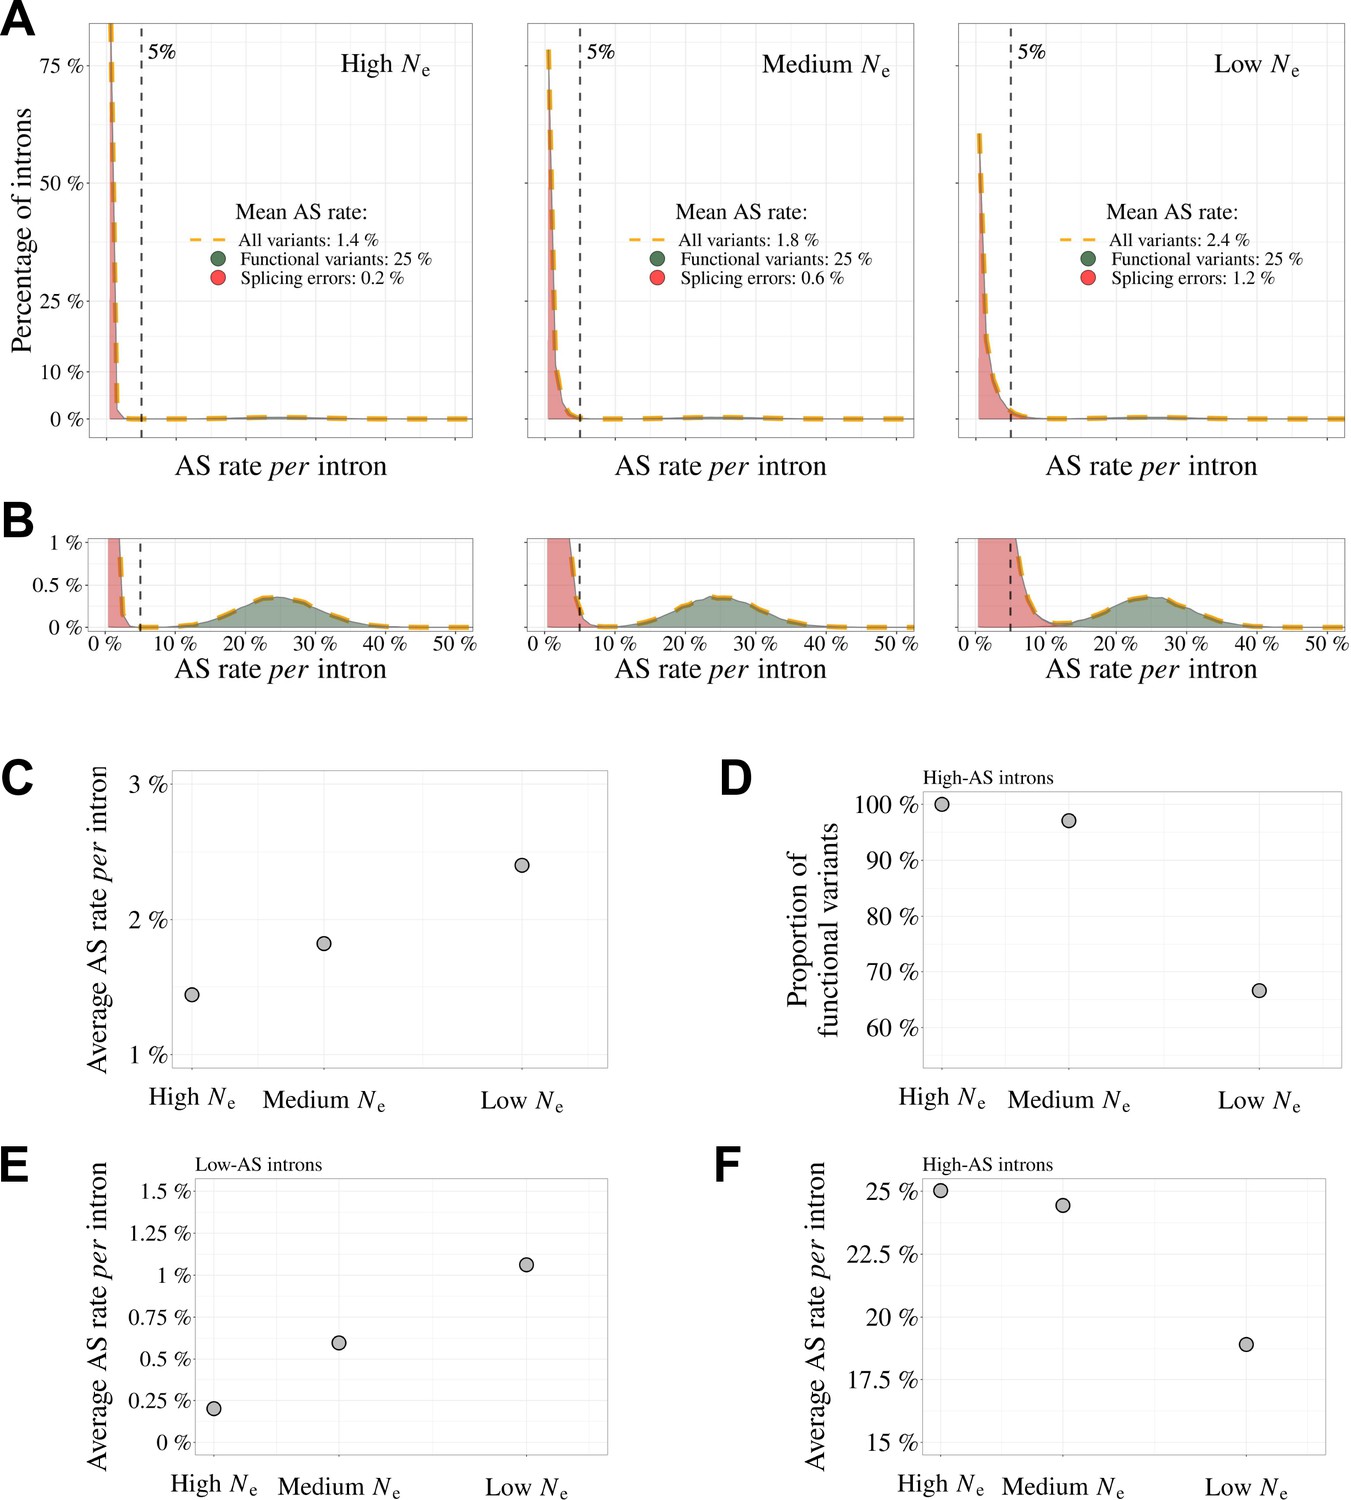
Impact of the drift-barrier on the genome-wide AS rate: model predictions.
To illustrate the impact of the drift barrier, we sketched a simple model, with three hypothetical species of different Ne. In this model, the repertoire of SVs consists of a mixture of functional variants and splicing errors. We assumed that in all species, only a small fraction of major-isoform introns (5%) produce functional SVs, but that these variants have a relatively high AS rate (average = 25%, standard deviation = 5%; see Materials and methods for details on model settings). Splicing error rates were assumed to be gamma-distributed, with a low mean value. Owing to the drift barrier effect, the mean error rate was set to vary from 0.2% in species of high Ne to 1.2% in species of low Ne (these parameters were chosen to match approximately the AS rates observed in empirical data for rare SVs). (A) Genome-wide distribution of AS rates in each species (high Ne, medium Ne and low Ne). Each distribution corresponds to a mixture of functional SVs (green) and splicing errors (red). (B) Zoom on the y-axis to better visualize the contribution of functional SVs to the whole distribution: rare SVs (AS ≤ 5%) essentially correspond to splicing errors, while abundant SVs (AS > 5%) correspond to a mixture of functional and spurious variants, whose relative proportion depend on Ne. The following panels show how these different distributions, induced by differences in Ne, impact genome-wide AS patterns. (C) Relationship between the average AS rate per major-isoform intron and Ne. (D) Fraction of frame-preserving splice variants among introns with high AS rates vs Ne. Relationship between the average AS rate per intron and Ne, for ‘low-AS’ major-isoform introns (MIRA ≤ %) (E), and for ‘high-AS’ major-isoform introns (MIRA > 5%) (F).
Author response image 1
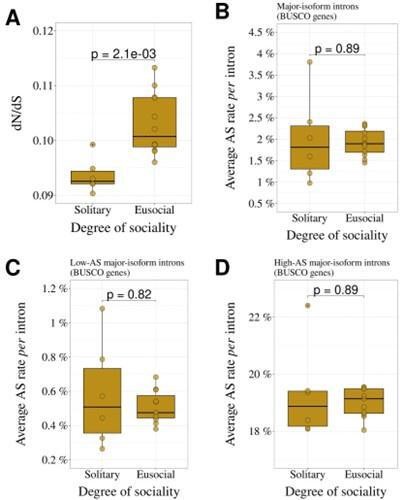
Comparison of solitary (N=6) and eusocial hymenopterans (N=12).
(A) dN/dS ratio.(B) AS rate (all major-isoform introns). (C) AS rate (low-AS major-isoform introns). (D) AS rate (high-AS major-isoform introns). The means of the two group were compared with a Wilcoxon test.
Additional files
Download links
A two-part list of links to download the article, or parts of the article, in various formats.
Downloads (link to download the article as PDF)
Open citations (links to open the citations from this article in various online reference manager services)
Cite this article (links to download the citations from this article in formats compatible with various reference manager tools)
Random genetic drift sets an upper limit on mRNA splicing accuracy in metazoans
eLife 13:RP93629.
https://doi.org/10.7554/eLife.93629.3


