X-ray structure and enzymatic study of a bacterial NADPH oxidase highlight the activation mechanism of eukaryotic NOX
- Univ. Grenoble Alpes, CNRS, CEA, Institut de Biologie Structurale, France
- European Molecular Biology Laboratory, France
- CNRS-Lyon 1 University Laboratory 5086, IBCP, France
- ALPX S.A.S. 71, France
- Department of Molecular and Cellular Biology, Kennesaw State University, United States
- Institut Universitaire de France, France
Figures
Figure 1 with 1 supplement
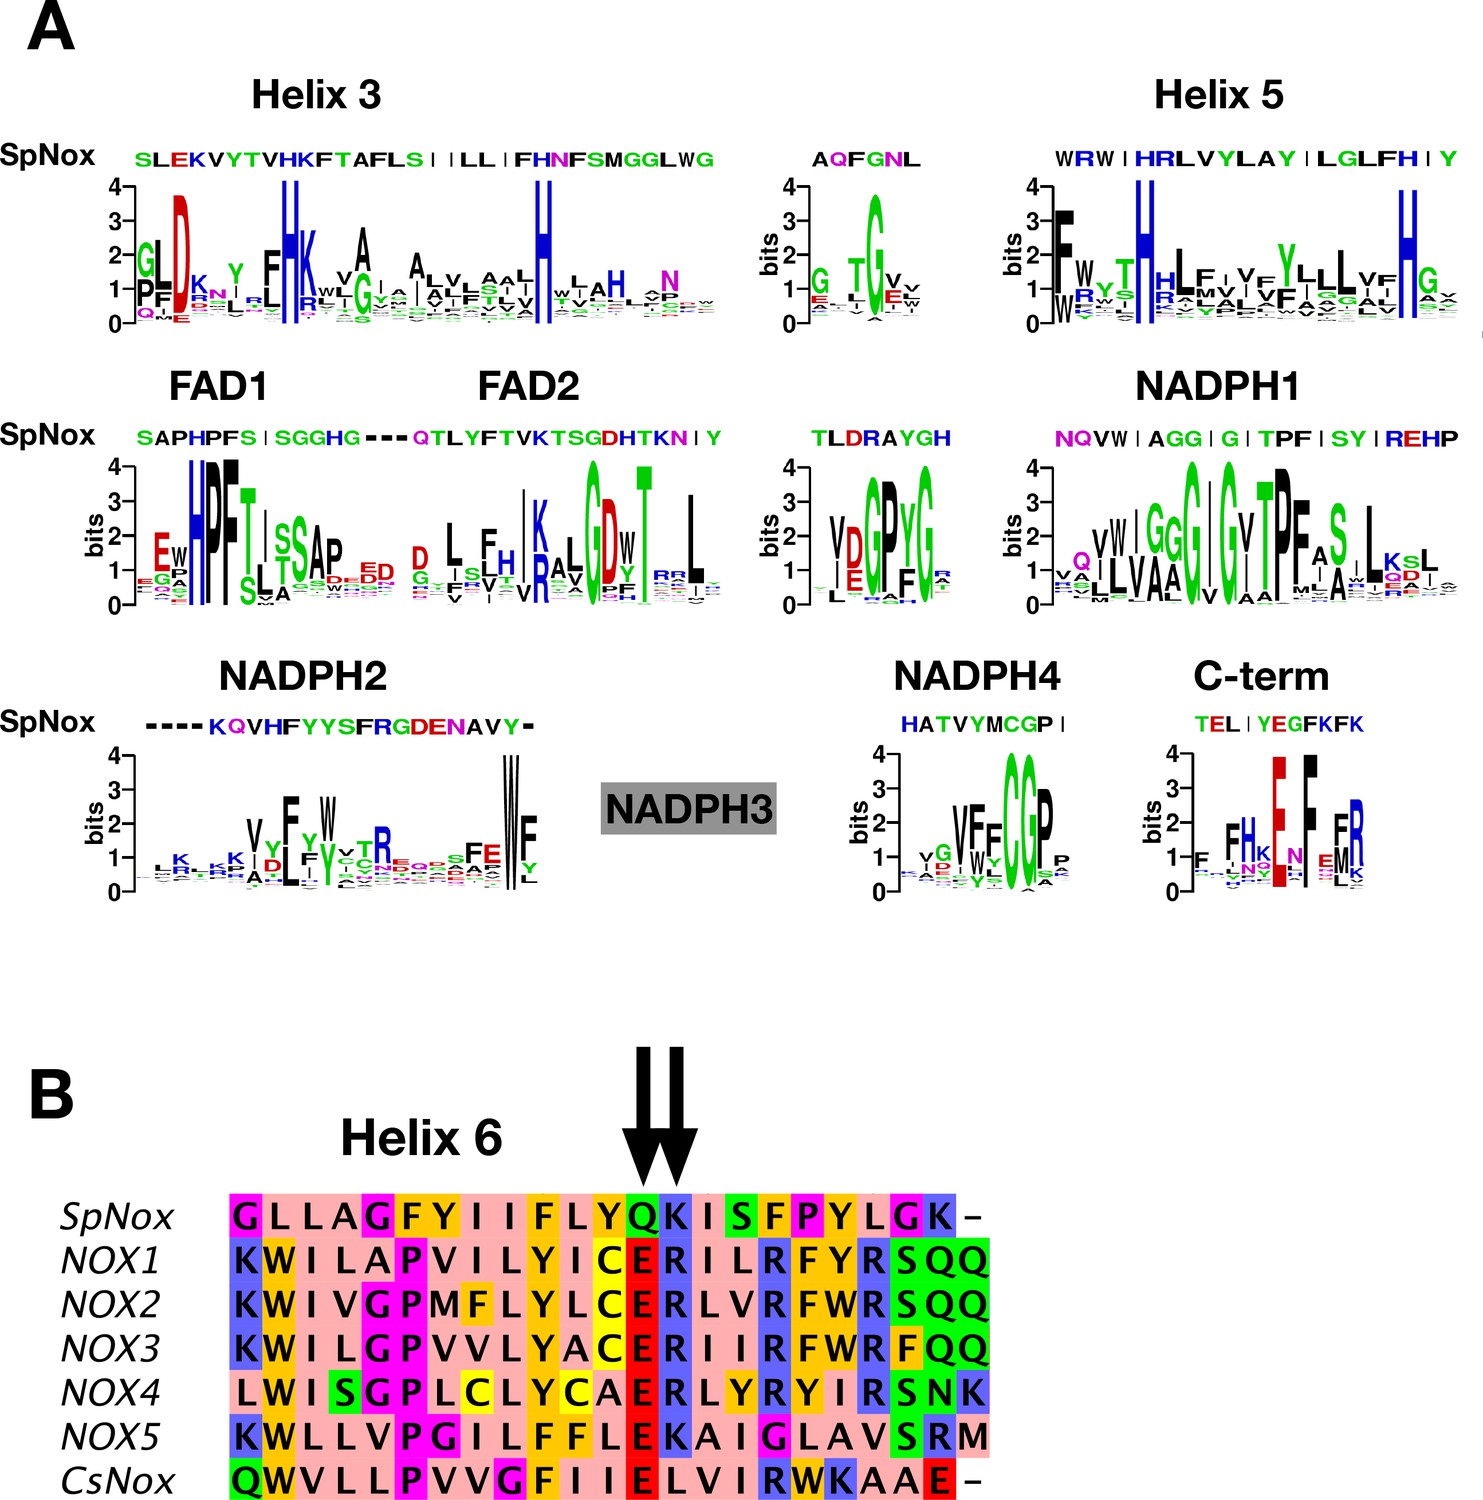
NOX-specific sites conserved in SpNOX.
(A) Alignment of the SpNOX sequence with motifs identified in eukaryotic NOX by Massari et al (61). Alignments of TM and DH domains including prokaryotic and eukaryotic NOX sequences, as described in Materials and methods, were used to construct logos of sub-sequences identified as NOX-specific sites in Massari et al., 2022. The NADPH3 motif as defined in Massari et al., 2022 is no longer relevant when adding prokaryotic sequence in alignments and is not presented here (grey box). (B) The region of human NOX1-5, CsNOX, and SpNOX spanning TM helix 6 and into the first beta strand of the DH domain was aligned to identify the putative end of the TM domain and beginning of the DH domain. Arrows indicate the ER (E283R284in NOX2 numbering) pair highly conserved in eukaryotic NOX, and the corresponding Q180K181 pair in SpNOX.
Figure 1—figure supplement 1
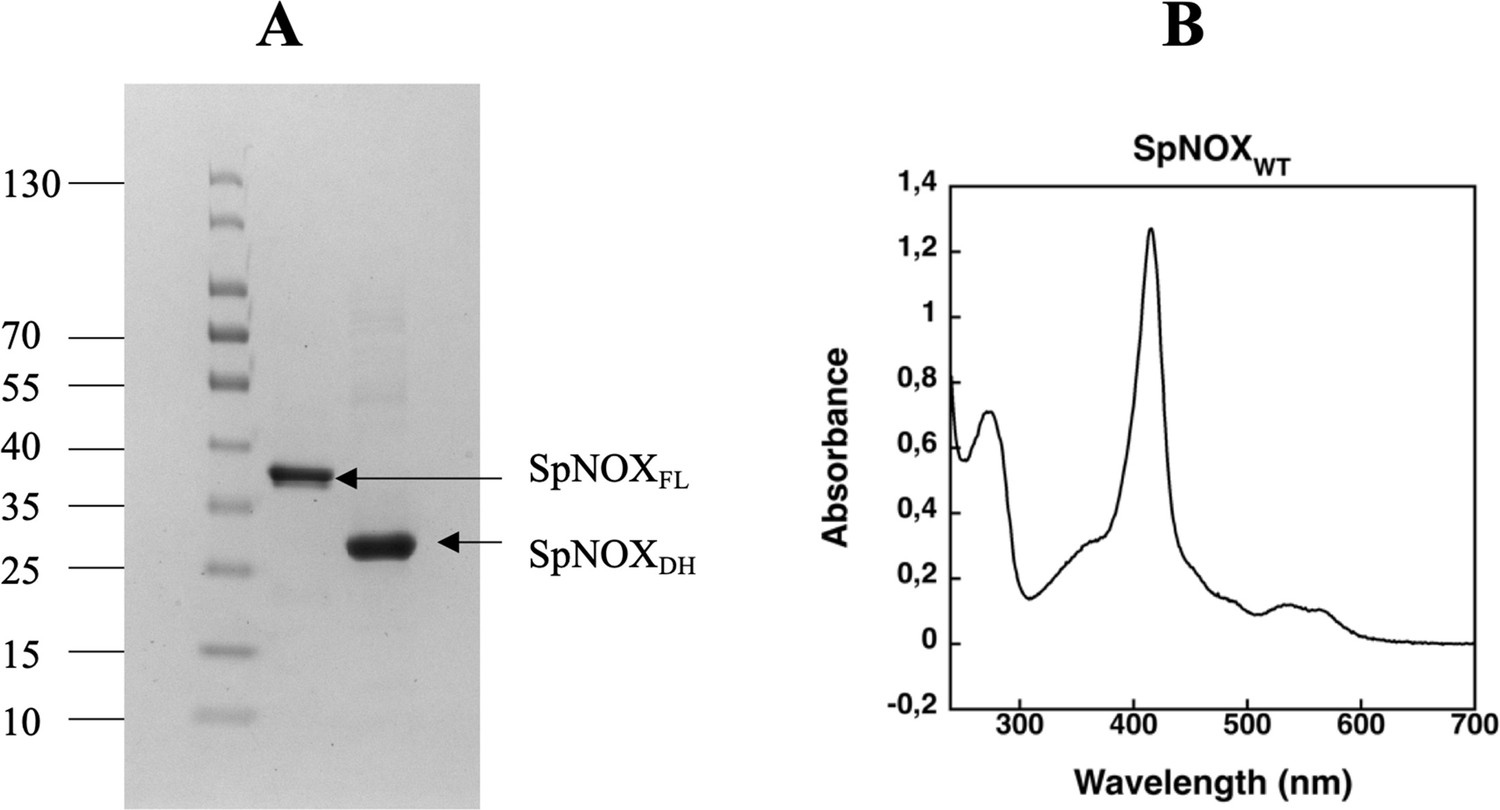
SDS PAGE of purified SpNOX and SpNOXDH.
(A) SpNOX full length (FL) and SpNOXDH separated by SDS–PAGE. (B) UV-visible spectrum of SpNOX at 5.8 µM (heme concentration) in 50 mM Tris-HCl, pH7, 300 mM NaCl, 0.0025% LMNG.
-
Figure 1—figure supplement 1—source data 1
Original file for the SDS-PAGE of SpNOX-full length and SpNOXDH.
Redundancy corresponds to a different quantity loaded on the gel.
- https://cdn.elifesciences.org/articles/93759/elife-93759-fig1-figsupp1-data1-v1.tiff
Figure 2 with 1 supplement
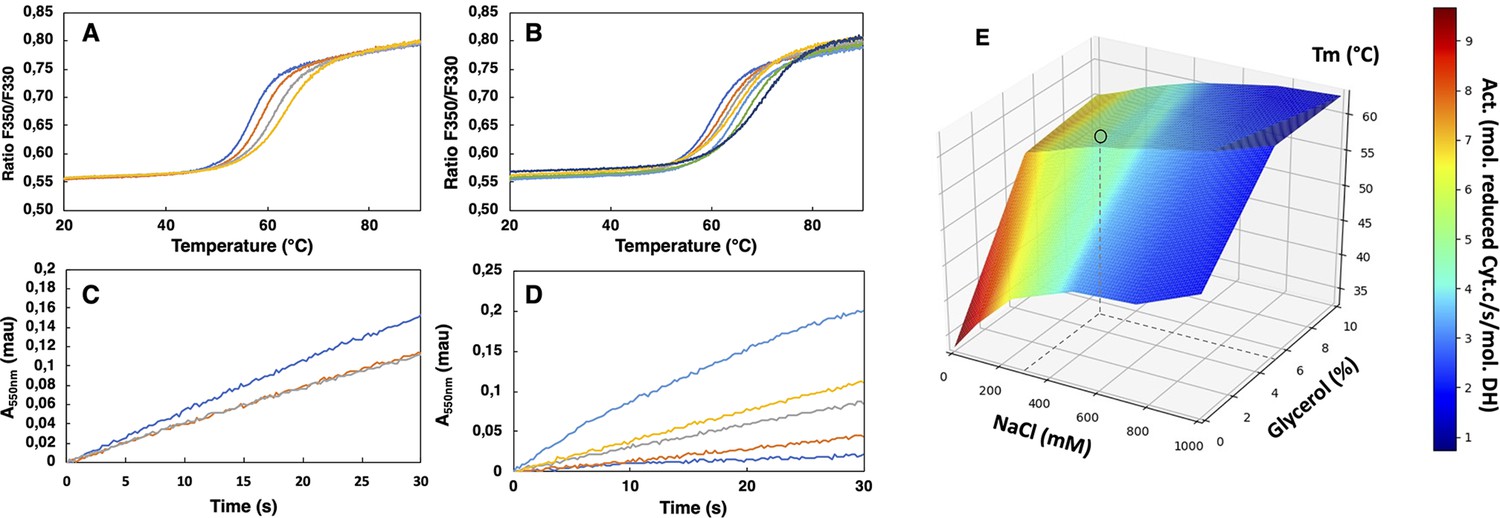
Buffer optimization for improvement of SpNOXDH thermostability and activity.
(A) Thermal unfolding curves of SpNOXDH (0.2 mg.mL–1) in 50 mM B bis TRIS-propane buffer pH 6.5, 300 mM NaCl with various glycerol percentages: 5% (dark blue), 10% (orange), 15% (grey), 20% (yellow). (B) Thermal unfolding curves of SpNOXDH (0.2 mg.mL–1) in bis TRIS-propane buffer pH 6.5, 5% glycerol with various NaCl concentrations: 100 mM (dark blue), 200 mM (orange), 300 mM (grey), 400 mM (yellow), 500 mM (light blue), 750 mM (green), 1M (indigo). (C) Cytochrome c reduction in presence of SpNOXDH (1 µg) NADPH (200 µM) FAD (10 µM) in the standard 50 mM bis TRIS-propane buffer at pH 6.5, 300 mM NaCl in presence of various glycerol percentages: 0% (blue line), 5% (orange line), 10% (grey line). (D) Cytochrome c reductase activity with SpNOXDH (1 µg), NADPH (200 µM), FAD (10 µM), glycerol (5%), in presence of various NaCl concentrations: 0 mM (light blue), 100 mM (yellow), 200 mM (grey), 400 mM (orange), 1M (dark blue). (E) 3D surface representation of Tm dependence with NaCl concentrations and glycerol percentages. (○) depicts the optimum used for further experiments of this study.
Figure 2—figure supplement 1
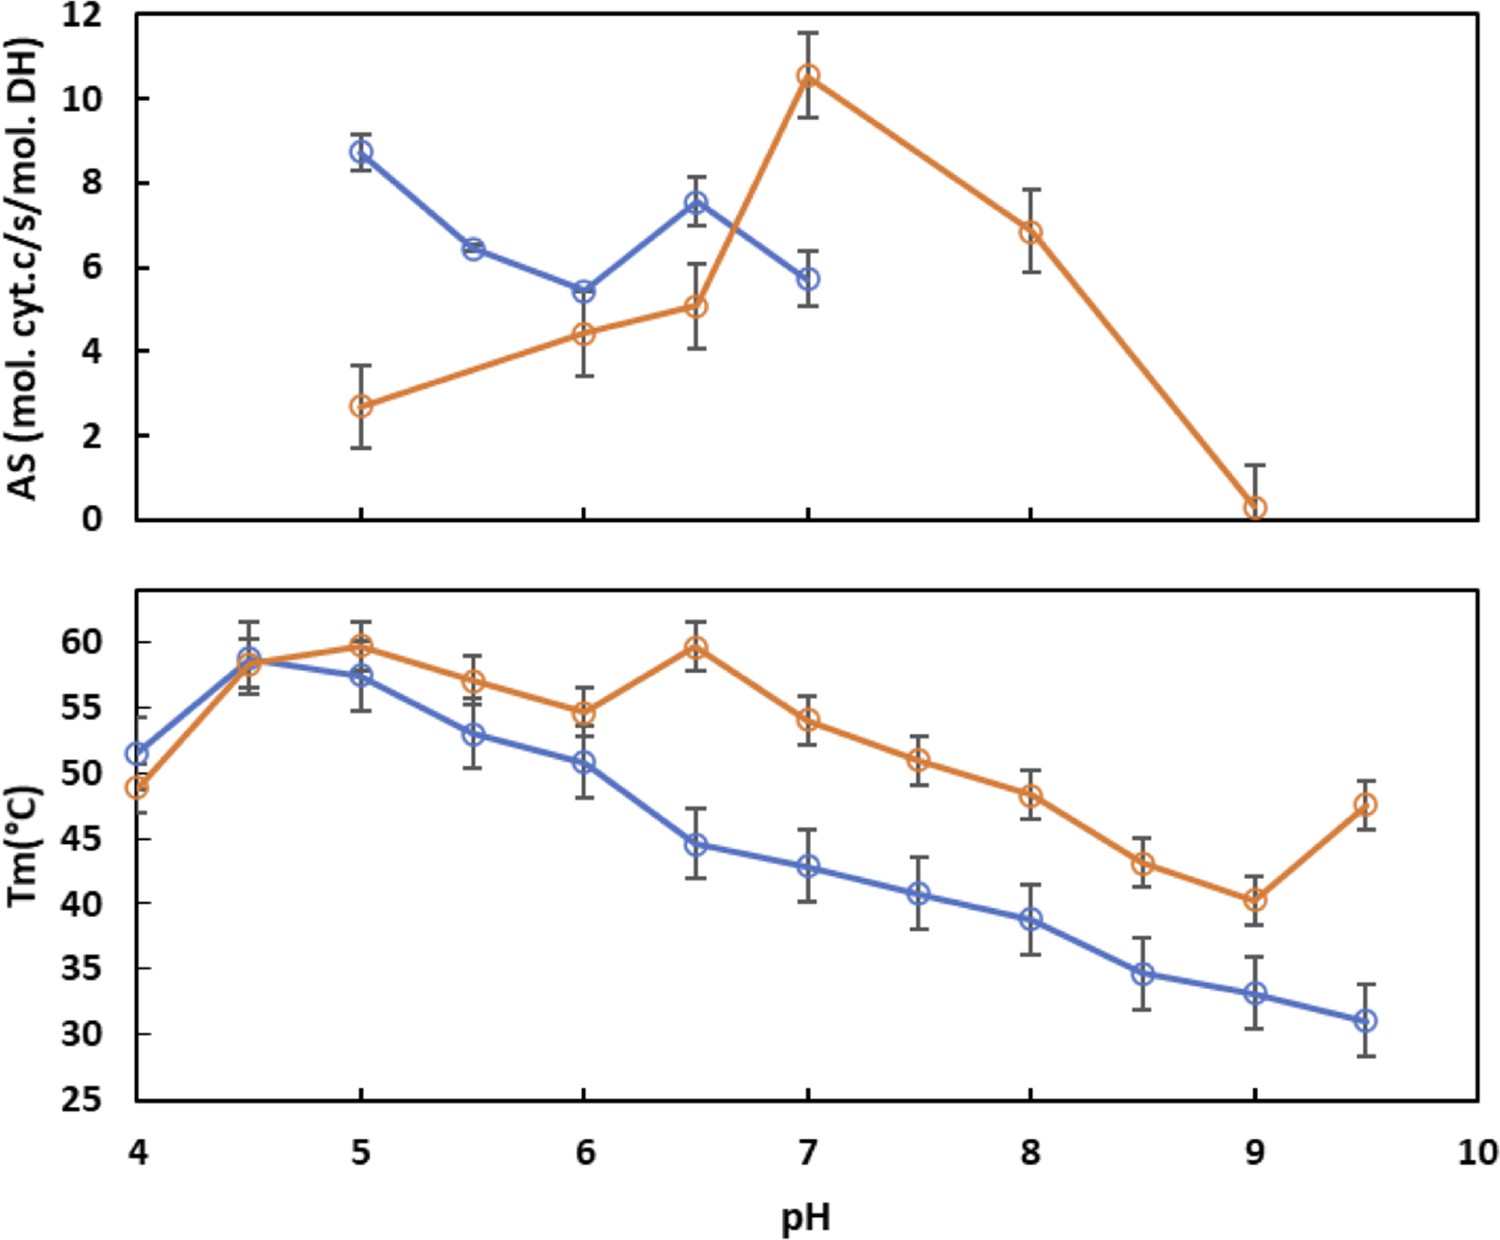
Comparison of pH dependence of SpNOX and SpNOXDH thermostability and activity.
Experiments were conducted in buffers at different pH at 0.1 M, 300 mM NaCl, and 5% glycerol (see Materials and methods). (A) Dependence of cytochrome c reductase activity of SpNOXDH (blue) and SpNOX (orange) on pH. (B) Dependence of SpNOXDH (blue) and SpNOX (orange) thermostability on pH. The sample sizes for the Tm and activity measurements were between 2 and 3.
Figure 3
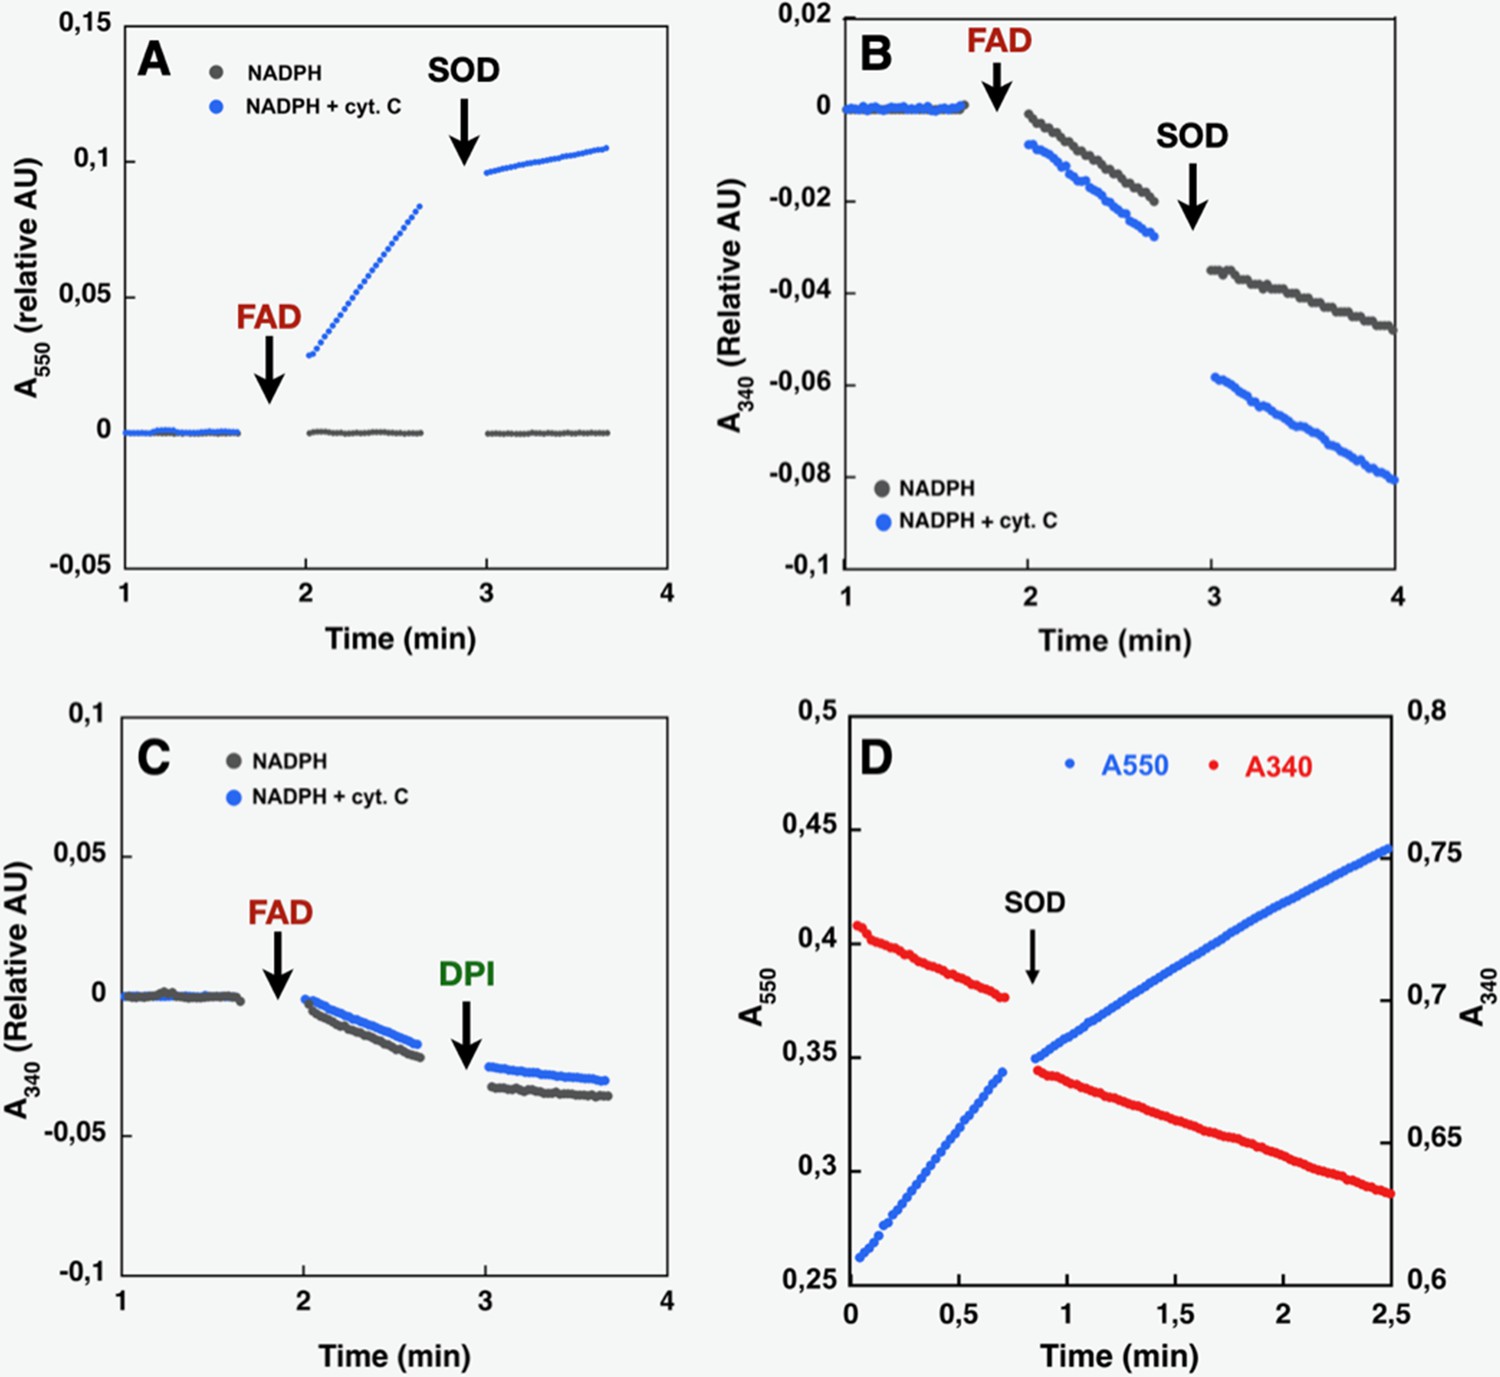
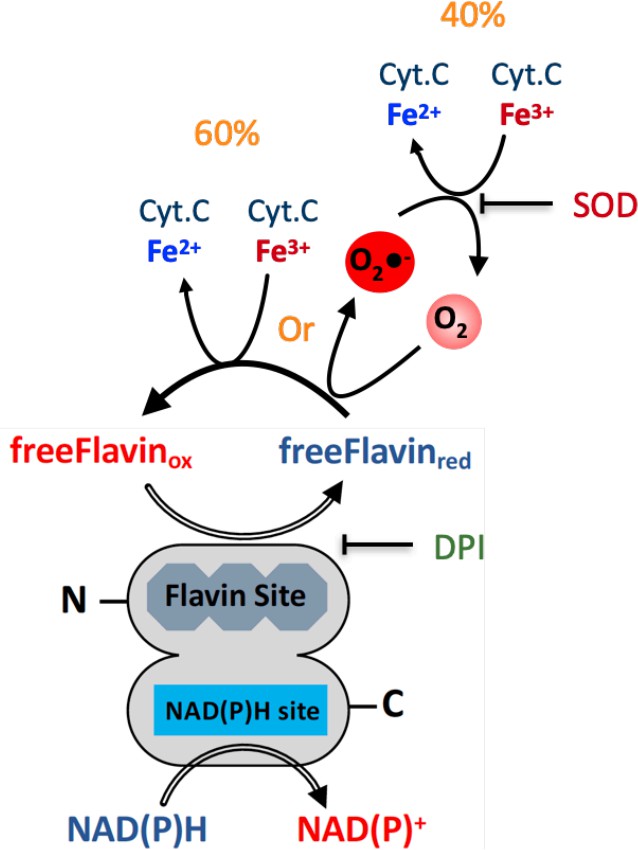
Effect of cyt. c, FAD, SOD, and DPI supplementation on SpNOXDH NADPH oxidase activity.
Assays performed with NADPH (200 µM) and SpNOXDH (1 µg) in the initial mix. Monitoring of cytochrome c reduction (Cyt. c reductase activity) (A) or NADPH oxidation (flavin reductase activity) (B) along with successive addition of FAD and SOD (A and B) or DPI (C) with Cyt. c (blue trace) or without (grey trace) in the initial mix. (D) Monitoring simultaneously NADPH oxidation (red) and cytochrome c reduction (blue) in presence of SpNOXDH, cytochrome c, NADPH and FAD, addition of SOD is indicated by an arrow.
Figure 4 with 1 supplement
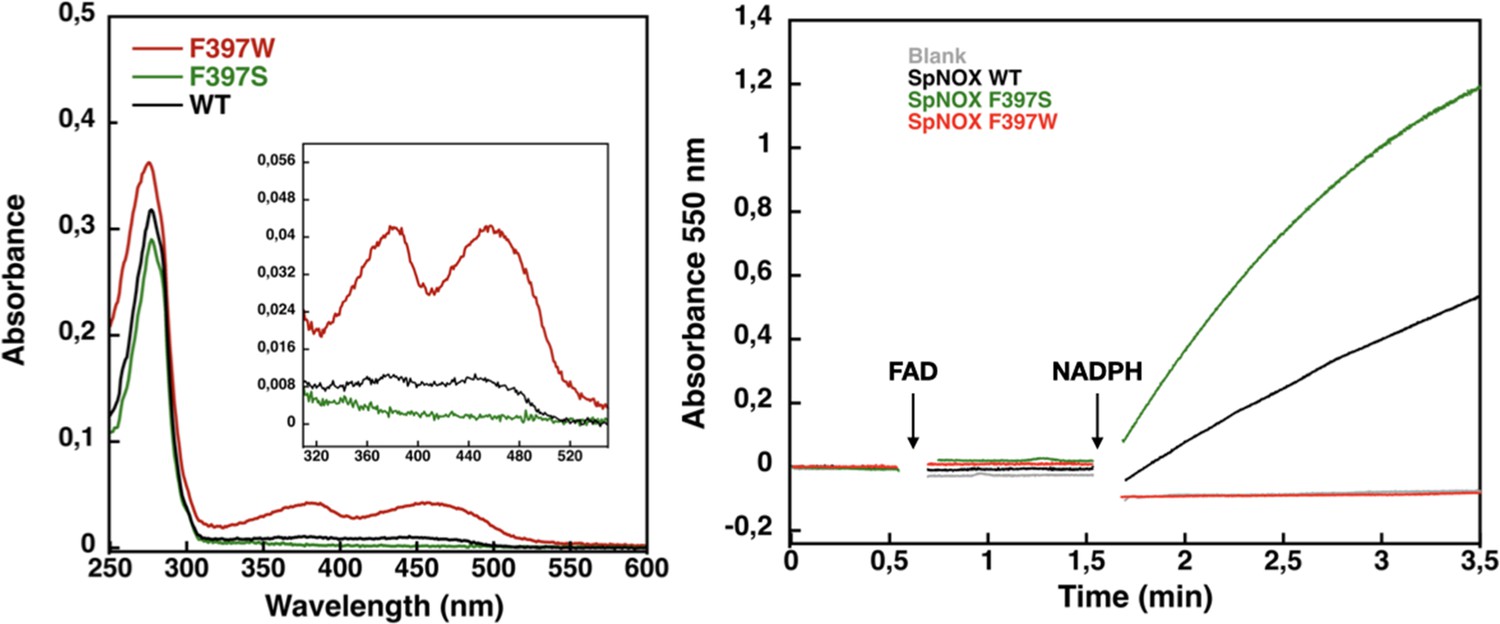
Flavin content and activity measurement of full-length SpNOX WT, SpNOX F397S and F397W.
(A) UV-Visible spectra of SpNOXDH WT, and mutants. Inset zoom on the 320–500 nm window, a specific spectroscopic feature of the oxidized flavin isoalloxazine ring. (B) Reduced cytochrome c was monitored at 550 nm for SpNOX WT (black), F397W (red), and F397S (green). A no-protein negative control is shown in grey. See also Figure 4—figure supplement 1 for spectral characterization of full-length SpNOX mutants.
Figure 4—figure supplement 1
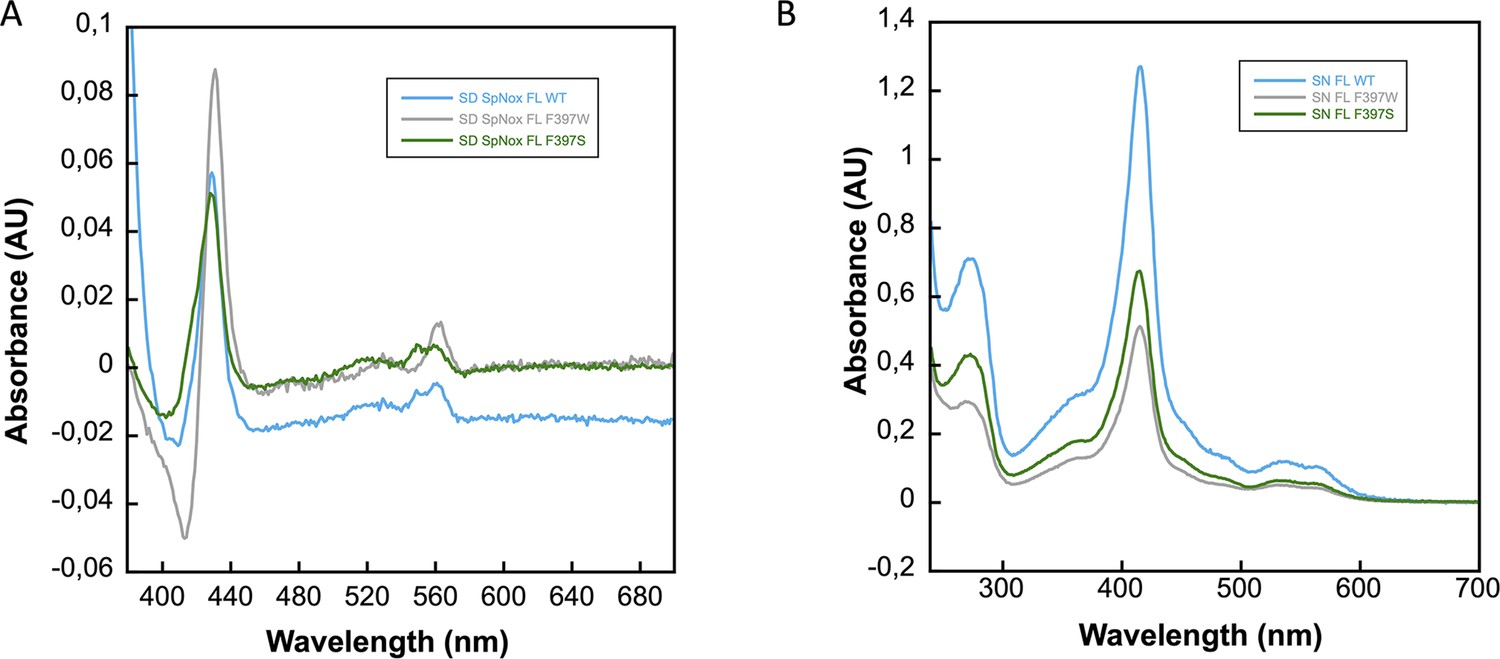
Characterization of SpNOX, SpNOX-F397W and SpNOX-F397S mutants.
(A) Difference spectra (reduced-oxidized) of membrane preparations from E. coli expressing SpNox FL WT (blue), SpNox FL F397W (grey) and SpNox FL F397S (green) mutants verify the presence of functional hemes. (B) UV-visible spectral characterization of purified SpNox FL WT, SpNox FL F397W and SpNox FL F397S in 50 mM Tris-HCl, pH7, 300 mM NaCl, 0.0025% LMNG (colors as in A). Spectra are not normalized with concentration.
Figure 5 with 2 supplements
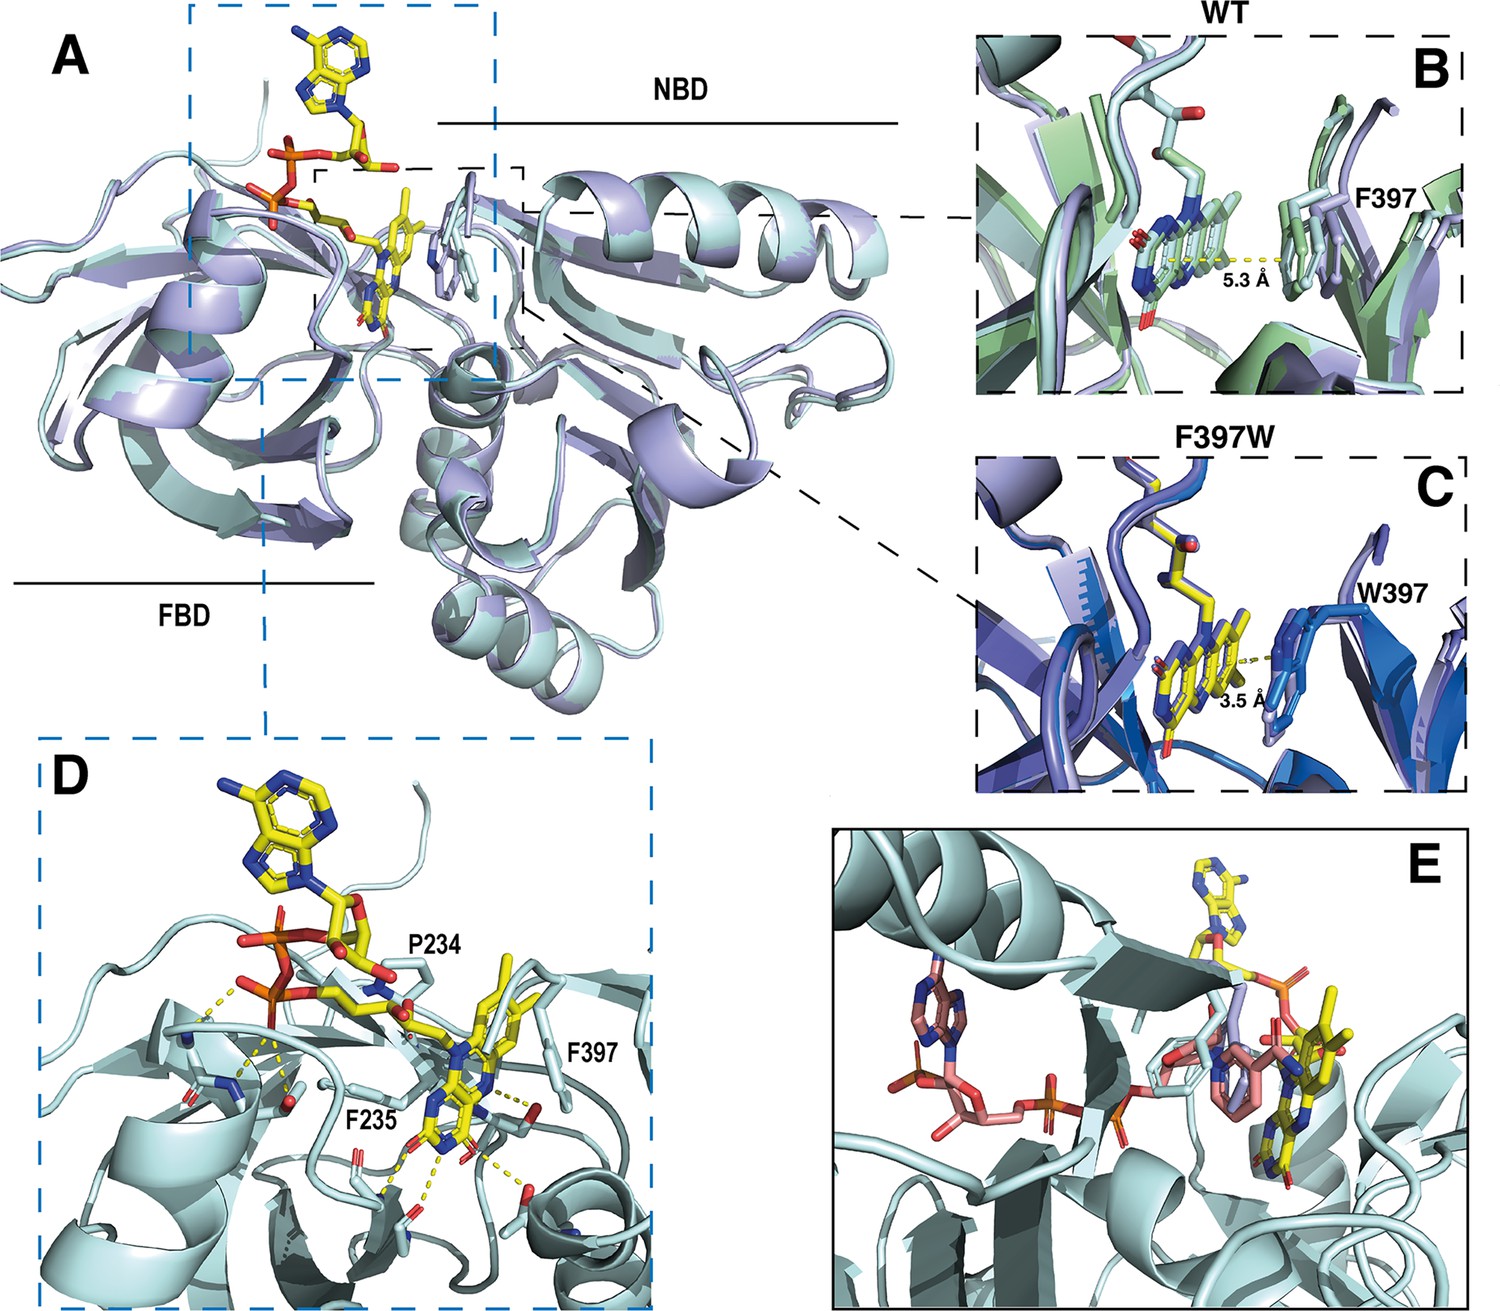
Crystal structures of the DH domain of SpNOX WT and F397W.
(A) Superposition of SpNOXDH WT (pale cyan ribbon, PDB: 8qq5) and SpNOXDH F397W (light blue ribbon, PDB: 8qq1); FAD is shown as sticks colored by atom, side chains of residues in position 397 (respectively F and W), are shown as sticks in the same color as the corresponding ribbon. (B and C) Superposition of the three different molecules of the asymmetric unit of WT SpNOXDH (B) and of SpNOXDH F397W (C), zoomed on the interaction of the isoalloxazine ring with the aromatic residue at position 397. (D) Close up of the FAD binding site in SpNOXDH WT; polar contacts are shown with dotted lines. Colors as for A. (E) SpNOXDH with the F397 (pale cyan sticks) and W397 (light blue sticks) residues superimposed; FAD as in A; and NADPH (salmon sticks) shown based on a superposition of the pea FNR:NADPH complex (PDB: 1qfz) with SpNOXDH.
Figure 5—figure supplement 1

Crystals of SpNOXDH F397W (left) and SpNOX F397W (right).
Figure 5—figure supplement 2
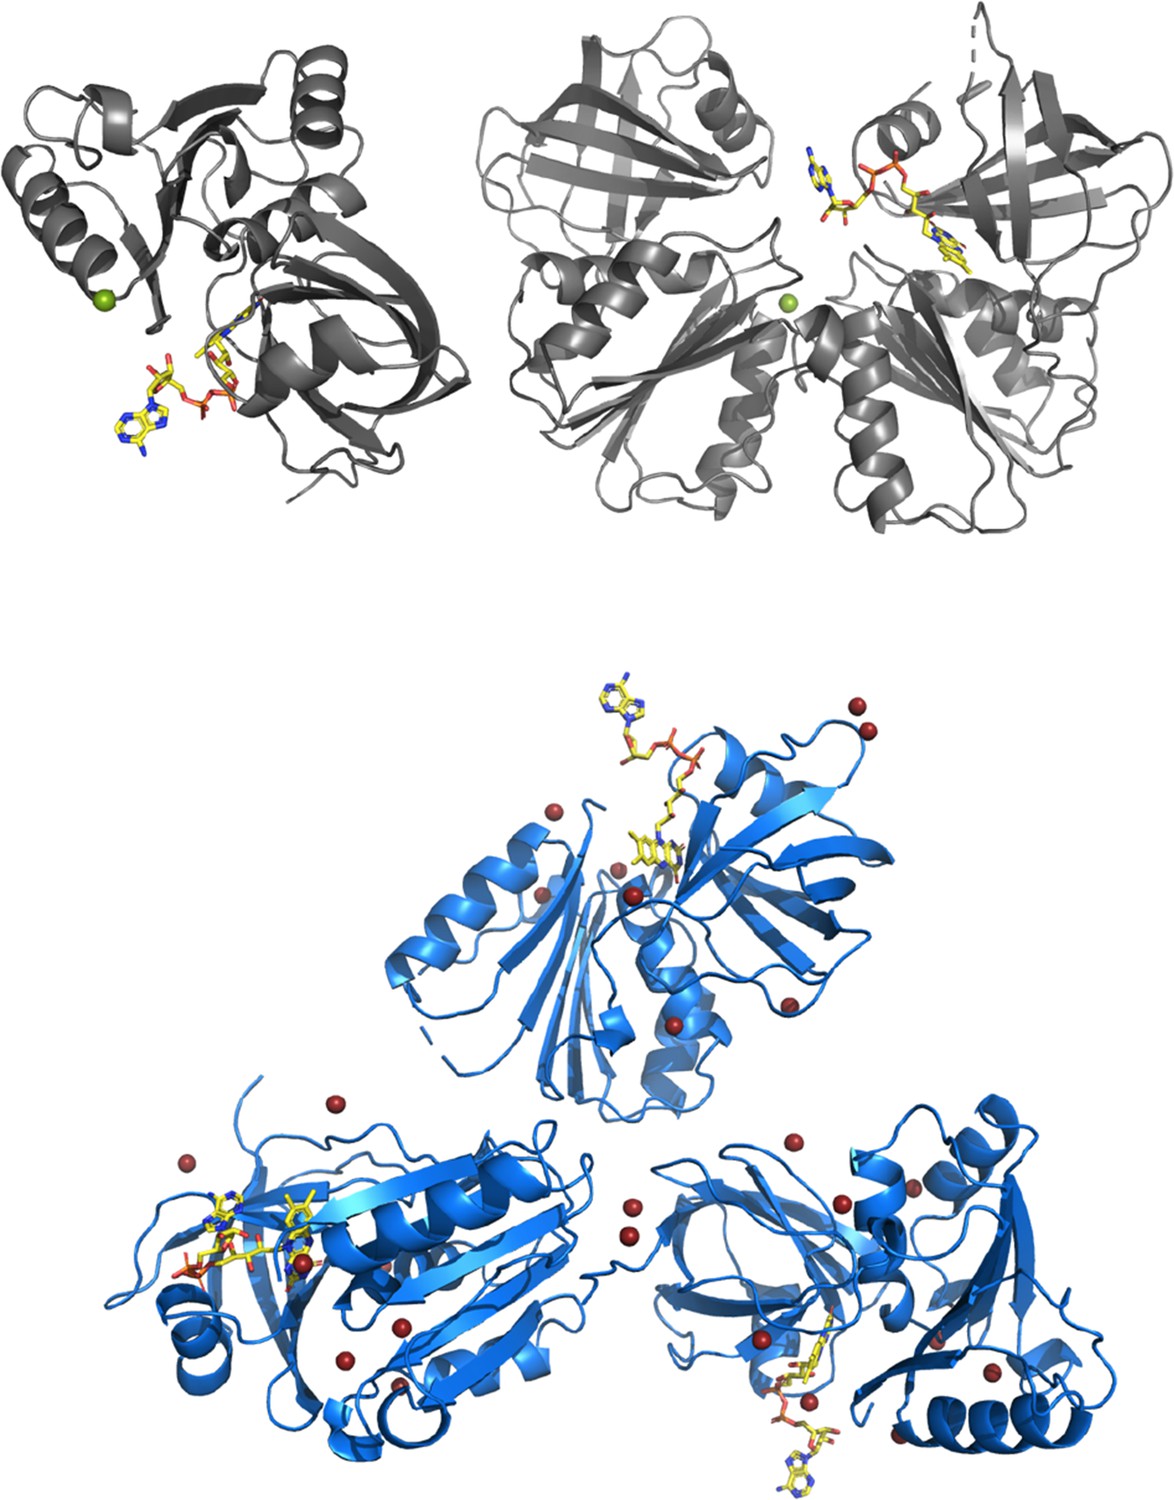
Asymmetric unit of crystal of SpNOXDH WT (top-grey) and of SpNOXDH F397W (bottom-blue).
FAD is depicted as sticks, colored by atom. Chloride ions are shown as green spheres, bromide ions used for SAD data acquisition as red spheres.
Figure 6 with 1 supplement
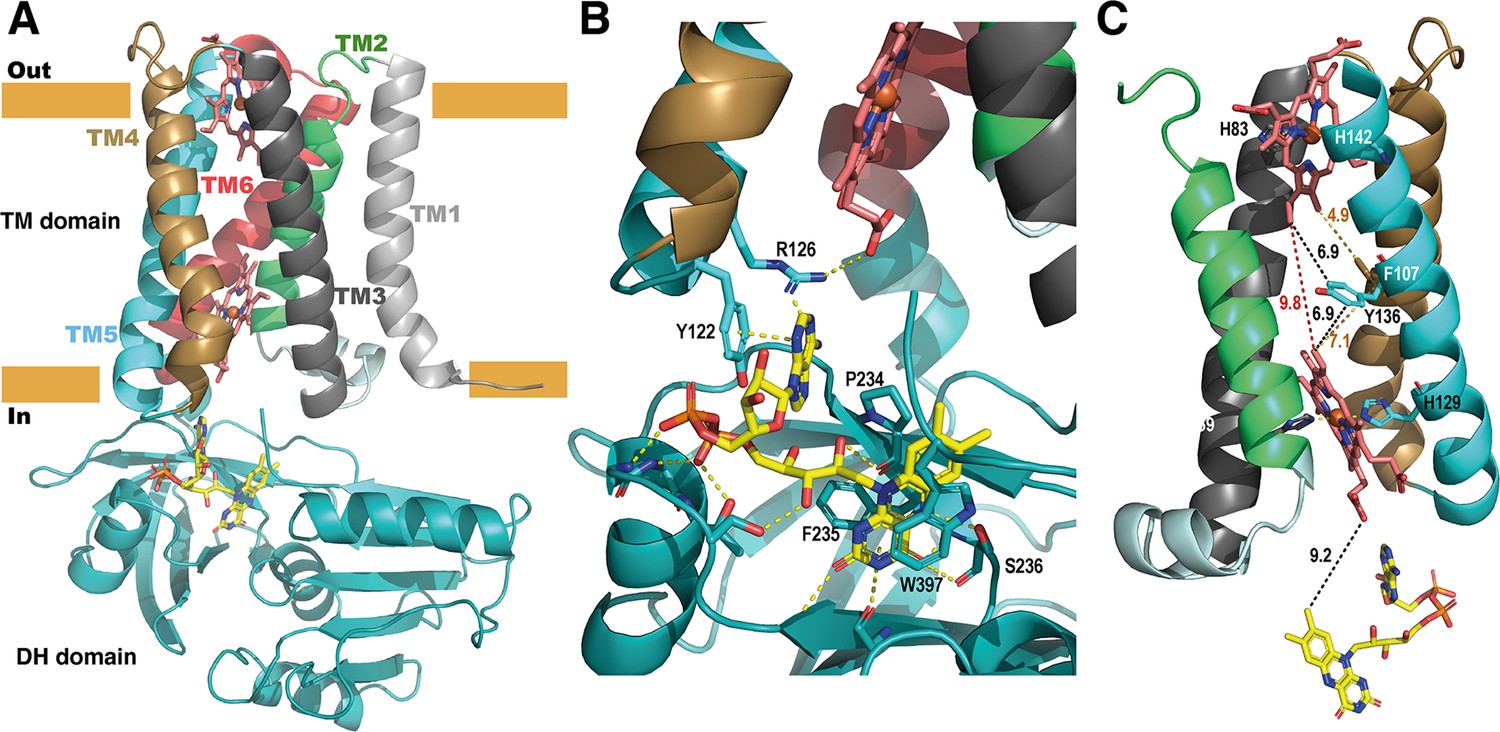
Structure of the full-length SpNOX.
(A) Overall structure of SpNOX F397W at 3.6 Å with ribbons in the TM colored by helix, hemes (red sticks) and FAD cofactor (colored by atom). (B) The FAD binding site; FAD as in A, side chains (sticks) of residues involved are labeled and interactions are indicated by yellow dotted lines. (C) Electron pathway from FAD to distal heme; for clarity, the DH domain and TM1 and TM6 are omitted. Two alternative electron pathways are indicated, from FAD to heme (both depicted as in A), through a direct transfer between the hemes (red dotted line) or with a relay between the hemes using either the well conserved aromatic residue Y136, or F107, both at intermediate distance from the hemes (black and orange dotted lines); distances in Å are indicated.
Figure 6—figure supplement 1
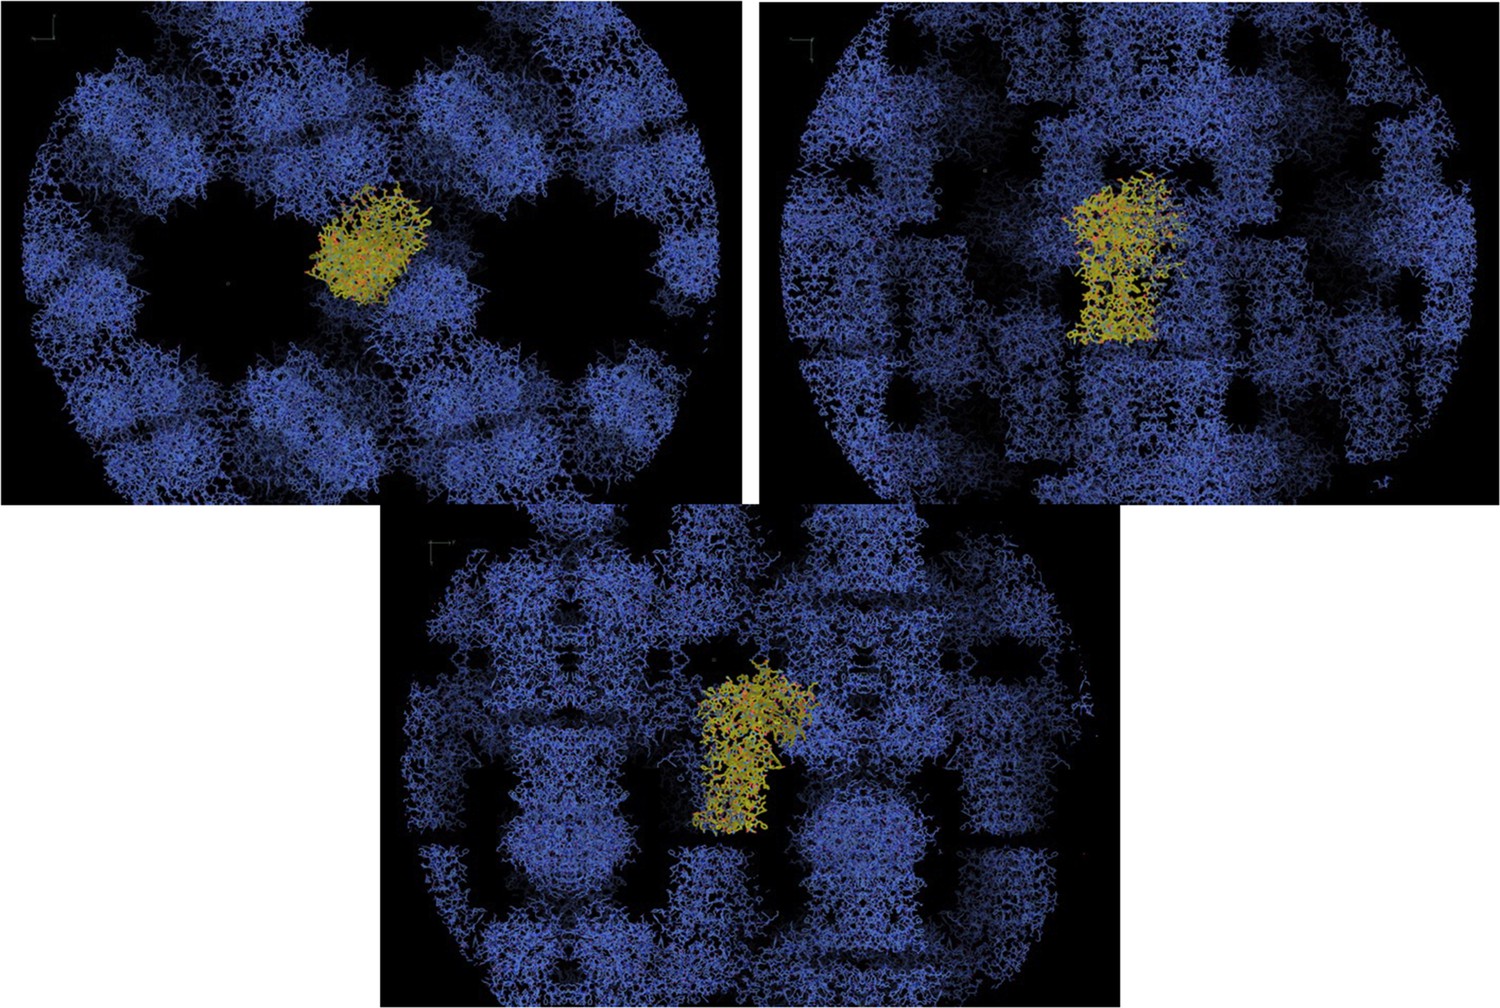
Packing in crystal of SpNOX.
Plane X-Y (top left), Plane X-Z (top right), Plane Y-Z (bottom). One asymmetric unit is seen in yellow sticks.
Figure 7
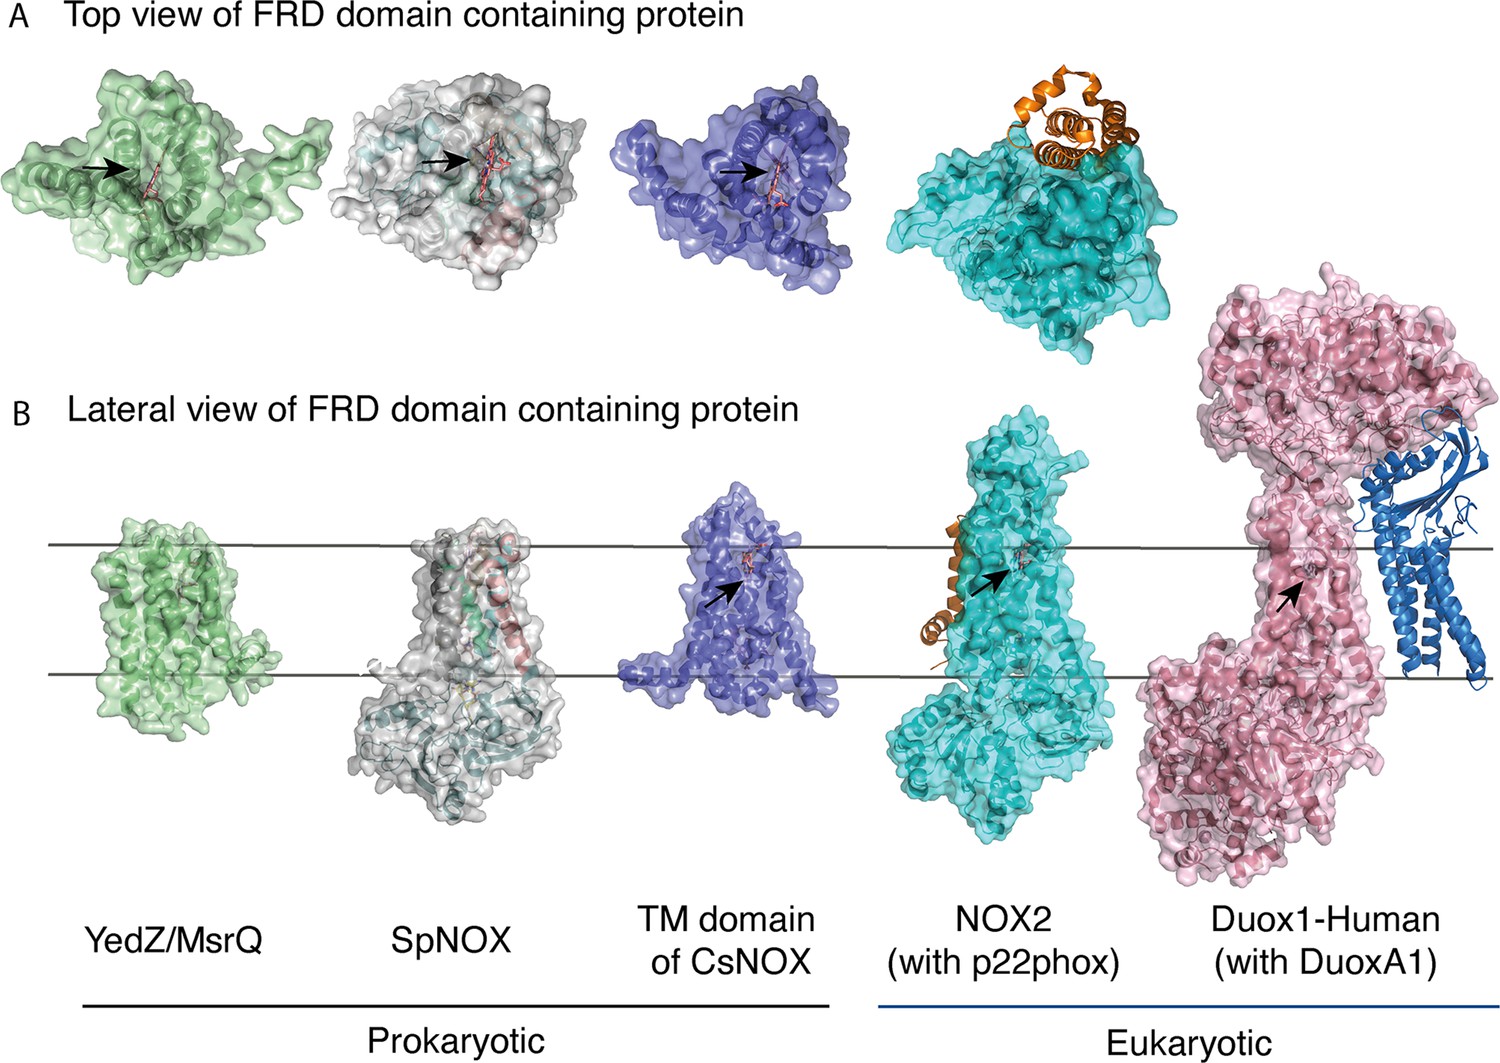
FRD containing proteins, represented as surfaces, and accessory proteins (p22phox and DUOXA1) represented as ribbons.
TM2 to TM5 were structurally aligned; all proteins are depicted in the same orientation based on this structural alignment. (A) Top (extracellular) views of the TM domains of MsrQ (AlphaFold model: P76343, green), SpNOX (this work, PDB: 8qq7, gray), TM domain of CsNOX (PDB: 5O0t, purple), NOX2/p22phox (PDB: 8gz3, blue) and DUOX1 (PDB: 7d3f, pink). (B) Each protein’s lateral side view (a 90 °C rotation from the orientation in A). Black arrow shows potential access to distal heme either from top or from lateral side. Hemes are represented as salmon sticks.
Figure 8
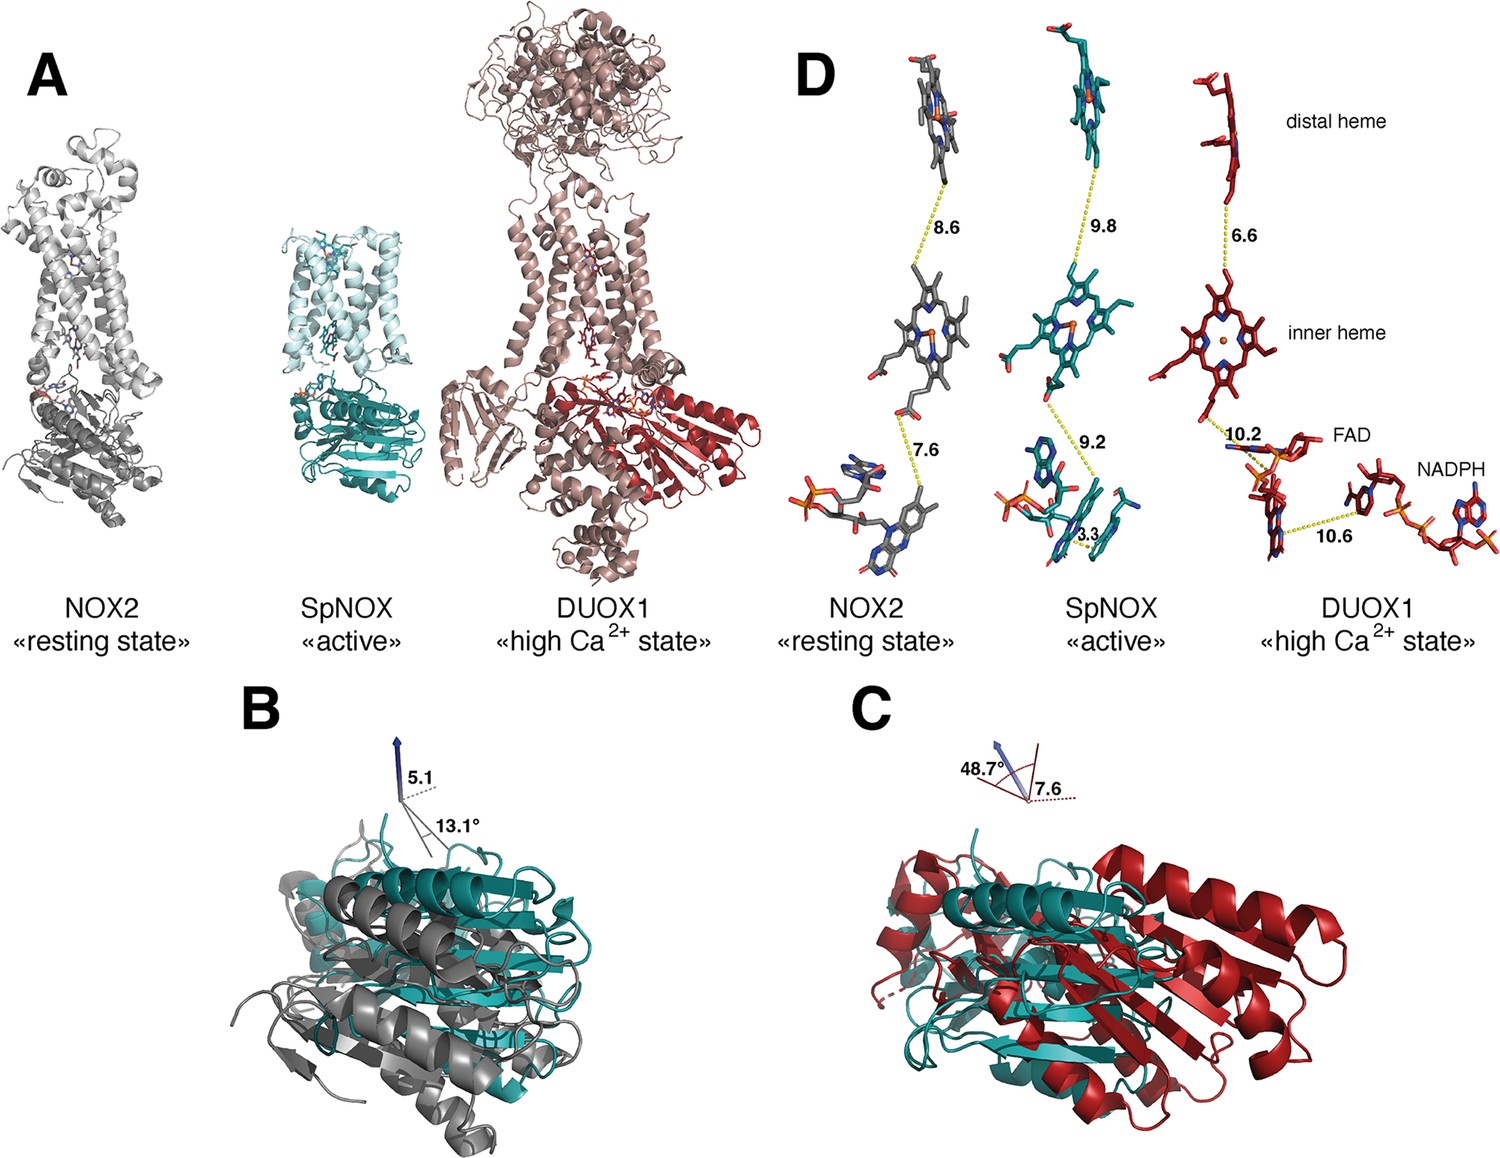
Comparison of domain and cofactor organization in NOX2, SpNOX and hDUOX1.
(A) Proteins were superimposed and are shown in identical orientations based on superposition, resting state NOX2 (PDB: 8gz3, gray ribbon), active SpNOX (this work, PDB: 8qq7, green ribbon) and high Ca2+ DUOX1 in (PDB: 7d3f, red ribbon), with DH domains in darker color. (B and C) DH domains only are represented in same orientations and color as in A. In B, angle and translation from NOX2 to SpNOXDH are indicated. In C, angle and translation from SpNOXDH to DUOX1 are indicated. (D) Cofactors necessary for electron transfer are shown as sticks, in identical orientations as in A-C, with distances indicated. In SpNOX the sidechain of Trp397 is shown and the distance to FAD isoalloxazine ring indicated. For DUOX1, NADPH is shown and the distance of nicotinamide to the isoalloxazine indicated.
Figure 9 with 2 supplements
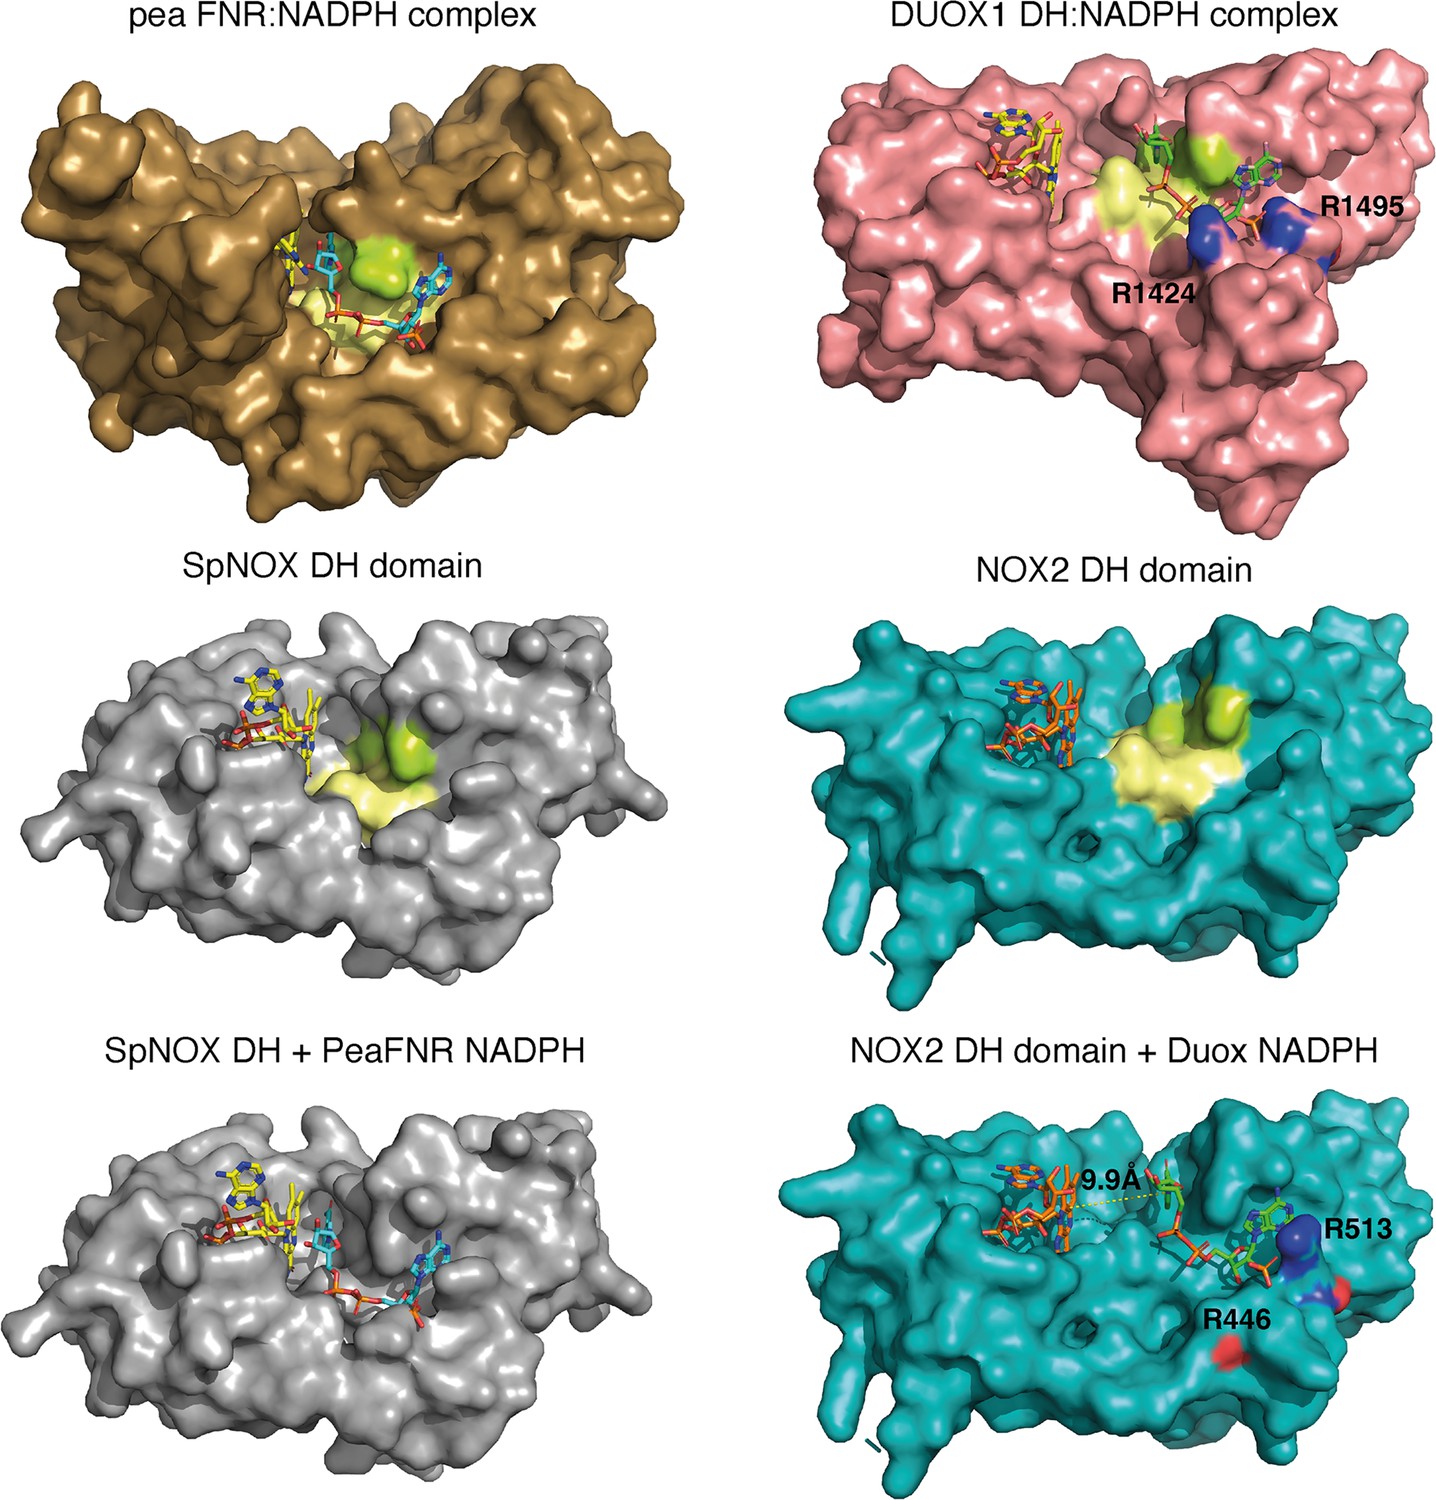
Comparison of FNR domains and their putative NADPH binding sites.
Top, pea FNR (PDB: 1qfz), DUOX1 domain (PDB: 7d3f) in complex with NADPH. Middle, SpNOX DH domain (PDB: 8qq7) and NOX2 DH domain in the resting state (PDB: 8gz3). Bottom, SpNOX DH is represented with the NADPH from pea FNR after superposition of those proteins; NOX2 DH is represented with the NADPH from DUOX1 after superposition of those proteins. Arg residues conserved between DUOX1 and NOX2 are highlighted using CPK colors, side chain of R446 is not defined in NOX2 CryoEM structure. In top and middle line, pale yellow and lime patches represent NADPH motifs 1 and 4, respectively (see Figure 1). Assuming that NADPH binding implies movement of F397, residues 397FKF399 have been omitted in the SpNOX DH surface to increase clarity and visibility of NAD(P)H binding groove.
Figure 9—figure supplement 1

Overlay of the pea FNR (sand) and the DH domain of SpNOX (pale cyan).
Lysine residues, K110/250, from the FBD domain involved in the pyrophosphate interaction of NADPH are conserved as well as the tyrosine residues, Y240/353, involved in a stacking interaction with the adenine ring and the serine residues, S228/348, binding to the 2’phosphate of the AMP moiety. On the contrary the R229 residue, from pea FNR, interacting with this phosphate is not conserved, in line with the absence of substrate selectivity of SpNOX.
Figure 9—figure supplement 2

Superposition of NOX2 in the resting state and SpNOX.
NOX2 (PDB: 8gz3) is in grey ribbon and SpNOX in blue. FAD is in yellow (NOX2) or orange (SpNOX) sticks; hemes are pink (NOX2) or orange (SpNOX) sticks.
Author response image 1
Tables
Table 1
Molecular specific activity monitoring either Cyt. C reduction or NADPH oxidation (flavin reductase activity).
Activities were measured for the different compositions of the initial mixture and addition of the multiple reactants. The sample sizes for the activity measurements were between 2 and 3.
| Cyt. C reductase activity | Flavin reductase activity | |
|---|---|---|
| mole of cyt. c reduced.s-1.mol-1 SpNOXDH | mole of NADPH oxidized.s-1.mol-1 SpNOXDH | |
| FAD | n.a. | 4,76±0.51 |
| FAD +Cyt .C | 6.64±0.51 | 6.34±0.33 |
| FAD +Cyt .C+SOD | 3.97±0.44 | 5.26±1.42 |
| FAD +DPI | n.a | 1.18±1.42 |
Table 2
SpNOX and SpNOXDH affinity for flavins.
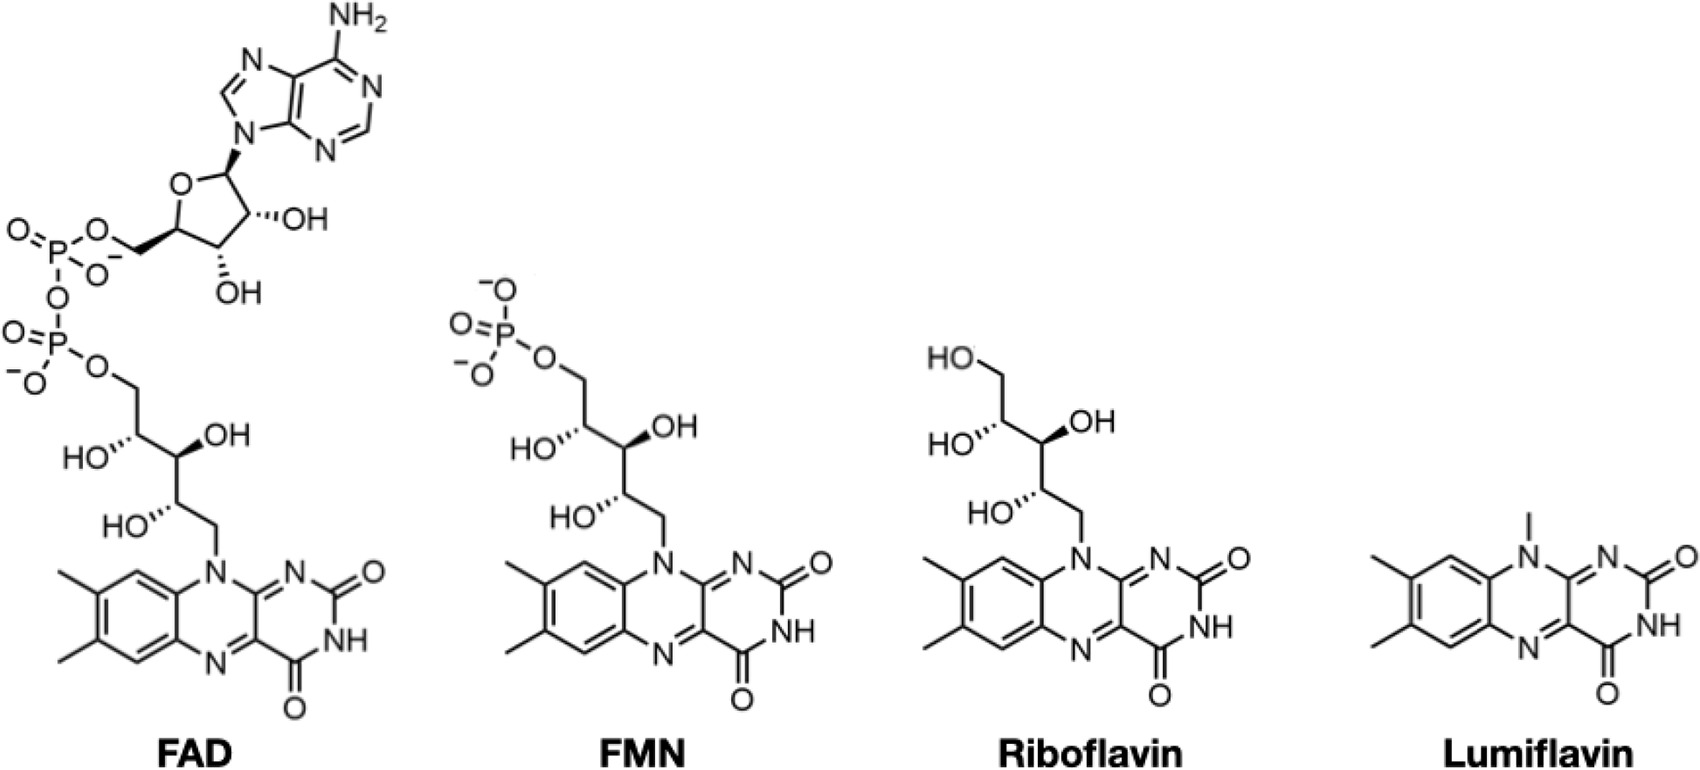 | ||||||
|---|---|---|---|---|---|---|
| Km (µM) | kcat (s–1) | |||||
| SpNOX | SpNOXDH | KmDH/Km | SpNOX | SpNOXDH | kcatDH/kcat | |
| FAD | 0.049±0.01 | 12.89±0,69 | 263 | 4.68±0.74 | 6.73±0.74 | 1.44 |
| FMN | 0.92±0.01 | 7.89±0.48 | 8.6 | 3.01±0.04 | 5.14±0.14 | 1.70 |
| Riboflavin | 8.28±0.01 | 16.76±1.47 | 2 | 7.37±0.38 | 2.77±0.16 | 0.38 |
| Lumiflavin | 16.56±2.77 | 15.85±1.07 | 1 | 4.67±0.45 | 4.14±0.11 | 0.89 |
-
Table 2—source data 1
Michaelis Menten analysis of SpNOX and SpNOXDH as a function of the flavin substrate.
- https://cdn.elifesciences.org/articles/93759/elife-93759-table2-data1-v1.pdf
Table 3
Km and Kcat using NADPH or NADH as electron donor for the SpNOX WT, F399W and F397S full-length constructs or the corresponding versions of the DH domain (SpNOXDH).
| Substrat | Km (µM) | kcat (s–1) | ||||
|---|---|---|---|---|---|---|
| SpNOX | SpNOXDH | SpNOX | SpNOXDH | |||
| Assays | Cyt. C red | Cyt. C red | FAD red | Cyt. C red | Cyt. C red | |
| NADPH | WT | 41.5±5 | 106±31 | 87.89±13 | 6.42±0.6 | 5.42±1.15 |
| F399W | n.d. | 86.7±6.5 | - | n.d. | 9.07±0.5 | |
| F397S | 33.76±5 | 79.3±19.5 | - | 10.80±0.5 | 8.29±1.3 | |
| NADH | WT | 41.81±4.4 | 133±21 | 80.27±9.1 | 3.5±0.2 | 4.41±0.5 |
| F399W | n.d. | 148.6±46 | - | n.d. | 8.65±2 | |
| F397S | 25.46±2 | 66.9±10.3 | - | 10.3±0.4 | 6.20±0.5 | |
| WT NADPH/NADH | 1 | 0.8 | 0.96 | 1.8 | 1.2 | |
-
Table 3—source data 1
Michaelis Menten analysis of wild type and mutant SpNOX and SpNOXDH as a function of the nicotinamide-based electron donor.
- https://cdn.elifesciences.org/articles/93759/elife-93759-table3-data1-v1.pdf
Table 4
Determination of Km for flavins as a function of the mutations in the D-loop region.
| FAD | FMN | Riboflavin | NADPH | |||||
|---|---|---|---|---|---|---|---|---|
| Km | Km | Km | Km | |||||
| WT | 0.06±0.01 | - | 0.9±0,3 | - | 6.4±0.2 | - | 13±0.74 | - |
| Y122A | 0.38±0.5 | 6.4 | 1.5±0.9 | 1.7 | 9.6±0.08 | 1.5 | 23.8±0.04 | 1.8 |
| R126A | 3.5±0.33 | 59,1 | 1.5±0.9 | 3.2 | 6.63±0.38 | 1.03 | 24.4±0.45 | 1.87 |
-
Table 4—source data 1
Michaelis Menten analysis of SpNOX and SpNOX Y122A and SpNOX R126A as a function of the flavin substrate.
- https://cdn.elifesciences.org/articles/93759/elife-93759-table4-data1-v1.pdf
-
Table 4—source data 2
kcat determined as a function of the mutation in the D-loop and the flavin used.
- https://cdn.elifesciences.org/articles/93759/elife-93759-table4-data2-v1.pdf
Table 5
X-ray data collection and refinement statistics of SpNOXDH WT, SpNOXDH F397W and full-length SpNOX F397W.
| Data collection | |||
|---|---|---|---|
| DH F397W | DH WT | FL F397W | |
| Space group | P41212 | P41212 | P6422 |
| Cell a, b, c (Å) | 104.62, 104.62, 142.68 | 104.88, 104.88, 139.29 | 145.97, 145.97, 153.62 |
| Angles a, b, g (°) | 90, 90, 90 | 90, 90, 90 | 90, 90, 120 |
| Resolution (Å) | 58.94–1.94 (1.97–1.94) | 46.9–2.50 (2.60–2.50) | 47.82–3.62 (3.95–3.62) |
| Rmerge | 0.117 (1.829) | 0.140 (2.441) | 0.072 (2.1) |
| I/σ | 21.2 (2.1) | 18.99 (1.46) | 19.6 (1.7) |
| Completeness (%) | 98.4 (95.6) | 100.0 (100.0) | 47.9 (10.7) 90.9* (85.4*) |
| Redundancy | 13.8 (12.9) | 25.96 (26.86) | 20.4 (20.1) |
| Ellipsoid | n/a | n/a | 0.894 a*–0.447 b*, b*, c* |
| Refinement | |||
| Resolution (Å) | 36.99–1.94 | 46.9–2.5 | 47.82–3.62 |
| Reflections / free % | 57709/5.00 | 27532/5.00 | 11510/4.45 |
| Rwork / Rfree | 0.190/0.225 | 0.197/0.290 | 0.262/0.320 |
| B-average (Å2) | 38.64 | 70.2 | 201.0 |
| R.m.s.d Bond lengths (Å) Bond angles (°) | 0.012 1.55 | 0.007 1.456 | 0.0071 1.6931 |
| Ramachandran (%) Favored Outliers | 98.6 0.0 | 93.7 0.0 | 87.1 1.0 |
-
Highest resolution shell is shown in parenthesis.
-
Data has been fitted to the ellipsoid defined by the following parameters:
-
Diffraction limits & principal axes of ellipsoid fitted to diffraction cut-off surface:
-
5.308 Å, 1.0000 0.0000 0.0000 0.894 a*–0.447 b*.
-
5.308 Å, 0.0000 1.0000 0.0000 b*.
-
3.240 Å, 0.0000 0.0000 1.0000 c*.
-
Worst diffraction limit after cut-off: 5.837 Å at reflection 20 3 0, in direction 0.989 a*+0.148 b*.
-
Best diffraction limit after cut-off: 3.623 Å at reflection 7 3 41, in direction 0.168 a*+0.072 b*+0.983 c*.
-
Beq: 366.94 [=equivalent overall isotropic B factor on Fs.].
-
Delta-B tensor: 100.25B11 100.25B22 200.49B33.
Additional files
Download links
A two-part list of links to download the article, or parts of the article, in various formats.
Downloads (link to download the article as PDF)
Open citations (links to open the citations from this article in various online reference manager services)
Cite this article (links to download the citations from this article in formats compatible with various reference manager tools)
X-ray structure and enzymatic study of a bacterial NADPH oxidase highlight the activation mechanism of eukaryotic NOX
eLife 13:RP93759.
https://doi.org/10.7554/eLife.93759.3


