Identification of pharmacological inducers of a reversible hypometabolic state for whole organ preservation
- Wyss Institute for Biologically Inspired Engineering at Harvard University, United States
- Department of Biology, Tufts University, United States
- DEVANA group, Faculty of Pharmacy, University of Castilla-La Mancha, Spain
- Vascular Perfusion Solutions Inc, United States
- RESTOR, 59th Medical Wing, JBSA, Lackland AFB, United States
- Allen Center, Tufts University, United States
- Vascular Biology Program & Department of Surgery, Boston Children’s Hospital and Harvard Medical School, United States
- Harvard John A. Paulson School of Engineering and Applied Sciences, United States
Figures
Figure 1 with 1 supplement
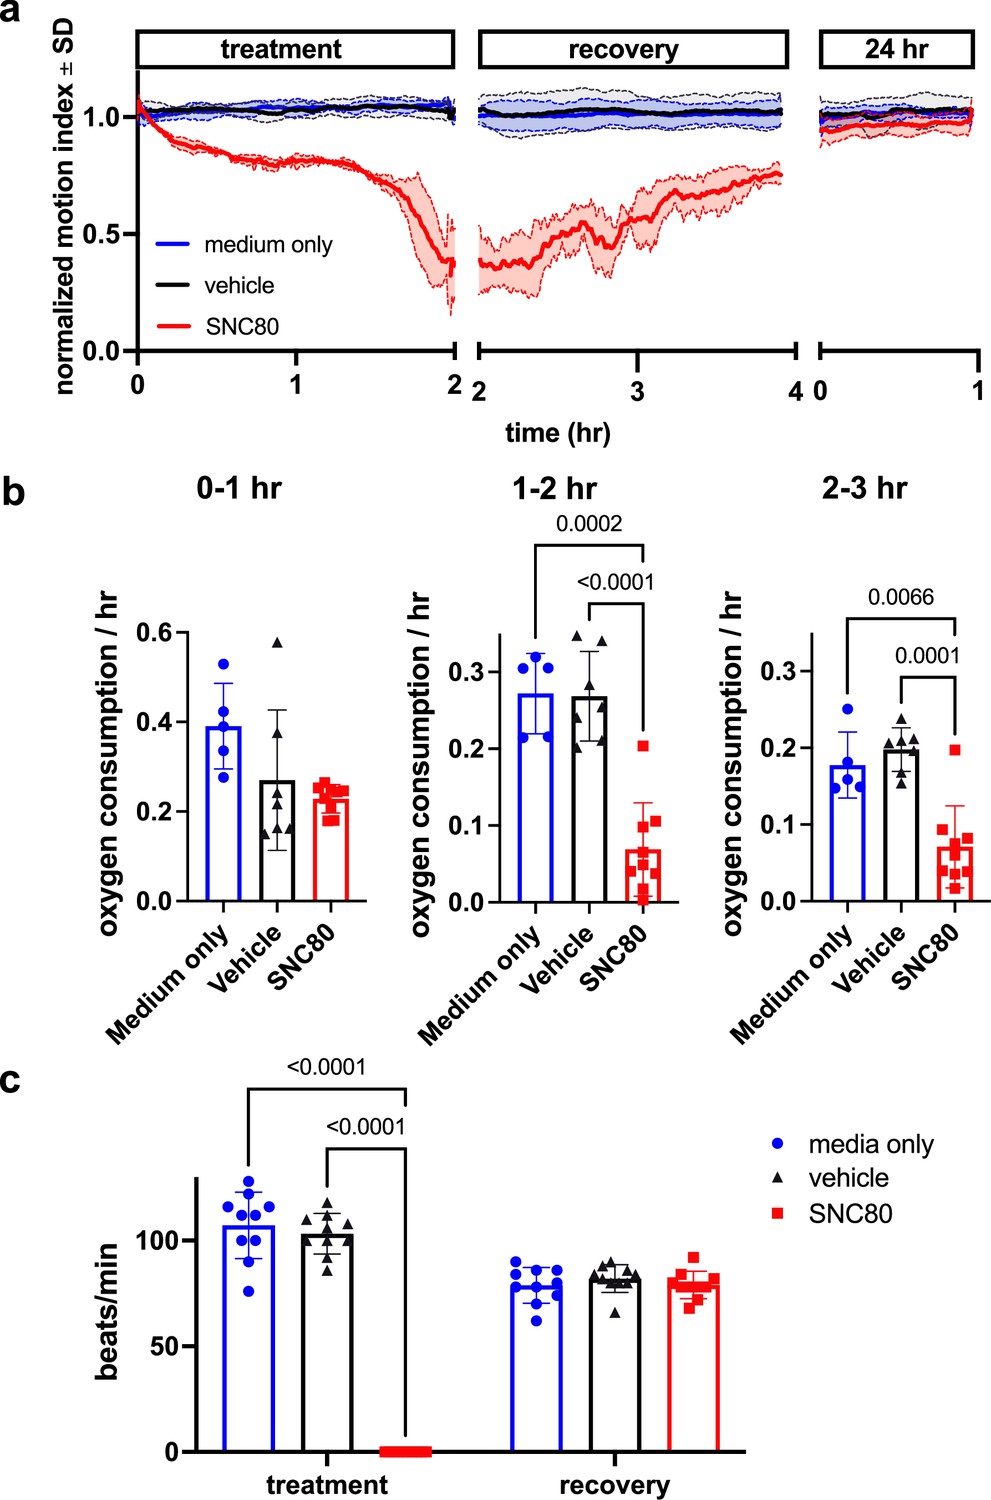
SNC80 treatment in Xenopus tadpoles.
(a) Swimming activity of Xenopus during 100 μM SNC80 or vehicle treatment. Data represent the mean ± SD of n=3 replicates, with 10 tadpoles per replicate. (b) Oxygen consumption rate for Xenopus treated with SNC80 or vehicle controls. N=5 medium only, n=7 vehicle and n=9 SNC80, with each data point representing the cumulative oxygen consumption for 5 tadpoles. (c) Heart rate in SNC80 and vehicle-treated Xenopus (n=10 tadpoles/group). Statistical comparisons were performed using a Brown-Forsythe and Welch’s ANOVA test with a Dunnett correction for multiple comparisons (b) and a two-way ANOVA (treatment × timepoint) with Tukey correction for multiple comparisons (c). Bar plots show the mean ± SD of each group.
Figure 1—figure supplement 1
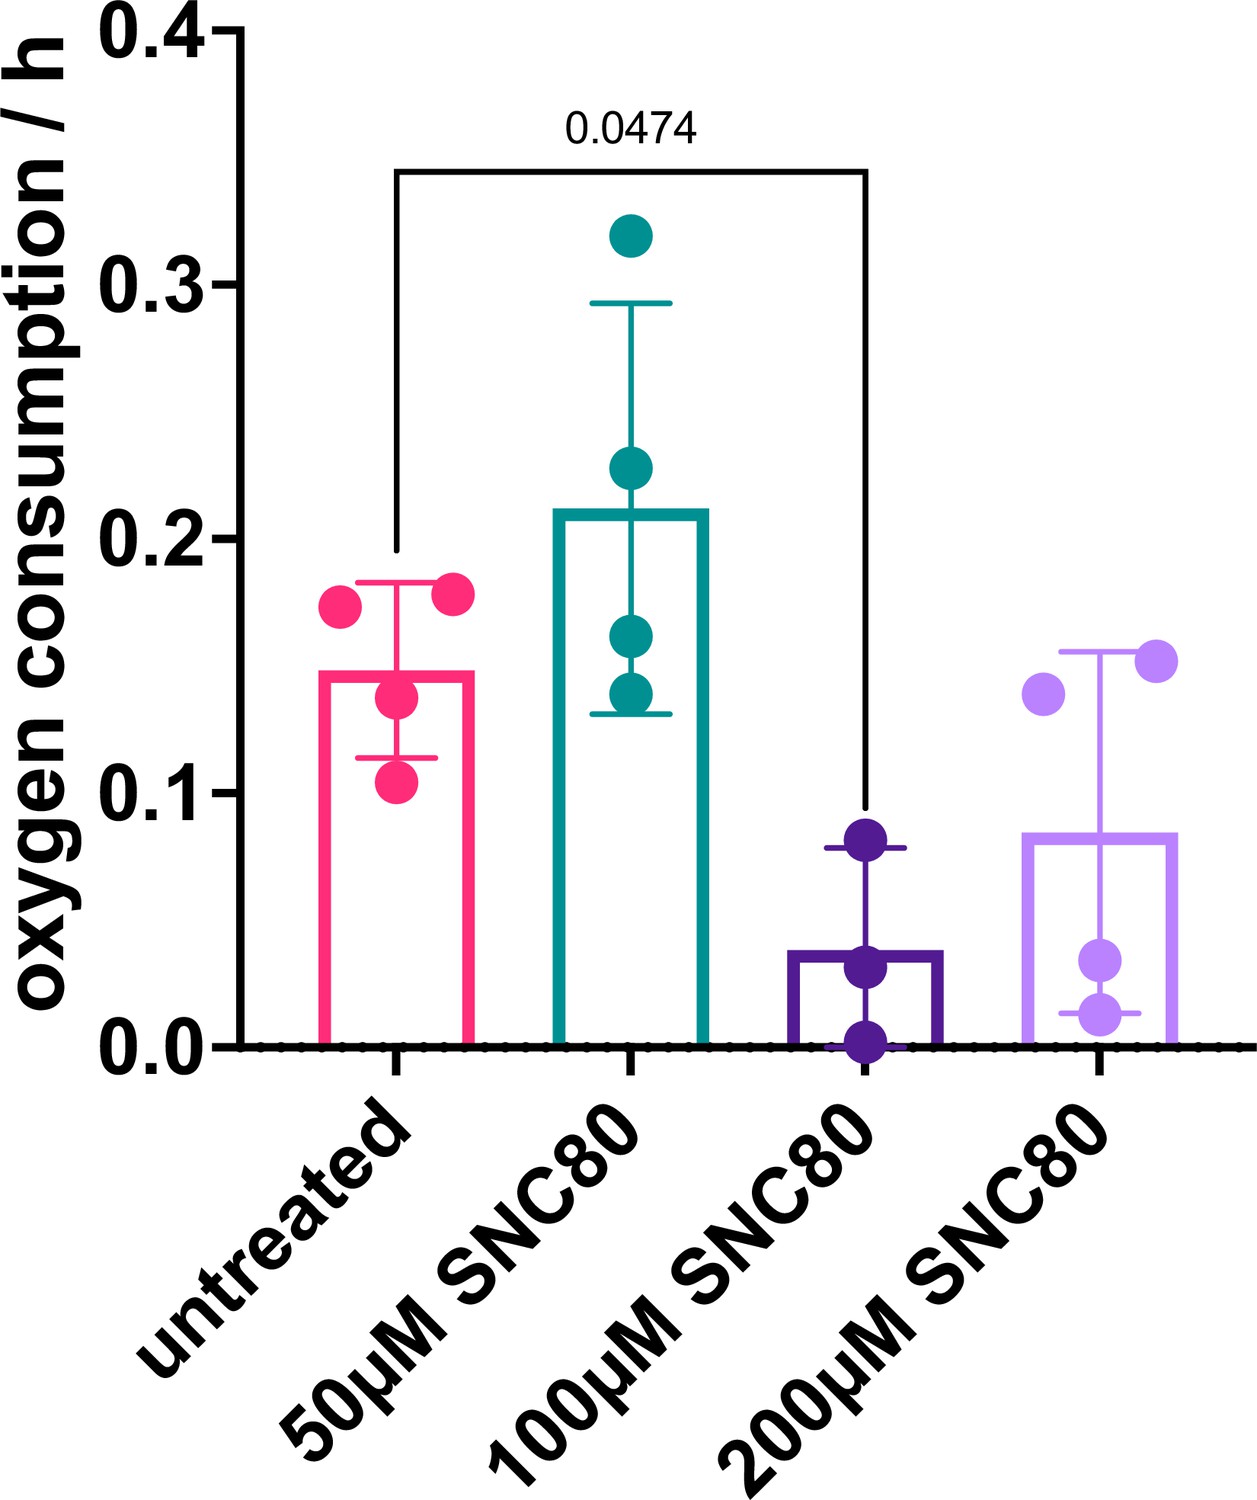
Metabolic measurements in SNC80-treated Xenopus embryos.
Oxygen consumption rate in Xenopus embryos treated with SNC80 (n=3–4 biological replicates/group). Statistical comparisons were performed using a Brown-Forsythe and Welch’s ANOVA test with Dunnett correction for multiple comparisons between untreated and each treatment group. Data represent the mean ± SD.
Figure 2
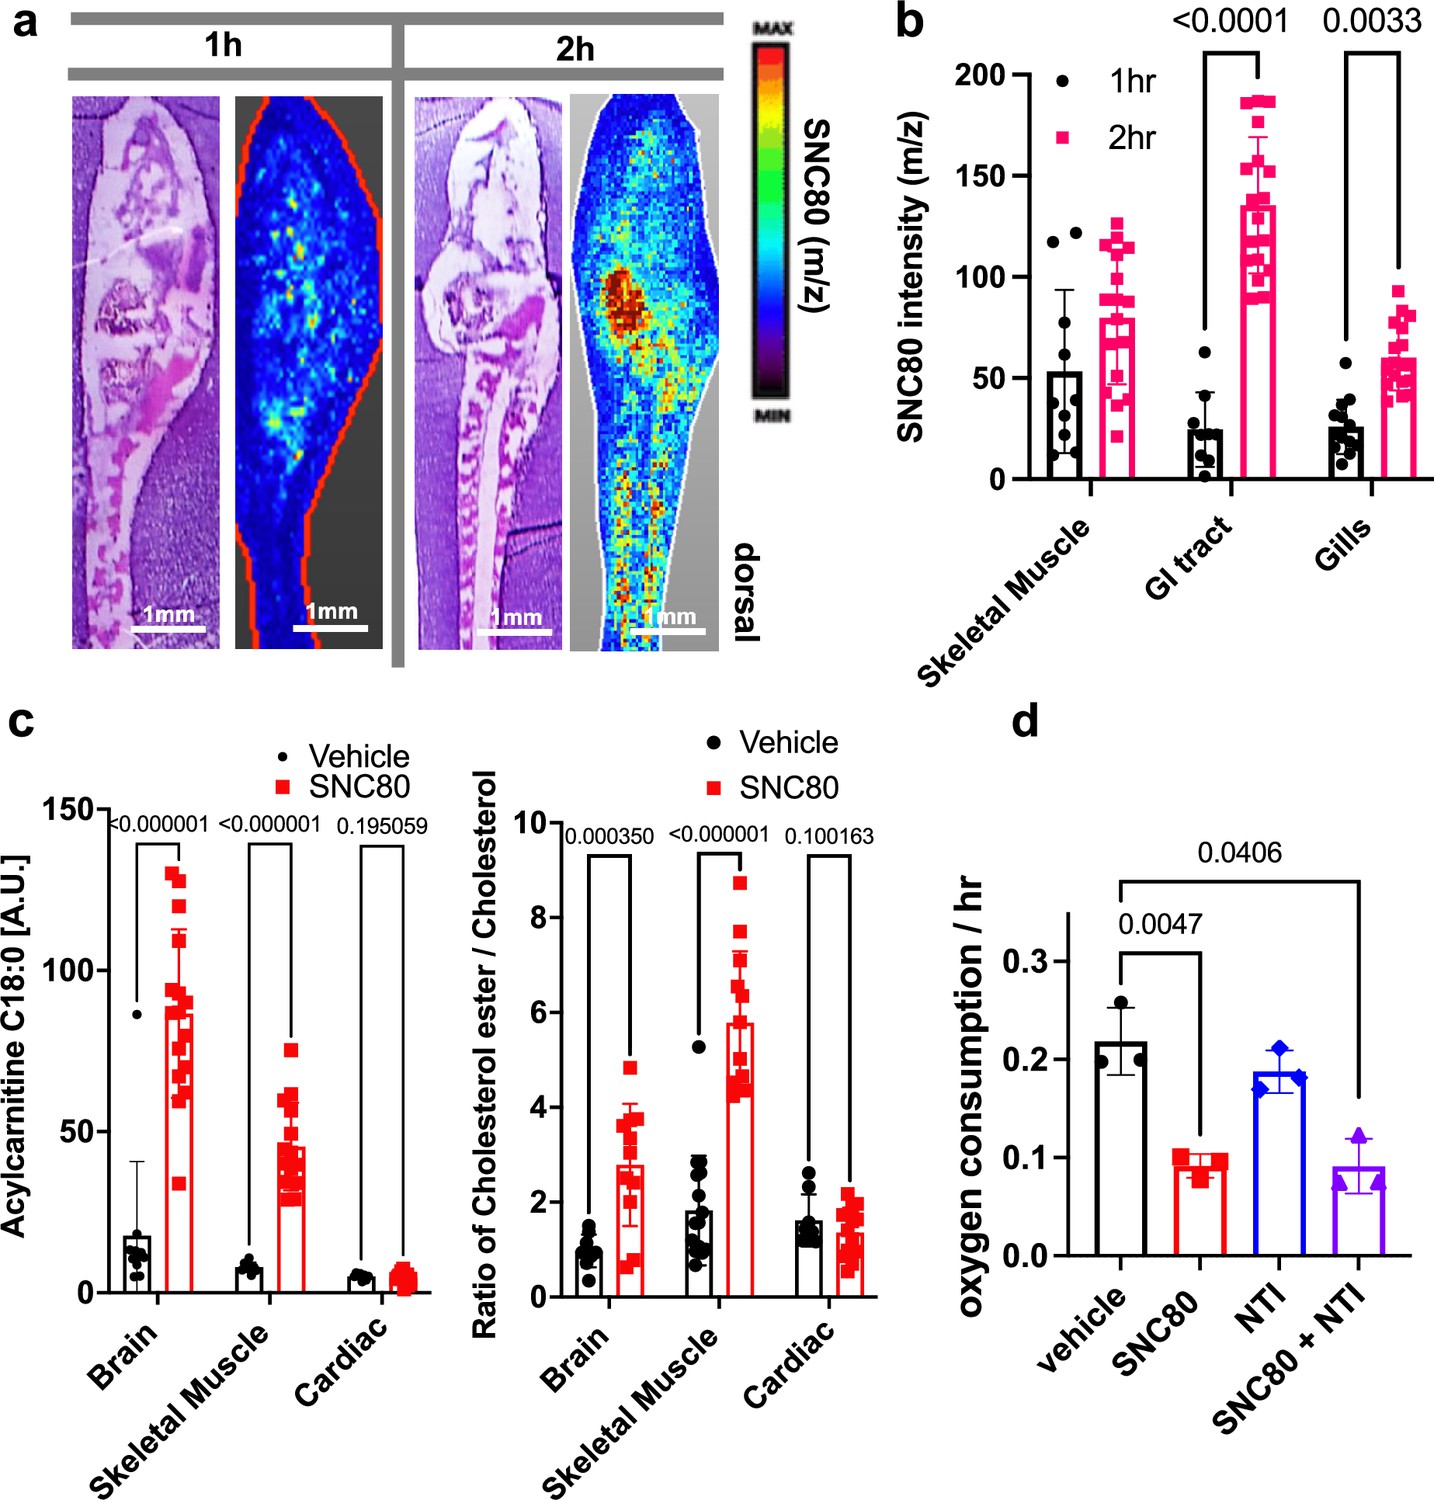
SNC80 uptake and activity at the delta opioid receptor.
(a) Distribution of SNC80 in Xenopus tadpoles after 1 and 2 hr of compound exposure. (b) Uptake of SNC80 in the tadpole skeletal muscle, gastrointestinal (GI) tract, and gills at 1 and 2 hr of exposure. (c) Levels of acylcarnitine and cholesterol ester in the skeletal muscle, brain, and cardiac tissue after 1 hr of SNC80 treatment. In vivo distributions of SNC80 and lipid levels measured from N=5 tadpoles per condition; N=3 sections/slide. (d) Oxygen consumption in Xenopus tadpoles treated with SNC80, the delta opioid antagonist naltrindole, or a combination of SNC80 and naltrindole. N=3 replicates/group with each data point representing the cumulative oxygen consumption from 5 tadpoles. Statistical comparisons were performed using a two-way ANOVA (time × tissue region) with Sidak’s correction for multiple comparisons (b), multiple unpaired t-tests for each tissue region with FDR correction (c), and a Welch’s ANOVA test with Dunnett correction for multiple comparisons between vehicle and each treatment group (d). Bar plots show the mean ± SD of each group.
Figure 3
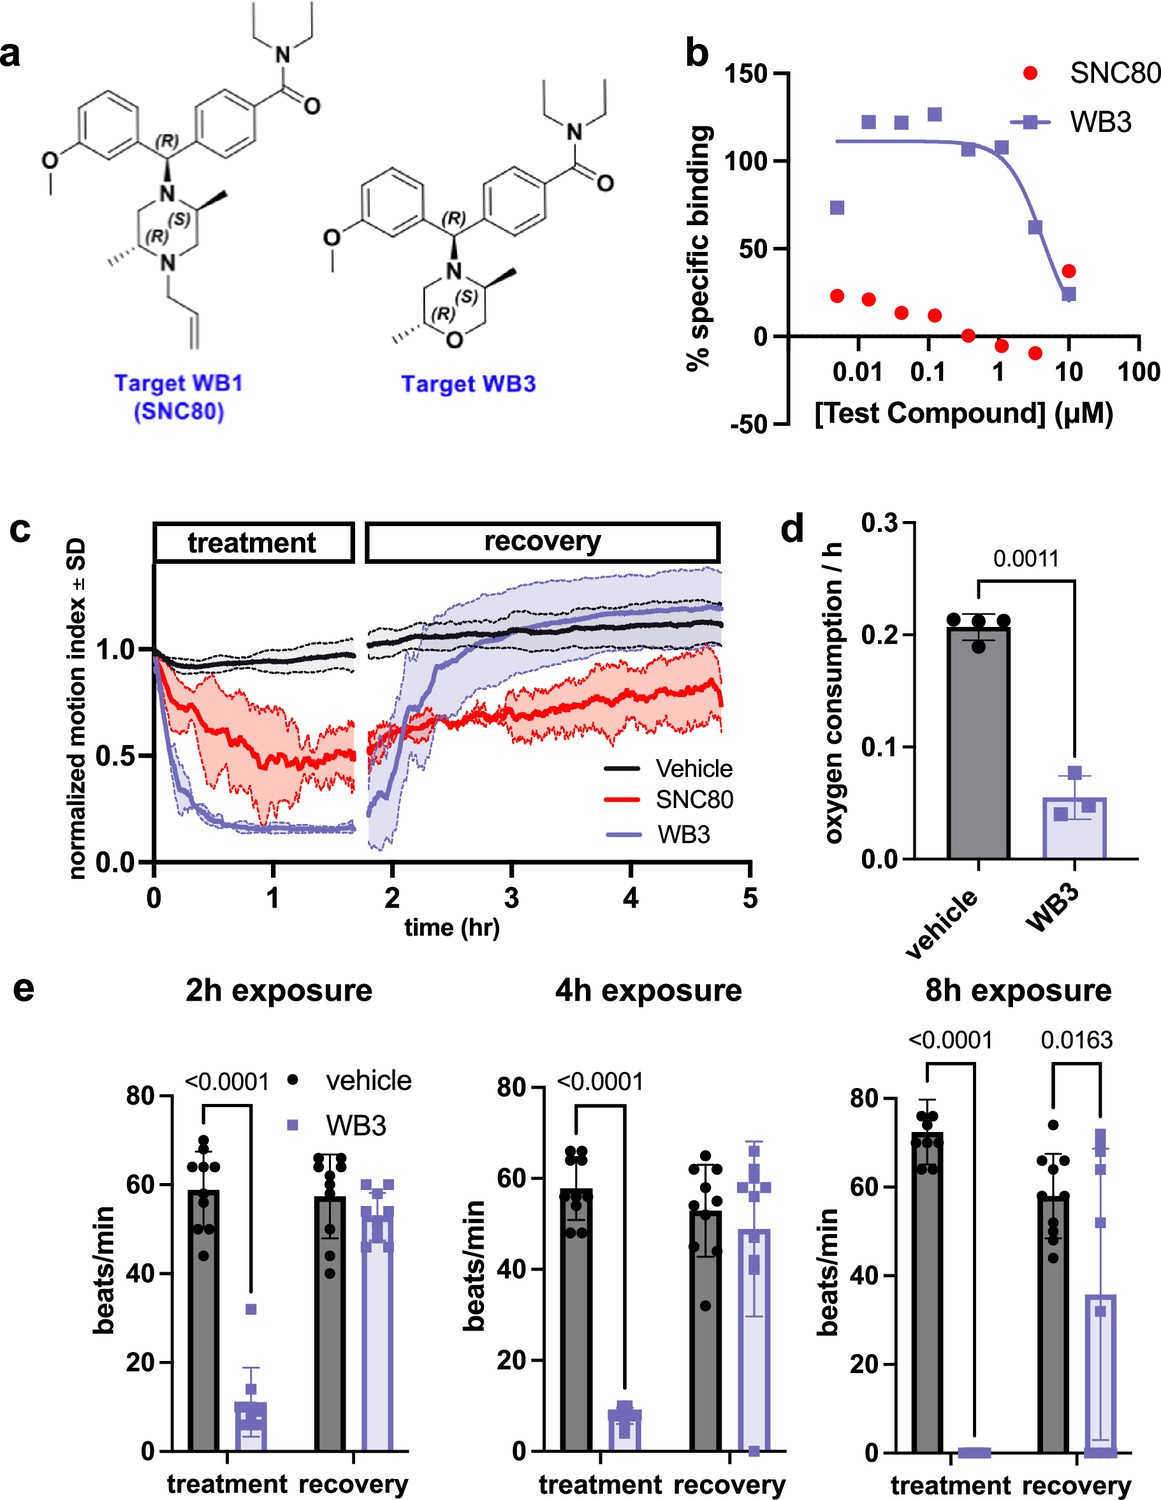
Design and in vivo screening of novel analog WB3.
(a) Molecular structures for SNC80 and novel compound WB3. (b) Percent-specific binding of the delta opioid receptor radioligand [3H]-DADLE in the presence of SNC80 and WB3. (c) Swimming activity of Xenopus during 100 μM WB3, SNC80, or vehicle treatment. Data represent the mean ± SD of n=2 replicates, with 10 tadpoles per replicate. (d) Oxygen consumption rate for Xenopus treated with WB3 or vehicle controls. N=4 vehicle and n=3 WB3, with each data point representing the cumulative oxygen consumption for 5 tadpoles. (e) Heart rate in WB3 and vehicle-treated Xenopus (n=10 tadpoles/group). Statistical comparisons were performed using Welch’s unpaired t-test (d) and a two-way ANOVA (group × timepoint) with Sidak’s correction for multiple comparisons (e). Bar plots show the mean ± SD of each group.
Figure 4 with 1 supplement
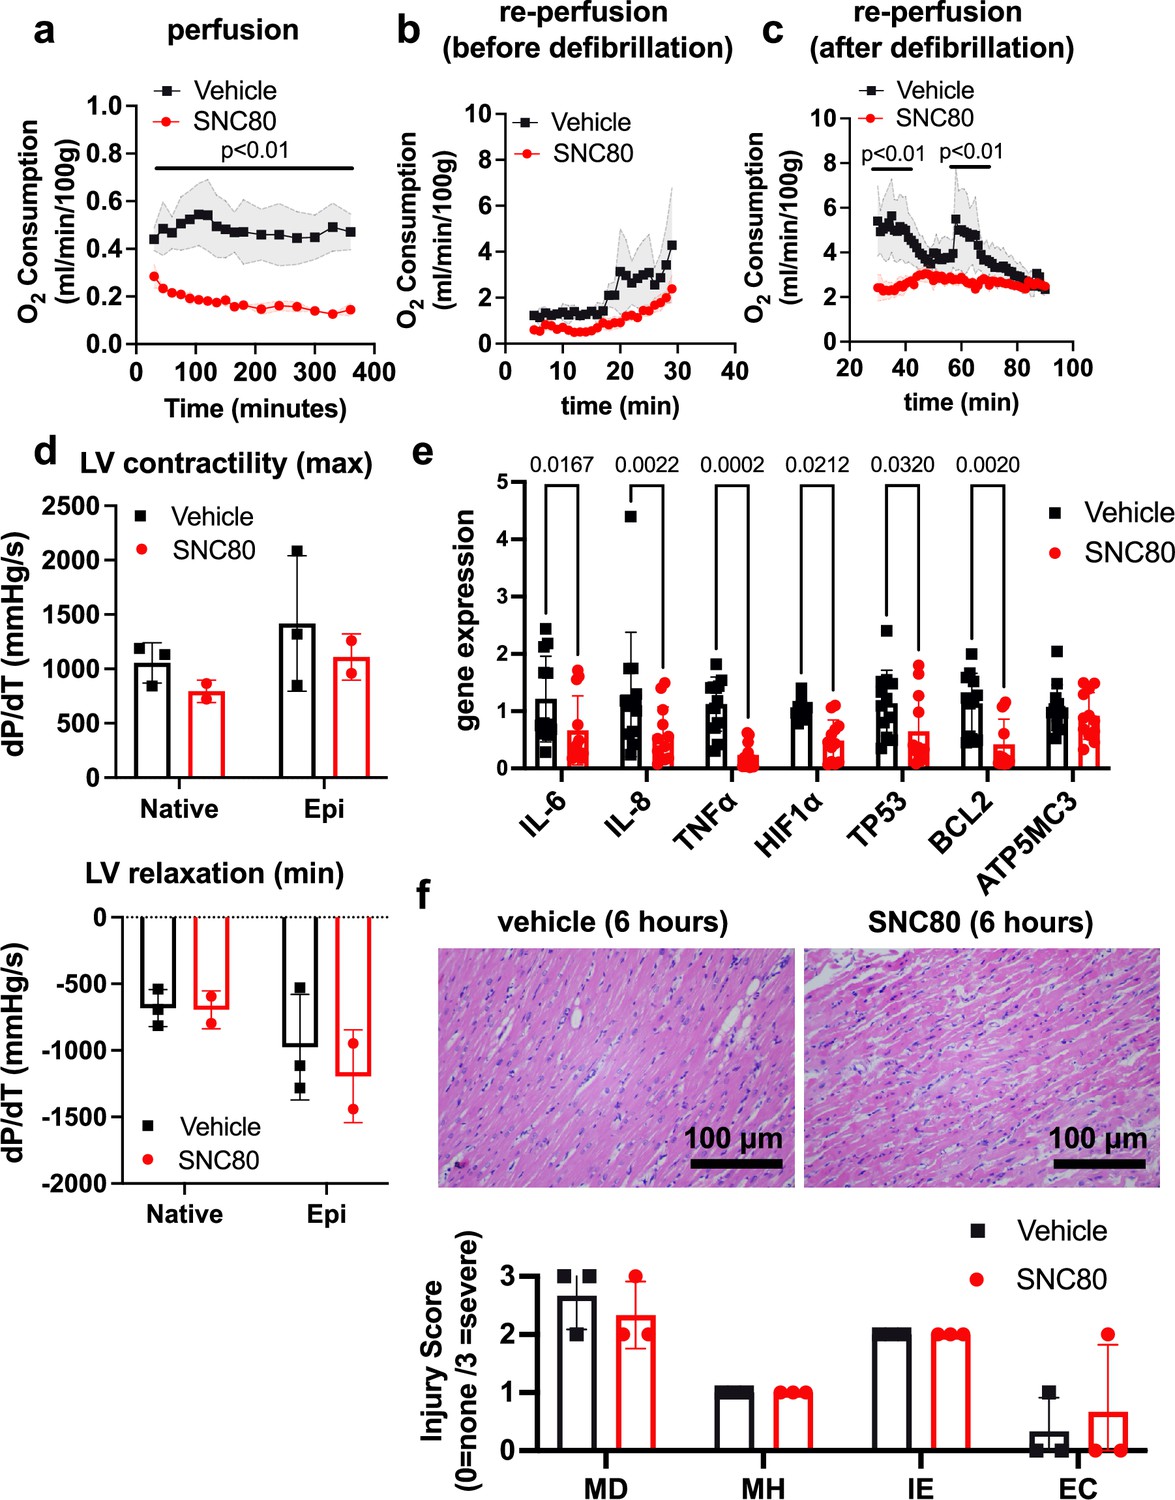
Preservation of porcine cardiac grafts with SNC80 over 6 hr.
(a) Oxygen consumption for vehicle and SNC80-treated cardiac grafts perfused in the VP.S ENCORE device (n=3 hearts/group). (b) Oxygen consumption during cardiac reperfusion on the Langendorff system before defibrillation (n=3 vehicle and n=3 SNC80 hearts). (c) Oxygen consumption measured on the Langendorff system after defibrillation (n=3 vehicle and n=3 SNC80 hearts). (d) Left ventricle (LV) contractility and relaxation before and after defibrillation and tissue exposure to epinephrine (n=3 vehicle and n=2 SNC-treated hearts). (e) Gene expression analysis of heart biopsy samples for vehicle and SNC80-treated cardiac grafts (n=2 hearts/group; 3 technical replicates each). (f) Light microscopic views of hematoxylin and eosin (H&E)-stained histological sections of heart biopsies (×20 magnification) after 6 hr of perfusion and quantification of myocardial degeneration (MD), myocardial hemorrhage (MH), interstitial edema (IE), and endothelial changes (EC). Statistical comparisons were performed using multiple unpaired t-tests between SNC80 and vehicle-treated cardiac grafts (a,b,c), two-way ANOVA with Sidak’s correction for multiple comparisons between SNC80 and vehicle-treated cardiac grafts (d,f), and unpaired t-tests between SNC80 and vehicle for each gene of interest (e). Data represent the mean ± SD.
Figure 4—figure supplement 1
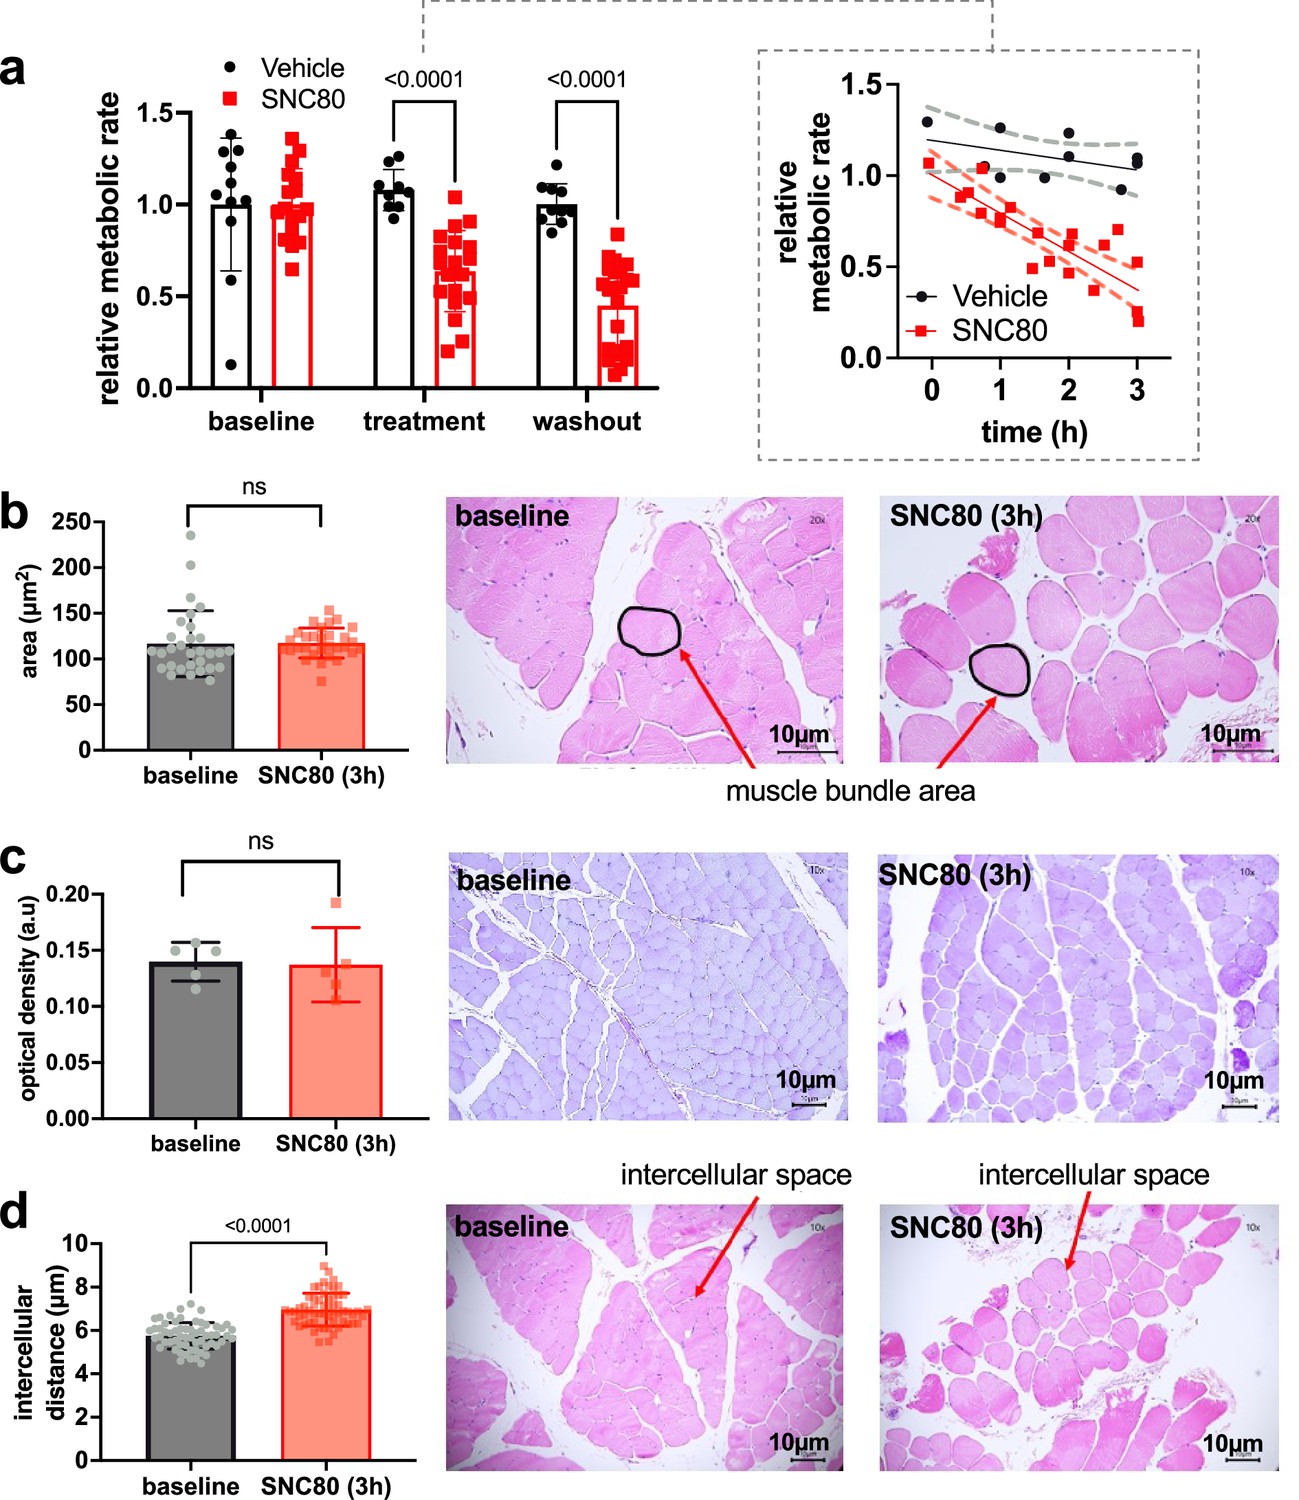
Preservation of whole porcine limbs with SNC80.
(a) The relative metabolic rate at baseline is not statistically significantly different between control (n=3) and SNC80 (n=5) injected limbs. Metabolic rate is reduced during the treatment and washout phases for SNC80 relative to controls. (b) Mean muscle bundle area between T0 before SNC80 administration and at T3 after SNC80 administration and histographs of limb biopsy (×20 magnification) at T0 before SNC80 administration and T3 after SNC80 administration. Muscle bundle area is not affected by the administration of SNC80. (c) Optical density between T0 before SNC80 administration and at T3 after SNC80 administration and histographs of limb biopsy (×20 magnification) at T0 before SNC80 administration and T3 after SNC80 administration. Optical density is not affected by the administration of SNC80. (d) Mean intracellular distance during T0 before SNC80 administration versus T3 after SNC80 administration and histographs of limb biopsy (×10 magnification) at T0 before SNC80 administration and T3 after SNC80 administration. Red arrows indicate intracellular distance measured. Intracellular distance increases after the administration of SNC80. Statistical comparisons were performed using a mixed-effects analysis with a Sidak’s test for multiple comparisons (a) and Welch’s t-test (b–d). Data represent the mean ± SD.
Figure 5 with 4 supplements
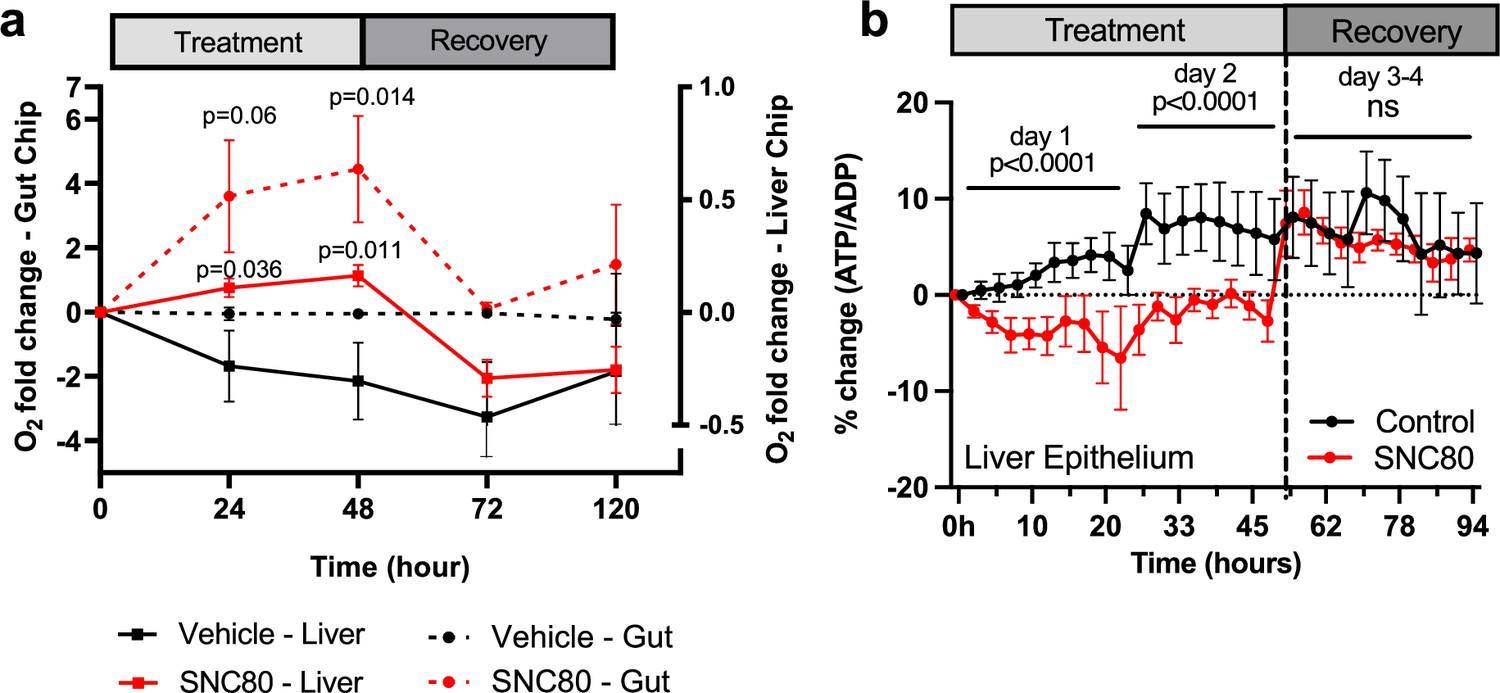
SNC80 treatment in human Organ Chips.
(a) Monitoring changes in O2 levels in human Gut (dotted lines; n=6 Chips/group) or Liver (straight lines; n=15–16 Chips/group) Chips throughout the treatment with 100 µM SNC80 (0–48 hr) and recovery (48–120 hr) versus vehicle control chip. (b) Graph showing the quantitative drop in ATP/ADP ratio of Liver Chip treated for 48 hr with 100 μM SNC80 or vehicle control as well as 2 days recovery after drug washout (n=5 control and n=3 SNC80 Chips). Statistical comparisons were performed using multiple unpaired t-tests for each timestamp with multiple comparison between control and treated cells. Data represent the mean ± SD.
Figure 5—figure supplement 1
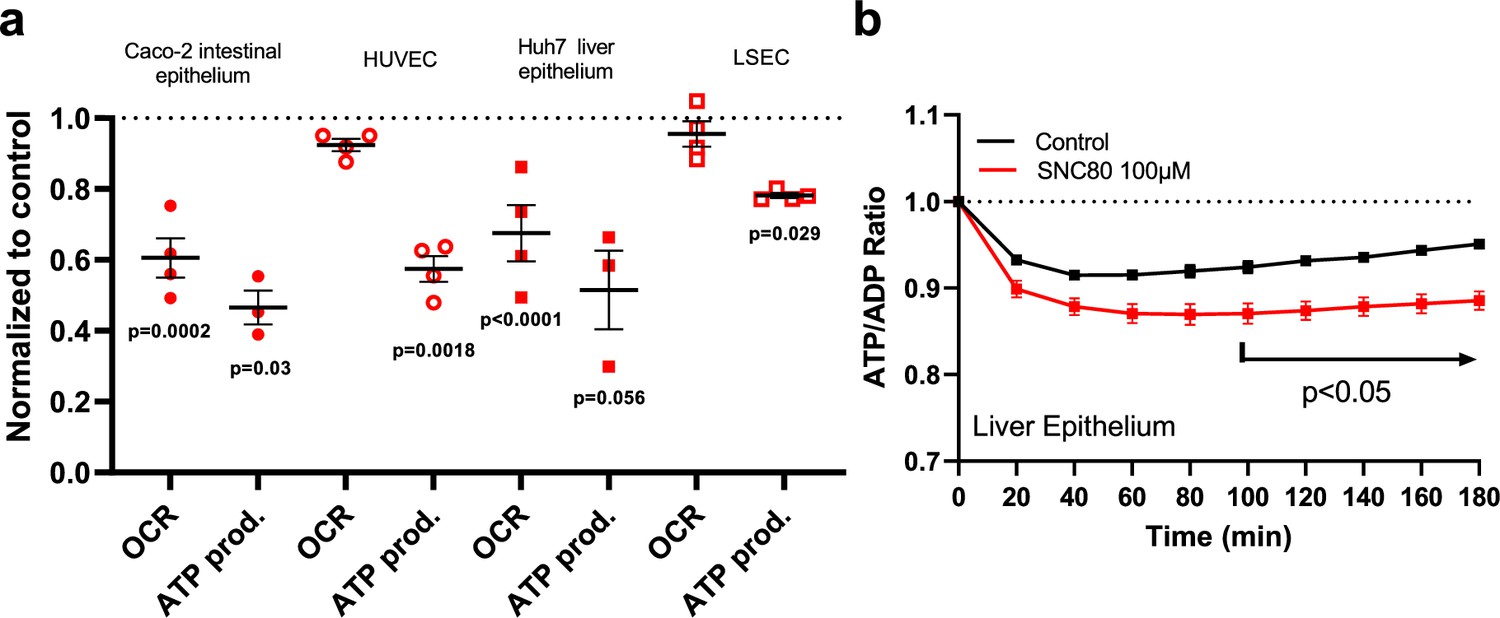
SNC80 treatment in cell culture and Organ Chip systems.
(a) Oxygen consumption rate (OCR) and mitochondrial ATP production obtained with Seahorse measurements for Caco-2 intestinal epithelium (filled circle), human umbilical vein endothelial cell (HUVEC) (empty circles), Huh7 liver epithelium (filled squares), and liver sinusoidal endothelial cell (LSEC) (empty squares) after 2 hr 100 μM SNC80 treatment (n=3–4 biological replicates/cell type). Values are normalized to their respective vehicle controls. (b) Graph showing the quantitative drop in ATP/ADP ratio of Huh7 cells treated with 100 μM SNC80 (n=2 control and n=3 SNC80 biological replicates). Statistical comparisons were performed using a two-way ANOVA with Dunnett correction with multiple comparison control versus treatment for each dataset. Data represent the mean ± SD.
Figure 5—figure supplement 2
Metabolic measurements in gut and liver cultures treated with SNC80.
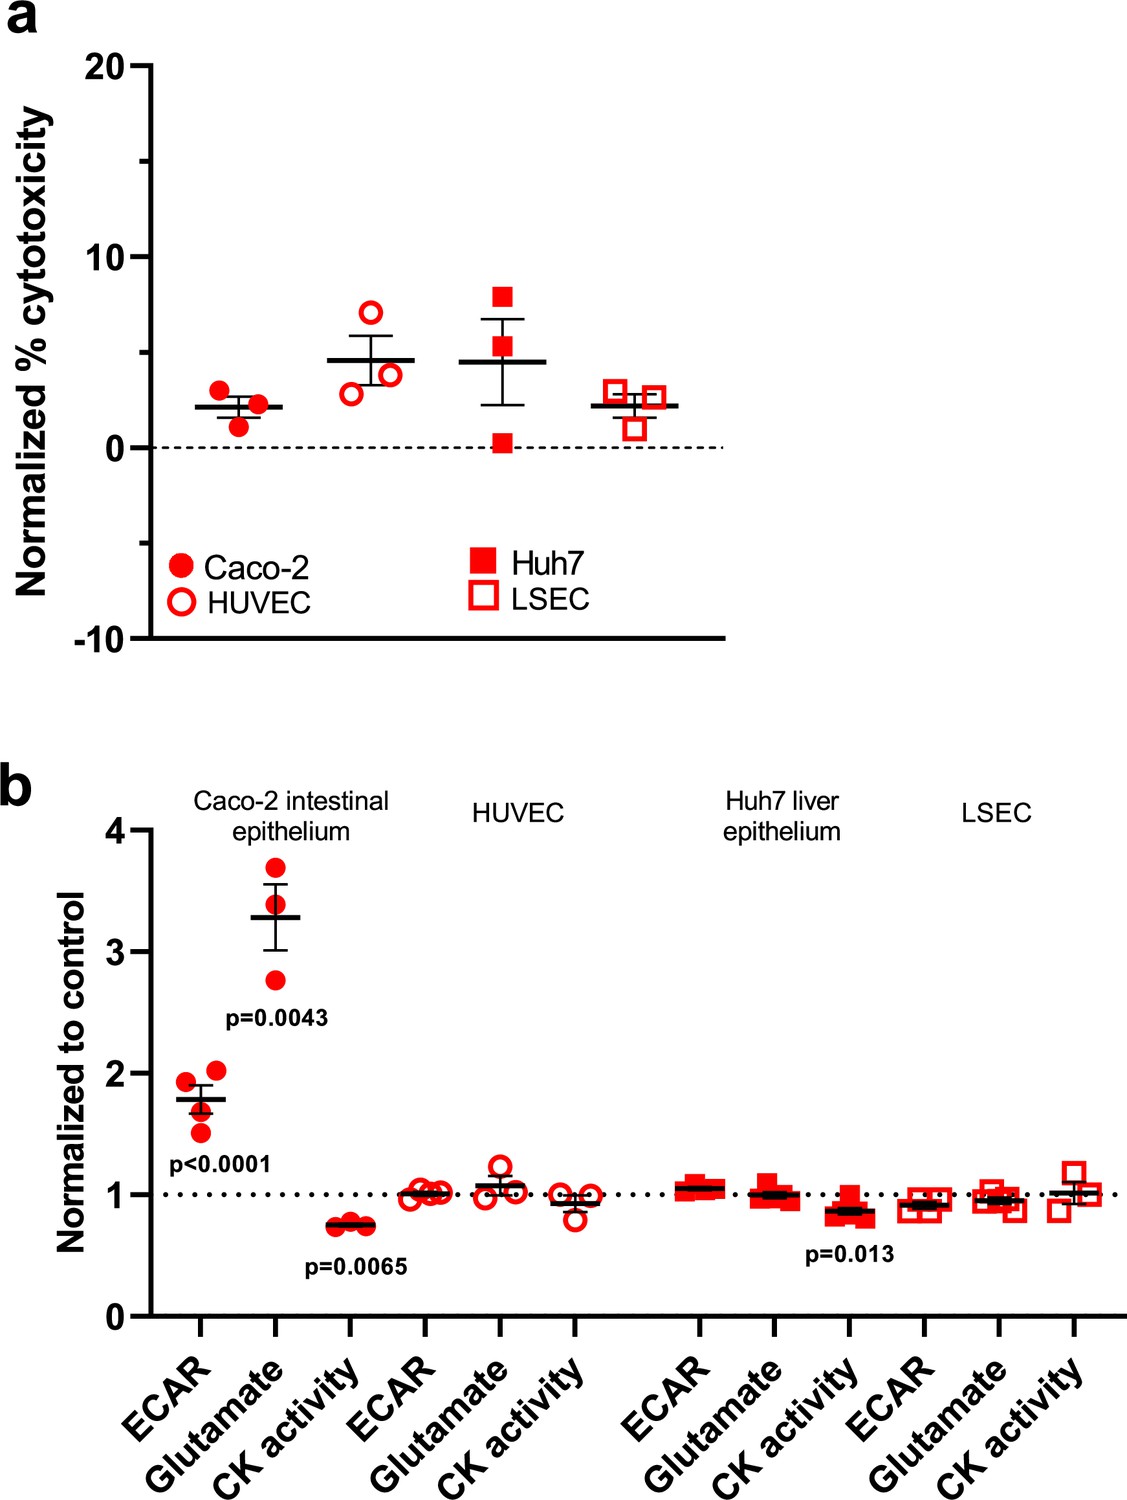
(a) Normalized percent cytotoxicity for Caco-2 intestinal epithelial cells (filled circles) or human umbilical vein endothelial cells (HUVECs) (empty circles) as well as Huh7 liver epithelium (filled squares) or liver sinusoidal endothelial cells (LSECs) (empty squares) after 2 hr of exposure to 100 μM SNC80 (n=3 biological replicates/cell type). (b) Normalized extracellular acidification rate (ECAR), glutamate, and creatine kinase (CK) activity for Caco-2 intestinal epithelial cells (filled circles) and HUVECs (empty circles) as well as Huh7 liver epithelium (filled squares) and LSECs (empty squares) (n=3–6 biological replicates/measurement/cell type). Statistical comparisons were performed using a two-way ANOVA with Dunnett correction with multiple comparison control versus treatment for each dataset (a,b). Data represent the mean ± SD.
Figure 5—figure supplement 3
Characterization of human Gut and Liver Chips with integrated sensing technology.
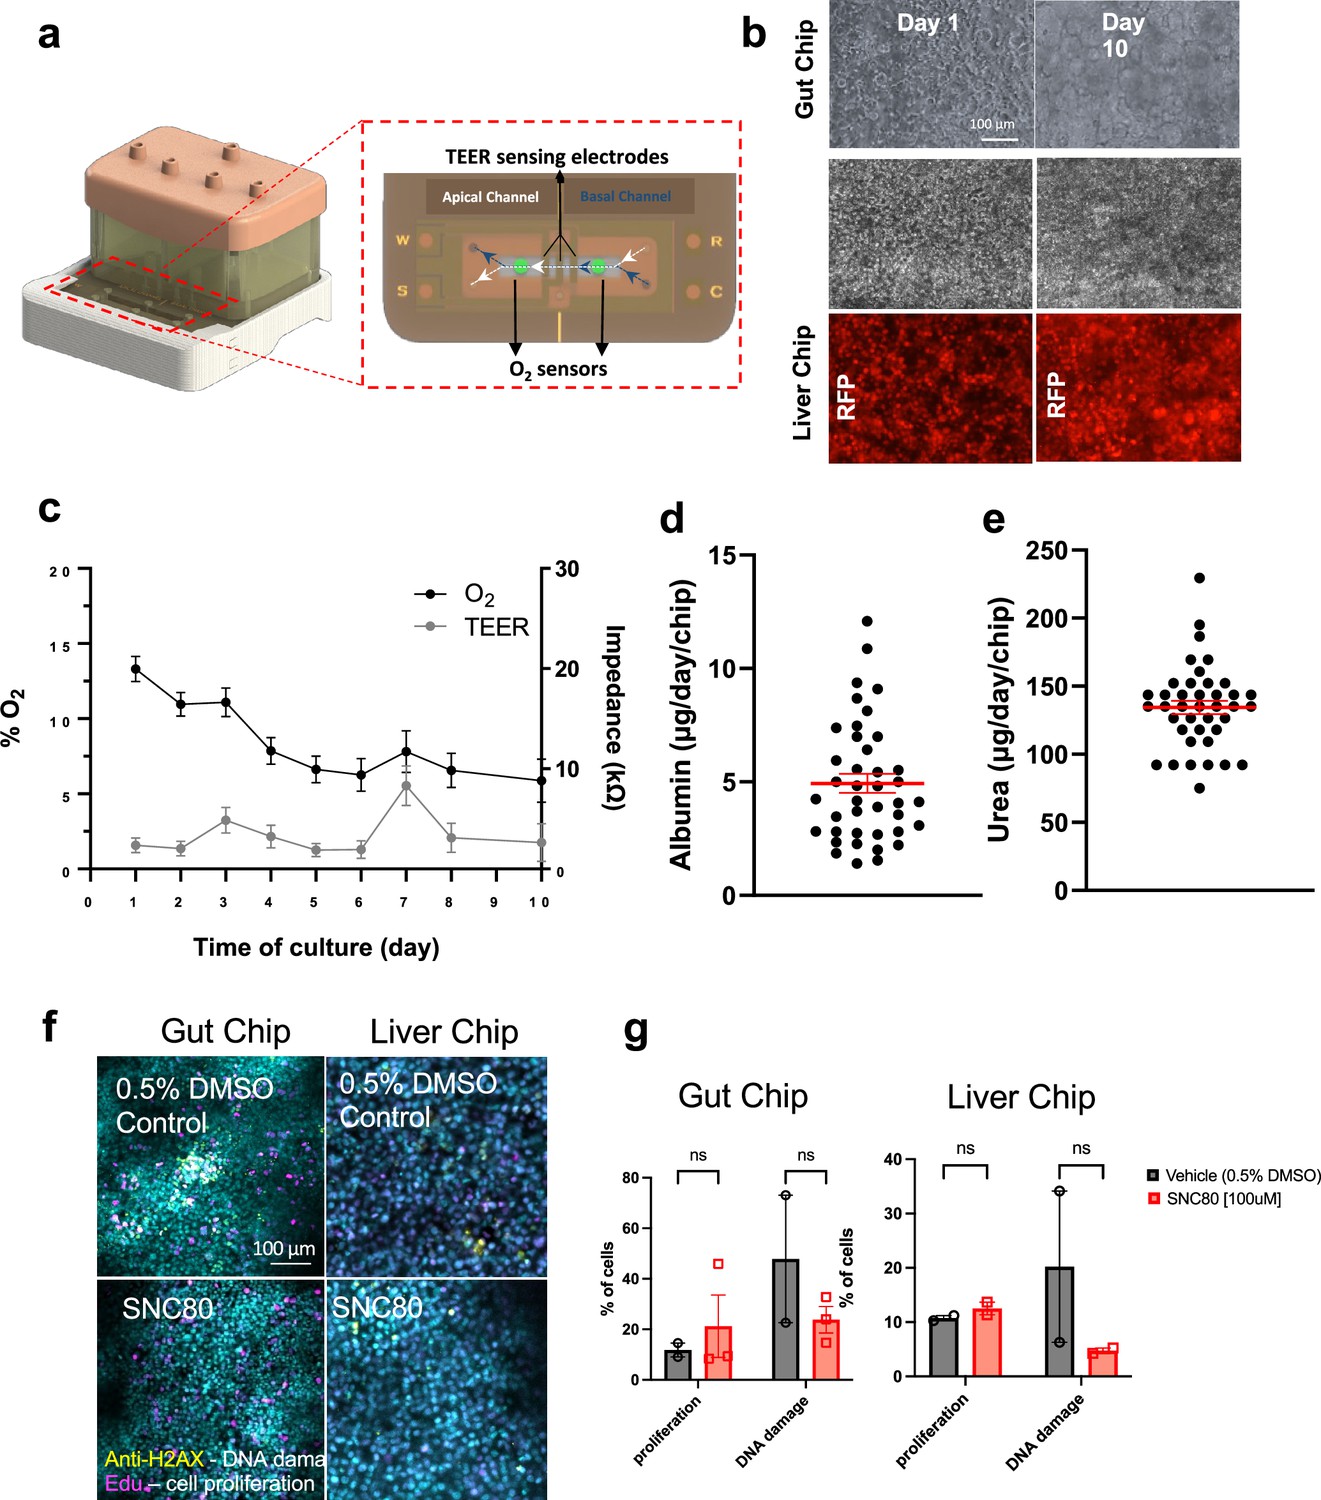
(a) Illustration of the sensor-integrated OOC unit connected to reservoir pod for automatic operation of fluid flow using pneumatic pressure (left). Inset shows a schematic of the top and bottom views of the sensor-chip-PCB compartment showing locations of transepithelial electrical resistance (TEER) electrodes and O2 sensors in the apical and basal channels. Four O2 sensing spots were added to the channels – two in the top and two in the bottom channels for across the chip measurement. Electrode connectors are necessary for remote TEER sensing. (b) Phase contrast images of Caco-2 cells seeded on sensor chip at days 1 and 10 of culture (top) and Huh7 cells seeded on sensor chip at days 1 and 10 (middle). Fluorescent images of Liver Chip at days 1 and 10 of the transduced nuclear marker (bottom). (c) Percentage of O2 level (black; n=16 Chips) and TEER impedance values (gray; n=9 Chips) on sensor Liver Chip during 10 days of culture. (d) Average albumin production of Liver Chips at day of experiment starts (days 7–10 of culture; n=40 Chips). (e) Average urea production of Liver Chips at day of experiment starts (days 7–10 of culture; n=40 Chips). (f) Representative immunofluorescence images of the sensor Gut Chip (left) and Liver Chip (right) epithelium stained with DNA damage marker (H2AX) and nuclei (DAPI) for vehicle control and SNC80-treated tissues after 7 days’ recovery. (g) Quantitative analysis of proliferation and DNA damage stains on Gut and Liver Chips after 48 hr of treatment and 7-day recovery to 100 μM SNC80 (2–3 biological replicates/group/marker; each data point corresponds to an average of multiple fields of view). Statistical comparisons were performed using multiple unpaired t-tests for each marker with FDR correction. Data represent the mean ± SD.
Figure 5—figure supplement 4
Metabolic measurements of Gut and Liver Chip systems treated with SNC80.
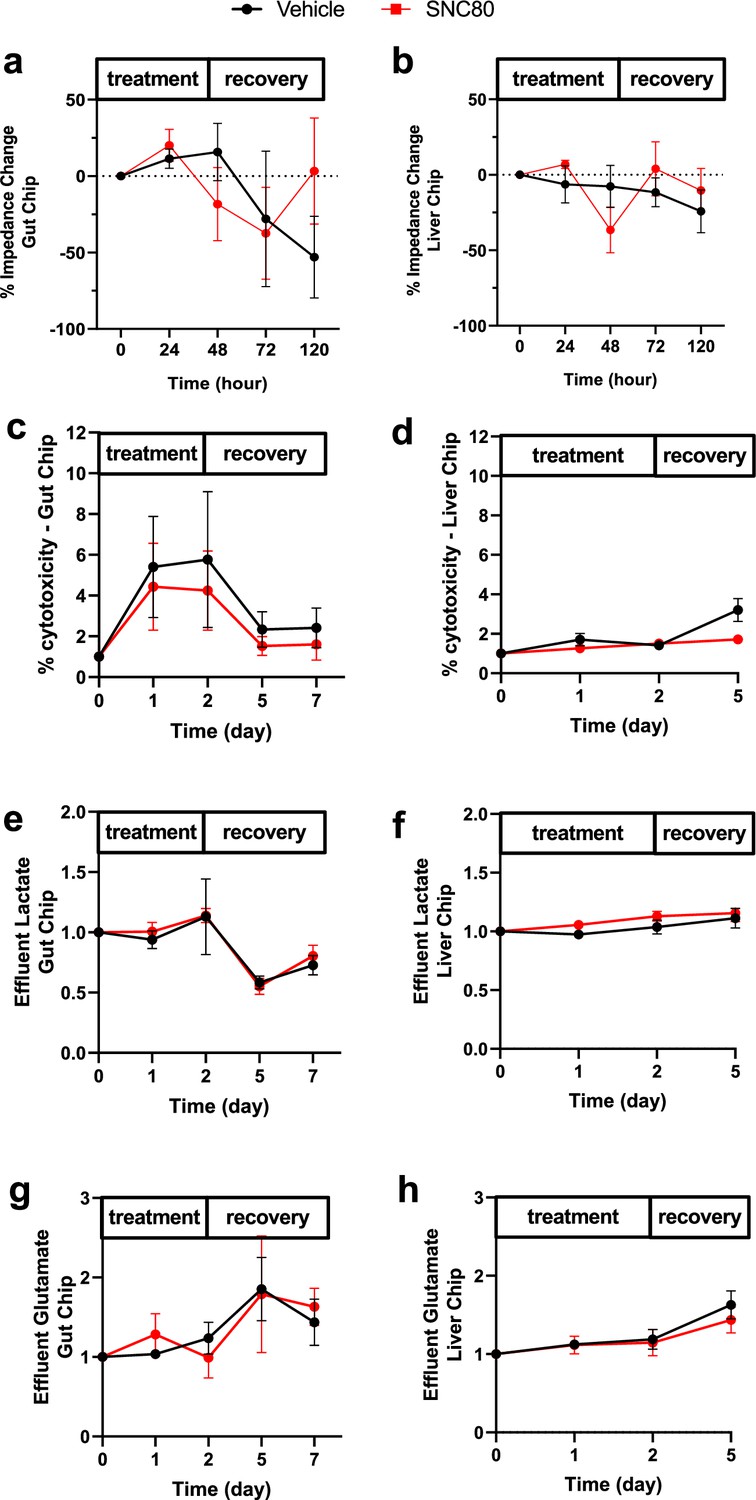
(a) Monitoring the percentage change in barrier function of Gut (n=6 Chips/group) or (b) Liver Chip (n=9 Chips/group) with time during treatment with 100 µM SNC80 (0–48 hr) and recovery (48–120 hr) versus vehicle control chip. (c) Cytotoxicity measured for the Gut (n=5-6 Chips/group) and (d) Liver Chips (n=7 Chips/group) during treatment and recovery. (e) Graph depicting the amount of lactate measured in effluents of Gut (n=5-6 Chips/group) and (f) Liver Chips (n=7 Chips/group), relative to baseline levels (to day 7 for Gut and day 5 for Liver) for SNC80-treated (red) or vehicle control (black) Chips. (g) Graph showing the glutamate measured in effluents of Gut (n=5 Chips/group) or (h) Liver Chips (n=7 Chips/group) during SNC80 (red) or vehicle (black) treatment and post-recovery (day 7), relative to baseline levels. For each measurement, statistical comparisons were performed using multiple unpaired t-tests at each timepoint and FDR correction for multiple comparisons. Data represent the mean ± SD.
Author response image 1

Tables
Table 1
SNC80 protein binding targets identified by thermal proteome profiling.
| Direct interaction | Function | Indirect interaction | Function |
|---|---|---|---|
| CCBL1 | Pyridoxal phosphate binding Cysteine-S-conjugate beta-lyase activity L-Glutamine aminotransferase activity Cellular modified amino acid metabolic process | ABCB1 | ABC-type bile acid transporter activity Regulation of fatty acid beta-oxidation Efflux transmembrane transporter activity |
| EAAT1 | L-Glutamate transmembrane transporter activity | ACOX3 | Fatty acid beta-oxidation using acyl-CoA oxidase Fatty acid binding |
| FUCA2 | Alpha-L-fucosidase activity Glycoside catabolic process | CAMSAP2 | Cytoplasmic microtubule organization Calmodulin binding |
| HM13 | Peptidase activity Aspartic endopeptidase activity | COX6C | Mitochondrial electron transport, cytochrome c to oxygen Generation of precursor metabolites and energy |
| PTX3 | Negative regulation of glycoprotein metabolic process Complement component C1q complex binding | ITGA7 | Integrin-mediated signaling pathway Cell adhesion mediated by integrin |
| RPE65 | Phosphatidylserine binding Retinoid metabolic process | NCX1 | Calcium:sodium antiporter activity Calcium ion binding Regulation of the force of heart contraction |
| RPL27A | Structural constituent of ribosome Cytoplasmic translation | ROBO1 | Roundabout signaling pathway Aorta development |
| RPL4 | Structural constituent of ribosome Cytoplasmic translation | RRP9 | RNA binding rRNA processing |
| RPS25 | Structural constituent of ribosome Cytoplasmic translation | ||
| TOMM40 | Protein transmembrane transporter activity Protein targeting to mitochondrion Mitochondrial outer membrane translocase complex | ||
| VMP1 | Autophagosome membrane docking Plasma membrane phospholipid scrambling Lipoprotein transport |
Additional files
-
Supplementary file 1
Clinical interpretation of electrocardiogram (ECG) in SNC80 and vehicle-treated hearts.
- https://cdn.elifesciences.org/articles/93796/elife-93796-supp1-v1.xlsx
-
Supplementary file 2
Compound synthesis description.
- https://cdn.elifesciences.org/articles/93796/elife-93796-supp2-v1.docx
-
MDAR checklist
- https://cdn.elifesciences.org/articles/93796/elife-93796-mdarchecklist1-v1.pdf
Download links
A two-part list of links to download the article, or parts of the article, in various formats.
Downloads (link to download the article as PDF)
Open citations (links to open the citations from this article in various online reference manager services)
Cite this article (links to download the citations from this article in formats compatible with various reference manager tools)
Identification of pharmacological inducers of a reversible hypometabolic state for whole organ preservation
eLife 13:RP93796.
https://doi.org/10.7554/eLife.93796.3


