Heparan sulfate-dependent phase separation of CCL5 and its chemotactic activity
- State Key Laboratory of Chemical Resource Engineering, College of Life Science and Technology, Beijing University of Chemical Technology, China
- Institute of Medical Science, China-Japan Friendship Hospital, China
- Greater Bay Biomedical InnoCenter, Shenzhen Bay Laboratory, China
- Beijing Advanced Innovation Centre for Soft Matter Science and Engineering, Beijing University of Chemical Technology, China
- Department of Medical Biochemistry and Microbiology, University of Uppsala, Sweden
Figures
Figure 1 with 3 supplements
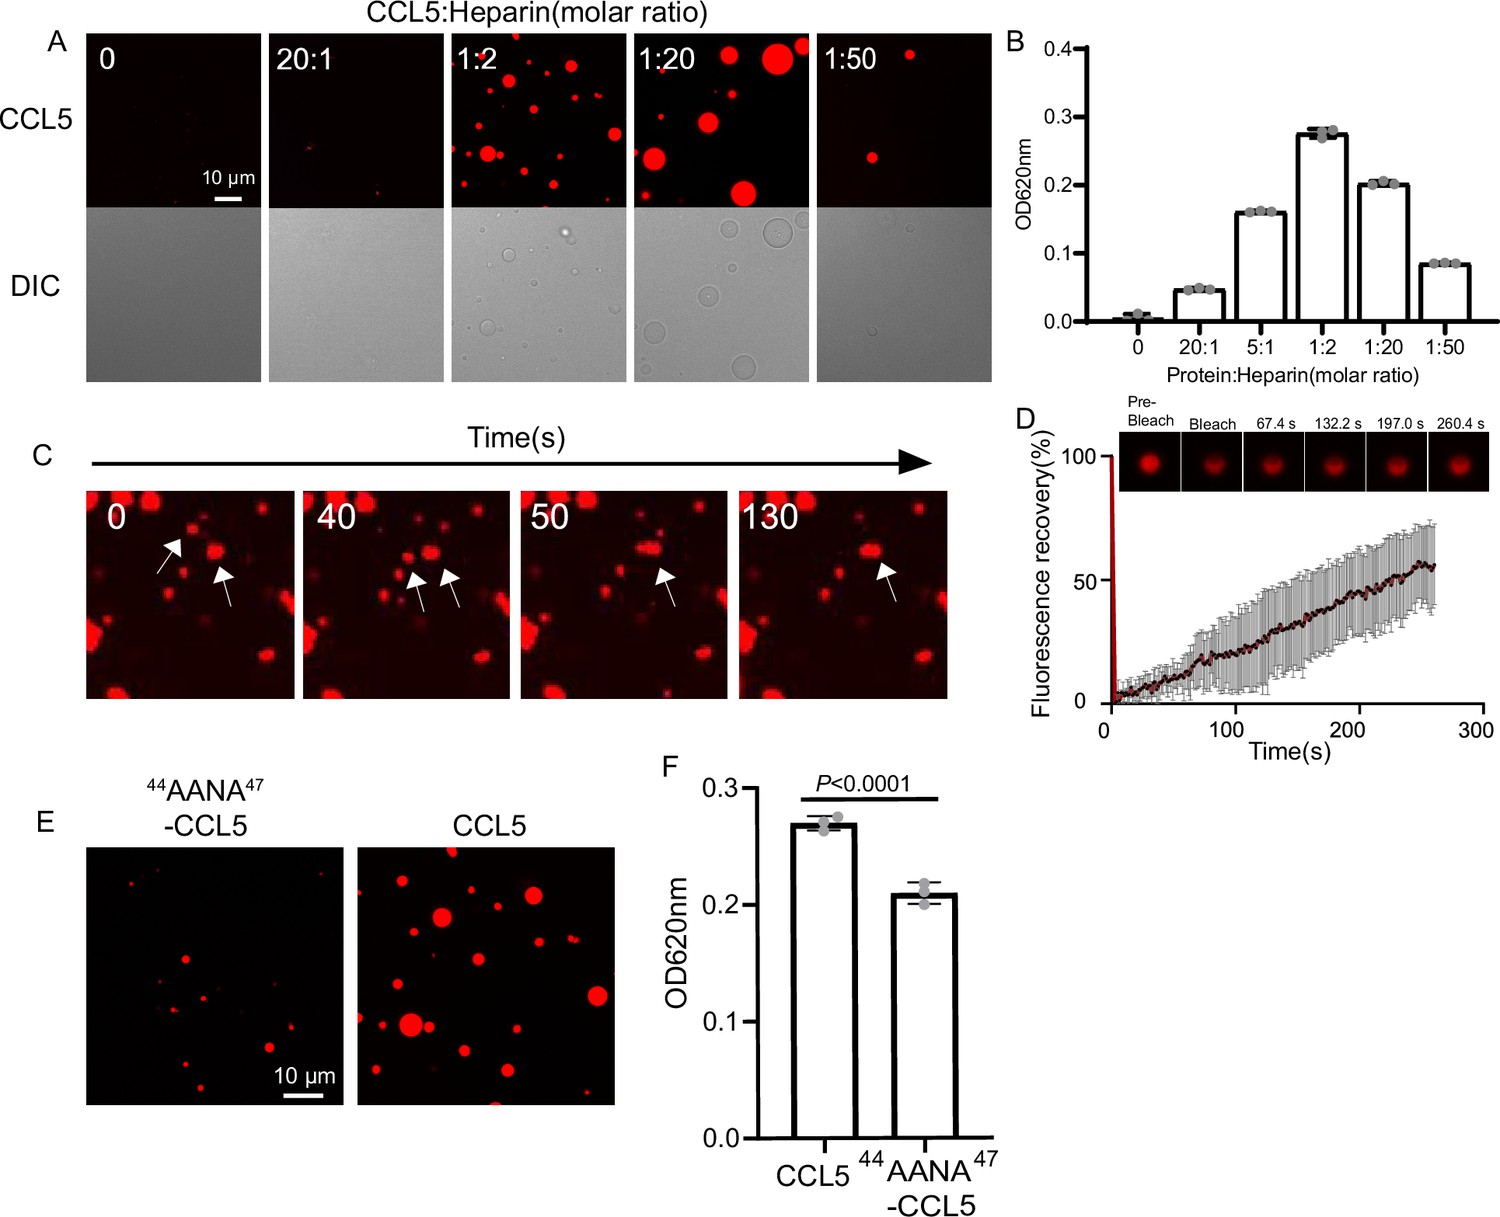
CCL5 phase separates with heparin in solution.
(A) Confocal images of assembling status of 20 μM CCL5-Cy3 mixed with heparin at different ratios and 5% PEG (Polyethylene Glycol). Scale bar = 10 μm. (B) Turbidity changes with increase of heparin concentration were measured at 620 nm. (C) Fusion of phase-separated droplets formed at the ratio of CCL5-Cy3:heparin = 1:2. The white arrows indicate the dynamic fusion of two adjacent droplets. (D) Representative fluorescence recovery after photobleaching (FRAP) results of droplets formed by CCL5-Cy3:heparin = 1:2 depicted in A, showing the intensity of fluorescence pre- and after photobleachin. The images of representative droplets in different recovery stages are shown. (E) Confocal images of assembling status of 44AANA47-CCL5 or CCL5 in the presence of heparin. Scale bar = 10 μm. (F) Comparison of CCL5 and 44AANA47-CCL5 turbidity in the presence of heparin. Data are mean ± standard deviation (s.d.). n = 3 (for B, F). Normal distribution was assessed by the Shapiro–Wilk (SW) normality test. p values were determined by unpaired two-tailed t-tests.
-
Figure 1—source data 1
Excel file containing the results of turbidity and descriptive statistics in Figure 1B.
- https://cdn.elifesciences.org/articles/93871/elife-93871-fig1-data1-v1.zip
-
Figure 1—source data 2
Excel file containing relative fluorescent value in Figure 1D.
- https://cdn.elifesciences.org/articles/93871/elife-93871-fig1-data2-v1.zip
-
Figure 1—source data 3
Excel file containing the results of turbidity and descriptive statistics in Figure 1F.
- https://cdn.elifesciences.org/articles/93871/elife-93871-fig1-data3-v1.zip
Figure 1—figure supplement 1

Protein expression and purification.
Sodium dodecyl sulfate–polyacrylamide gel electrophoresis (SDS–PAGE) showed the molecular weight and purity of CCL5 (A) and CCL5-EGFP (B).
-
Figure 1—figure supplement 1—source data 1
Original file for the sodium dodecyl sulfate–polyacrylamide gel electrophoresis (SDS–PAGE) in Figure 1—figure supplement 1A.
- https://cdn.elifesciences.org/articles/93871/elife-93871-fig1-figsupp1-data1-v1.zip
-
Figure 1—figure supplement 1—source data 2
Image containing Figure 1—figure supplement 1A and original scans of the sodium dodecyl sulfate–polyacrylamide gel electrophoresis (SDS–PAGE) with sample labels.
- https://cdn.elifesciences.org/articles/93871/elife-93871-fig1-figsupp1-data2-v1.zip
-
Figure 1—figure supplement 1—source data 3
Original file for the sodium dodecyl sulfate–polyacrylamide gel electrophoresis (SDS–PAGE) in Figure 1—figure supplement 1B.
- https://cdn.elifesciences.org/articles/93871/elife-93871-fig1-figsupp1-data3-v1.zip
-
Figure 1—figure supplement 1—source data 4
Image containing Figure 1—figure supplement 1B and original scans of the sodium dodecyl sulfate–polyacrylamide gel electrophoresis (SDS–PAGE) with sample labels.
- https://cdn.elifesciences.org/articles/93871/elife-93871-fig1-figsupp1-data4-v1.zip
Figure 1—figure supplement 2
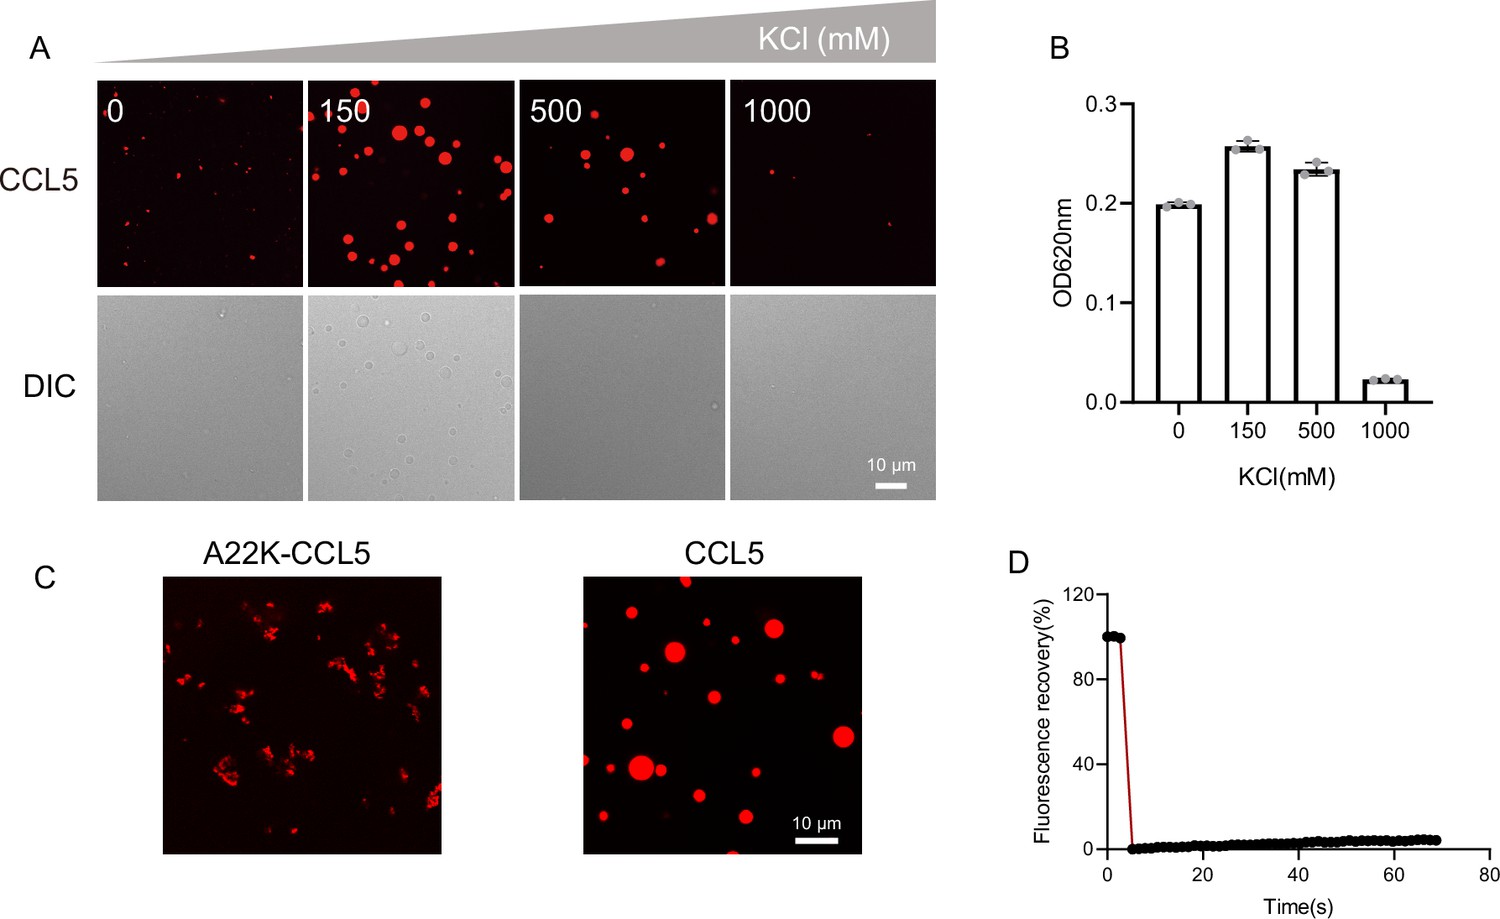
The effect of salt concentration on phase separation.
(A) Confocal images of assembling status of 20 μM CCL5-Cy3 mixed with heparin with increasing salt concentration. Scale bar = 10 μm. (B) Turbidity changes with different increasing salt concentrations. (C) Confocal images of assembling status of A22K-CCL5 or CCL5 in the presence of heparin. Scale bar = 10 μm. (D) Fluorescence recovery after photobleaching (FRAP) of the aggregates formed by A22K-CCL5-Cy3, showing the intensity of fluorescence pre- and after photobleaching.
Figure 1—figure supplement 3
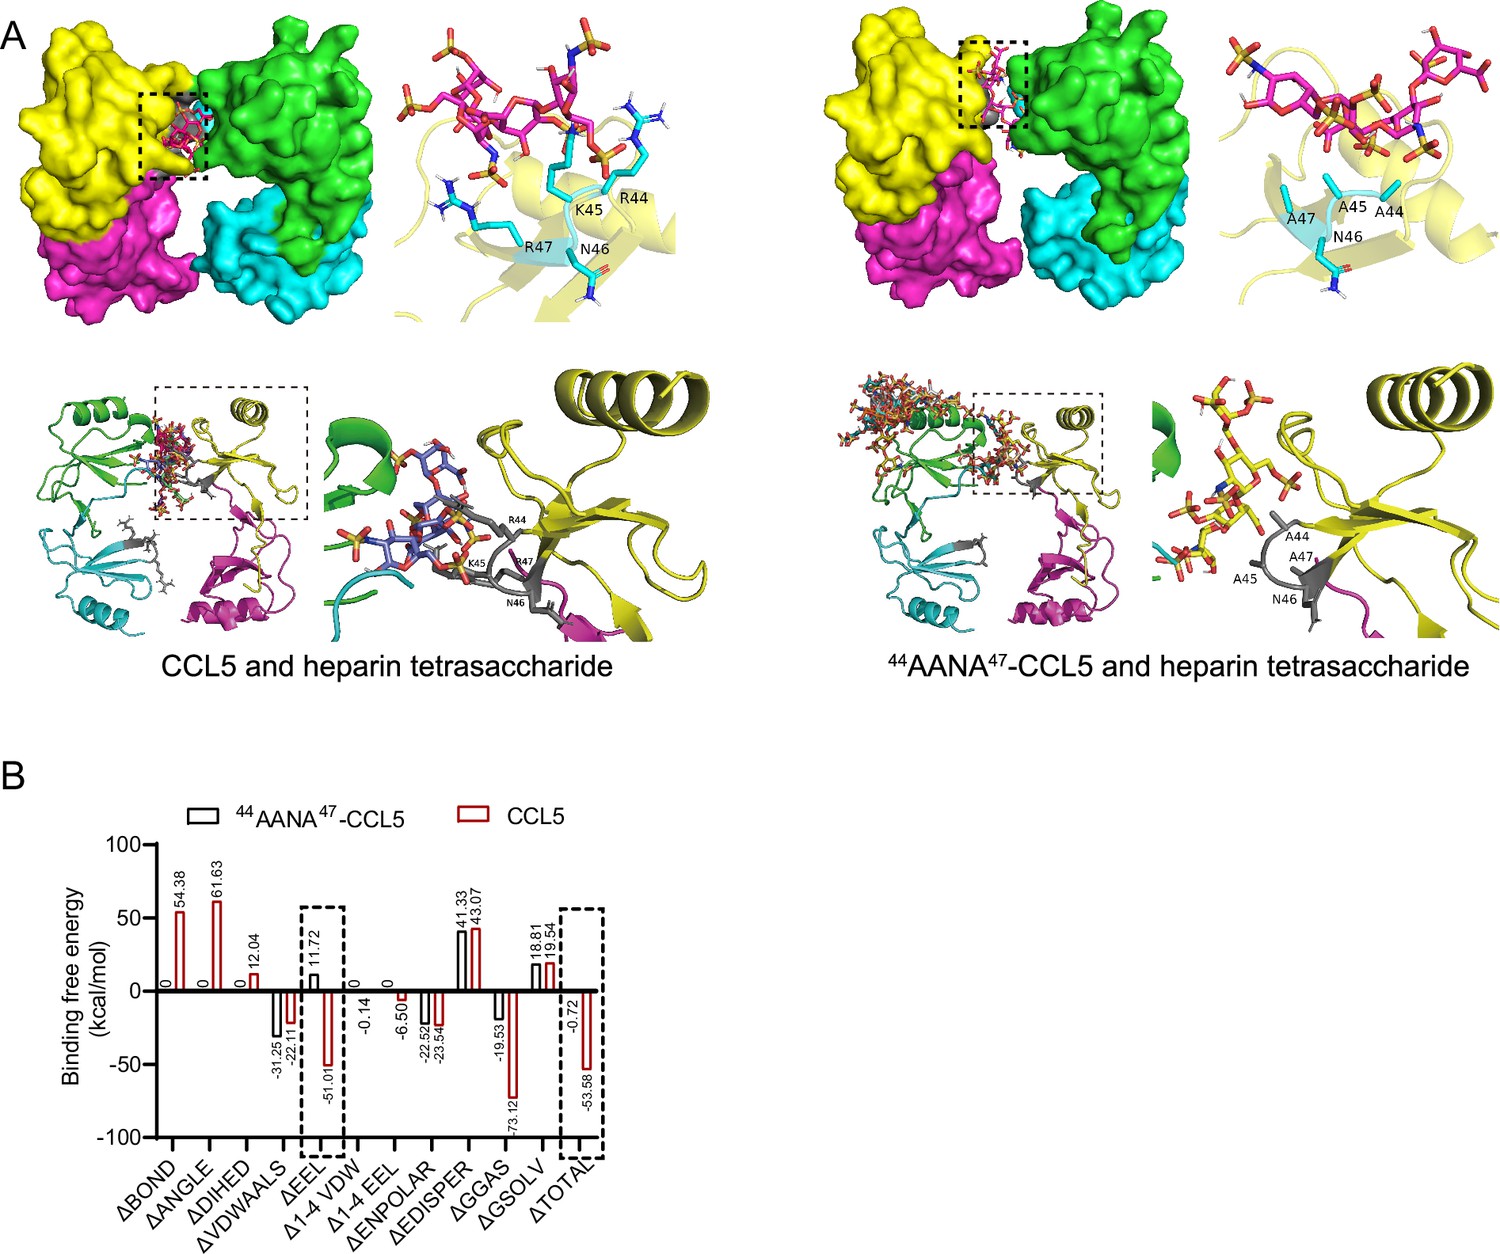
Comparison of binding of CCL5 and 44AANA47-CCL5 to heparin tetrasaccharide.
(A) Binding mode of heparin tetrasaccharide to 44AANA47-CCL5 or CCL5 shown by molecular docking. On the right are the details framed by the dotted line. (B) Comparison of binding free energy of different interacting forces between CCL5/44AANA47-CCL5 and heparin tetrasaccharide. The mutation led to change in electrostatic interaction forces.
Figure 2 with 2 supplements
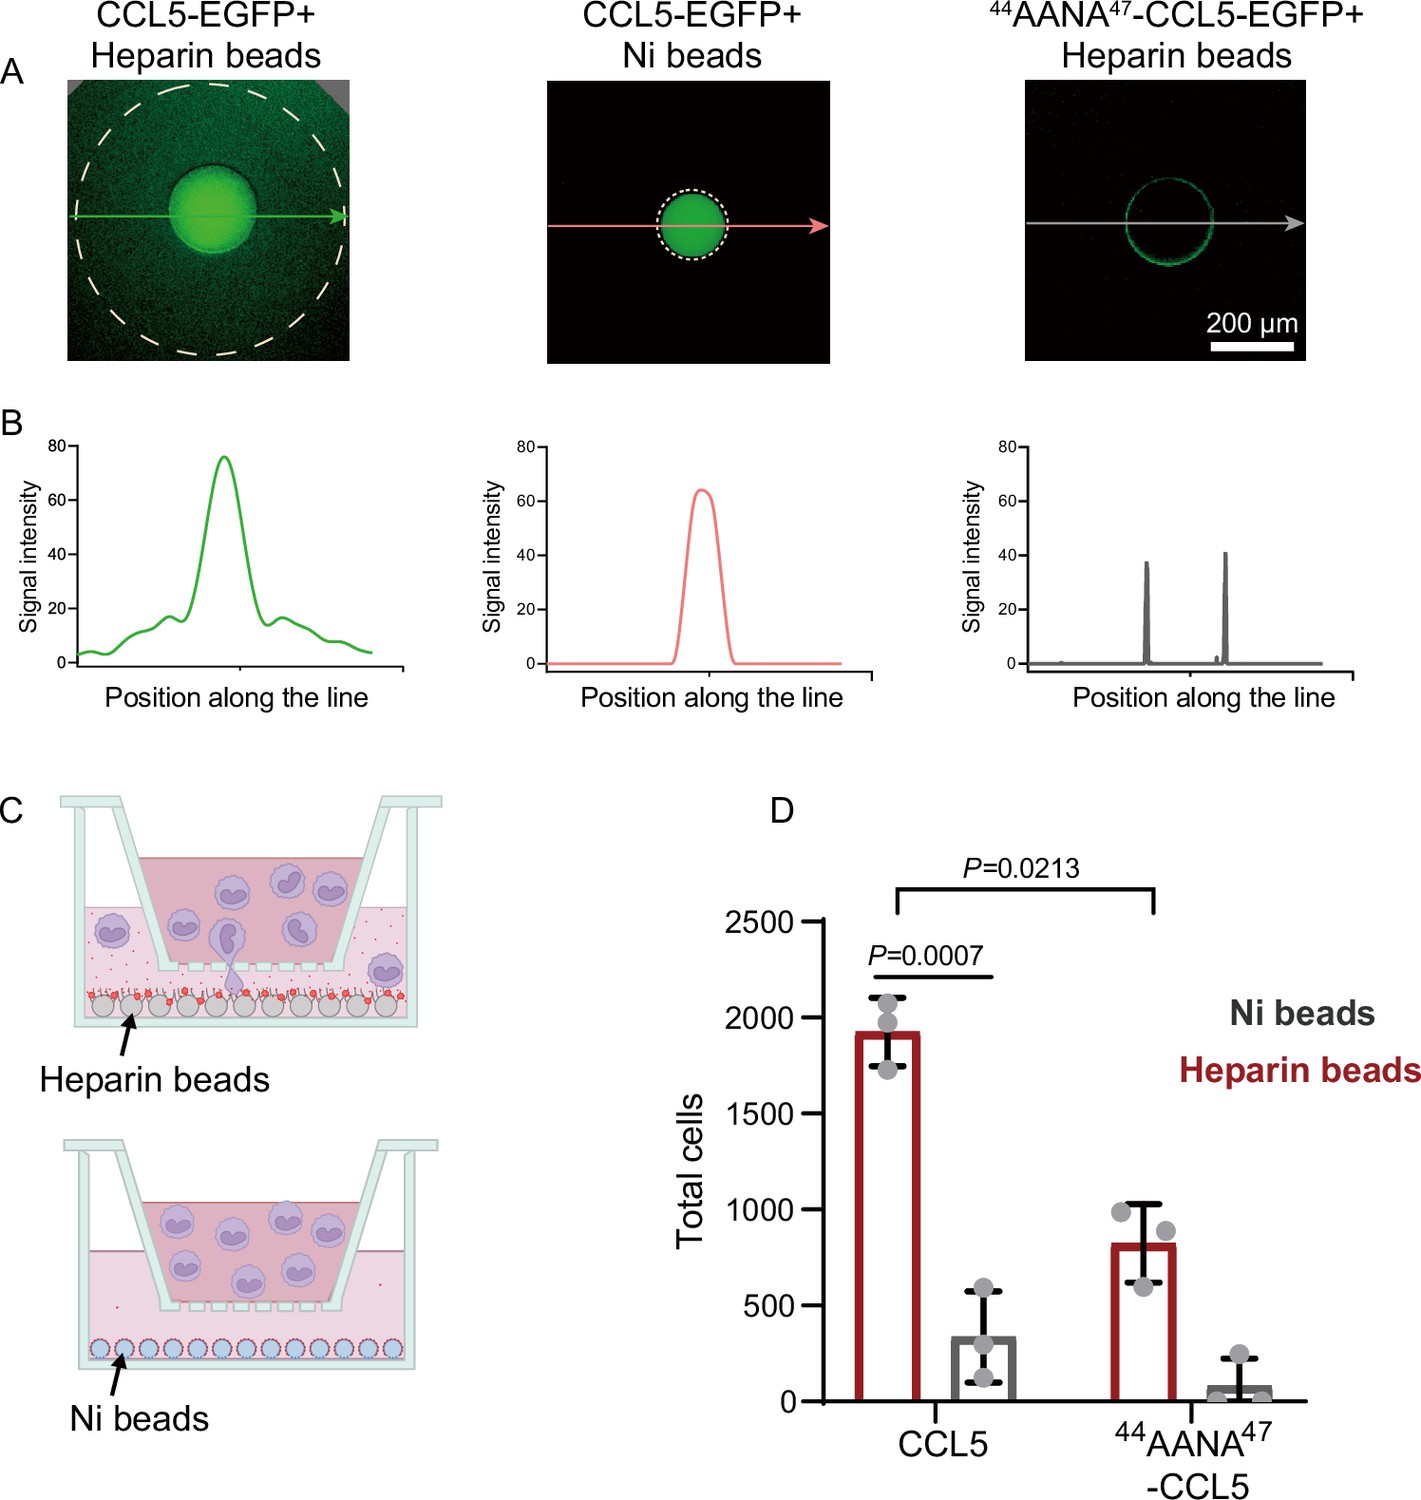
Co-phase separation of CCL5 and heparin establishes chemokine gradient.
(A) CCL5-EGFP or 44AANA47-CCL5-EGFP were bound to heparin-beads or Ni-NTA beads, respectively, and were placed in Matrigel in 96-well plate. After incubation for 12 hr images were taken to quantify the fluorescence intensity. (B) Quantification of the fluorescence signals along the lines with arrows indicated in A. (C) Illustration of in vitro chemotaxis assay. (D) Heparin-beads or Ni-NTA beads bound with CCL5 or 44AANA47-CCL5 were placed in the lower chamber. THP-1 cells (3 × 10⁵ cells) were added to upper chamber. After 4 hr, THP-1 in the lower chamber was collected and counte. Data are mean ± standard deviation (s.d.). n = 3. Normal distribution was assessed by the Shapiro–Wilk (SW) normality test. p values were determined by unpaired two-tailed t-tests.
-
Figure 2—source data 1
Excel file containing output results of gray value in Figure 2B.
- https://cdn.elifesciences.org/articles/93871/elife-93871-fig2-data1-v1.zip
-
Figure 2—source data 2
Excel file containing the results of cell counting and descriptive statistics in Figure 2D.
- https://cdn.elifesciences.org/articles/93871/elife-93871-fig2-data2-v1.zip
Figure 2—figure supplement 1

Chemotactic function of CCL5-EGFP.
Labeled CCL5 has similar activity as CCL5, 50 nM CCL5, CCL5-EGFP, or CCL5-Cy3 were added to the lower chamber of the Transwell. THP-1 cells were added to upper chambers. Data are mean ± standard deviation (s.d.). n = 3. p values were determined by unpaired two-tailed t-tests. NS, not significant.
Figure 2—figure supplement 2

Diffusion of the CCL5-Cy3 in heparin-beads or Ni-NTA beads.
Beads bound with CCL5-Cy3 placed in Matrigel were imaged and reconstructed by Leica DMi8.
Figure 3 with 1 supplement
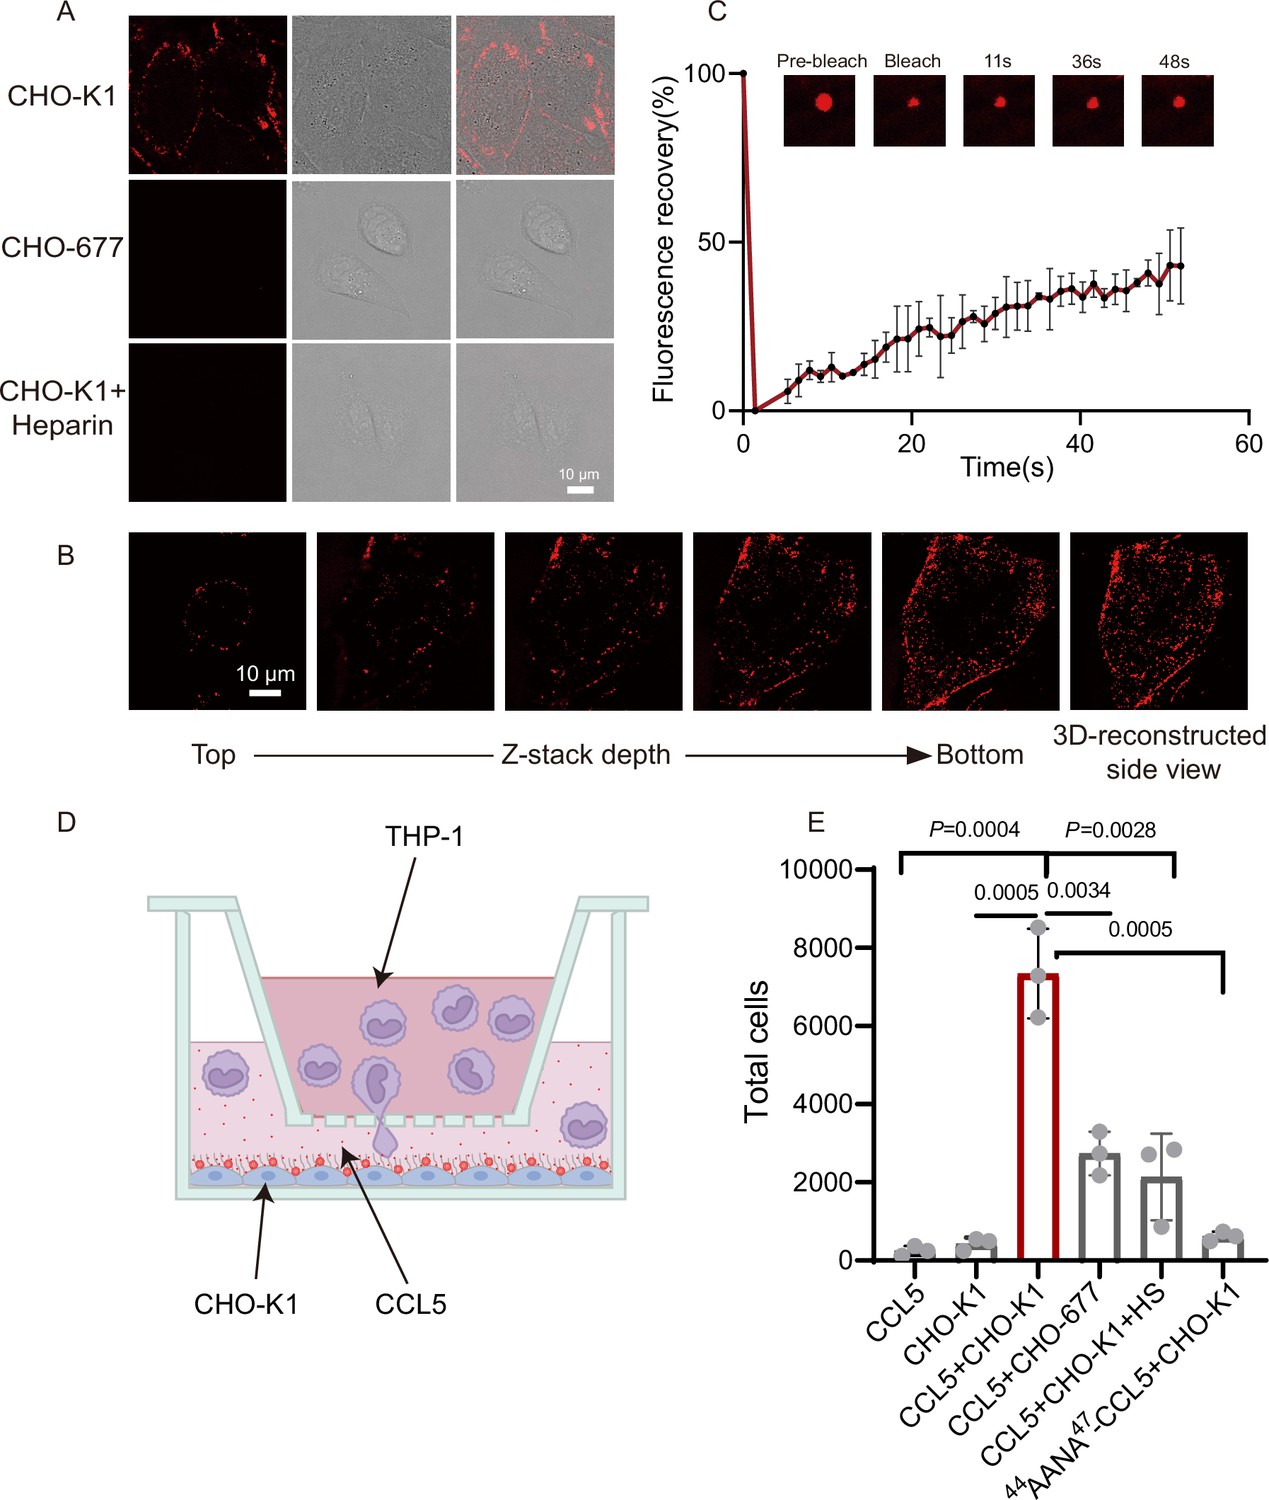
CCL5 phase separates with heparan sulfate on the cell surface.
(A) Microscopy images of CCL5-Cy3 on the surface CHO-K1 and CHO-677 as well as CHO-K1 treated with 1 mg/ml heparin. From left to right, the images are fluorescent-field, bright-field, and overlay of two illuminations. Scale bar = 10 μm. (B) Z-stack scanning of CCL5-Cy3 phase separation on CHO-K1 cell surface. The cell was imaged by confocal microscope with the Z-stack method. Scale bar = 10 μm. (C) Fluorescence recovery after photobleaching (FRAP) of the condensates formed by CCL5-Cy3, showing the intensity of fluorescence pre- and after photobleaching. The size of the representative droplets in different recovery stages are shown above of the graph. (D) Graphical illustration of the cell-based chemotaxis assay. CHO cells (1 × 10⁵ cells/well) were plated onto the lower chamber for 24 hr (fully attached) and CCL5 or 44AANA47-CCL5 or heparin were added as indicated. THP-1 cells (3 × 10⁵) were placed on upper chambers. After 4 hr, a small volume of medium in the lower chamber was aspirated to count THP-1 transmigrated through the membrane. (E) Quantification of THP-1 collected from the lower chambe. Data are mean ± standard deviation (s.d.). n = 3. Normal distribution was assessed by the Shapiro–Wilk (SW) normality test. p values were determined by unpaired two-tailed t-tests.
-
Figure 3—source data 1
Excel file containing relative fluorescent value in Figure 3C.
- https://cdn.elifesciences.org/articles/93871/elife-93871-fig3-data1-v1.zip
-
Figure 3—source data 2
Excel file containing the results of cell counting and descriptive statistics in Figure 3E.
- https://cdn.elifesciences.org/articles/93871/elife-93871-fig3-data2-v1.zip
Figure 3—figure supplement 1

44AANA47-CCL5 did not immobilize to the surface of CHO-K1.
CHO-K1 were treated with 500 nM 44AANA47-CCL5. From left to right, the pictures showed bright-field, fluorescent-field, and overlay of two illuminations.
Figure 4 with 1 supplement
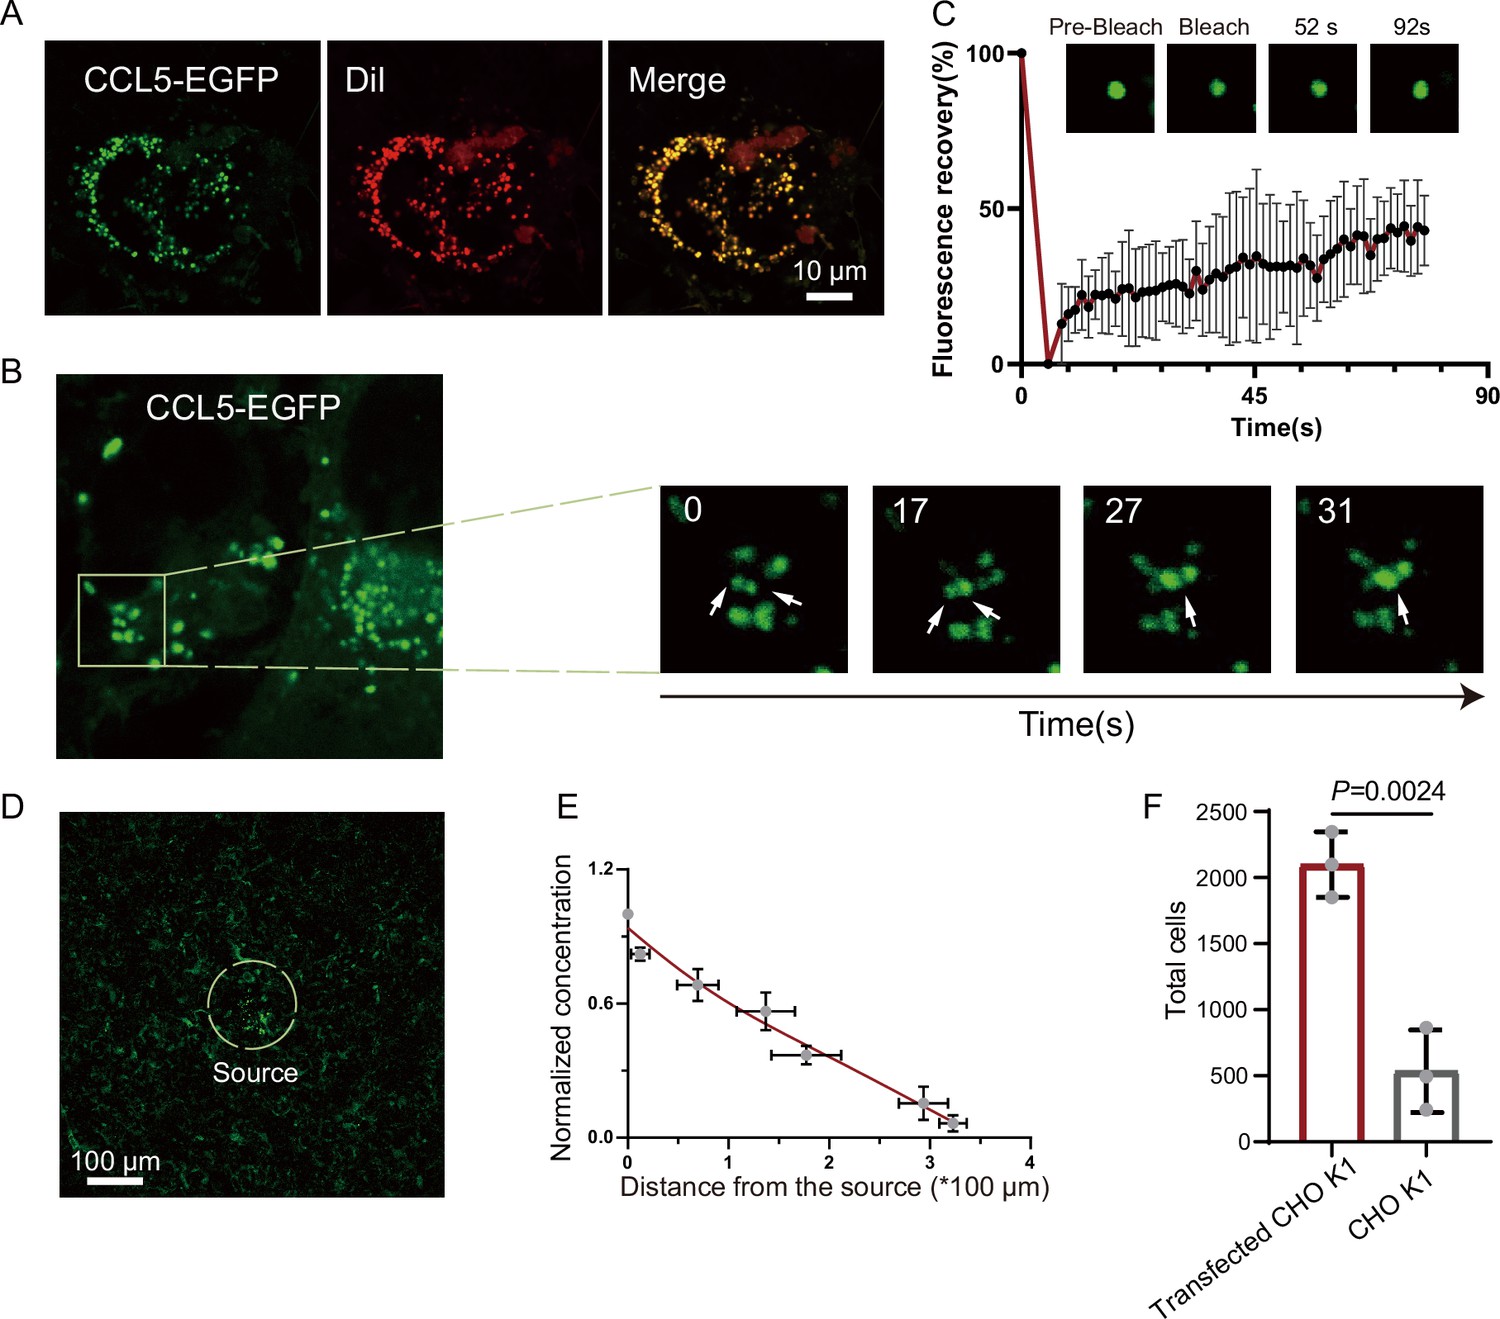
Formation of chemokine gradient on the cell surface by phase separation.
(A) Human umbilical vein endothelial cells (HUVECs) were seeded on the plates for 24 hr and stained with Dil (Cell membrane red fluorescent probe). After washing with PBS (Phosphate buffer saline), CCL5-EGFP transfected CHO-K1 were added and co-cultured for 24 hr before taking the images (scale bar = 10 μm). (B) Fusion events of droplets formed by CCL5-EGFP on HUVEC cell surface. The white arrows in cropped images indicate the fusion of two droplets with time. (C) Fluorescence recovery after photobleaching (FRAP) of the condensates formed by CCL5-EGFP in HUVEC cell surface, showing the intensity of fluorescence pre- and after photobleaching. The images of representative droplets in different recovery stages are shown. (D) HUVEC cells were seeded on the plate and firmly adhered before adding the 400 CCL5-EGFP transfected CHO-K1 cells placed in 50% of Matrigel. After 1-hr co-culture, confocal images were taking showing CCL5-EGFP diffusion on the surface of HUVEC. Dotted white circle indicates the source cell of CCL5-EGFP transfected CHO-K1. Scale bar = 100 μm. (E) Quantification of the fluorescence intensity shows decreased signals of CCL5-EGFP as the distance from the source cells increased. (F) The chemotaxis assay (same experimental conditions as described in Figure 1) shows higher activity of CCL5-EGFP transfected CHO-K1 cells than wild-type CHO-K1 cell. Data are mean ± standard deviation (s.d.). n = 3. Normal distribution was assessed by the Shapiro–Wilk (SW) normality test. p values were determined by unpaired two-tailed t-tests.
-
Figure 4—source data 1
Excel file containing relative fluorescent value in Figure 4C.
- https://cdn.elifesciences.org/articles/93871/elife-93871-fig4-data1-v1.zip
-
Figure 4—source data 2
Excel file containing output results of gray value and normalized concentration in Figure 4E.
- https://cdn.elifesciences.org/articles/93871/elife-93871-fig4-data2-v1.zip
-
Figure 4—source data 3
Excel file containing the results of cell counting and descriptive statistics in Figure 4F.
- https://cdn.elifesciences.org/articles/93871/elife-93871-fig4-data3-v1.zip
Figure 4—figure supplement 1
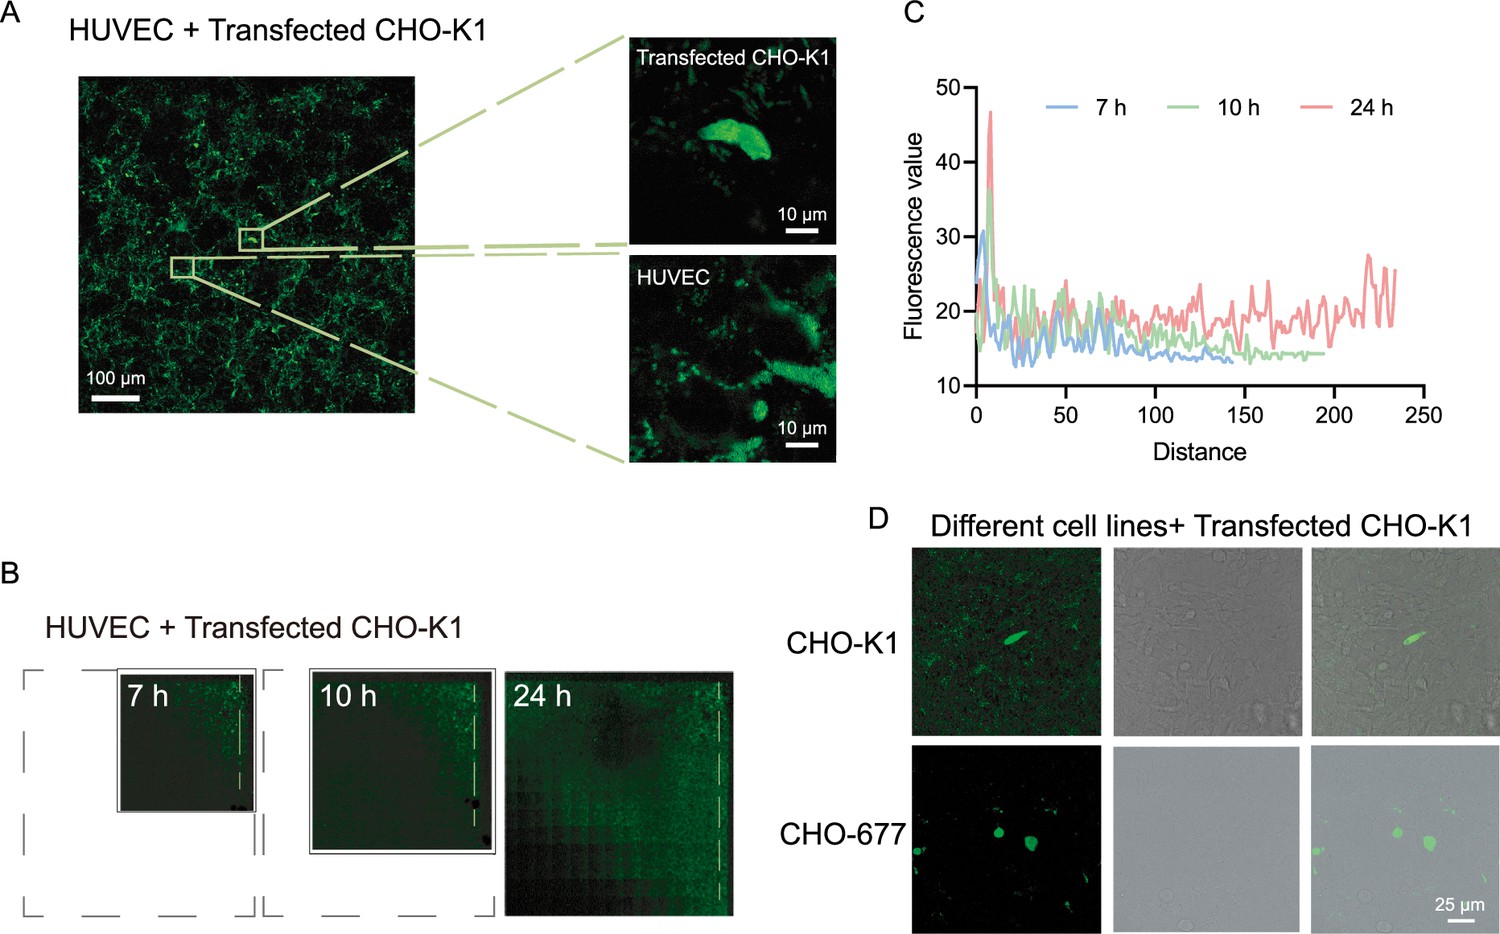
Diffusion of CCL5-EGFP on the cell surface.
(A) Confocal images of transfected CHO-K1 and human umbilical vein endothelial cells (HUVECs). Scale bar = 100 μm. The yellow boxes are shown in higher magnification on the right. Scale bar = 10 μm. CCL5-EGFP was expressed by transfected CHO-K1 and then adhere to the surface of HUVEC and formed phase separation. (B) The range of CCL5-EGFP diffusion on HUVEC cell surface at different time. The black dashed box showed the final image size. (C) Fluorescence intensity along the dotted lines indicated in B. (D) Confocal images of transfected CHO-K1 and CHO-K1 or CHO-677. CCL5-EGFP was expressed by transfected CHO-K1 and then adhere to the surface of CHO-K1 and formed phase separation but CHO-677 completely lack the signals. Scale bar = 25 μm.
Figure 5
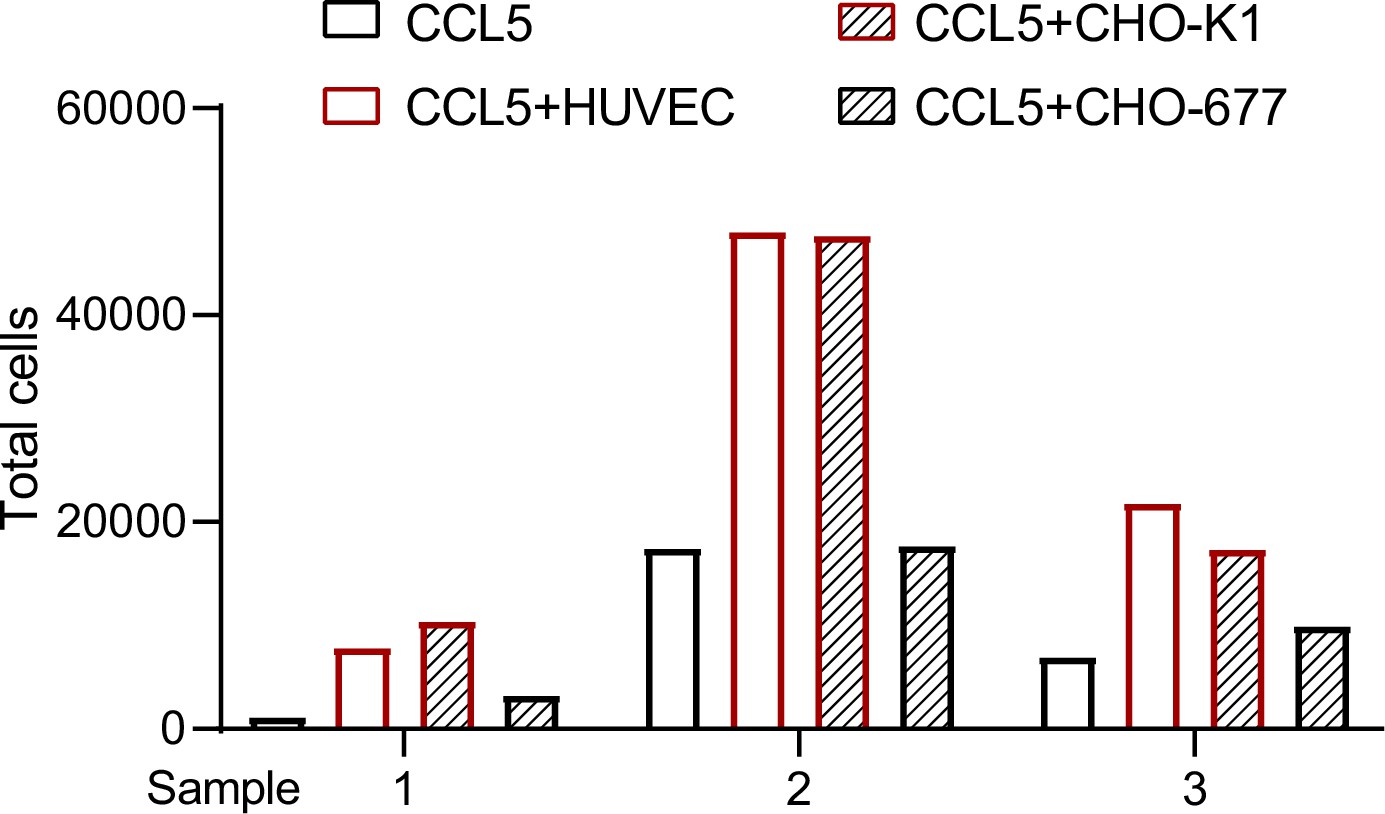
Transmigration of blood cells that lysed red cells.
The cells (CHO-K1, CHO-677, or human umbilical vein endothelial cell [HUVEC]) (1 × 10⁵ cells/well) as indicated were plated onto the lower chamber for 24 hr (fully attached) and CCL5 was added for 1 hr. The blood cells that lysed red cells isolated from three healthy volunteer donors were placed in the upper chamber (total number of cells: Sample 1: 8.65 × 10⁵; Sample 2: 2.31 × 10⁶; Sample 3: 2.23 × 10⁶). After culturing for 4 hr, the total transmigrated cells in the lower chamber were counted.
-
Figure 5—source data 1
Excel file containing the results of cell counting in Figure 5.
- https://cdn.elifesciences.org/articles/93871/elife-93871-fig5-data1-v1.zip
Figure 6
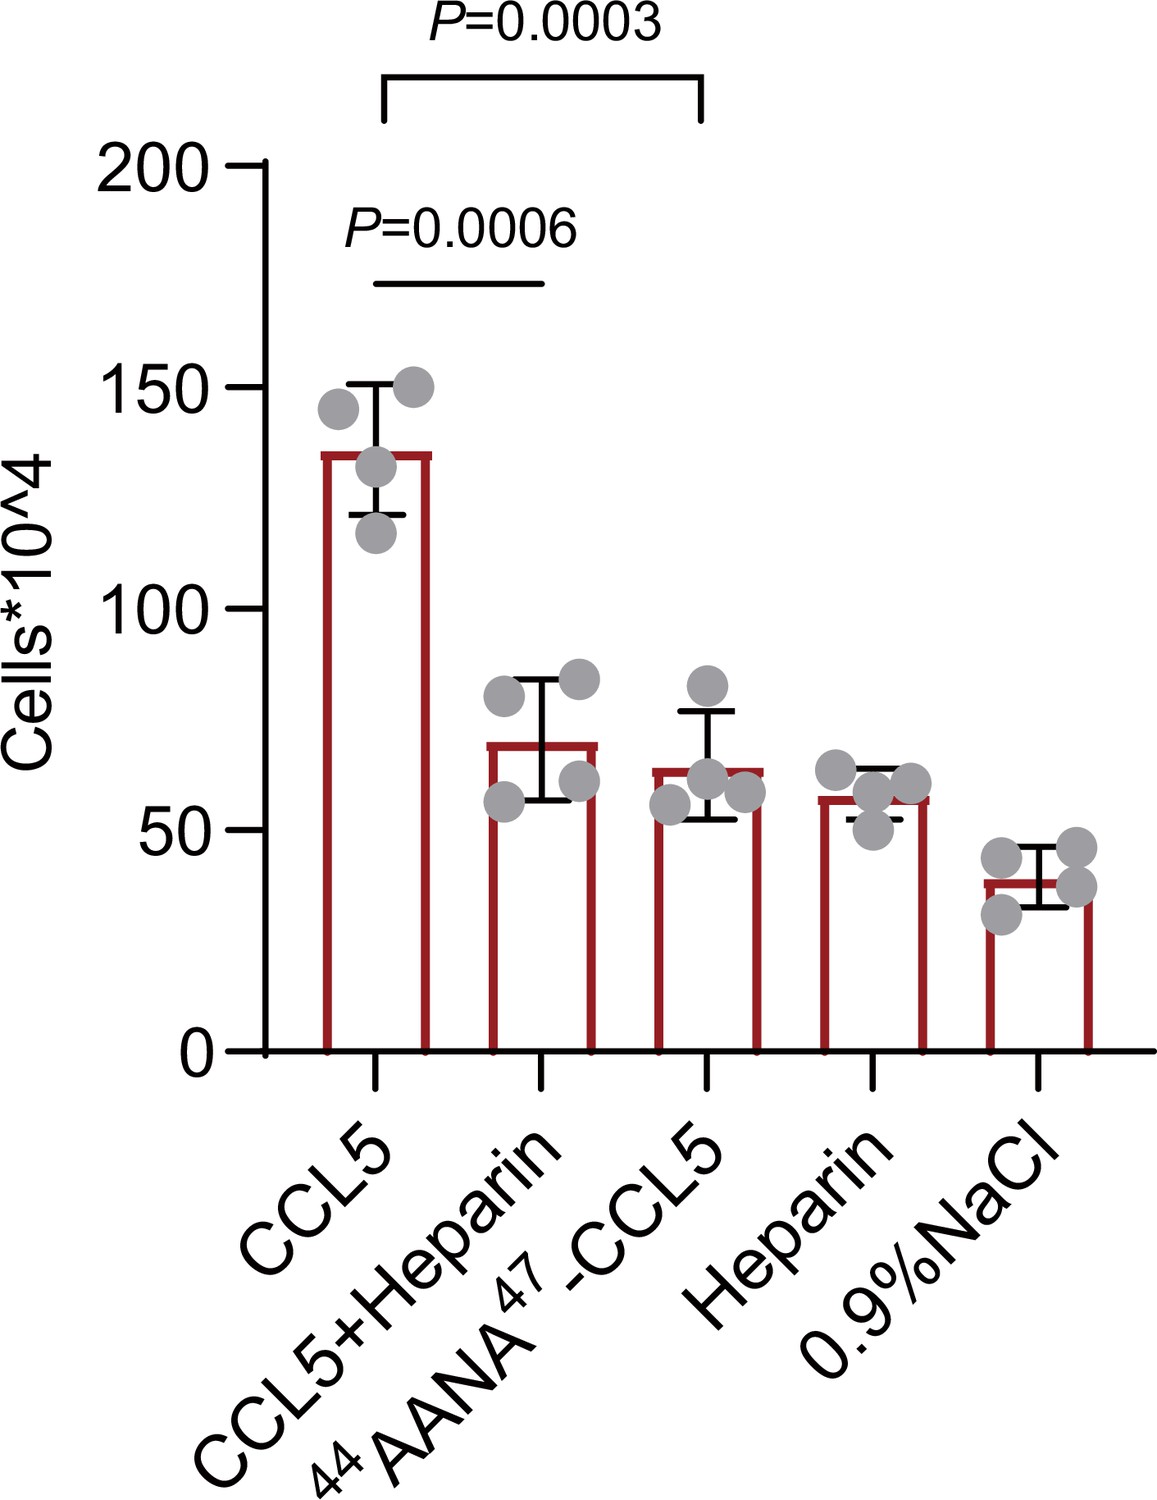
Chemokines phase separation promotes cell recruitment in vivo.
Mice were treated by intraperitoneal injection of CCL5 or the reagents as indicated. After 18 hr, the animals were sacrificed and peritoneal lavage was collected. Total cell number was counted by automated cell counter. Data are mean ± standard deviation (s.d.). n = 4. Normal distribution was assessed by the Shapiro–Wilk (SW) normality test. p values were determined by unpaired two-tailed t-tests.
-
Figure 6—source data 1
Excel file containing the results of cell counting and descriptive statistics in Figure 6.
- https://cdn.elifesciences.org/articles/93871/elife-93871-fig6-data1-v1.zip
Figure 7
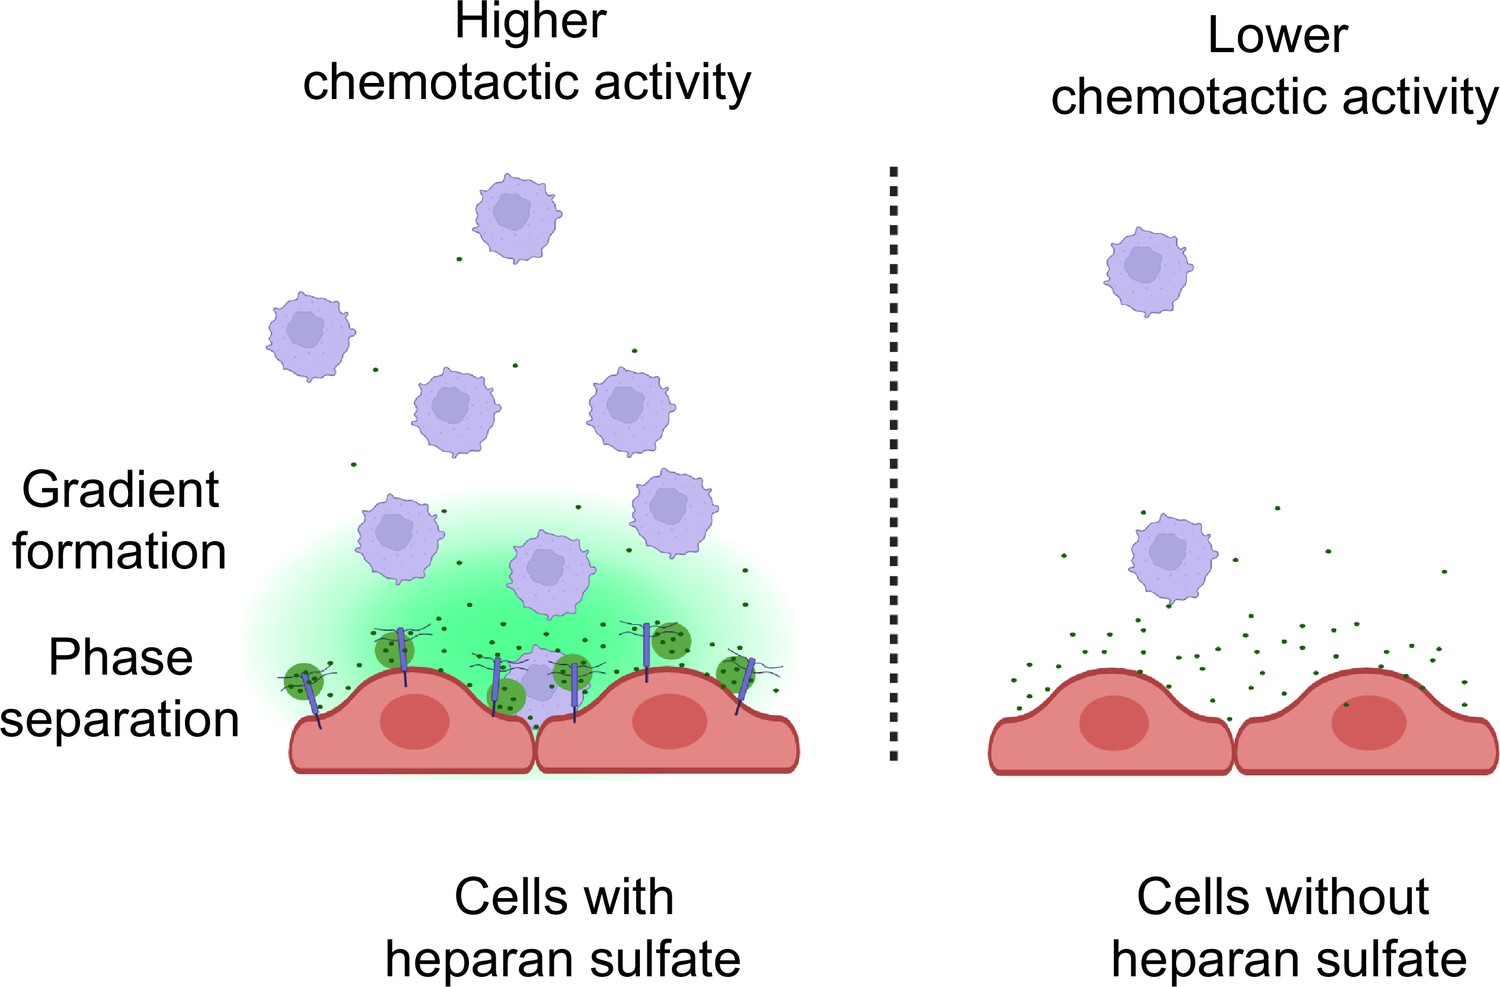
Schematic model of CCL5 phases separation along with heparan sulfate on the cell surface.
The inflammatory cells secrete chemokines that are immobilized by heparan sulfate in the form of liquid–liquid phase separation and subsequently diffused to form a concentration gradient.
Tables
Key resources table
| Reagent type (species) or resource | Designation | Source or reference | Identifiers | Additional information |
|---|---|---|---|---|
| Gene (Homo sapiens) | CCL5 | GenBank | HGNC:10632 | |
| Strain, strain background (Escherichia coli) | Rosetta(DE3) | Biomed | BC204-01 | |
| Strain, strain background (Escherichia coli) | OrigamiB(DE3) | Biomed | BC205-01 | |
| Sequence-based reagent | 44AANA47-CCL5-mut-F | Øynebråten et al., 2015 | PCR primers | GCAGTCGTCTTTGTCACCGCGGCGAACGCGCAAGTGTGTGCCAACCCA |
| Sequence-based reagent | 44AANA47-CCL5-mut-R | Øynebråten et al., 2015 | PCR primers | TGGGTTGGCACACACTTGCGCGTTCGCCGCGGTGACAAAGACGACTGC |
| Recombinant DNA reagent | pET-28a | Miao Ling Plasmid | P51040 | |
| Chemical compound, drug | Cy3-NHS | ATT Bioquest | 1023 | |
| Chemical compound, drug | Heparin | GlycoNovo | C-HEPPIM | Mw: 13.980 Da |
| Cell line (Homo sapiens) | HUVEC | Pricella | CL-0675 | |
| Cell line (Cricetulus griseus) | CHO-K1 | GlycoNovo | ||
| Cell line (Cricetulus griseus) | CHO-677 | GlycoNovo | ||
| Biological sample (Mus musculus) | BALB/cAnNCrl | Vital River | 211 | Female |
| Biological sample (Homo sapiens) | Human peripheral blood cell | China-Japan Friendship Hospital | Freshly isolated from volunteers | |
| Software, algorithm | CHARMM-GUI | CHARMM-GUI | RRID:SCR_025037 | |
| Software, algorithm | GROMACS | GROMACS | RRID:SCR_014565 | |
| Software, algorithm | gmx_MMPBSA | GitHub | RRID:SCR_002630 | |
| Software, algorithm | LAS X software 3.5 | Leica Application Suite X | RRID:SCR_013673 |
Additional files
Download links
A two-part list of links to download the article, or parts of the article, in various formats.
Downloads (link to download the article as PDF)
Open citations (links to open the citations from this article in various online reference manager services)
Cite this article (links to download the citations from this article in formats compatible with various reference manager tools)
Heparan sulfate-dependent phase separation of CCL5 and its chemotactic activity
eLife 13:RP93871.
https://doi.org/10.7554/eLife.93871.4


