Targeted protein degradation systems to enhance Wnt signaling
- Surrozen, Inc, United States
Figures
Figure 1 with 1 supplement
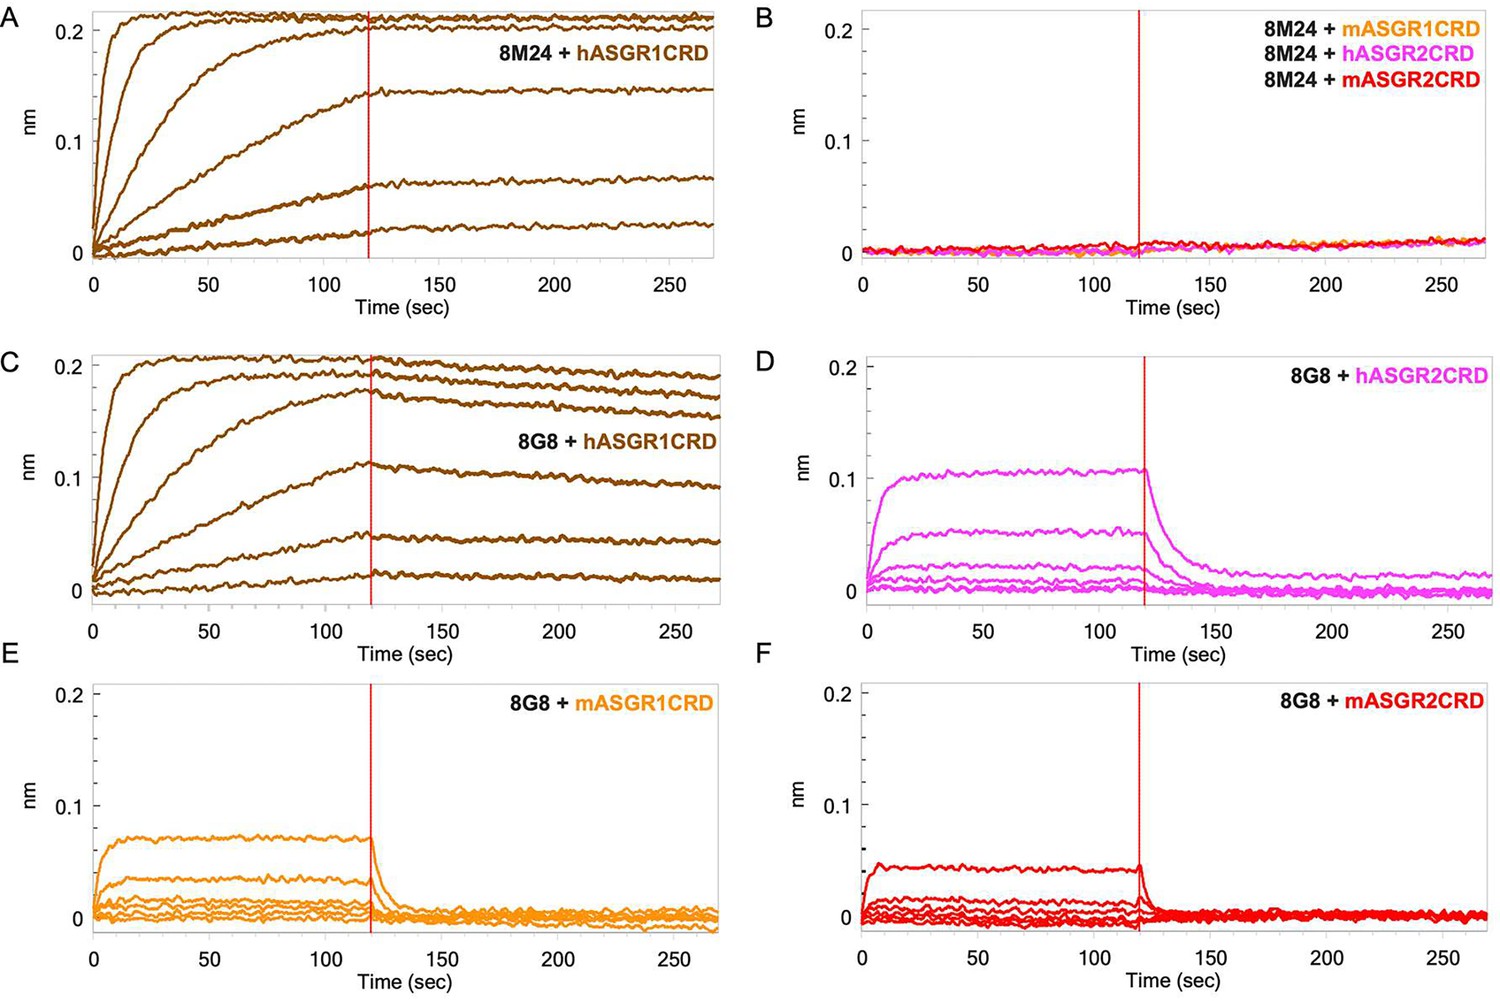
Biolayer interferometry (BLI) profiles of antigen carbohydrate recognition domains (CRDs) to antibodies.
(A) Binding of hASGR1 to 8M24-IgG1; (B) non-binding of mASGR1, hASGR2, and mASGR2 to 8M24-IgG1; (C) binding of hASGR1 to 8G8-IgG1; (D) binding of hASGR2 to 8G8-IgG1; (E) binding of mASGR1 to 8G8-IgG1; and (F) binding of mASGR2 to 8G8-IgG1. Binding profiles for hASGR1, hASGR2, mASGR1, and mASGR2 are shown in brown, magenta, orange, and red traces, respectively.
-
Figure 1—source data 1
Excel file contains raw binding data in Figure 1.
- https://cdn.elifesciences.org/articles/93908/elife-93908-fig1-data1-v1.xlsx
Figure 1—figure supplement 1
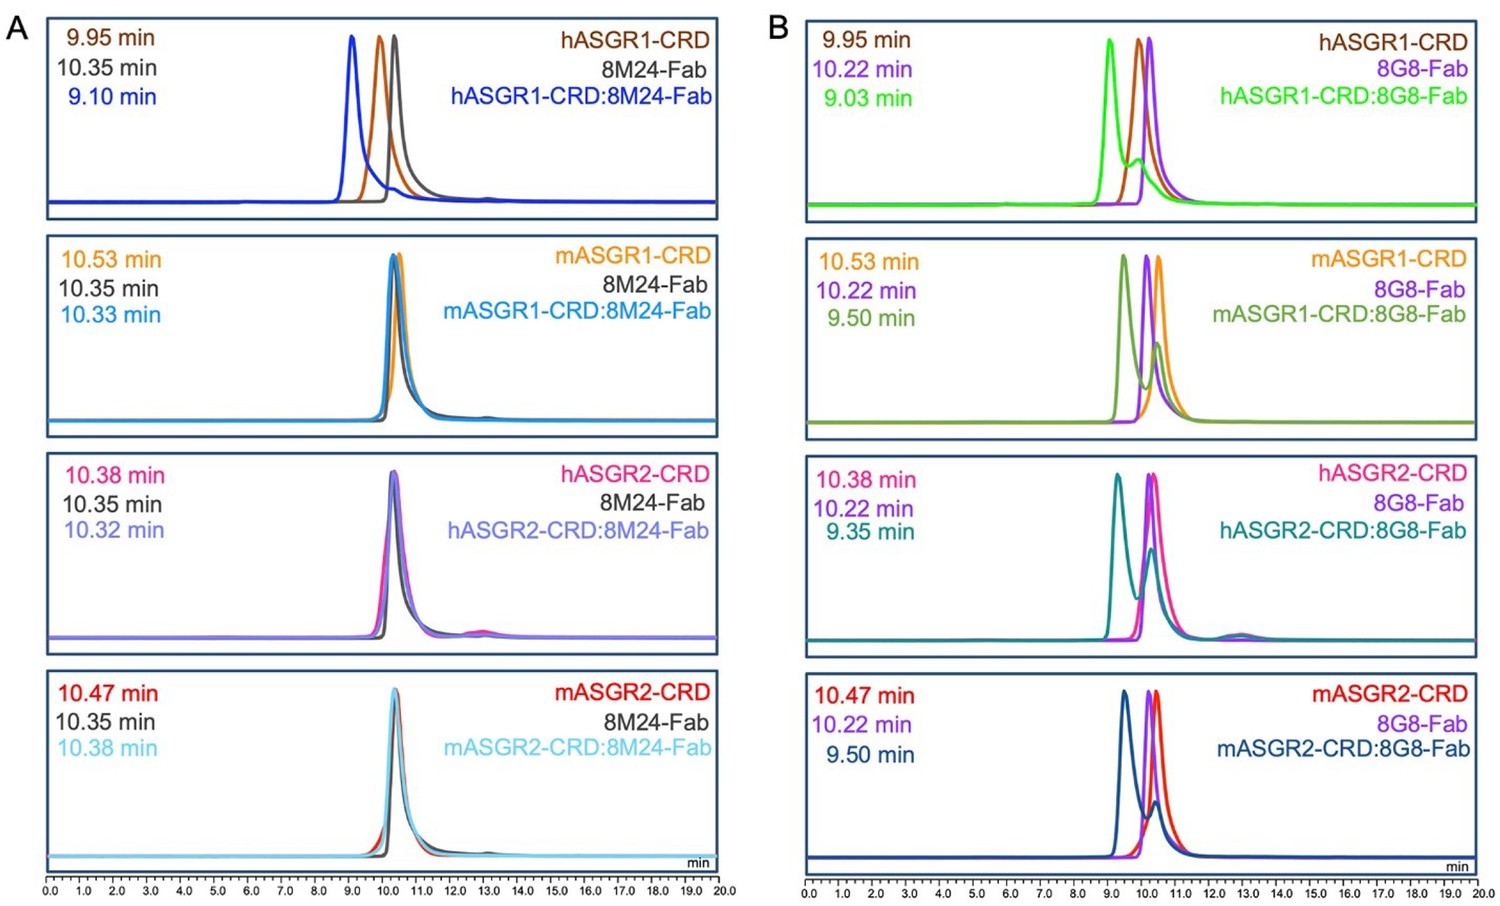
8M24 is specific to human ASGR1, and 8G8 binds to both ASGR1 and ASGR2 with mouse cross-reactivity.
(A) Interaction of 8M24-Fab with human and mouse ASGR1 and ASGR2 carbohydrate recognition domains (CRDs). The left-shifted peak, corresponding to complex formation, is observed only with hASGR1-CRD. (B) Interaction of 8G8-Fab with human and mouse ASGR1 and ASGR2 CRDs. The left-shifted peak, corresponding to complex formation, is observed for four proteins from human and mouse ASGR1 and ASGR2 CBDs. Elution time is shown on the x-axis, and the absorption unit on the y-axis is not to actual scale. Samples were analyzed on an Agilent AdvanceBio SEC 300 Å, 2.7 μm, 7.8 × 300 mm column, equilibrated with 20 mM HEPES (4-(2-hydroxyethyl) piperazine-1-ethane-sulfonic acid) pH 7.5, 150 mM sodium chloride, mounted on a Vanquish (Thermo Scientific, USA) UHPLC system.
-
Figure 1—figure supplement 1—source data 1
Source data files include raw size-exclusion chromatography (SEC)–high performance liquid chromatography (HPLC) data in Figure 1—figure supplement 1.
- https://cdn.elifesciences.org/articles/93908/elife-93908-fig1-figsupp1-data1-v1.zip
Figure 2
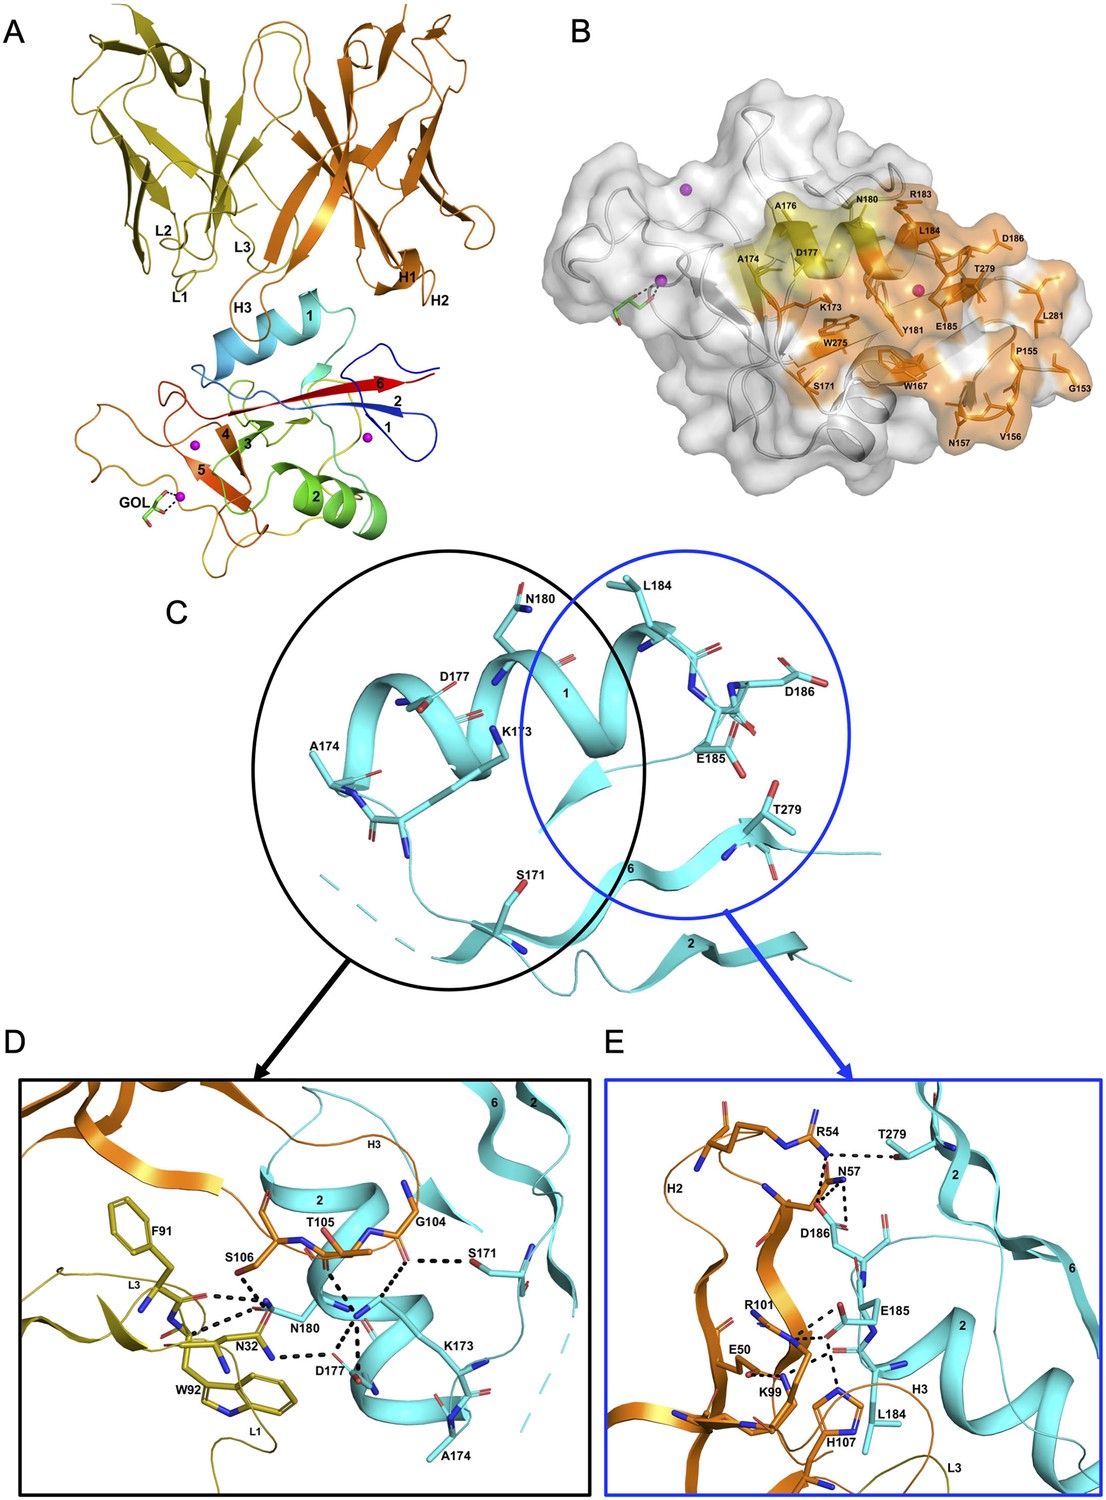
Structure of the hASGR1:8M24 complex.
(A) A cartoon representation of the overall structure of the hASGR1CRD:8M24-Fab complex. The heavy and light chains of 8M24 are colored orange and olive, respectively, with their CDR loops marked as H1, H2, H3, L1, L2, and L3. hASGR1CRD is traced in blue to red from the N- to C-terminus. Three calcium ions are represented as magenta spheres. A glycerol molecule bound to the calcium ion at the ASGR substrate-binding site is highlighted in the stick representation. (B) The epitope of 8M24 highlighted on the surface of hASGR1. Antigen residues that are within 4.5 Å from 8M24 heavy and light chains are shown in orange and olive, respectively. (C) Residues of hASGR1 involved in polar interactions with the 8M24 antibody are shown in stick notation on the secondary structure elements (cyan traces) with most of the residues situated on the helix ∝1 of hASGR1. (D) A close-up view of polar interactions between 8M24 and hASGR1 near the N-terminus of helix ∝1. (E) A close-up view of polar interactions between 8M24 and hASGR1 near the C-terminus of helix ∝1.
Figure 3
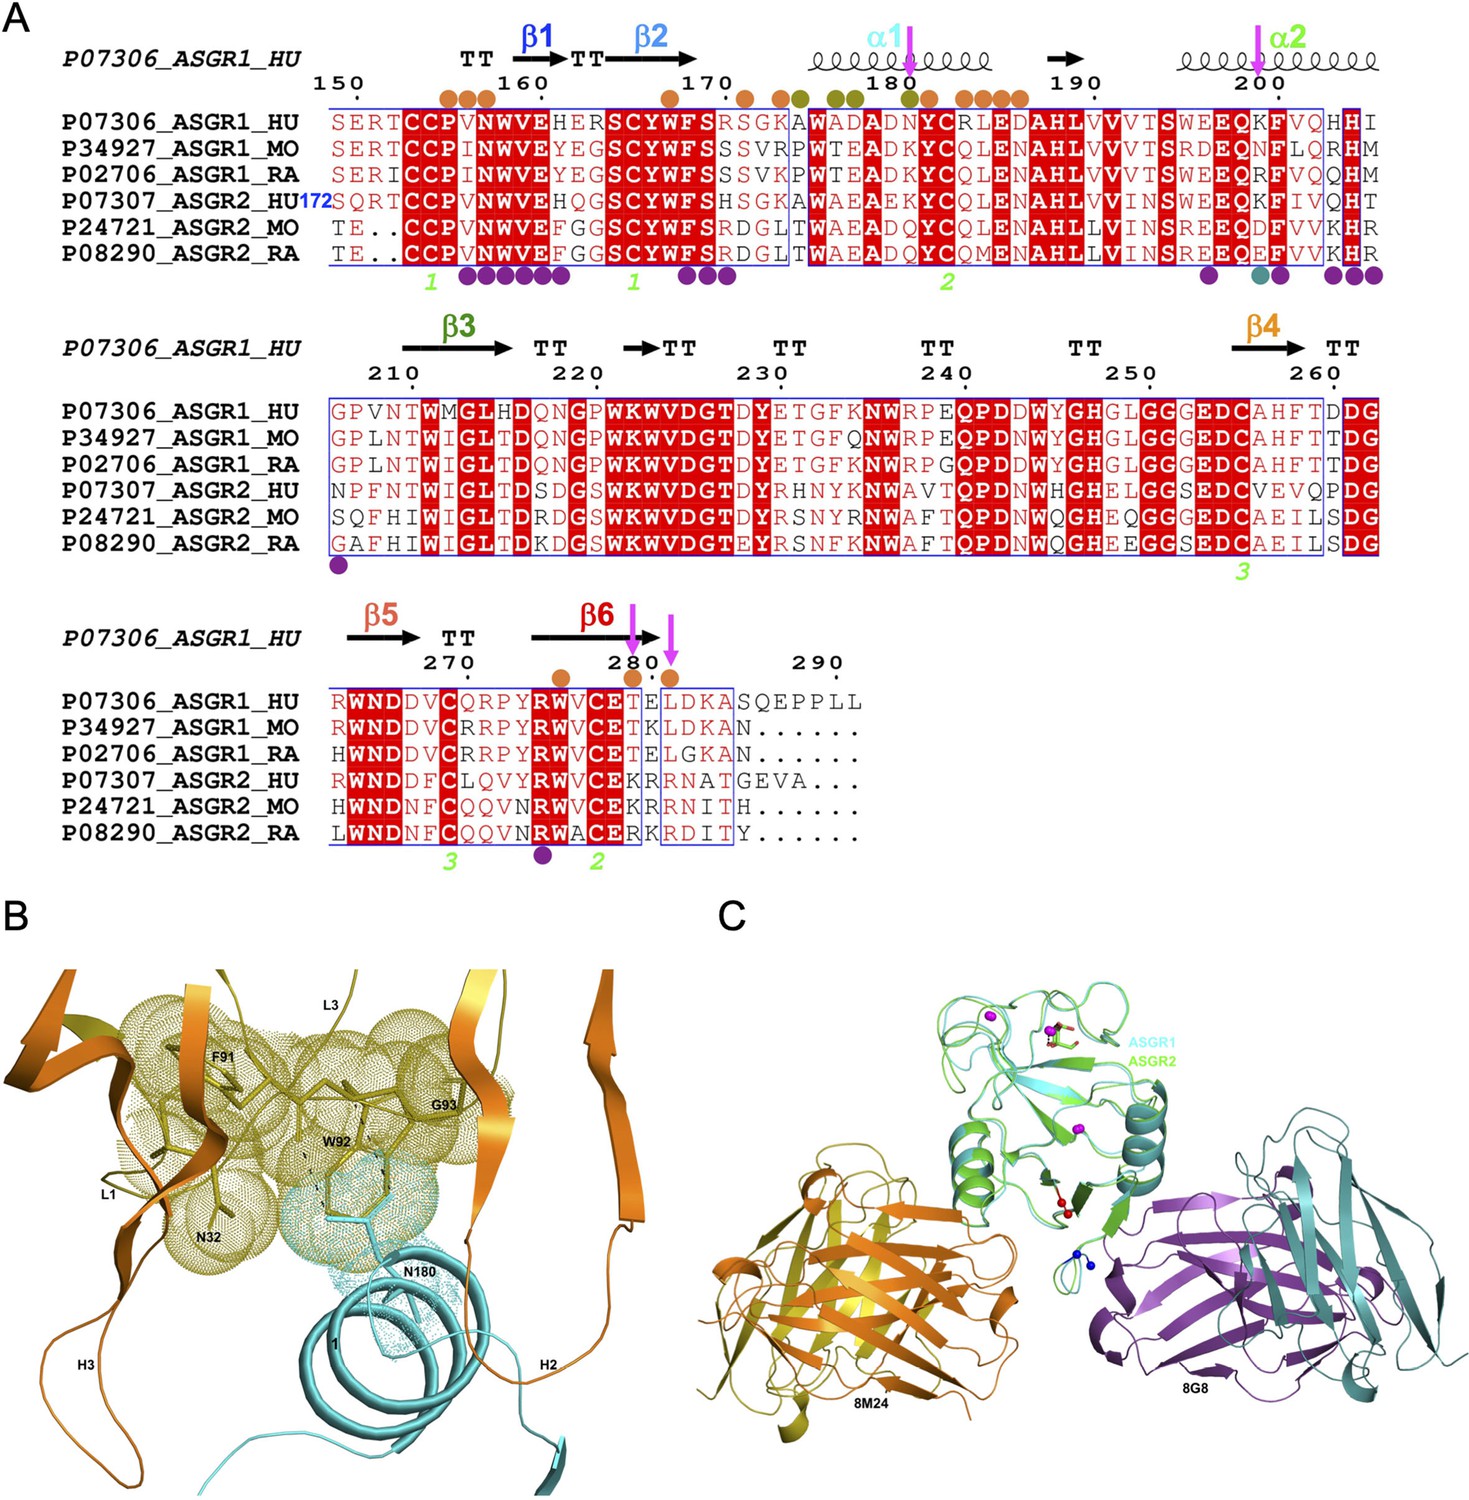
Comparison of hASGR1:8M24 and hASGR2:8G8 complex structures.
(A) An alignment, made with MultAlin (Corpet, 1988) and ESPript (Gouet et al., 2003) of human, mouse, and rat ASGR1 and ASGR2 sequences with the secondary structure elements of hASGR1CRD (PDB code: 1DV8, Meier et al., 2000) depicted at the top and labeled according to the color scheme in Figure 1A. Paratope residues from the heavy and light chains of 8M24 are marked with orange and olive circles, respectively. Paratope residues from the heavy and light chains of 8G8 are marked with purple and teal circles, respectively. Important residues are highlighted with a magenta downward arrow. hASGR2 residue Ser172 is marked for reference to the sequence numbering. (B) A dot representation showing the snug-fit of hASGR1 Asn180 for the cavity formed by Phe91–Trp92–Gly93 (LCDR3 loop) and Asn32 (LCDR1 loop) of 8M24. hASGR1 Asn180 is replaced by either Lys or Gln in h/m/rASGR2 and m/rASGR1, respectively. (C) Superimposed structures of hASGR1:8M24 and hASGR2:8G8 complexes illustrating that the interaction surfaces of the antibodies are situated on the opposite surfaces of the antigens and are non-overlapping. The overall folds of hASGR1 and hASGR2 are shown in cyan and green, respectively, with their N- and C-terminus highlighted as blue and red spheres, respectively. Three calcium ions are represented as magenta spheres. A glycerol molecule bound to the calcium ion at the ASGR substrate-binding site is highlighted in stick representation.
Figure 4
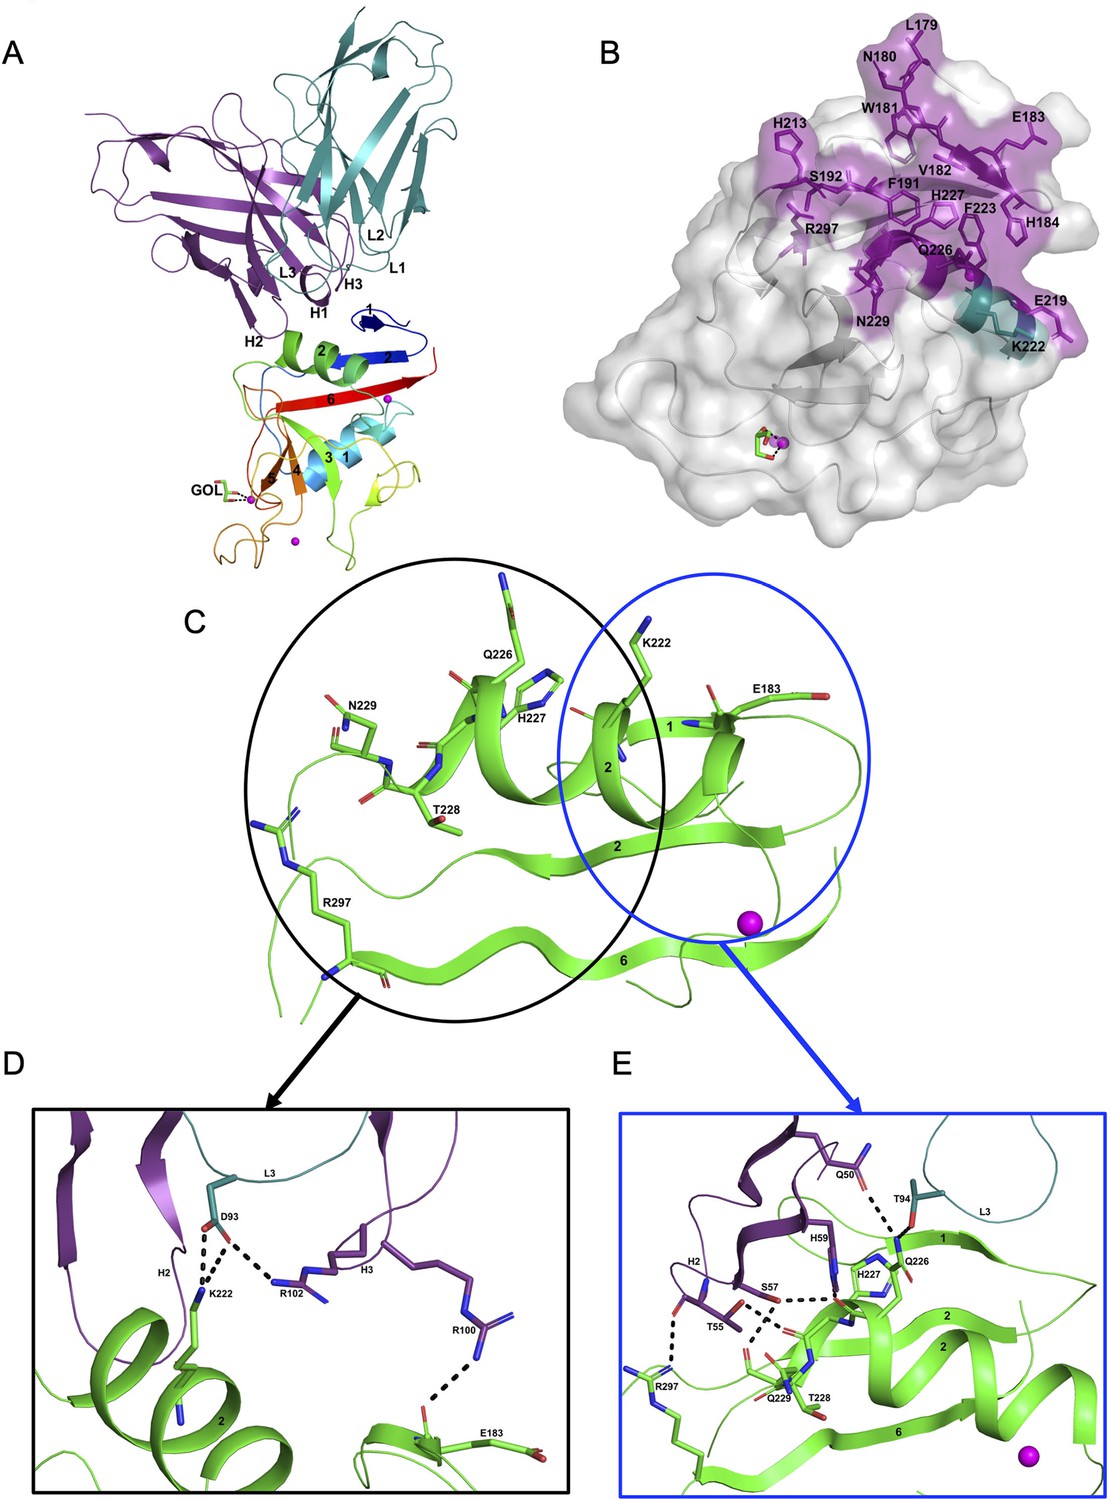
Structure of the hASGR2:8G8 complex.
(A) A cartoon representation of the overall structure of the hASGR2CRD:8G8-Fab complex. The heavy and light chains of 8G8 are colored in purple and teal, respectively, with their CDR loops marked as H1, H2, H3, L1, L2, and L3. hASGR2CRD is traced in blue to red from the N- to C-terminus. Three calcium ions are represented as magenta spheres. A glycerol molecule bound to the calcium ion at the ASGR substrate-binding site is highlighted in stick representation. (B) The epitope of 8G8 highlighted on the surface of hASGR2. Antigen residues that are within 4.5 Å from the 8G8 heavy and light chains are shown in purple and teal, respectively. (C) Residues of hASGR2 involved in polar interactions with the 8G8 antibody are shown in stick representation on the secondary structure elements (green traces) with most of the residues situated on the ∝2 helix of hASGR2. (D) A close-up view of polar interactions between 8M24 and hASGR2 near the N-terminus of helix ∝2. (E) A close-up view of polar interactions between 8M24 and hASGR2 near the C-terminus of helix ∝2.
Figure 5
Both 8M24 and 8G8 RSPO2RA SWEETS molecules enhance Wnt signaling.
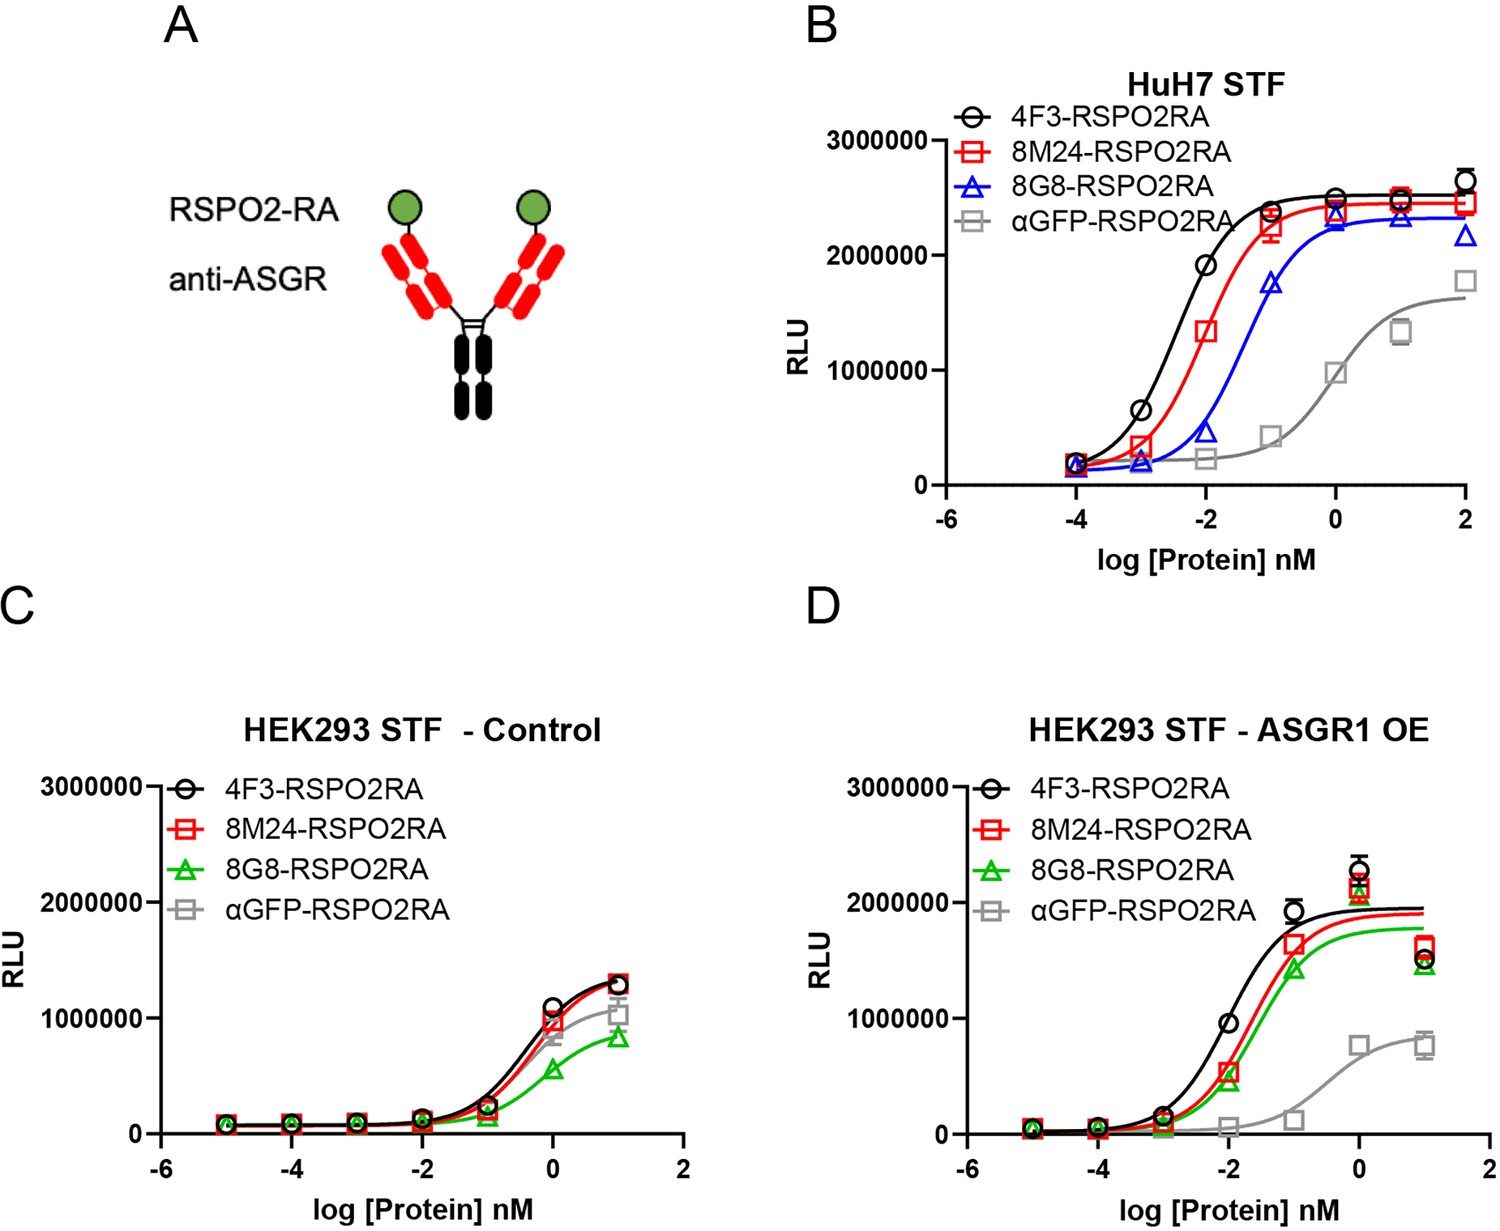
(A) Diagrams of the SWEETS molecules. RSPO2RA is fused at the N-terminus of the heavy chain of IgG. (B) Both 8M24 and 8G8 RSPO2RA SWEETS molecules enhance Wnt signaling in HuH-7 STF cells, which has the Wnt response reporter. (C, D) Compared to the negative control αGFP-RSPO2RA, both 8M24 and 8G8 RSPO2RA SWEETS molecules enhance Wnt signaling in ASGR1-overexpressed HEK293 STF cells (D), but not in parental HEK293 cells without ASGR1 overexpression (C). Data are representative of three independent experiments performed in triplicate and are shown as mean ± standard deviation (SD).
-
Figure 5—source data 1
Excel file contains STF raw reading in Figure 5B–D.
- https://cdn.elifesciences.org/articles/93908/elife-93908-fig5-data1-v1.xlsx
Figure 6 with 1 supplement
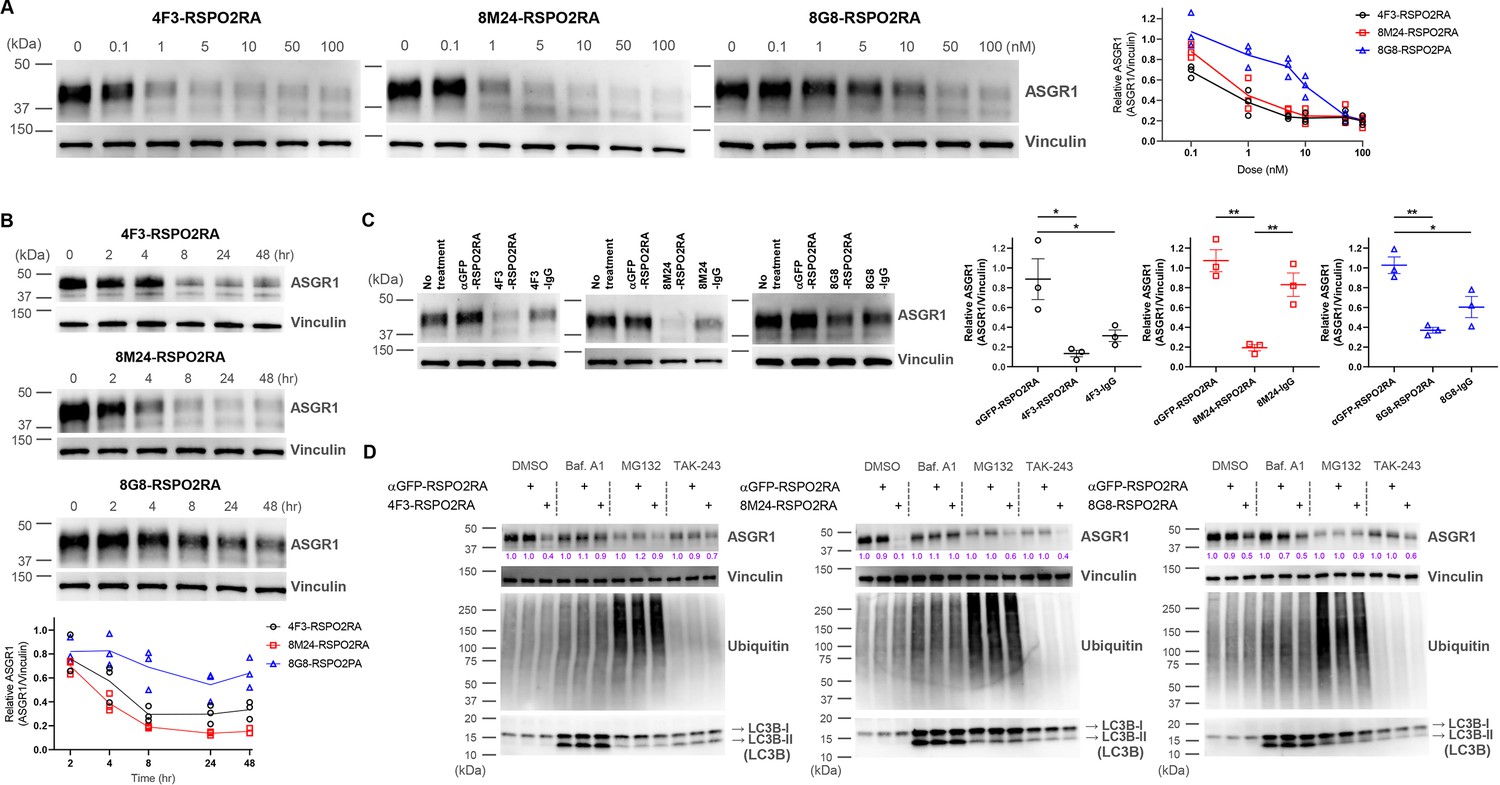
SWEETS induce degradation of ASGR1 in HuH-7 cells.
(A) Dose-dependent ASGR1 degradation promoted by different concentrations of 4F3-, 8M24-, and 8G8-RSPO2RA SWEETS for 24 hr. (B) Time-course of ASGR1 degradation upon treatment with 10 nM 4F3-, 8M24-, and 8G8-RSPO2RA. (C) Western blot analysis demonstrating the efficacy of ASGR1 degradation in cells treated with 4F3-, 8M24-, and 8G8-RSPO2RA SWEETS compared with ASGR1 antibodies lacking the RSPO2RA domain. (D) Western blot data showing the total protein levels of ASGR1, ubiquitin, and LC3B in HuH-7 cells pre-treated with dimethyl sulfoxide (DMSO), lysosomal pathway inhibitor bafilomycin A1 (Baf.A1), proteasome inhibitor MG132, and E1 ubiquitin ligase inhibitor TAK-243 to determine which degradation pathways govern ASGR1 degradation by SWEETS. Data in (A–C) are representative of three independent experiments, while data in (D) are representative of two independent experiments. For (A, B), total ASGR1 levels were normalized to generate graphs representing the mean of those three experiments. In (C), data are represented as mean ± standard error of the mean (SEM) of normalized total ASGR1 levels, and one-way analysis of variance (ANOVA) with Tukey’s post hoc test was used for statistical analysis. *p < 0.05, **p < 0.01.
-
Figure 6—source data 1
Source data files include raw unedited and uncropped blots with the relevant bands clearly labeled shown in Figure 6A.
- https://cdn.elifesciences.org/articles/93908/elife-93908-fig6-data1-v1.zip
-
Figure 6—source data 2
Source data files include raw unedited and uncropped blots with the relevant bands clearly labeled shown in Figure 6B.
- https://cdn.elifesciences.org/articles/93908/elife-93908-fig6-data2-v1.zip
-
Figure 6—source data 3
Source data files include raw unedited and uncropped blots with the relevant bands clearly labeled shown in Figure 6C.
- https://cdn.elifesciences.org/articles/93908/elife-93908-fig6-data3-v1.zip
-
Figure 6—source data 4
Source data files include raw unedited and uncropped blots with the relevant bands clearly labeled shown in Figure 6D.
- https://cdn.elifesciences.org/articles/93908/elife-93908-fig6-data4-v1.zip
-
Figure 6—source data 5
Excel file contains the quantification of relative ASGR1 levels in Figure 6A right panel, Figure 6B bottom panel, and Figure 6C right panel.
- https://cdn.elifesciences.org/articles/93908/elife-93908-fig6-data5-v1.xlsx
Figure 6—figure supplement 1
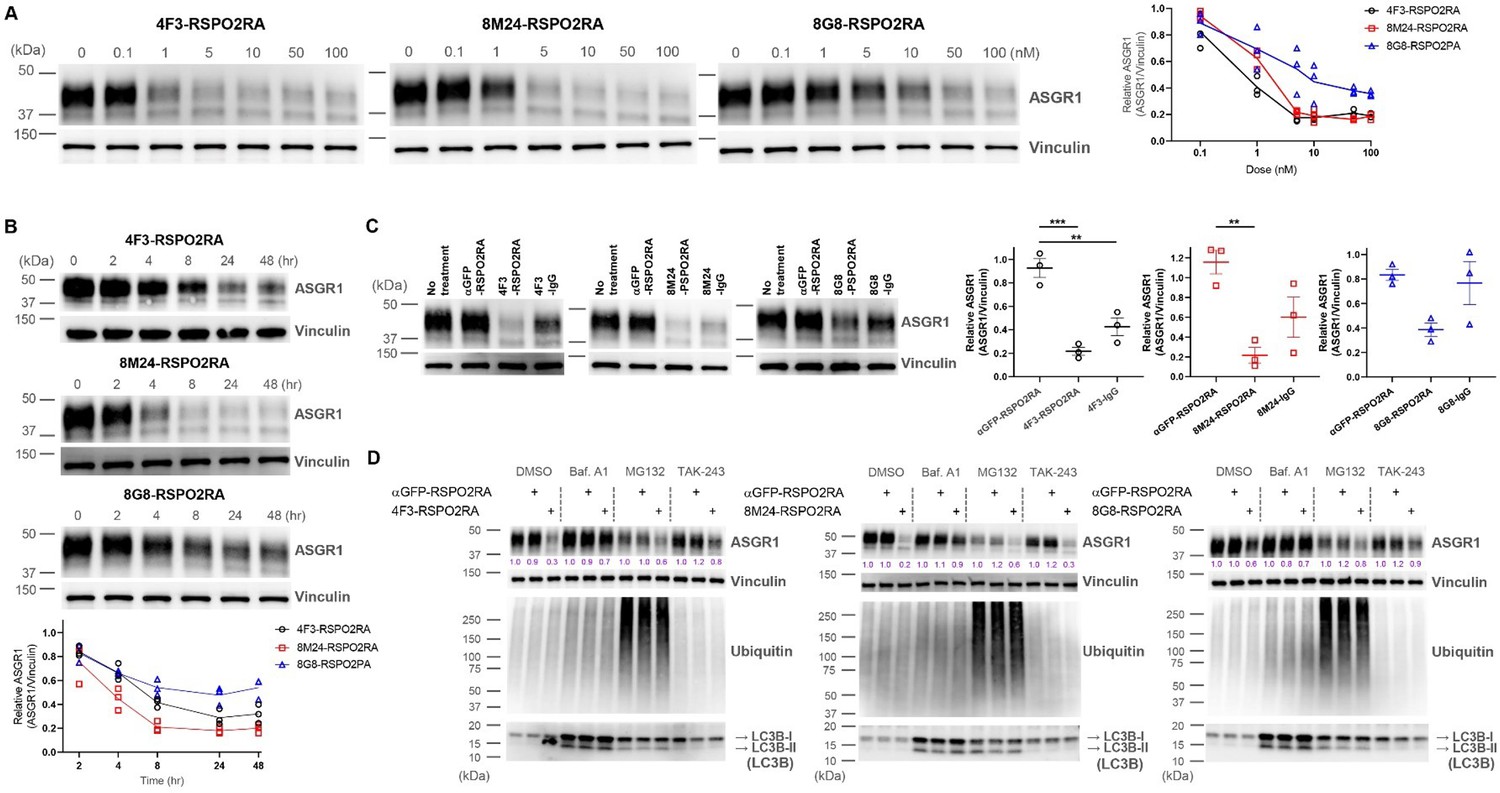
ASGR1 degradation promoted by SWEETS was determined in an additional hepatocyte cell line, HepG2 cells.
(A) ASGR1 degradation induced by different concentrations of 4F3-, 8M24-, and 8G8-RSPO2RA showing the dose-response curves of SWEETS. (B) Time-course of ASGR1 degradation treated with 10 nM of 4F3-, 8M24-, and 8G8-RSPO2RA for 24 hr. (C) Western blot analysis results showing comparisons of ASGR1 degradation induced by SWEETS and ASGR1 antibody. (D) Total protein levels of ASGR1, ubiquitin, and LC3B in HepG2 cells pre-incubated with DMSO, lysosomal pathway inhibitor bafilomycin A1 (Baf.A1), proteasome inhibitor MG132, and E1 ubiquitin ligase inhibitor TAK-243 to determine the degradation pathway for SWEETS-mediated ASGR1 degradation. The western blot data in (A–C) are representative of three independent experiments, whereas the data in (D) are representative of two independent experiments. For (A, B), total ASGR1 levels were normalized by total loading control protein levels (Vinculin) to generate graphs representing the mean of those three experiments. For (C), data are represented as mean ± standard error of the mean (SEM) of normalized total ASGR1 levels, and one-way analysis of variance (ANOVA) with Tukey’s post hoc test was used for statistical analysis. **p < 0.01, ***p < 0.001.
-
Figure 6—figure supplement 1—source data 1
Source data files include raw unedited and uncropped blots with the relevant bands clearly labeled shown in Figure 6—figure supplement 1A.
- https://cdn.elifesciences.org/articles/93908/elife-93908-fig6-figsupp1-data1-v1.zip
-
Figure 6—figure supplement 1—source data 2
Source data files include raw unedited and uncropped blots with the relevant bands clearly labeled shown in Figure 6—figure supplement 1B.
- https://cdn.elifesciences.org/articles/93908/elife-93908-fig6-figsupp1-data2-v1.zip
-
Figure 6—figure supplement 1—source data 3
Source data files include raw unedited and uncropped blots with the relevant bands clearly labeled shown in Figure 6—figure supplement 1C.
- https://cdn.elifesciences.org/articles/93908/elife-93908-fig6-figsupp1-data3-v1.zip
-
Figure 6—figure supplement 1—source data 4
Source data files include raw unedited and uncropped blots with the relevant bands clearly labeled shown in Figure 6—figure supplement 1D.
- https://cdn.elifesciences.org/articles/93908/elife-93908-fig6-figsupp1-data4-v1.zip
-
Figure 6—figure supplement 1—source data 5
Excel file contains the quantification of relative ASGR1 levels in Figure 6—figure supplement 1A right panel, Figure 6—figure supplement 1B bottom panel, and Figure 6—figure supplement 1C right panel.
- https://cdn.elifesciences.org/articles/93908/elife-93908-fig6-figsupp1-data5-v1.xlsx
Figure 7
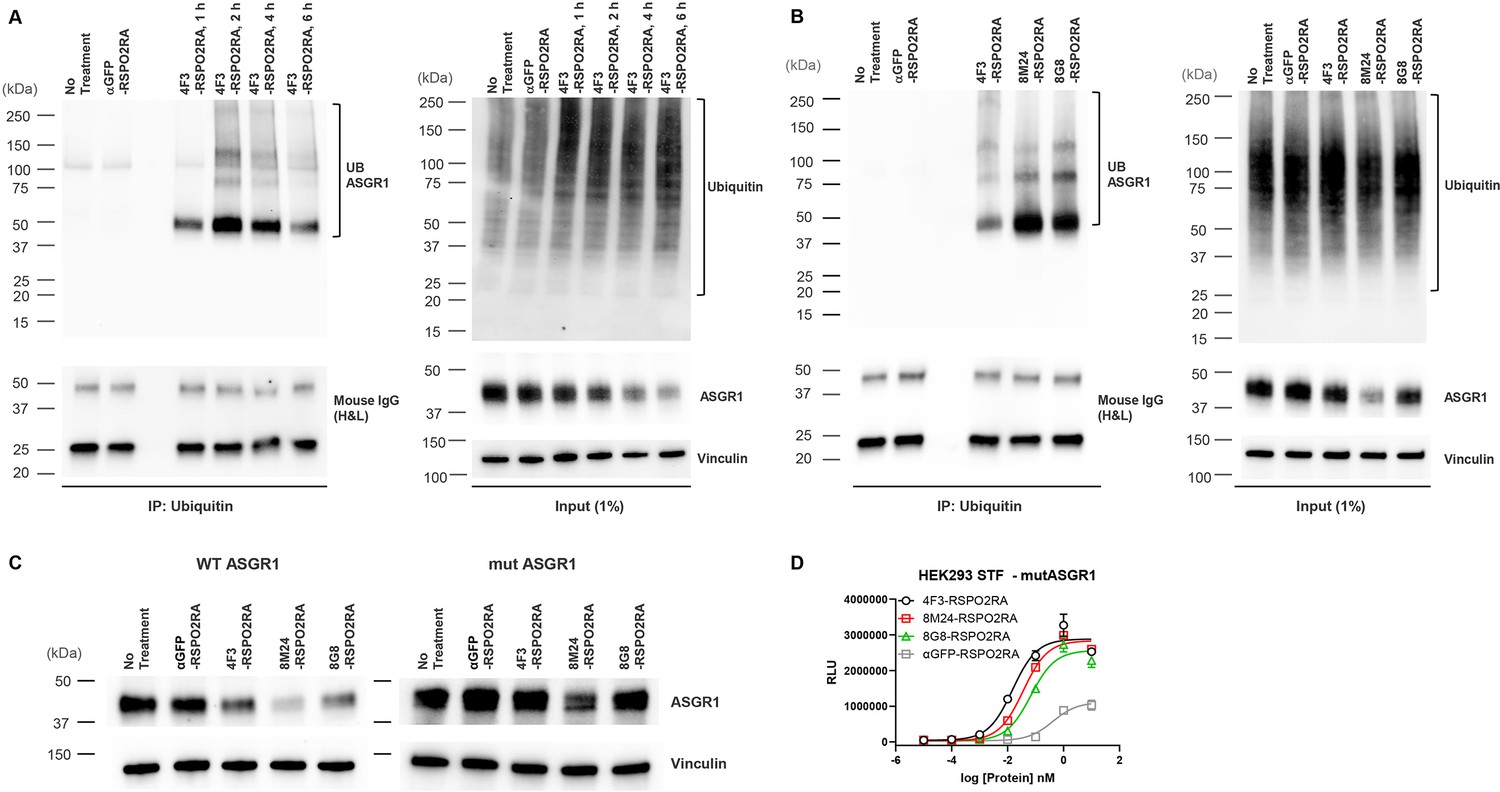
SWEETS induce degradation of ASGR1 by recruitment of E3 ubiquitin ligase activity.
(A) Levels of total and immunoprecipitated ubiquitin and ASGR1 in HepG2 cells subjected to ubiquitin immunoprecipitation (IP) following treatment with 10 nM 4F3-RSPO2RA for the indicated time (1, 2, 4, and 6 hr). The controls (fresh media and 10 nM αGFP-RSPO2RA) were treated for 2 hr before harvest. (B) Levels of total and immunoprecipitated ubiquitin and ASGR1 in HepG2 cells subjected to ubiquitin IP following treatment with 10 nM 4F3-, 8M24-, 8G8-RSPO2RA or the controls (fresh media or 10 nM αGFP-RSPO2RA) for 2 hr. (C) Western blot analysis results demonstrating ASGR1 degradation in HEK293 STF cells transfected with wild-type ASGR1 and treated with SWEETS compared with cells transfected with mutant ASGR1 that lacks lysine in the cytoplasmic domain. The western blot data are representative of two independent experiments. (D) Mutating lysine residues in the cytoplasmic domain of ASGR1 does not affect ASGR1-dependent SWEETS activity. Data are representative of three independent experiments performed in triplicate and are shown as mean ± standard deviation (SD).
-
Figure 7—source data 1
Source data files include raw unedited and uncropped blots with the relevant bands clearly labeled shown in Figure 7A.
- https://cdn.elifesciences.org/articles/93908/elife-93908-fig7-data1-v1.zip
-
Figure 7—source data 2
Source data files include raw unedited and uncropped blots with the relevant bands clearly labeled shown in Figure 7B.
- https://cdn.elifesciences.org/articles/93908/elife-93908-fig7-data2-v1.zip
-
Figure 7—source data 3
Source data files include raw unedited and uncropped blots with the relevant bands clearly labeled shown in Figure 7C.
- https://cdn.elifesciences.org/articles/93908/elife-93908-fig7-data3-v1.zip
-
Figure 7—source data 4
Excel file contains STF raw reading in Figure 7D.
- https://cdn.elifesciences.org/articles/93908/elife-93908-fig7-data4-v1.xlsx
Tables
Table 1
Kinetic parameters of ASGR1 and ASGR2 binding to 8M24 and 8G8 antibodies.
| Load sample | Analyte | KD (nM) | KD (M) | kon (1/Ms) | kdis (1/s) |
|---|---|---|---|---|---|
| 8M24-IgG | hASGR1CRD | <1.0E−3 | <1.0E−12 | 7.39E+05 | <1.0E−07 |
| 8G8-IgG | hASGR1CRD | 1.69 | 1.69E−09 | 5.48E+05 | 9.25E−04 |
| 8G8-IgG | mASGR1CRD | 340 | 3.40E−07 | 5.34E+05 | 1.81E−01 |
| 8G8-IgG | hASGR2CRD | 331 | 3.31E−07 | 2.59E+05 | 8.56E−02 |
| 8G8-IgG | mASGR2CRD | 51,500 | 5.01E−05 | 6.91E+03 | 3.46E−01 |
-
Note: 8M24-IgG does not bind to mASGR1, hASGR2, and mASGR2 (Figure 1B).
Table 2
Crystallography structure determination statistics.
| Data collection | hASGR1CRD:8M24 | hASGR2CRD:8G8 |
|---|---|---|
| PDB code | 8TS0 | 8URF |
| Beamline | ALS BCSB 5.0.2 | ALS BCSB 5.0.2 |
| Wavelength (Å) | 0.9999 | 0.9999 |
| Space group | P212121 | H32 |
| Unit-cell dimensions (Å) | a = 38.9, b = 90.3, c = 167.8 | a = b = 102.41, c = 358.98 |
| Matthew’s coefficient (Å3/Da) | 2.17 | 2.71 |
| Solvent content (%) | 43.20 | 54.56 |
| Resolution (Å) | 38.91–1.70 (1.73–1.70) | 38.90–1.85 (1.94–1.90) |
| Number of unique reflections | 66,288 (3439) | 57,655 (3681) |
| Completeness (%) | 100 (100) | 100 (100) |
| CC1/2 (%) | 99.9 (40.7) | 99.9 (44.0) |
| I/σ(I) | 14.7 (0.9) | 16.3 (1.2) |
| Rmeas | 0.107 (2.923) | 0.109 (3.273) |
| Rpim | 0.030 (0.789) | 0.025 (0.718) |
| Multiplicity | 13.0 (13.6) | 19.8 (20.7) |
| Refinement | ||
| Resolution (Å) | 38.05–1.70 (1.73–1.70) | 33.54–1.90 (1.97–1.90) |
| Number of unique reflections | 66,188 (2660) | 57,636 (5730) |
| Number of reflections for Rfree | 3233 (152) | |
| Rcryst (%) | 17.3 | 16.6 |
| Rfree (%) | 20.5 | 20.35 |
| r.m.s.d.’s from ideal values: | ||
| Bond length (Å) | 0.007 | 0.008 |
| Bond angles (°) | 0.870 | 0.940 |
| Average B-factors (Å2): | ||
| Protein | 32.8 | 48.6 |
| Water molecules | 41.0 | 51.6 |
| Ligands | 47.7 | 57.3 |
| Ramachandran plot: | ||
| MolProbity residues in | ||
| Favored region (%) | 97.63 | 98.15 |
| Allowed region (%) | 2.37 | 0.41 |
| Outliers (%) | 0.00 | 0.00 |
Key resources table
| Reagent type (species) or resource | Designation | Source or reference | Identifiers | Additional information |
|---|---|---|---|---|
| Cell line (Homo sapiens) | Expi293F cells | Thermo Fisher Scientific | A14527 | |
| Cell line (H. sapiens) | HEK293 STF | https://doi.org/10.1371/journal.pone.0009370 | Cells containing a luciferase gene controlled by a WNT-responsive promoter | |
| Cell line (H. sapiens) | Huh7 STF | https://doi.org/10.1038/s41598-020-70912-3 | Cells containing a luciferase gene controlled by a WNT-responsive promoter | |
| Cell line (H. sapiens) | HuH-7 | JCRB Cell Bank | JCRB0403 | |
| Cell line (H. sapiens) | Hep G2 | ATCC | HB-8065 | |
| Antibody | Rabbit polyclonal anti-Human ASGR1 antibody | Thermo Fisher | PA5-80356 | RRID:AB_2787681 1:1000 |
| Antibody | Rabbit polyclonal anti-LC3B antibody | Novus | NB100-2220 | RRID:AB_10003146 1:1000 |
| Antibody | Mouse monoclonal anti-Ubiquitin (eBioP4D1) antibody | Thermo Fisher | 14-6078-82 | RRID:AB_837154 1:500 |
| Antibody | Mouse monoclonal anti-Human Vinculin (V284) antibody | Bio-Rad | MCA465GA | RRID:AB_2214389 1:1000 |
| Antibody | Goat polyclonal anti-rabbit IgG H&L (HRP) | Abcam | ab205718 | RRID:AB_2819160 1:20,000 |
| Antibody | Goat polyclonal anti-mouse IgG H&L (HRP) | Abcam | ab205719 | RRID:AB_2755049 1:20,000 |
| Peptide, recombinant protein | Fc-R-spondin 2 | https://doi.org/10.1038/s41598-020-70912-3 | Produced in Expi293F cells | |
| Commercial assay or kit | Luciferase Assay System | Promega | E1501 | |
| Commercial assay or kit | Mem-PER Plus Membrane Protein Extraction Kit | Thermo Fisher | 89842 | |
| Commercial assay or kit | Pierce Classic Magnetic IP/Co-IP Kit | Thermo Fisher | 88804 | |
| Commercial assay or kit | Rapid Gold BCA Protein Assay Kit | Thermo Fisher | A53225/A53226 | Discontinued at Thermo Fisher, Use alternatives. |
| Recombinant DNA reagent | ASGR1 | GenScript | OHU03658D | Accession No. NM_001671 |
| Recombinant DNA reagent | pAmCyan1-N1 | Takara Bio | 632442 | |
| Chemical compound, drug | IWP2 | Tocris Bioscience | 3533 | Porcupine inhibitor |
| Software, algorithm | Octet Data Analysis 9.0 | Sartorius | https://www.sartorius.com/en/products/biolayer-interferometry/octet-systems-software | RRID:SCR_023267 |
| Software, algorithm | Prism | GraphPad | https://www.graphpad.com/scientific-software/prism/ | RRID:SCR_002798 |
| Software, algorithm | MOE | Chemical Computing Group | https://www.chemcomp.com/ | RRID:SCR_014882 |
| Software, algorithm | PyMol | Schrödinger | https://pymol.org/ | RRID:SCR_000305 |
| Other | cOmplete His-Tag purification resin | Sigma-Aldrich | 5893801001 | Used for protein purification (methods) |
| Other | CaptivA Protein A affinity resin | Repligen | CA-PRI-0100 | Used for protein purification (methods) |
| Other | Superdex 200 Increase 10/300 GL | Cytiva | 28990944 | Used for protein purification (methods) |
| Other | Anti-hIgG Fc Capture (AHC) biosensors | Sartorius | 18-5060 | Used for protein-binding determination (methods) |
Additional files
Download links
A two-part list of links to download the article, or parts of the article, in various formats.
Downloads (link to download the article as PDF)
Open citations (links to open the citations from this article in various online reference manager services)
Cite this article (links to download the citations from this article in formats compatible with various reference manager tools)
Targeted protein degradation systems to enhance Wnt signaling
eLife 13:RP93908.
https://doi.org/10.7554/eLife.93908.3


