Enhancing TCR specificity predictions by combined pan- and peptide-specific training, loss-scaling, and sequence similarity integration
- Department of Health Technology, Section for Bioinformatics, Technical University of Denmark, Denmark
Figures
Figure 1
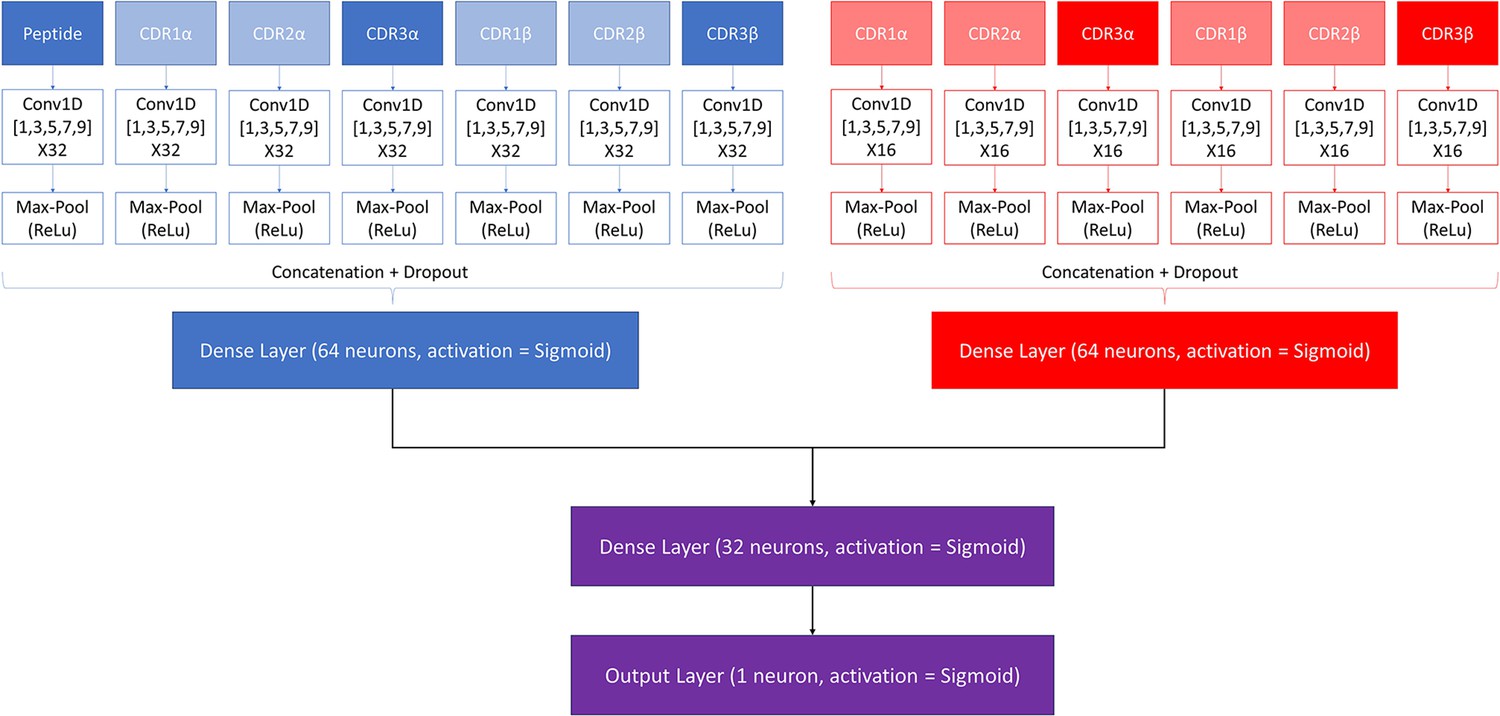
Architecture of the pre-trained model.
The pan-specific CNN block consists of the layers shown in blue, whereas the peptide-specific CNN block consists of the layers shown in red. During the pan-specific training, the weights and biases for the peptide-specific CNN block are frozen, whereas the opposite is the case during the peptide-specific training. The layers shown in purple are kept unfrozen during both training steps.
Figure 2
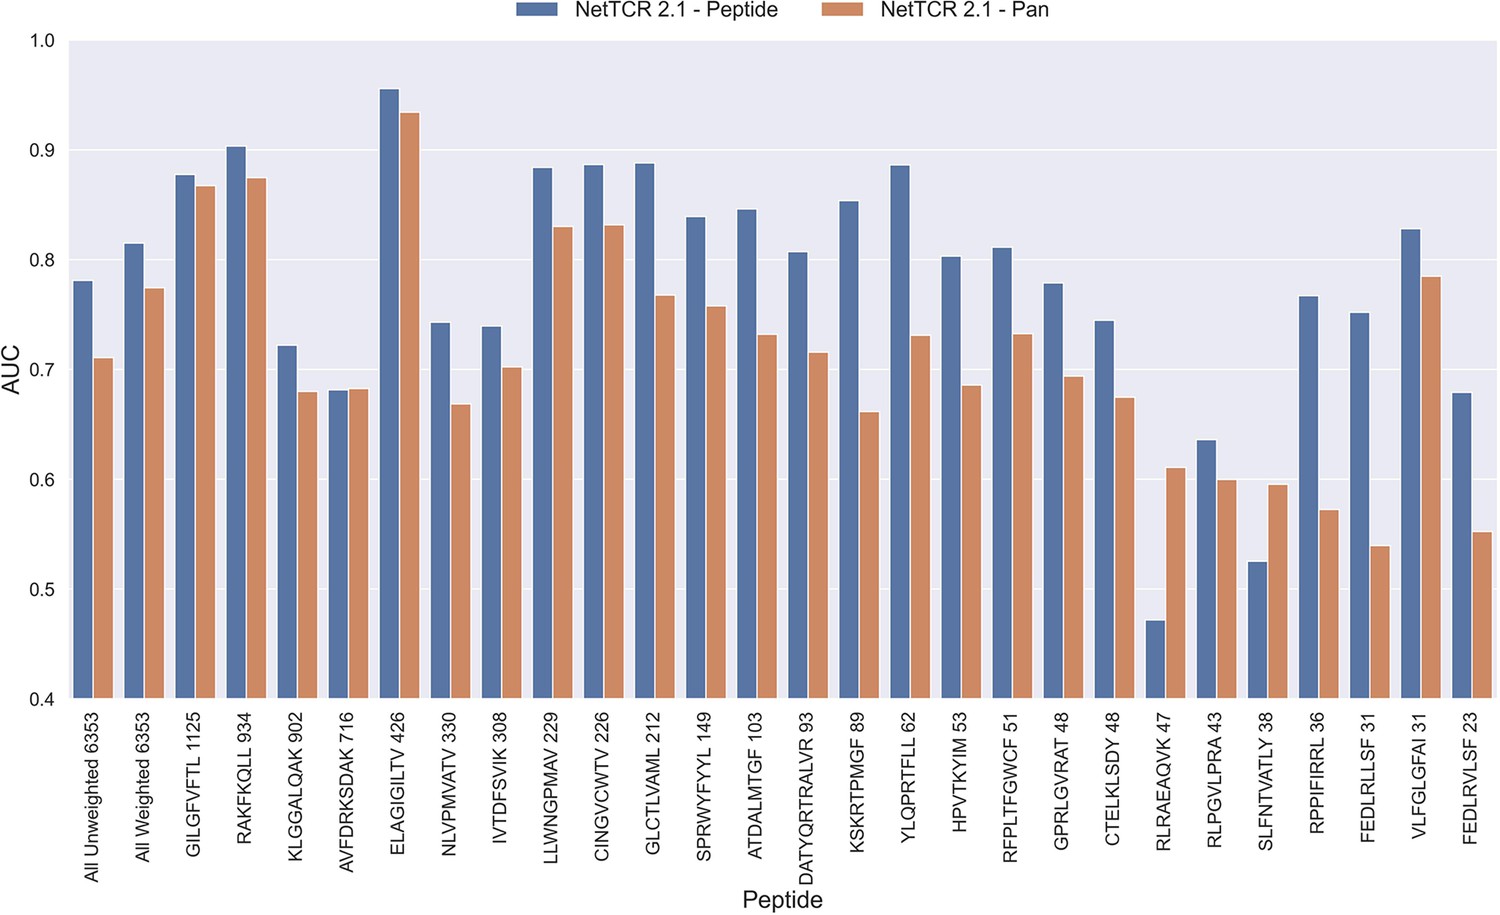
Per peptide performance of the peptide-specific and pan-specific NetTCR 2.1 in terms of AUC, when trained and evaluated on the new dataset.
The peptides are sorted based on the number of positive observations from most abundant to least abundant, with the number of positive observations listed next to the peptide sequence. The unweighted (direct) mean of AUC across all peptides is shown furthest to the left, while the weighted mean is shown second furthest to the left. The weighted mean is weighted by the number of positive observations per peptide and puts more emphasis on the peptides with the most observations. The models included in this figure corresponds to model 1 (NetTCR 2.1 - Pan) and model 2 (NetTCR 2.1 - Peptide) in Supplementary file 1.
Figure 3 with 1 supplement
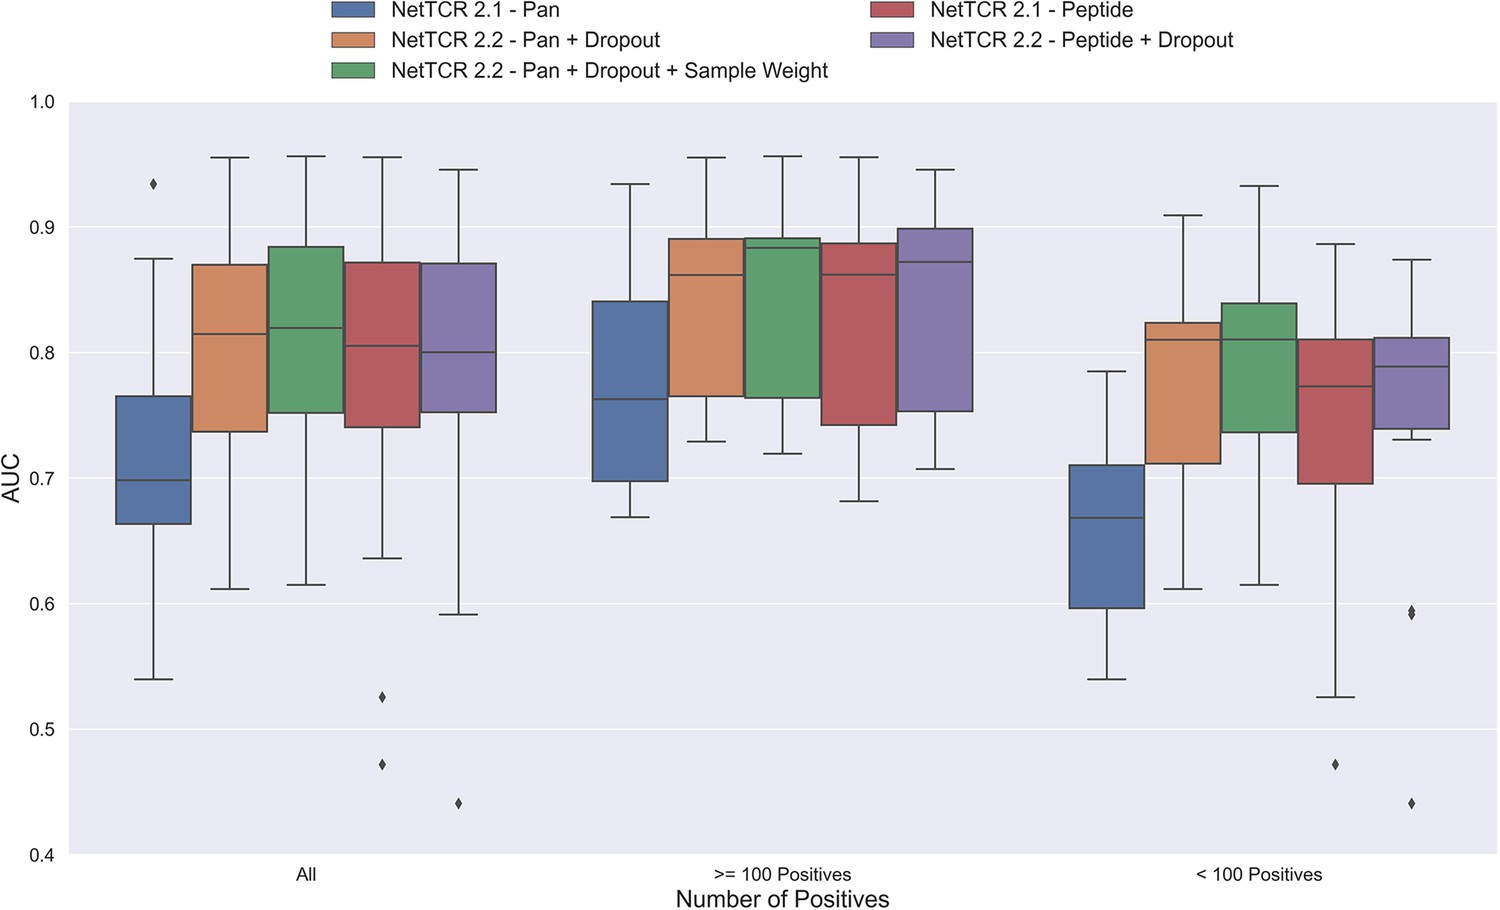
Boxplot of AUC of the pan- and peptide-specific NetTCR 2.1 and 2.2 models, respectively.
The NetTCR 2.2 models include the updates to the model architecture, with the primary change being the introduction of dropout for the concatenated max-pooling layer (dropout rate = 0.6). Both the introduction of dropout and sample weights are shown to result in considerably improved performance for the pan-specific model. Separate boxplots are shown for all peptides, as well as separately for peptides with at least 100 positive observations and peptides with less than 100 positive observations, to highlight the effect of introducing dropout and sample weight for the least abundant peptides. The models included in this figure corresponds to model 1 (NetTCR 2.1 - Pan), model 3 (NetTCR 2.2 - Pan +Dropout), model 4 (NetTCR 2.2 - Pan +Dropout + Sample Weight), model 2 (NetTCR 2.1 - Peptide) and model 5 (NetTCR 2.2 - Peptide +Dropout) in Supplementary file 1.
Figure 3—figure supplement 1
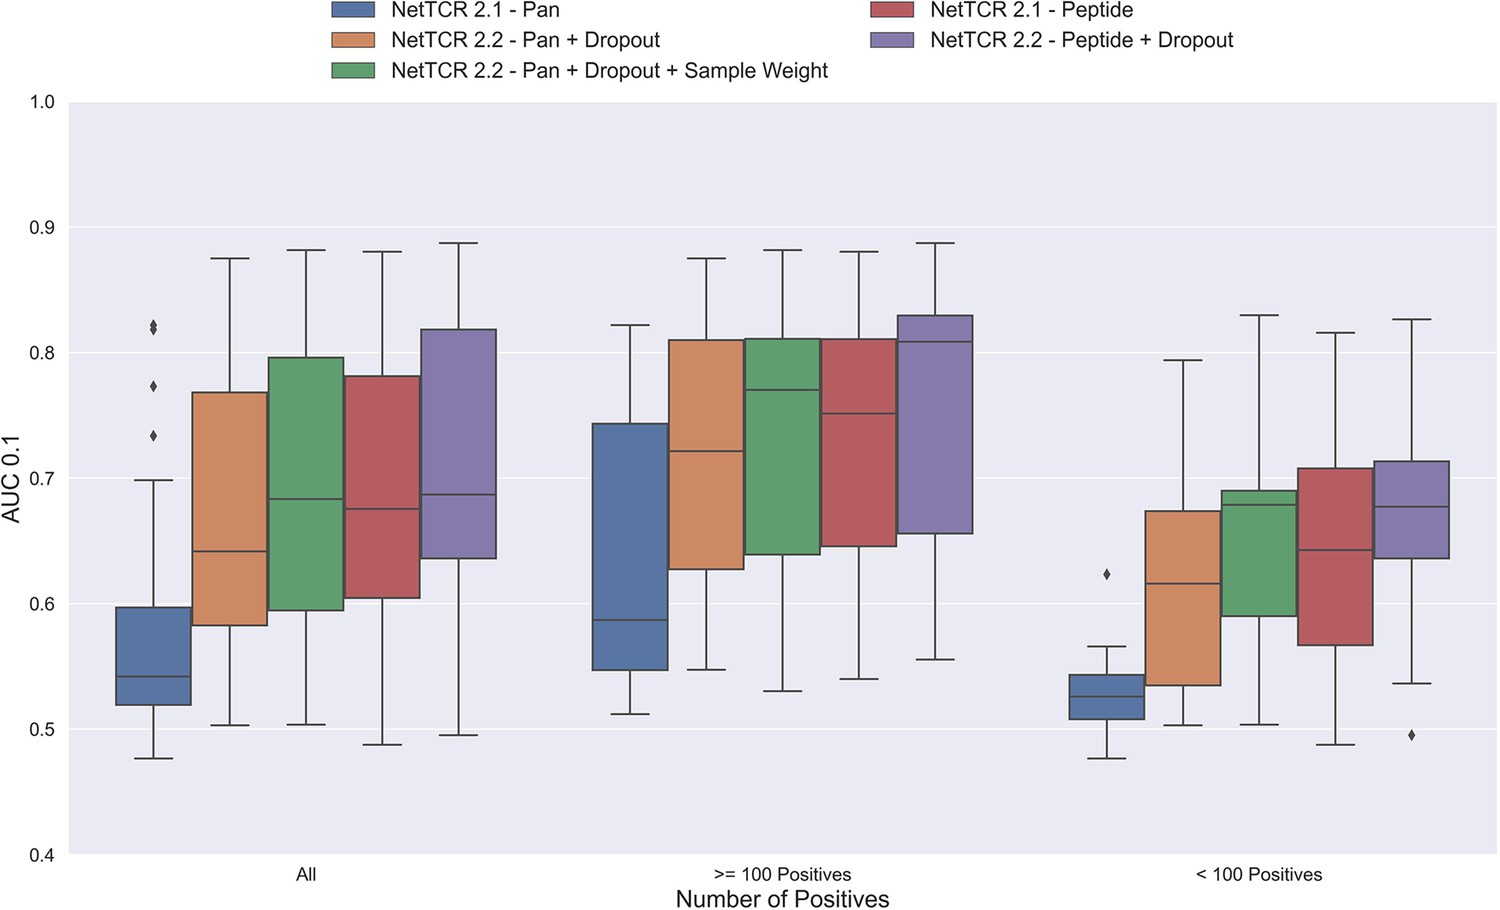
Boxplot of AUC 0.1 of the pan- and peptide-specific NetTCR 2.1 and 2.2 models, respectively.
The NetTCR 2.2 models include the updates to the model architecture, with the primary change being the introduction of dropout for the concatenated max-pooling layer (dropout rate = 0.6). Both the introduction of dropout and sample weights are shown to result in considerably improved performance for the pan-specific model. Separate boxplots are shown for all peptides, as well as separately for peptides with at least 100 positive observations and peptides with less than 100 positive observations, to highlight the effect of introducing dropout and sample weight for the least abundant peptides. The models included in this figure corresponds to model 1 (NetTCR 2.1 - Pan), model 3 (NetTCR 2.2 - Pan +Dropout), model 4 (NetTCR 2.2 - Pan +Dropout + Sample Weight), model 2 (NetTCR 2.1 - Peptide), and model 5 (NetTCR 2.2 - Peptide +Dropout) in Supplementary file 1.
Figure 4
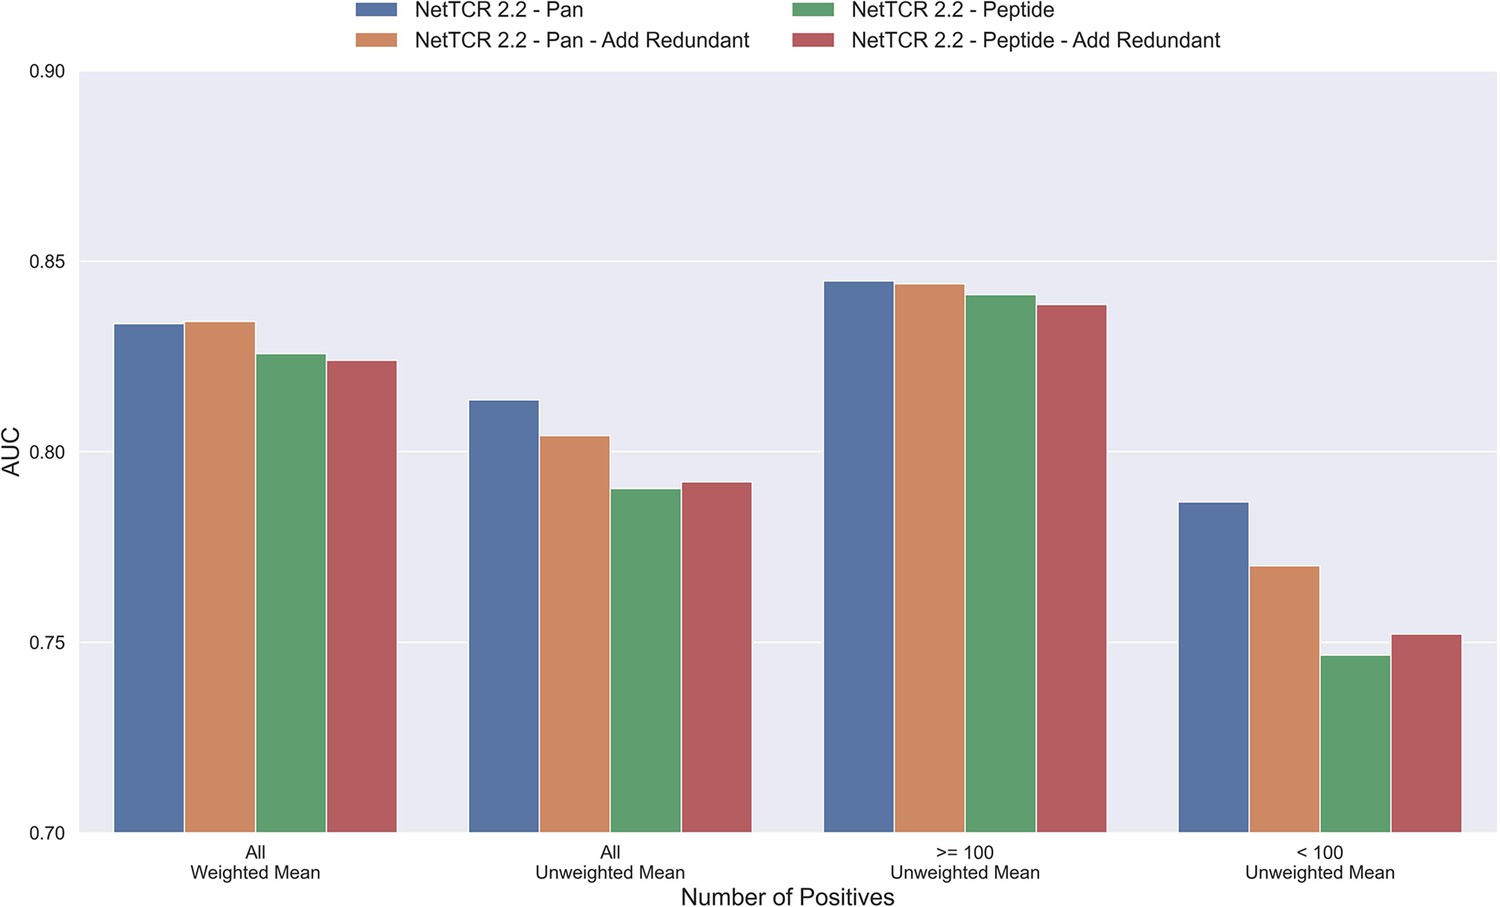
Mean AUC of the pan-specific and peptide-specific NetTCR 2.2 models, when training on the original redundancy reduced training data, and with redundant observations back.
The AUC is reported in terms of weighted and unweighted mean across all peptides, as well as unweighted mean when the data is split into peptides with at least 100 positive observations, and less than 100 positive observations. The models included in this figure corresponds to model 4 (NetTCR 2.2 - Pan), model 6 (NetTCR 2.2 - Pan - Add Redundant), model 5 (NetTCR 2.2 - Peptide), and model 7 (NetTCR 2.2 - Peptide - Add Redundant) in Supplementary file 1.
Figure 5 with 3 supplements
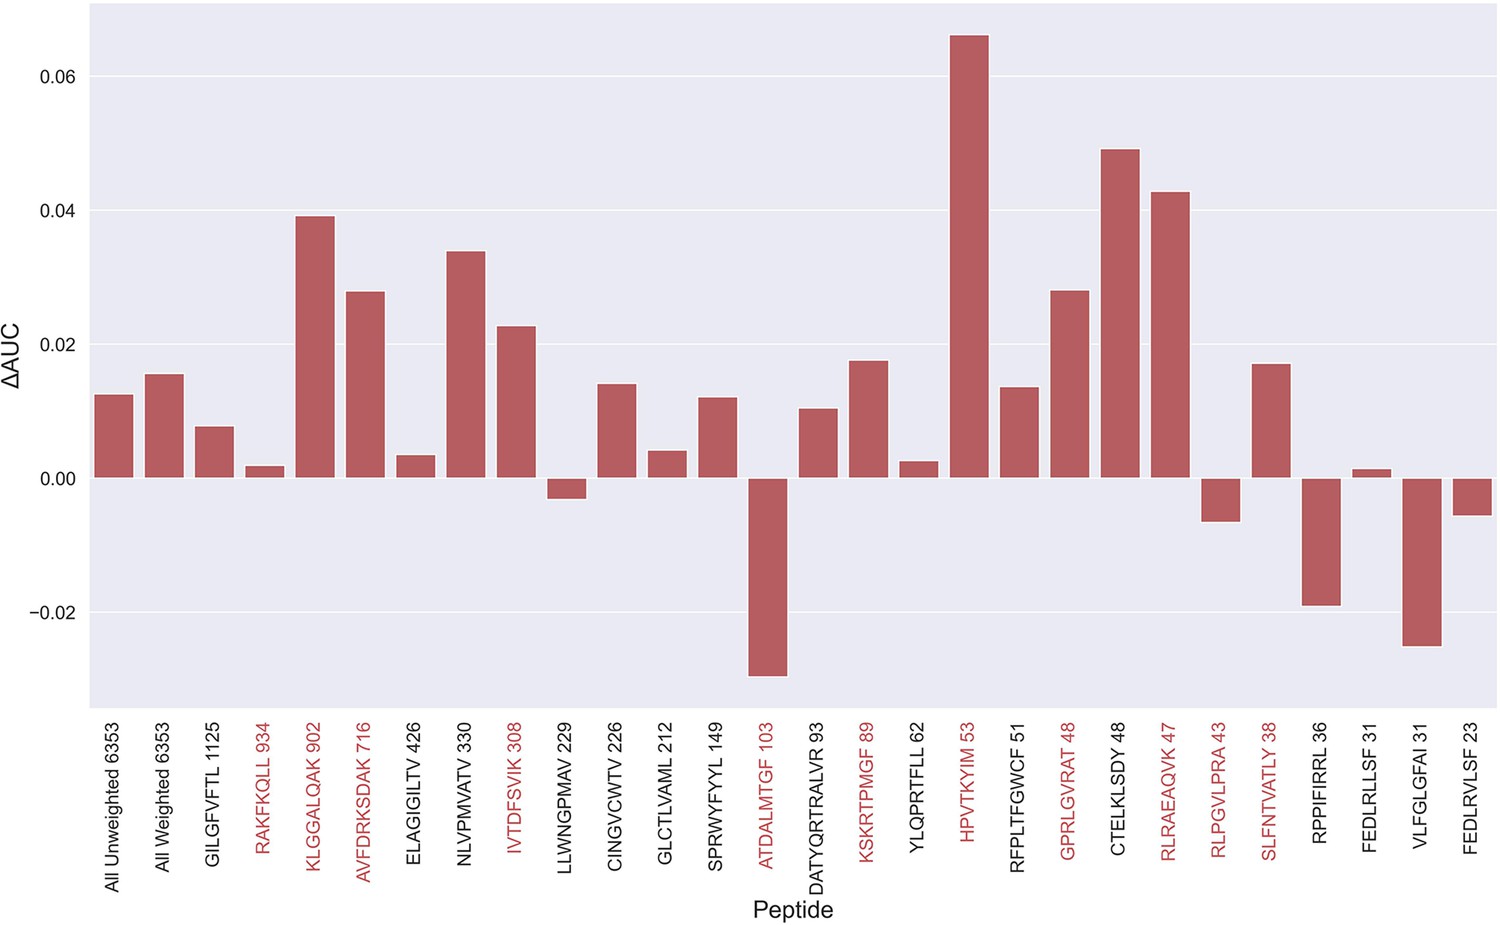
Difference in AUC between pan-specific CNN trained on the limited dataset (70th percentile) and full dataset.
Peptides with TCRs originating solely from 10 x sequencing are highlighted in red. The performance was in both cases evaluated per peptide on the full dataset. A positive ΔAUC indicates that the model trained on the limited dataset performs better than the model trained on the full dataset. The performance differences are based on the performance of model 10 and model 4 in Supplementary file 1, with model 4 being the baseline.
Figure 5—figure supplement 1
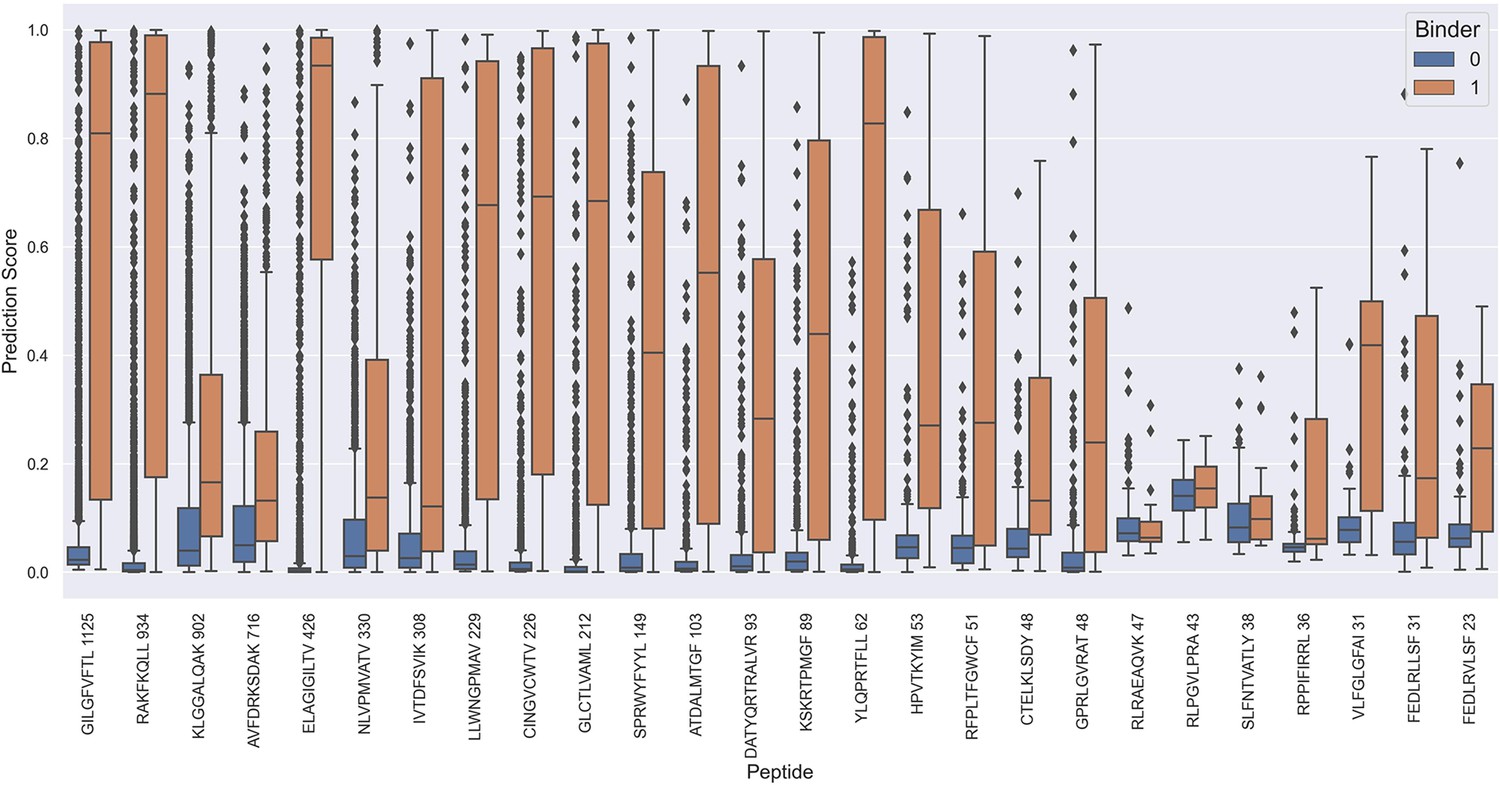
Prediction values on the full test data for each peptide when predicted using the NetTCR 2.2 - Peptide model.
The prediction scores are shown for model 5 in Supplementary file 1.
Figure 5—figure supplement 2
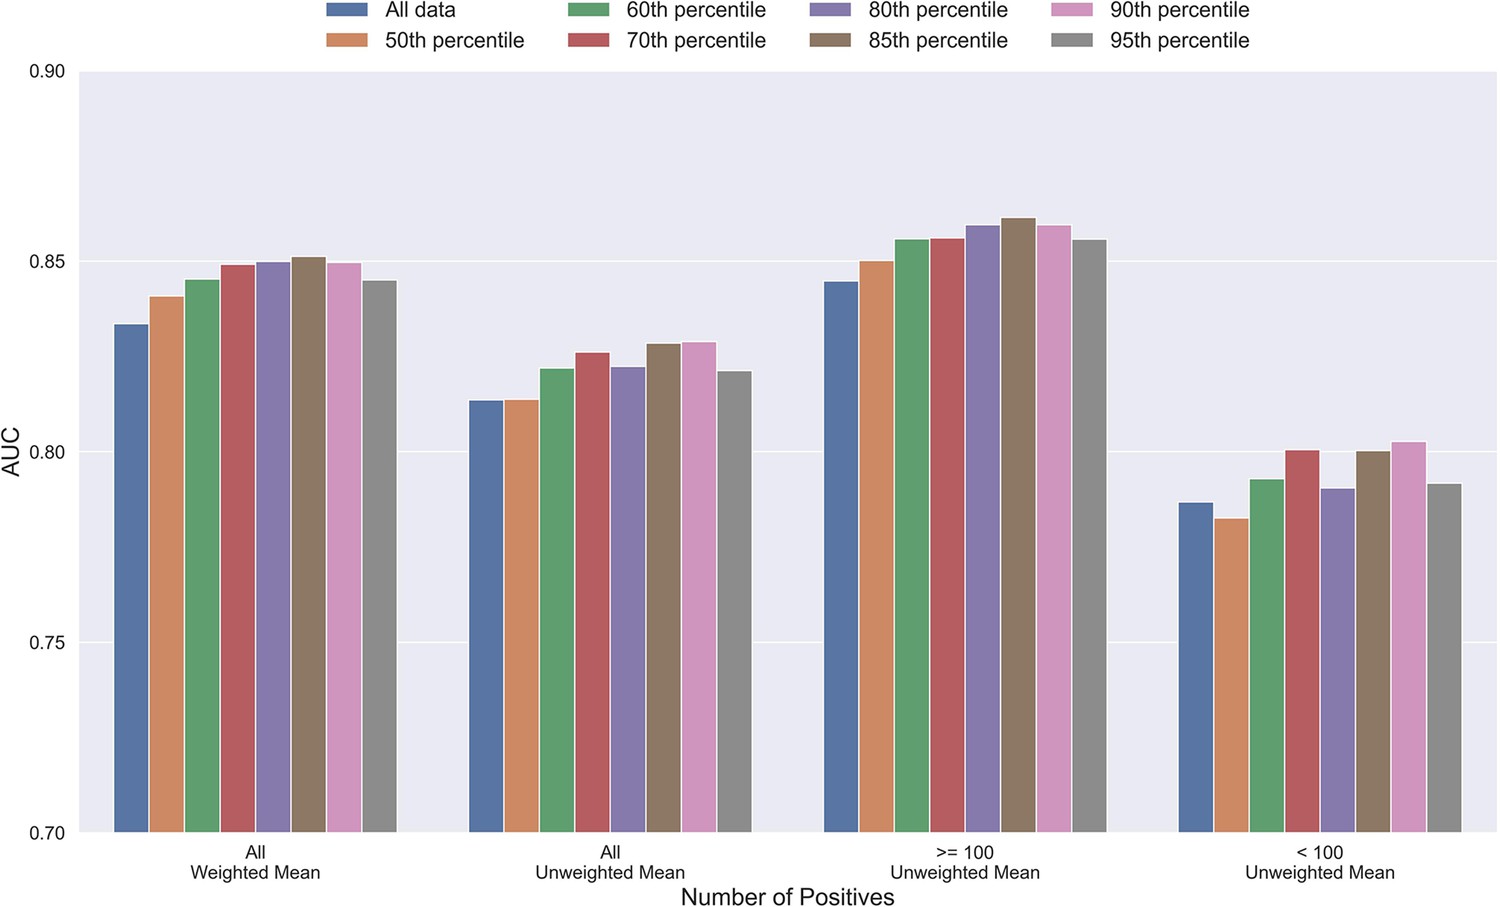
Mean AUC of the pan-specific NetTCR 2.2 models when trained on datasets with potential outliers removed.
The percentile refers to the threshold of prediction scores used for removing observations (see Materials and methods), and the higher the percentile is, the more observations are removed from training. The AUC is reported in terms of weighted and unweighted mean across all peptides, as well as unweighted mean when the data is split into peptides with at least 100 positive observations, and less than 100 positive observations. The performance is based on model 4 (All data), model 8 (50th percentile), model 9 (60th percentile), model 10 (70th percentile), model 11 (80th percentile), model 12 (85th percentile), model 13 (90th percentile), and model 14 (95th percentile) in Supplementary file 1.
Figure 5—figure supplement 3
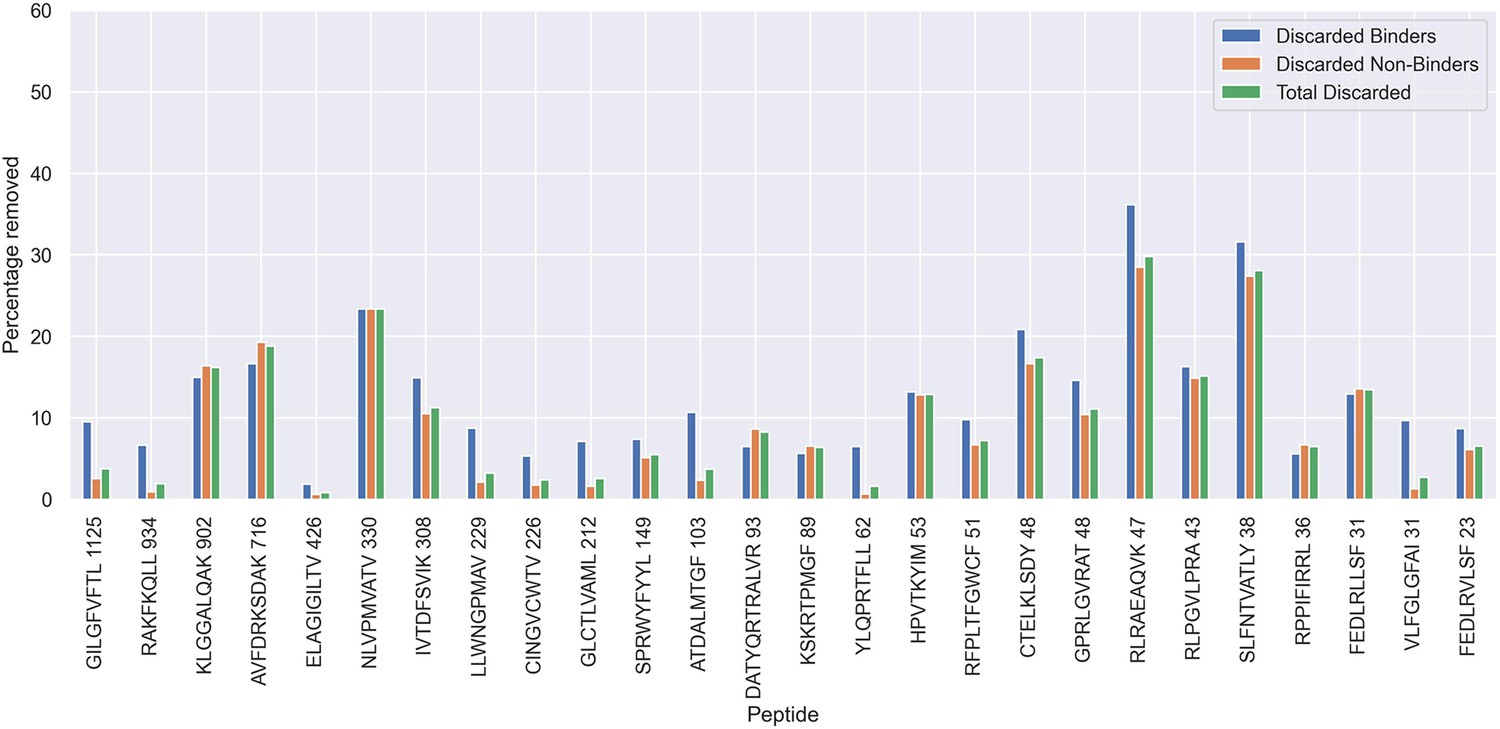
Percentage of observations discarded for the 70th percentile limited dataset, as a result of the removal of potential outliers.
Figure 6 with 1 supplement
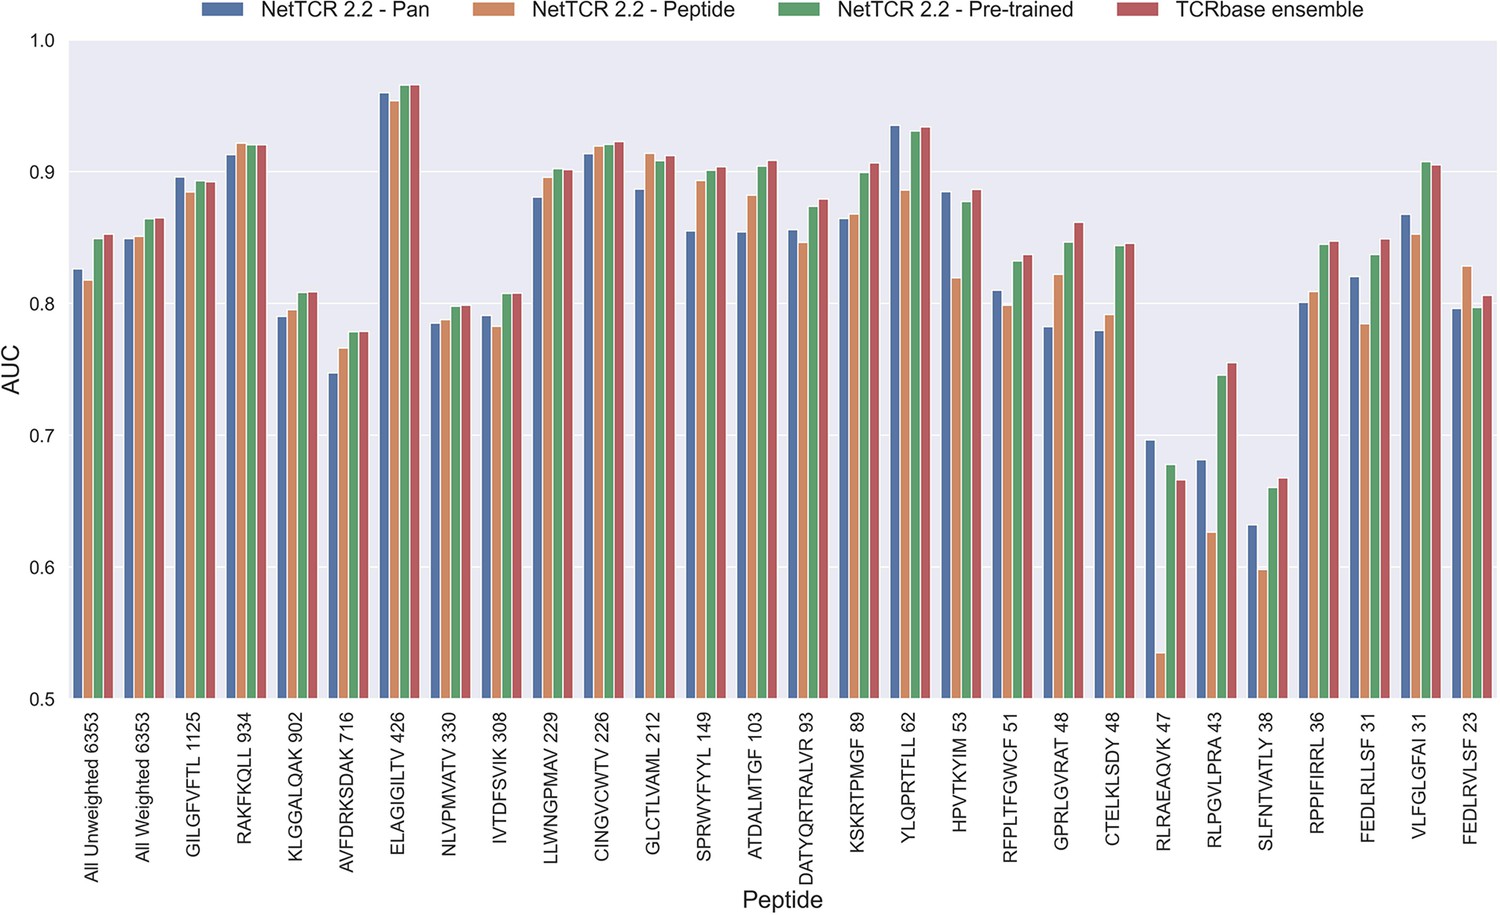
Per peptide performance of the updated peptide-specific, pan-specific, and pre-trained CNN in terms of AUC, when trained on the limited training dataset and evaluated on the full dataset.
The peptides are sorted based on the number of positive observations from most abundant to least abundant, with the number of positive observations listed next to the peptide sequence. The unweighted (direct) mean of AUC across all peptides is shown furthest to the left, while the weighted mean is shown second furthest to the left. The weighted mean is weighted by the number of positive observations per peptide and puts more emphasis on the peptides with the most observations. The models included in this figure corresponds to model 10 (NetTCR 2.2 - Pan), model 15 (NetTCR 2.2 - Peptide), model 16 (NetTCR 2.2 - Pre-trained) and model 17 (TCRbase ensemble) in Supplementary file 1.
Figure 6—figure supplement 1
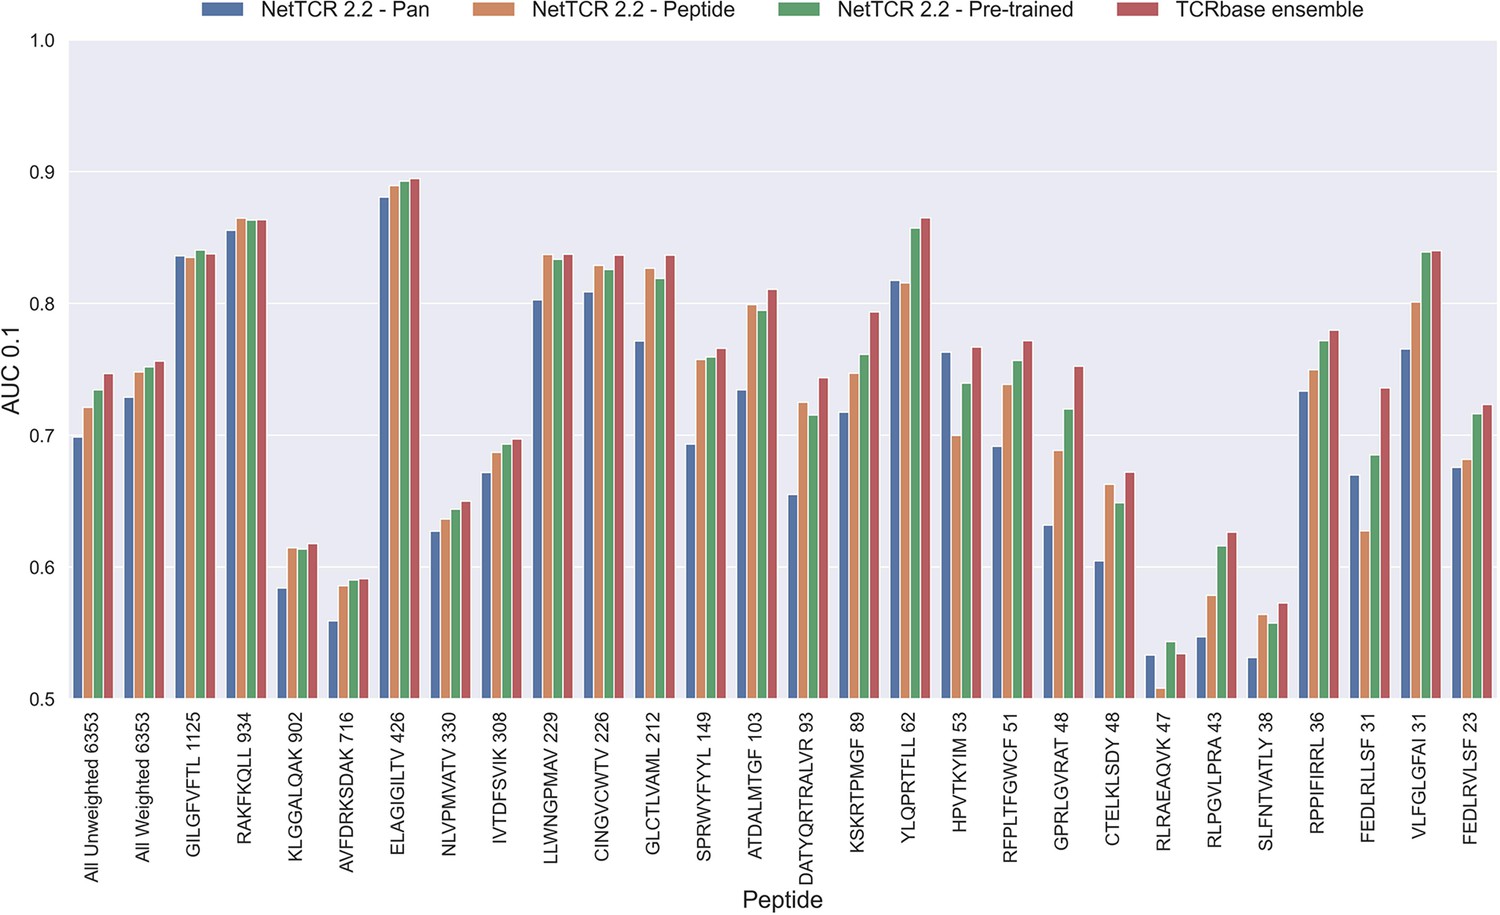
Per peptide performance of the updated peptide-specific, pan-specific, and pre-trained CNN in terms of AUC 0.1, when trained on the limited training dataset and evaluated on the full dataset.
The peptides are sorted based on the number of positive observations from most abundant to least abundant, with the number of positive observations listed next to the peptide sequence. The unweighted (direct) mean of AUC across all peptides is shown furthest to the left, while the weighted mean is shown second furthest to the left. The weighted mean is weighted by the number of positive observations per peptide and puts more emphasis on the peptides with the most observations. The models included in this figure corresponds to model 10 (NetTCR 2.2 - Pan), model 15 (NetTCR 2.2 - Peptide), model 16 (NetTCR 2.2 - Pre-trained), and model 17 (TCRbase ensemble) in Supplementary file 1.
Figure 7 with 1 supplement
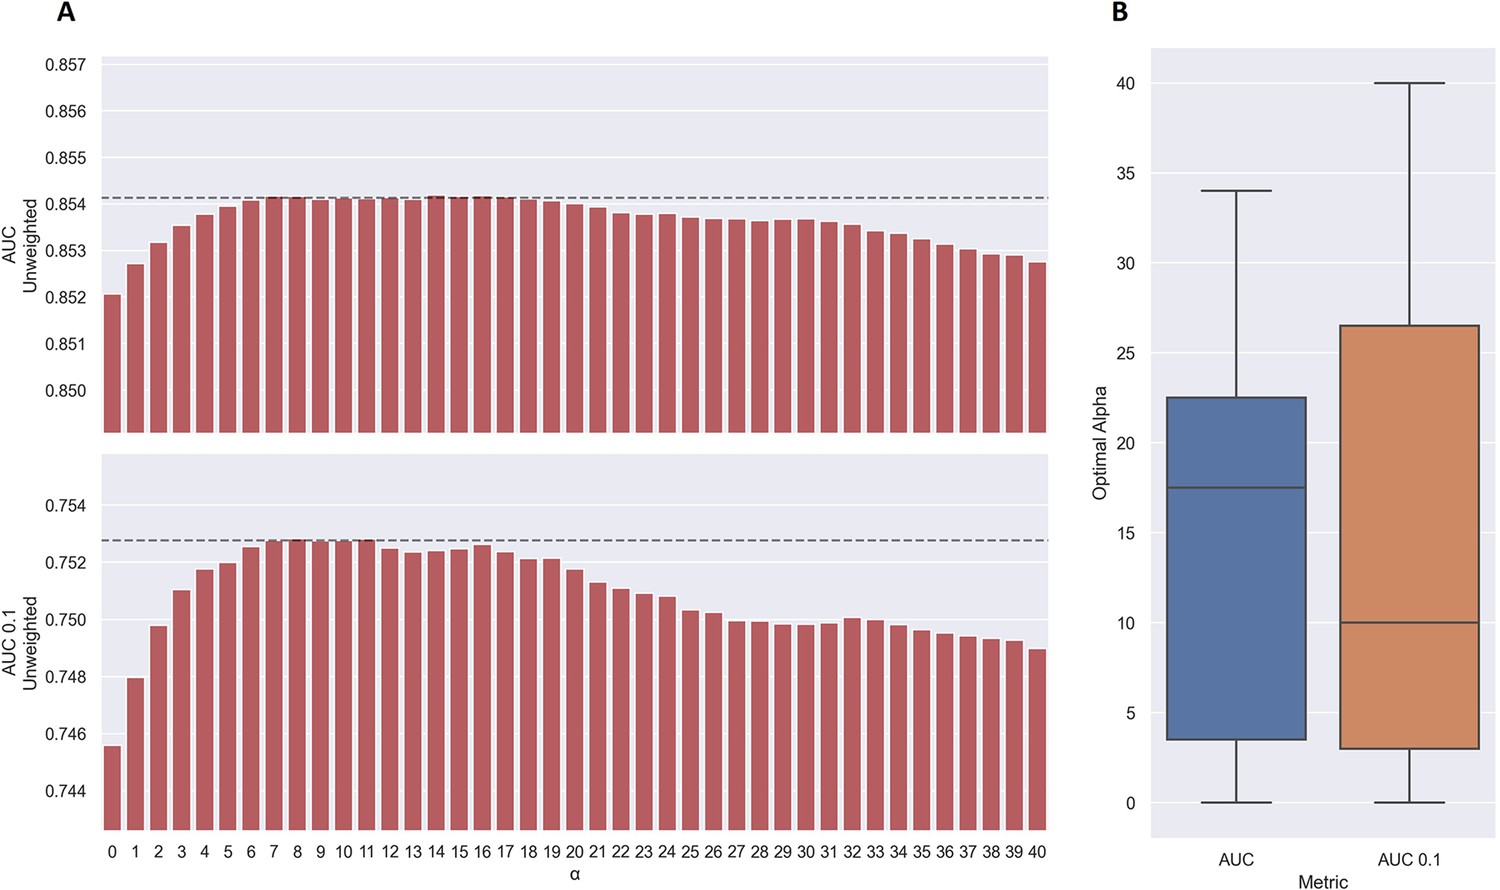
Performance of TCRbase ensemble as a function of α along with boxplot of optimal alpha in terms of AUC and AUC 0.1 for the validation partitions.
(A) The predictions of the pre-trained model ensemble (trained on the limited dataset) on the test partitions (full data) were scaled by the kernel similarity to known binders, as given by TCRbase with a weight of (1,1,3,1,1,3), to a power of α. The performance is given as the unweighted mean performance across all 26 peptides, in terms of AUC and AUC 0.1. The dashed line shows the performance when α is set to 10, which strikes a good balance between AUC and AUC 0.1. An α of zero corresponds to the model ensemble without the TCRbase scaling. (B) Boxplot of the optimal alpha scaling factor per cross-validation model, when evaluated in terms of AUC and AUC 0.1, respectively, on the validation partitions. The models used for calculating the performance of the ensembles in this figure are model 16 (NetTCR 2.2 - Pre-trained) and model 21 (TCRbase) in Supplementary file 1.
Figure 7—figure supplement 1
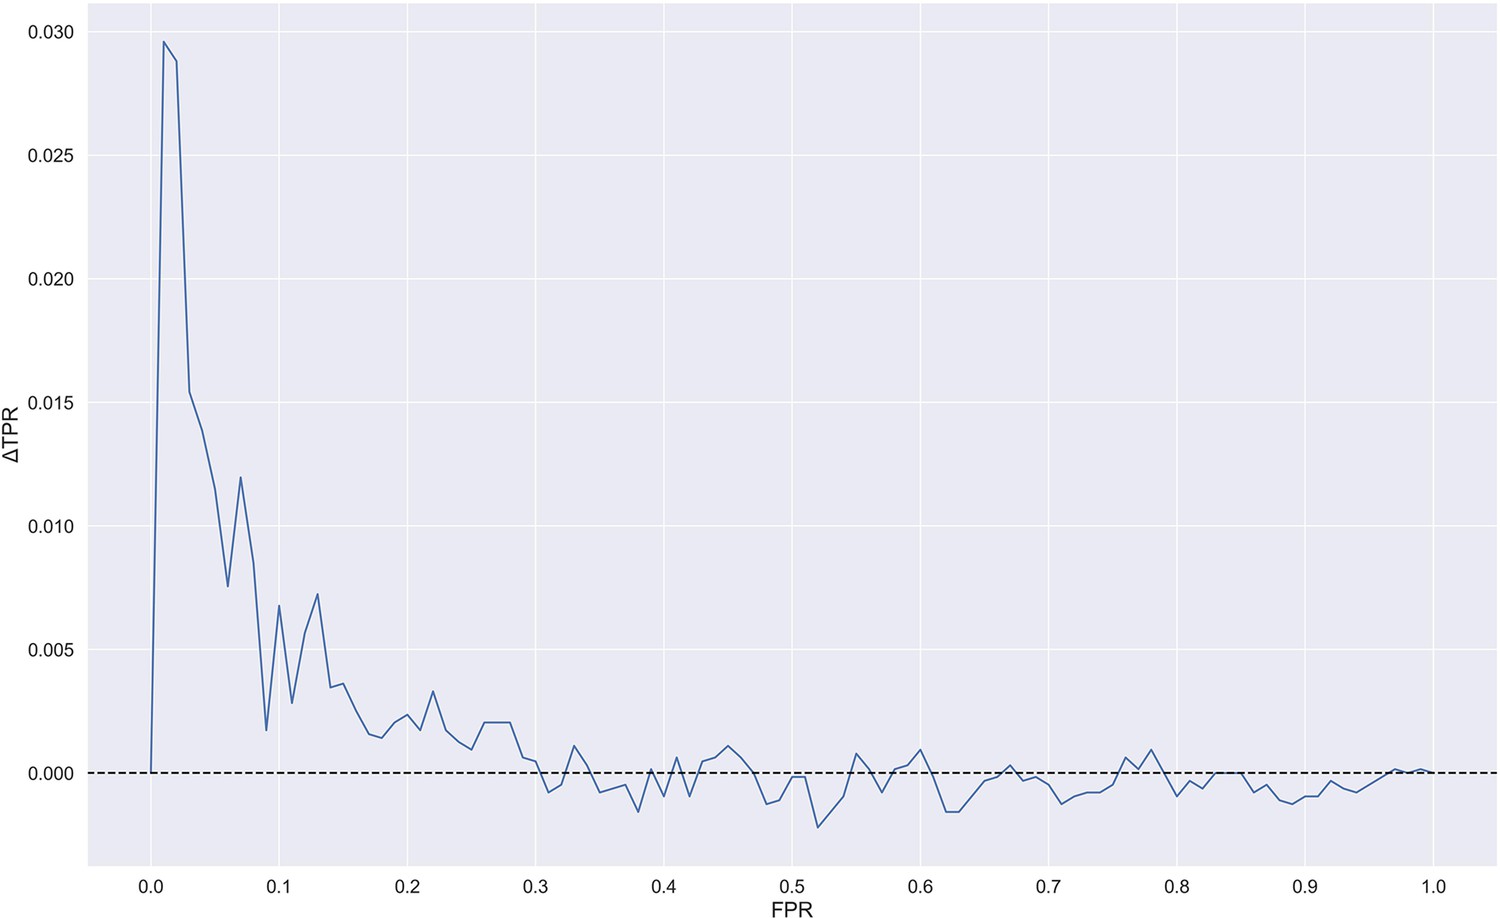
Difference in true positive rate (TPR) between TCRbase ensemble (pre-trained +TCRbase models) and pre-trained models as a function of false positive rate (FPR).
A positive ΔTPR corresponds to an increased performance of the TCRbase ensemble compared to the pre-trained models alone. The models used for this figure are model 16 (NetTCR 2.2 - Pre-trained) and model 17 (TCRbase ensemble) in Supplementary file 1.
Figure 8
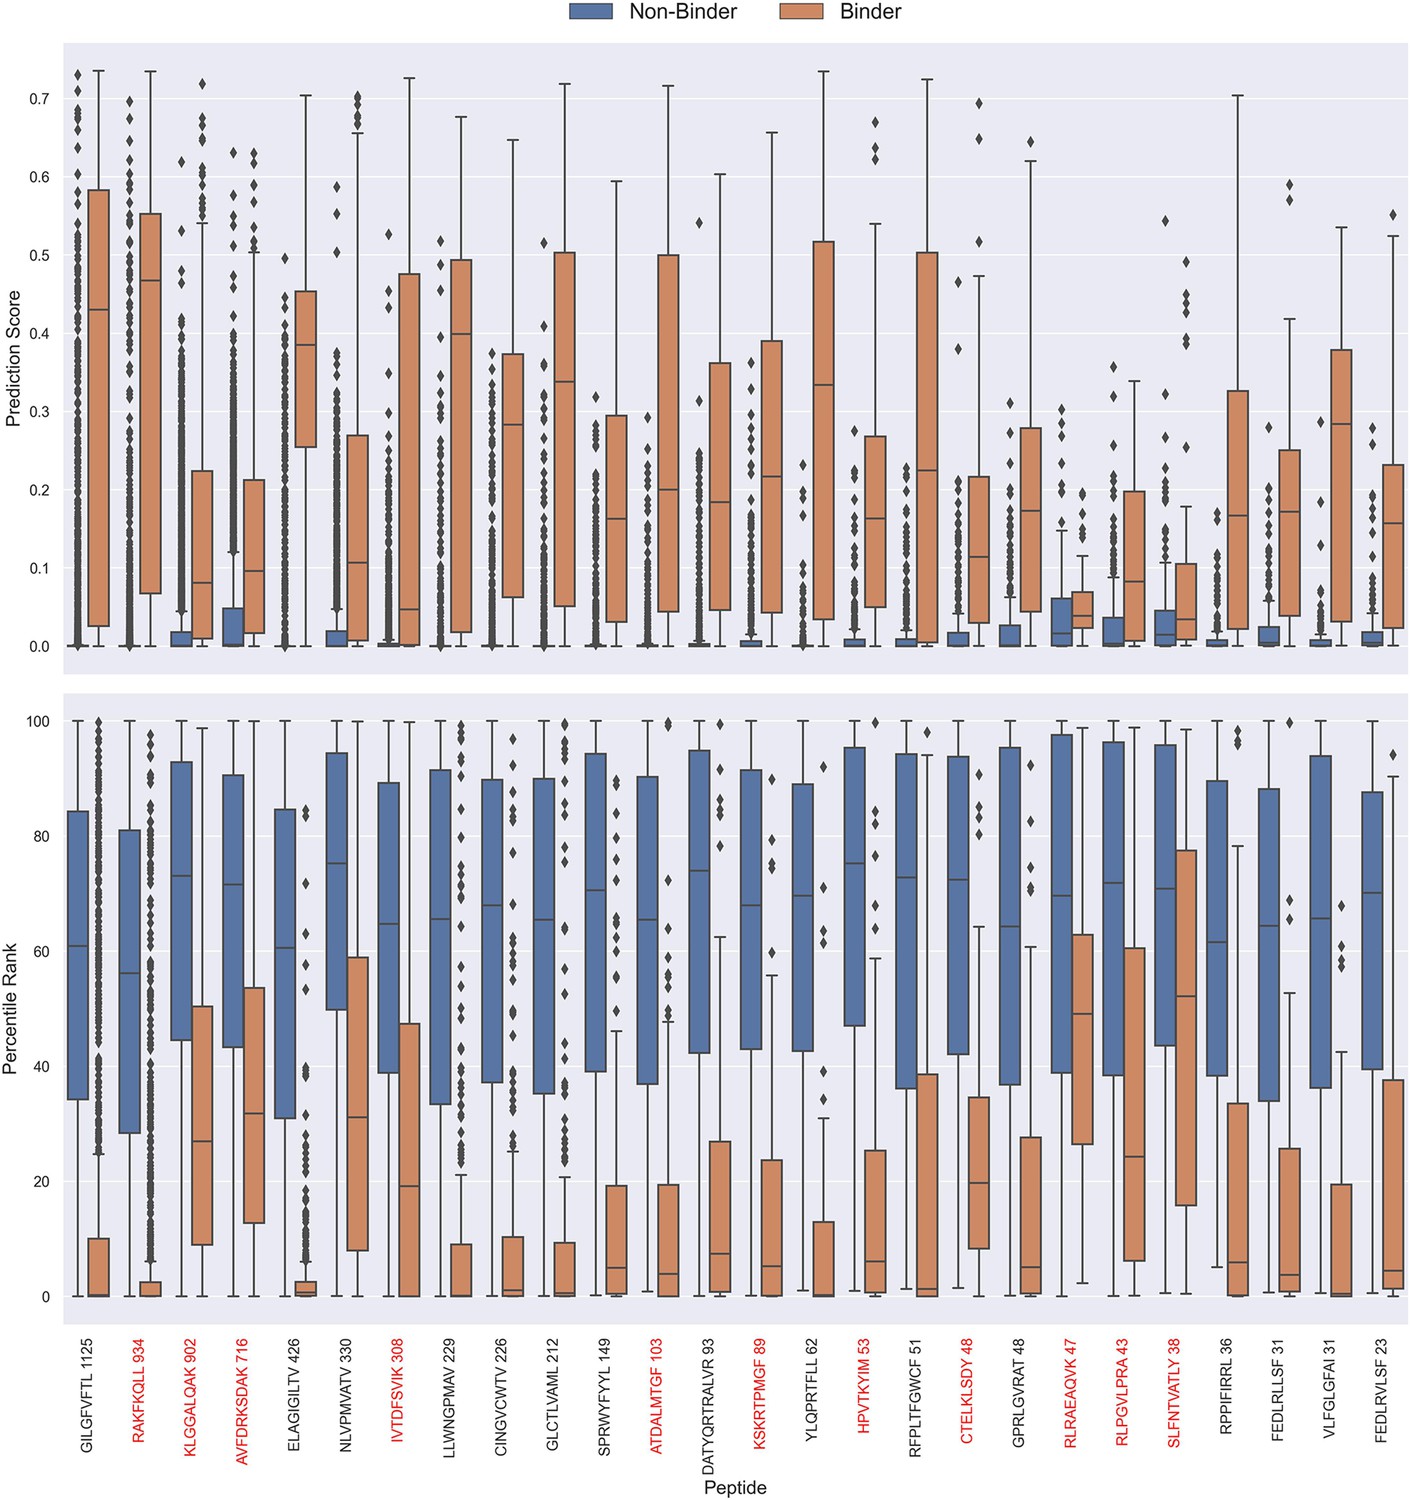
Boxplot of direct prediction scores and percentile ranks per peptide of the full test dataset for the TCRbase ensemble.
Peptides with 100% of positive observations coming from 10 X sequencing are highlighted in red. The model used in this figure is model 17 (TCRbase ensemble) in Supplementary file 1.
Figure 9 with 1 supplement
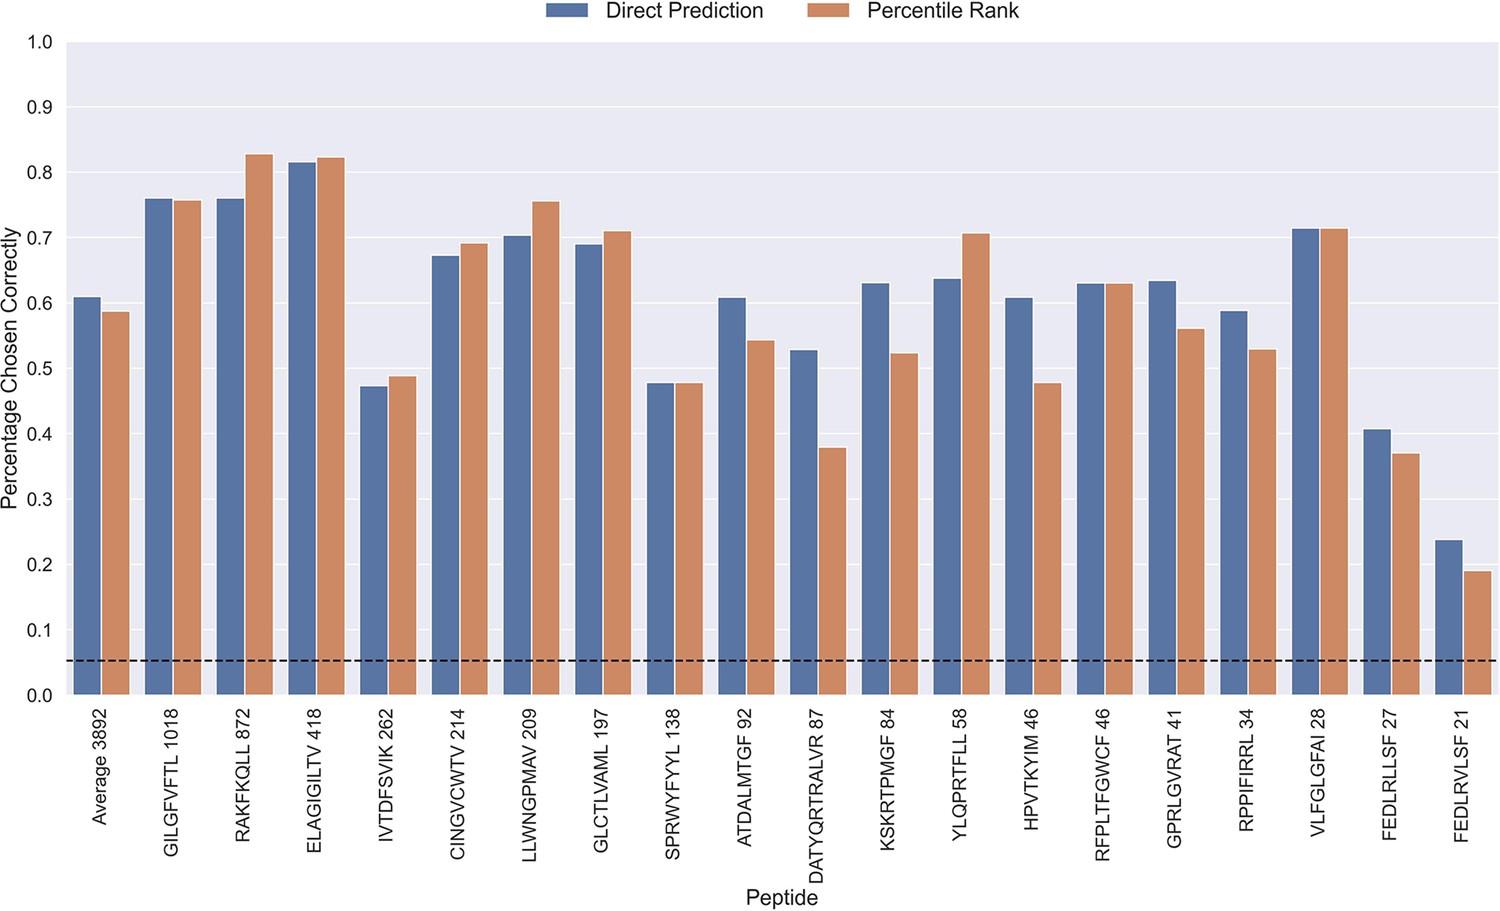
Percentage of correctly chosen true peptide-TCR pairs for each peptide in the limited dataset.
This was evaluated using the direct prediction score (blue) and the percentile rank (orange) of the TCRbase ensemble. KLGGALQAK, AVFDRKSDAK, NLVPMVATV, CTELKLSDY, RLRAEAQVK, RLPGVLPRA, and SLFNTVATLY were excluded from this analysis due to low predictive performance for these peptides (AUC 0.1<0.65). The numbers next to the peptides indicate the number of positive TCRs in the filtered dataset, and the dashed line indicates the expected value for a random prediction. The predictions are based on model 17 (TCRbase ensemble) in Supplementary file 1.
Figure 9—figure supplement 1
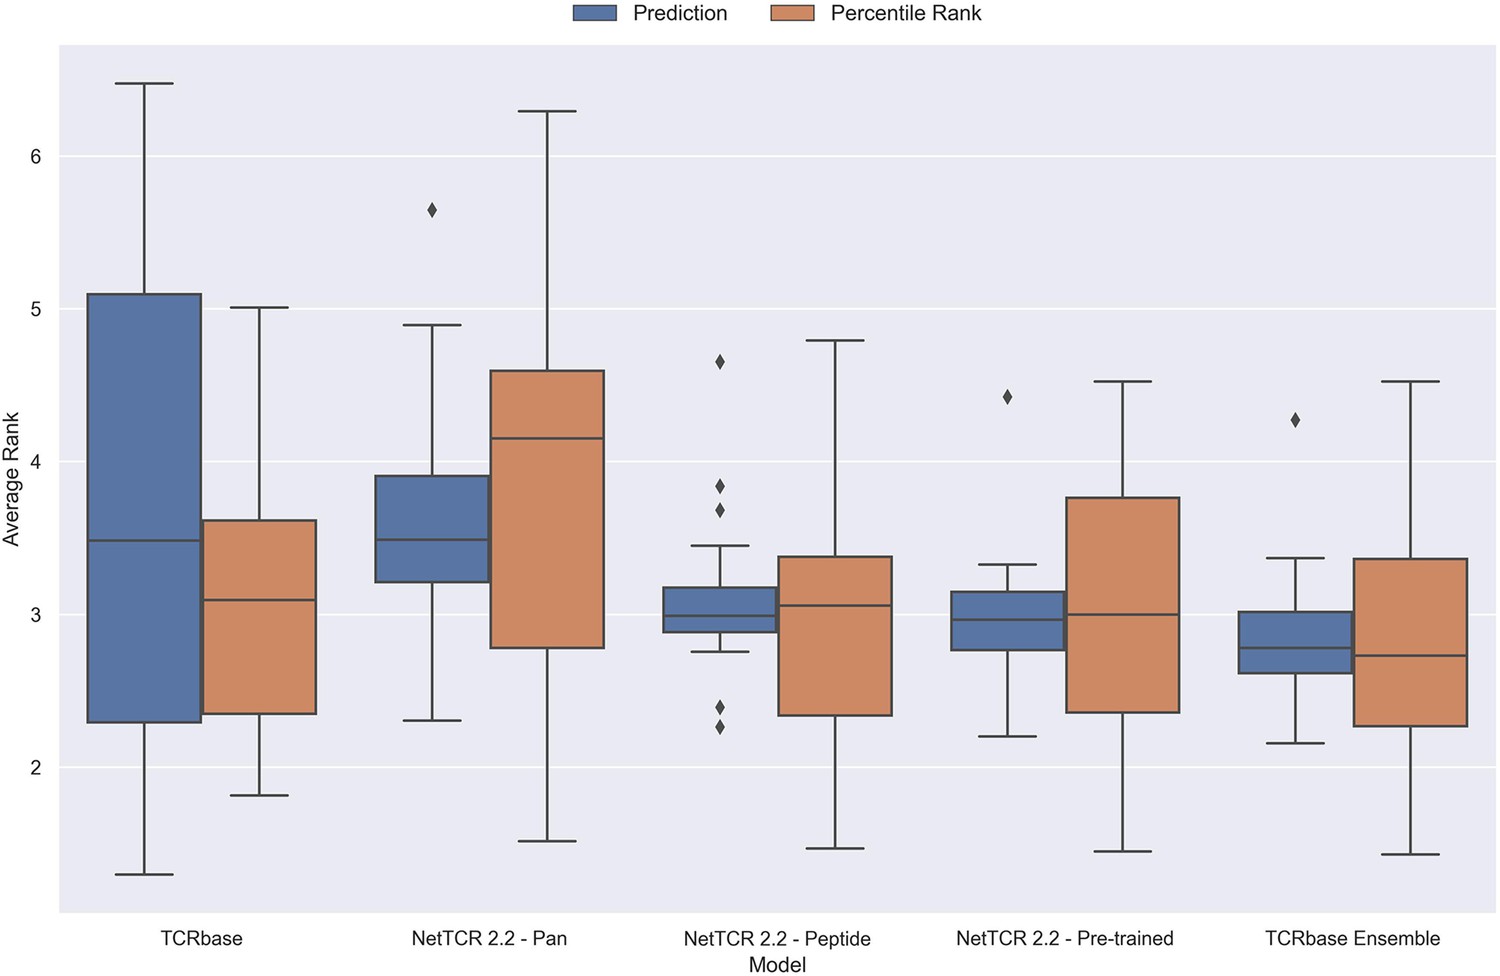
Boxplot of average rank per peptide for the final updated models.
The rank was evaluated on the limited dataset covering 21 peptides, that is excluding the peptides with low performance (KLGGALQAK, AVFDRKSDAK, NLVPMVATV, CTELKLSDY, RLRAEAQVK, RLPGVLPRA and SLFNTVATLY). The models used in this figure corresponds to model 21 (TCRbase), model 10 (NetTCR 2.2 - Pan), model 15 (NetTCR 2.2 - Peptide), model 16 (NetTCR 2.2 - Pre-trained), and model 17 (TCRbase ensemble) in Supplementary file 1.
Figure 10
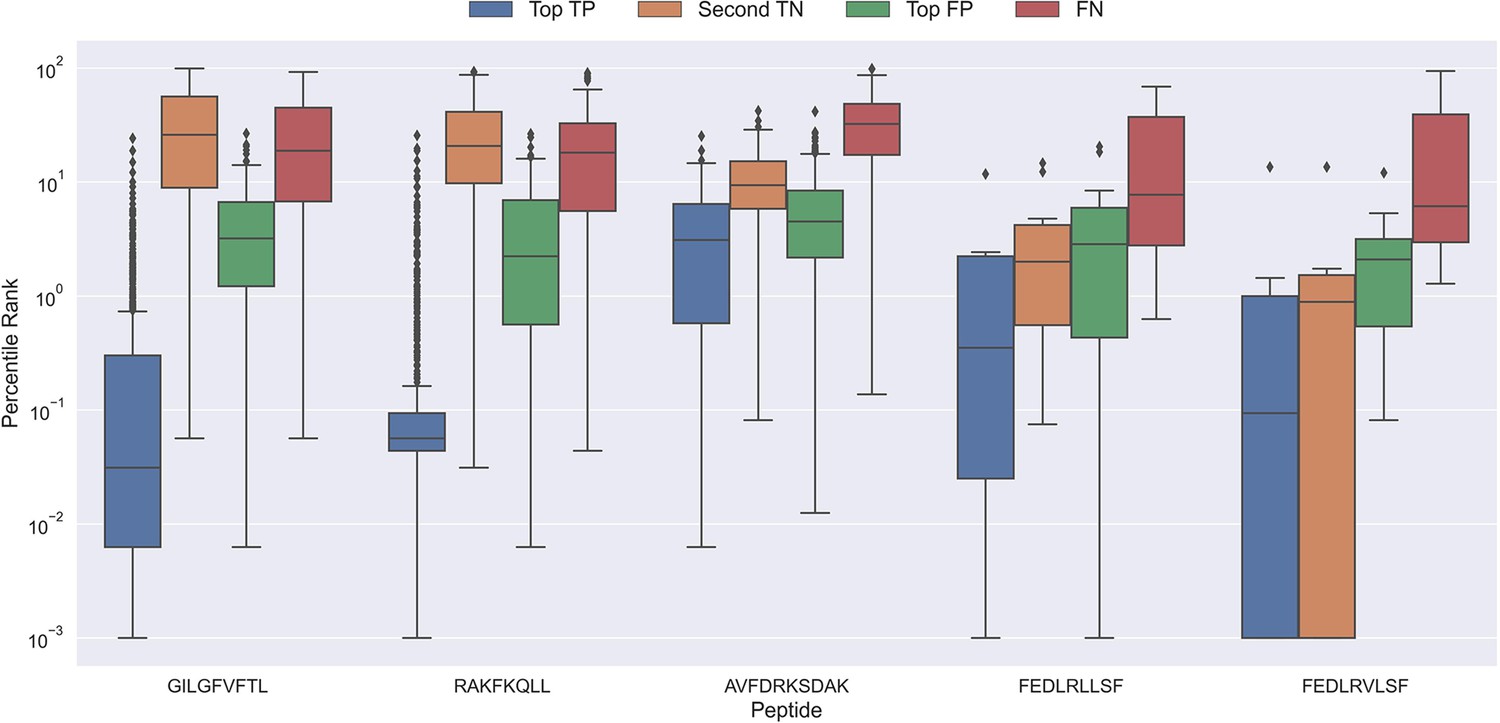
Boxplot of percentile ranks per peptide in the rank test, with KLGGALQAK, NLVPMVATV, CTELKLSDY, RLRAEAQVK, RLPGVLPRA, and SLFNTVATLY excluded.
AVFDRKSDAK was included as an example of a peptide with a poor rank in the rank test. Top TP: Percentile rank of the correctly chosen pairs. Second TN: Percentile rank of the second-best pair, when the correct pair was chosen. Top FP: Percentile rank of the best scoring pair when the incorrect pair was chosen. FN: Percentile rank of the correct pair, when the incorrect pair was chosen. The predictions are based on model 17 in Supplementary file 1.
Figure 11 with 1 supplement
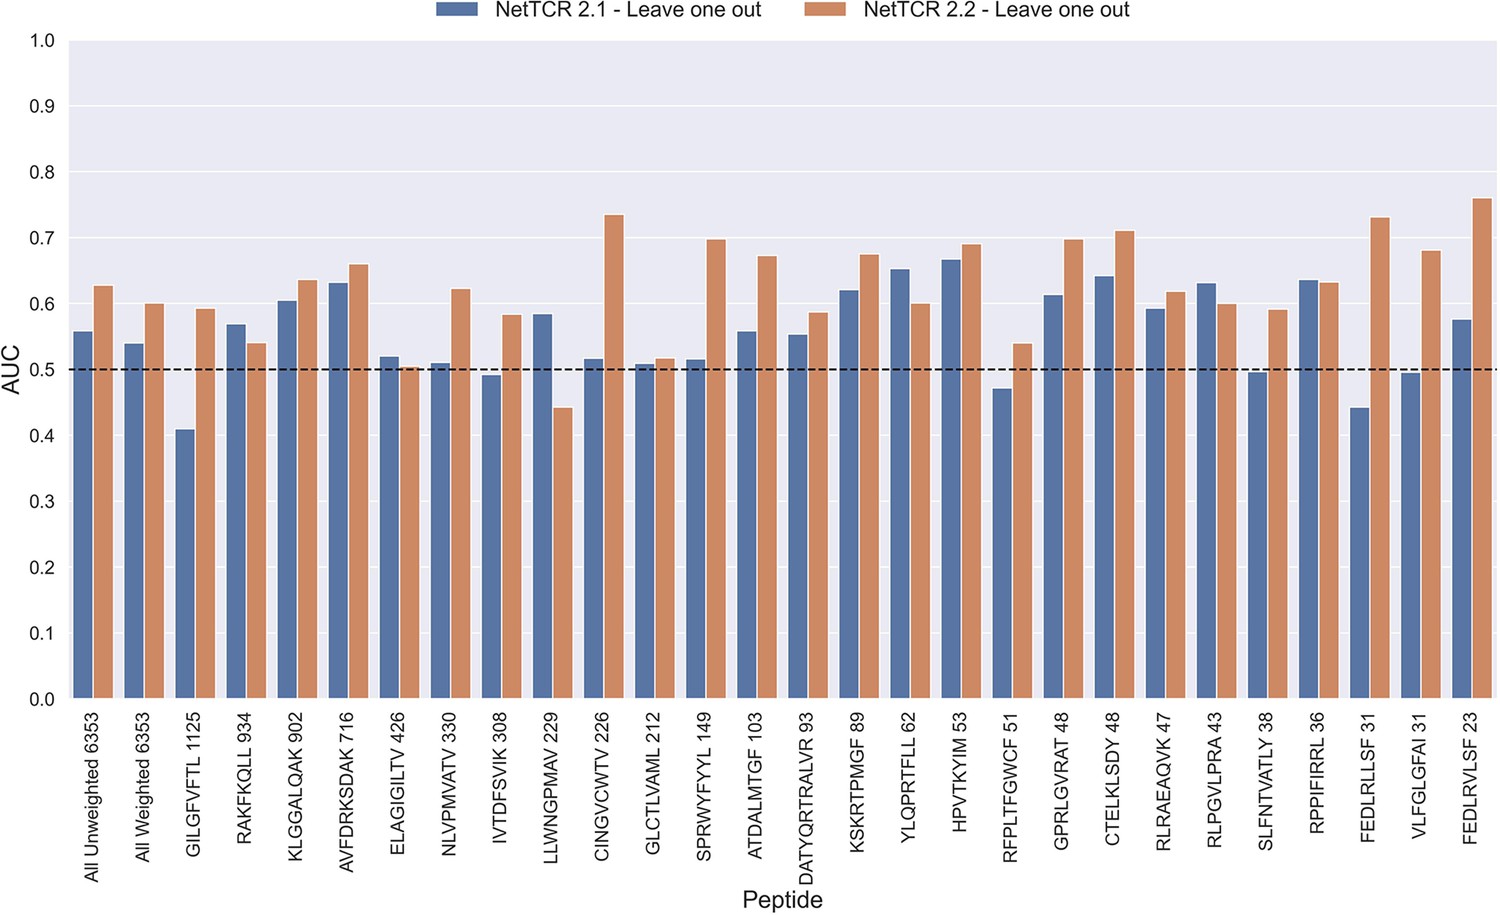
Per peptide performance of the old (NetTCR 2.1) and updated (NetTCR 2.2) pan-specific CNN models trained in a leave-one-out setup.
The performance was evaluated in terms of AUC on the full dataset. The performance shown in this figure is based on model 63 (NetTCR 2.1 - Leave one out) and model 19 (NetTCR 2.2 - Leave one out) in Supplementary file 1.
Figure 11—figure supplement 1
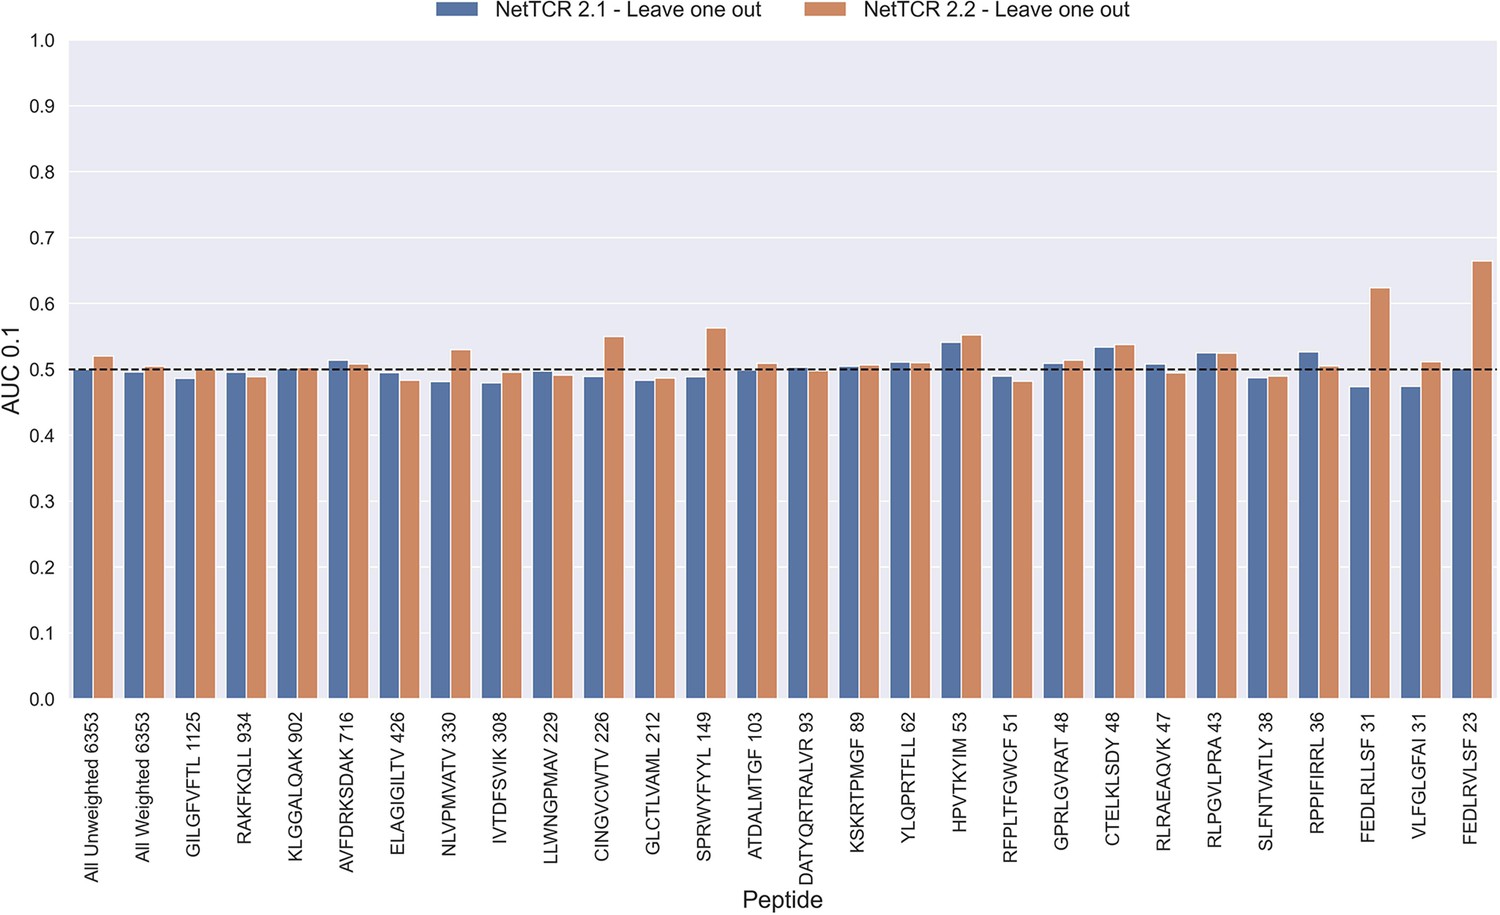
Per peptide performance of the old (NetTCR 2.1) and updated (NetTCR 2.2) pan-specific CNN models trained in a leave-one-out setup.
The performance was evaluated in terms of AUC on the full dataset. The performance shown in this figure is based on model 63 (NetTCR 2.1 - Leave one out) and model 19 (NetTCR 2.2 - Leave one out) in Supplementary file 1.
Figure 12 with 1 supplement
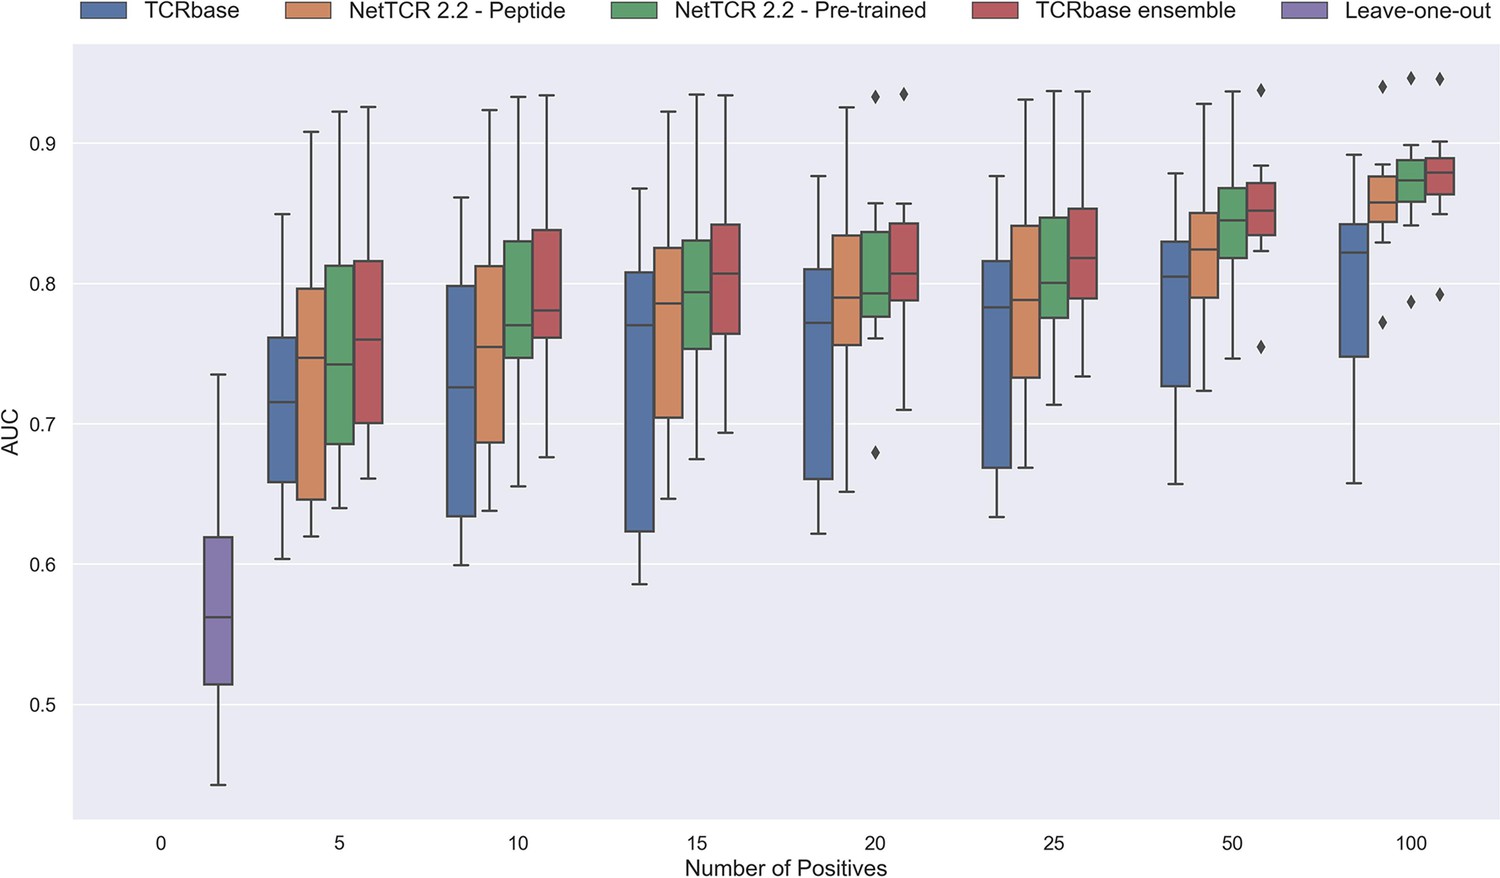
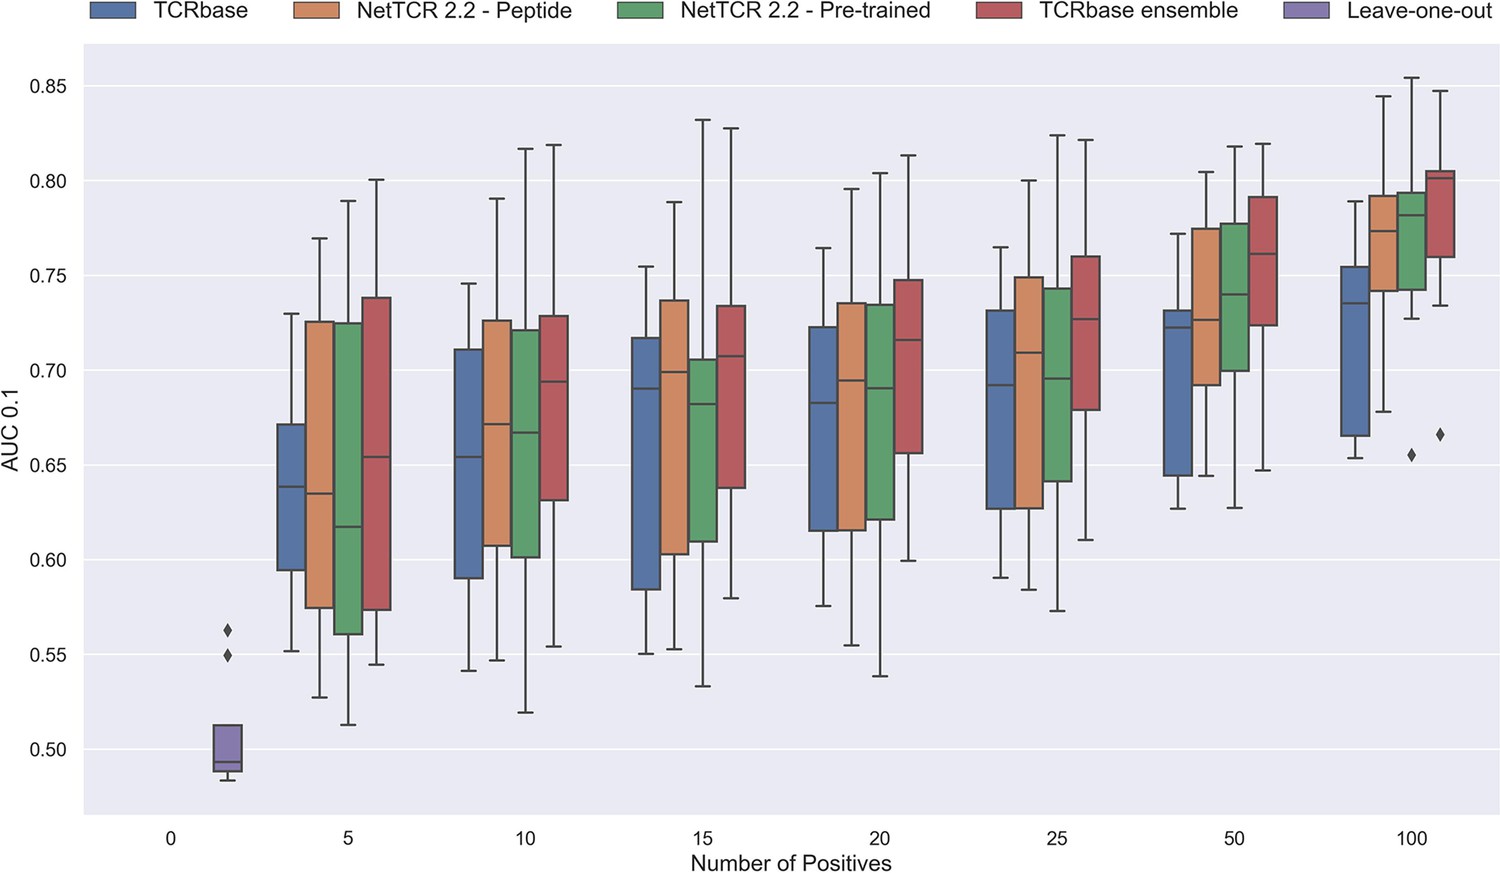
Performance in terms of AUC of various models trained on increasing amounts of data.
These models were trained on the following peptides: GILGFVFTL, RAKFKQLL, ELAGIGILTV, IVTDFSVIK, LLWNGPMAV, CINGVCWTV, GLCTLVAML, and SPRWYFYYL. The pre-trained models were based on the leave-one-out model, and afterwards fine-tuned and re-trained on the smaller training datasets. The performance shown is based on the predictions for model 24–51 in Supplementary file 1.
Figure 12—figure supplement 1
Performance in terms of AUC 0.1 of various models trained on increasing amounts of data.
These models were trained on the following peptides: GILGFVFTL, RAKFKQLL, ELAGIGILTV, IVTDFSVIK, LLWNGPMAV, CINGVCWTV, GLCTLVAML and SPRWYFYYL. The pre-trained models were based on the leave-one-out model, and afterwards fine-tuned and re-trained on the smaller training datasets. The performance shown is based on the predictions for model 24–51 in Supplementary file 1.
Figure 13 with 1 supplement
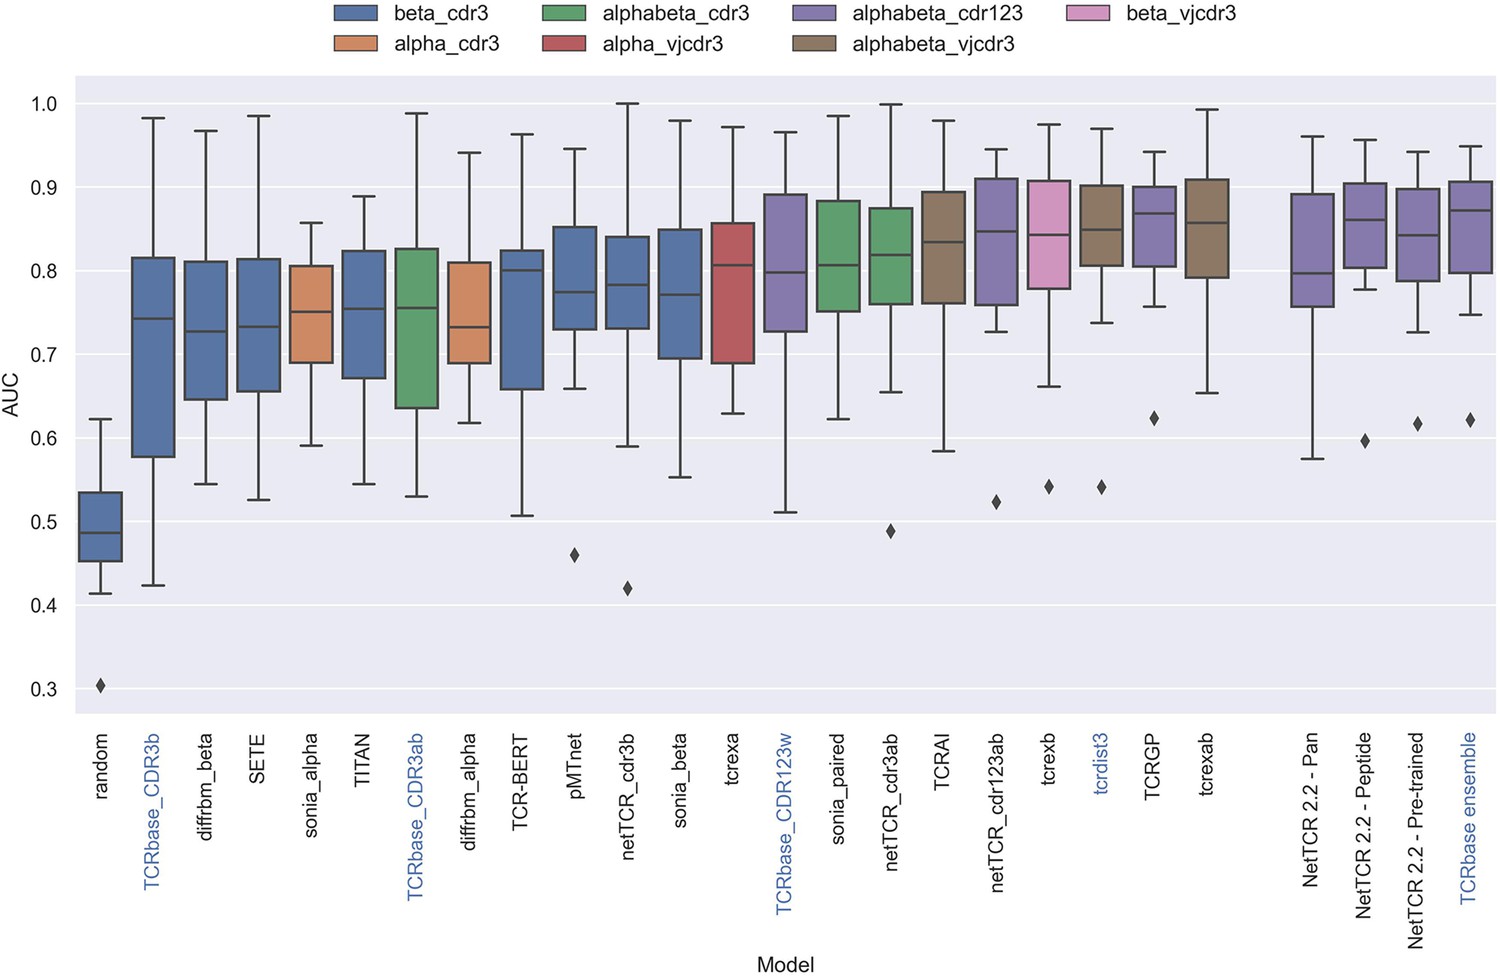
Boxplot of reported unweighted AUC per peptide for the models in the IMMREP benchmark, as well as the updated NetTCR 2.2 models.
Except for the updated NetTCR 2.2 models (NetTCR 2.2 - Pan, NetTCR 2.2 - Peptide, NetTCR 2.2 - Pre-trained and TCRbase ensemble) the performance of all models is equal to the reported performance in the IMMREP benchmark. The color of the bars indicates the type of input used by the model. Machine-learning models are labeled with black text, whereas distance-based models are labeled with blue text. Note that the TCRbase ensemble is a mixture between a machine-learning and distance-based model. The performance of the NetTCR 2.2 models is based on model 53 (NetTCR 2.2 - Pan), model 54 (NetTCR 2.2 - Peptide), model 55 (NetTCR 2.2 - Pre-trained), and model 56 (TCRbase ensemble) in Supplementary file 2. The performance of the remaining models are based on the values listed in the IMMREP 2022 GitHub repository at https://github.com/viragbioinfo/IMMREP_2022_TCRSpecificity/blob/main/evaluation/microaucs.csv.
Figure 13—figure supplement 1
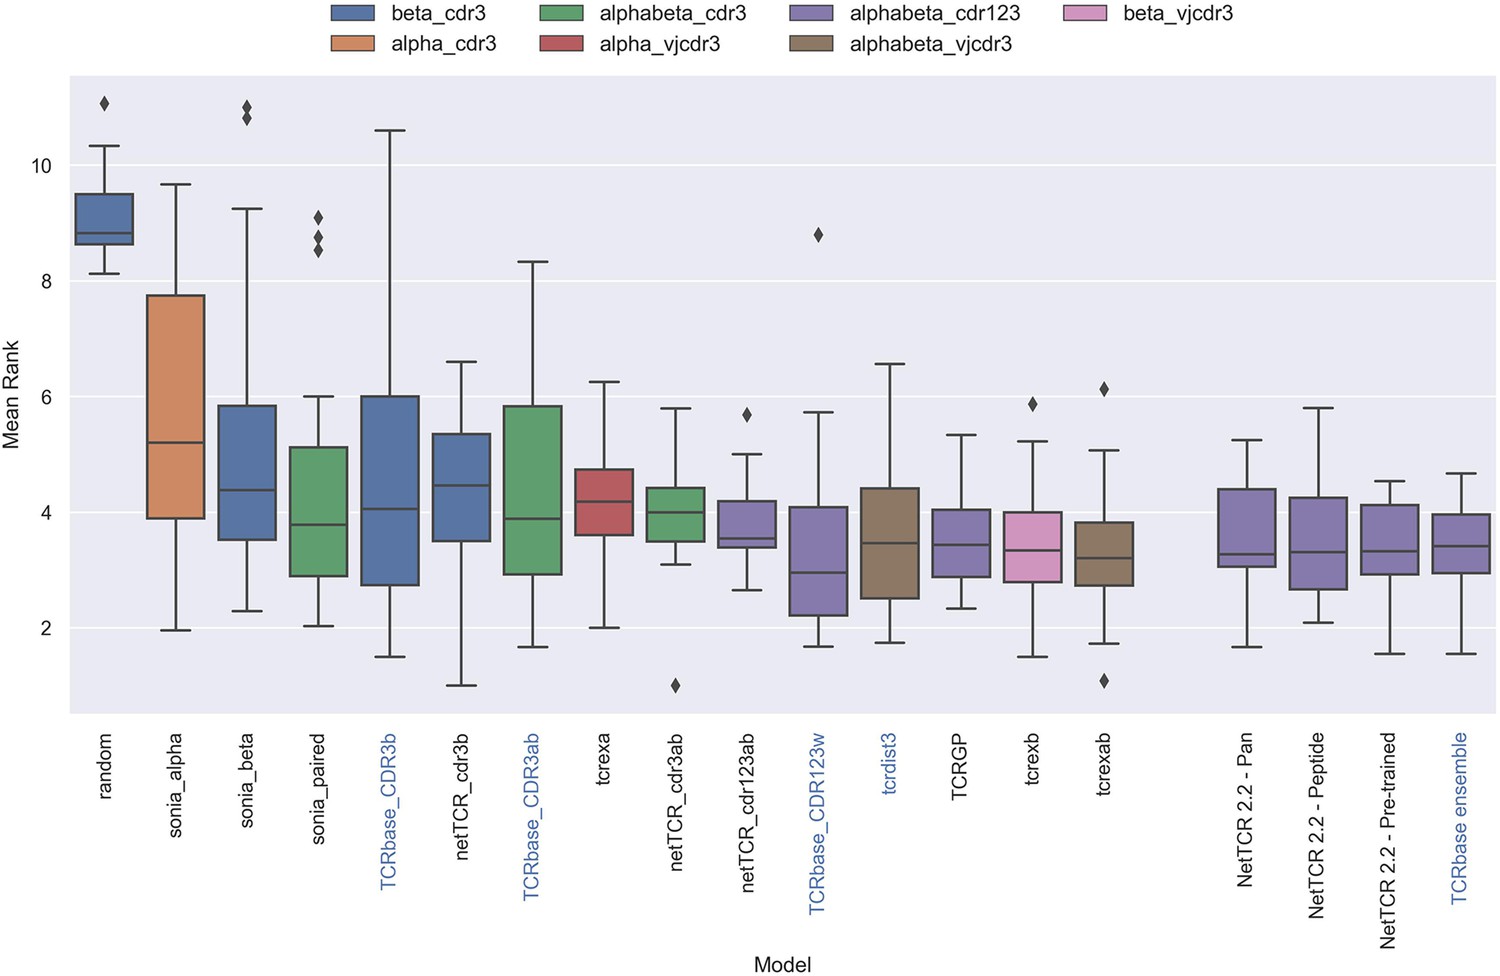
Boxplot of average rank per peptide per model in the IMMREP test data, as reported in the IMMREP benchmark.
The updated NetTCR 2.2 models are included to the right. The color of the bars indicates the type of input used by the model. Machine-learning models are labeled with black text, whereas distance-based models are labeled with blue text. Note that the TCRbase ensemble is a mixture between a machine-learning and distance-based model. The mean rank of the NetTCR 2.2 models are based on model 53 (NetTCR 2.2 - Pan), model 54 (NetTCR 2.2 - Peptide), model 55 (NetTCR 2.2 - Pre-trained), and model 56 (TCRbase ensemble) in Supplementary file 2. The mean rank of the remaining models are based on the values listed in the IMMREP 2022 GitHub repository at https://github.com/viragbioinfo/IMMREP_2022_TCRSpecificity/blob/main/evaluation/epitoperank.csv.
Figure 14
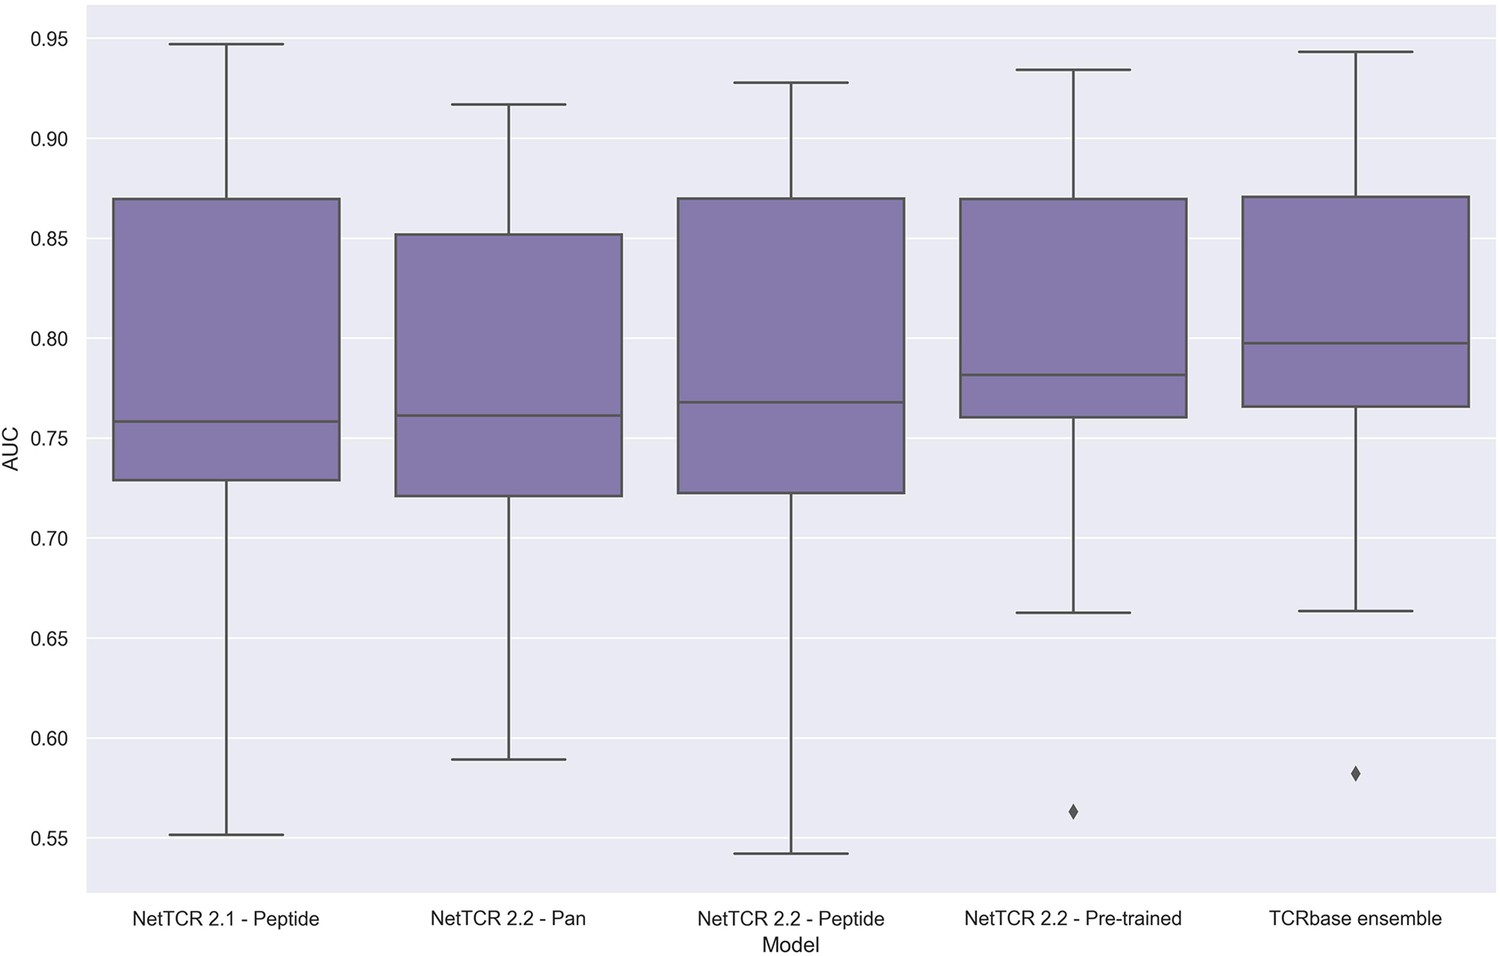
Boxplot of unweighted AUC per peptide for the NetTCR 2.1 and 2.2 models, when trained and evaluated on the redundancy reduced dataset.
The evaluation was performed using a nested cross-validation setup. The performance is based on model 58 (NetTCR 2.1 - Peptide), model 59 (NetTCR 2.2 - Pan), model 60 (NetTCR 2.2 - Peptide), model 61 (NetTCR 2.2 - Pre-trained), and model 62 (TCRbase ensemble) in Supplementary file 2.
Tables
Table 1
Per peptide overview of the full positive training data.
The source organism for each epitope, as well as the MHC allele which they bind to, are here shown. Additionally, the number of observations discarded during each redundancy reduction step, as well as the total remaining number of observations, are also listed, along with the number of observations originating from 10 x sequencing.
| Peptide | Organism | MHC | Pre reduction count | Removed in first reduction | Removed in second reduction | Post reduction count | Not 10 X | 10 X |
|---|---|---|---|---|---|---|---|---|
| GILGFVFTL | Influenza A virus | HLA-A*02:01 | 1897 | 645 | 127 | 1125 | 426 | 699 |
| RAKFKQLL | Epstein Barr virus | HLA-B*08:01 | 1065 | 114 | 17 | 934 | 0 | 934 |
| KLGGALQAK | Human CMV | HLA-A*03:01 | 912 | 8 | 2 | 902 | 0 | 902 |
| AVFDRKSDAK | Epstein Barr virus | HLA-A*11:01 | 725 | 5 | 4 | 716 | 0 | 716 |
| ELAGIGILTV | Melanoma neoantigen | HLA-A*02:01 | 435 | 6 | 3 | 426 | 55 | 371 |
| NLVPMVATV | Human CMV | HLA-A*02:01 | 384 | 43 | 11 | 330 | 154 | 176 |
| IVTDFSVIK | Epstein Barr virus | HLA-A*11:01 | 323 | 13 | 2 | 308 | 0 | 308 |
| LLWNGPMAV | Yellow fever virus | HLA-A*02:01 | 322 | 72 | 21 | 229 | 229 | 0 |
| CINGVCWTV | Hepatitis C virus | HLA-A*02:01 | 231 | 4 | 1 | 226 | 75 | 151 |
| GLCTLVAML | Epstein Barr virus | HLA-A*02:01 | 278 | 59 | 7 | 212 | 95 | 117 |
| SPRWYFYYL | SARS-CoV2 | HLA-B*07:02 | 158 | 4 | 5 | 149 | 149 | 0 |
| ATDALMTGF | Hepatitis C virus | HLA-A*01:01 | 128 | 21 | 4 | 103 | 0 | 103 |
| DATYQRTRALVR | Influenza A virus | HLA-A*68:01 | 100 | 4 | 3 | 93 | 93 | 0 |
| KSKRTPMGF | Hepatitis C virus | HLA-B*57:01 | 115 | 14 | 12 | 89 | 0 | 89 |
| YLQPRTFLL | SARS-CoV2 | HLA-A*02:01 | 69 | 6 | 1 | 62 | 54 | 8 |
| HPVTKYIM | Hepatitis C virus | HLA-B*08:01 | 60 | 5 | 2 | 53 | 0 | 53 |
| RFPLTFGWCF | HIV-1 | HLA-A*24:02 | 58 | 7 | 0 | 51 | 51 | 0 |
| GPRLGVRAT | Hepatitis C virus | HLA-B*07:02 | 51 | 3 | 0 | 48 | 0 | 48 |
| CTELKLSDY | Influenza A virus | HLA-A*01:01 | 48 | 0 | 0 | 48 | 48 | 0 |
| RLRAEAQVK | Epstein Barr virus | HLA-A*03:01 | 47 | 0 | 0 | 47 | 0 | 47 |
| RLPGVLPRA | AML neoantigen | HLA-A*02:01 | 43 | 0 | 0 | 43 | 0 | 43 |
| SLFNTVATLY | HIV-1 | HLA-A*02:01 | 38 | 0 | 0 | 38 | 0 | 38 |
| RPPIFIRRL | Epstein Barr virus | HLA-B*07:02 | 40 | 2 | 2 | 36 | 24 | 12 |
| FEDLRLLSF | Influenza A virus | HLA-B*37:01 | 31 | 0 | 0 | 31 | 31 | 0 |
| VLFGLGFAI | T1D neoantigen | HLA-A*02:01 | 32 | 1 | 0 | 31 | 31 | 0 |
| FEDLRVLSF | Influenza A virus | HLA-B*37:01 | 36 | 0 | 13 | 23 | 23 | 0 |
Table 2
Overview of number of TCRs for each peptide in the IMMREP 2022 training dataset before and after redundancy reduction.
The redundancy reduction was performed using a kernel similarity threshold of 95%.
| Peptide | Pre reduction count | Post reduction count | Percent redundant |
|---|---|---|---|
| All | 2445 | 1960 | 19.8% |
| GILGFVFTL | 544 | 301 | 44.7% |
| NLVPMVATV | 274 | 242 | 11.7% |
| YLQPRTFLL | 267 | 227 | 15.0% |
| TTDPSFLGRY | 193 | 187 | 3.1% |
| LLWNGPMAV | 188 | 175 | 6.9% |
| CINGVCWTV | 183 | 179 | 2.2% |
| GLCTLVAML | 146 | 91 | 37.7% |
| ATDALMTGF | 104 | 78 | 25.0% |
| LTDEMIAQY | 100 | 94 | 6.0% |
| SPRWYFYYL | 92 | 92 | 0.0% |
| KSKRTPMGF | 85 | 63 | 25.9% |
| NQKLIANQF | 56 | 53 | 5.4% |
| HPVTKYIM | 48 | 41 | 14.6% |
| TPRVTGGGAM | 45 | 44 | 2.2% |
| NYNYLYRLF | 44 | 42 | 4.6% |
| GPRLGVRAT | 40 | 37 | 7.5% |
| RAQAPPPSW | 36 | 14 | 61.1% |
Table 3
Pearson Correlation Coefficients (PCC) between the optimal α scaling factor and performance per peptide in terms of AUC and AUC 0.1 of the pre-trained CNN model and TCRbase model, respectively, for the validation partitions.
Each partition was considered as a separate sample. p-Values for the null hypothesis that the performance and optimal α are uncorrelated are also shown.
| Metric | PCC to optimal alpha | p-Value |
|---|---|---|
| CNN AUC | –0.1101 | 0.2123 |
| TCRbase AUC | 0.3056 | 0.0004 |
| CNN AUC 0.1 | –0.0809 | 0.3602 |
| TCRbase AUC 0.1 | 0.2068 | 0.0183 |
Table 4
Degree of redundancy between the IMMREP test and training data, when using a 95% kernel similarity threshold for redundancy within each peptide.
The redundancy reduction was performed on both positive and negative observations. The counts and percentages, however, only refers to the positive observations.
| Peptide | Pre reduction count | Post reduction count | Percent redundant |
|---|---|---|---|
| All | 619 | 467 | 24.56% |
| GILGFVFTL | 136 | 58 | 57.35% |
| NLVPMVATV | 69 | 54 | 21.74% |
| YLQPRTFLL | 67 | 53 | 20.90% |
| TTDPSFLGRY | 49 | 47 | 4.08% |
| LLWNGPMAV | 47 | 44 | 6.38% |
| CINGVCWTV | 46 | 46 | 0.00% |
| GLCTLVAML | 37 | 23 | 37.84% |
| ATDALMTGF | 26 | 22 | 15.38% |
| LTDEMIAQY | 25 | 23 | 8.00% |
| SPRWYFYYL | 24 | 24 | 0.00% |
| KSKRTPMGF | 22 | 13 | 40.91% |
| NQKLIANQF | 15 | 15 | 0.00% |
| TPRVTGGGAM | 12 | 12 | 0.00% |
| HPVTKYIM | 12 | 10 | 16.67% |
| NYNYLYRLF | 12 | 9 | 25.00% |
| GPRLGVRAT | 11 | 11 | 0.00% |
| RAQAPPPSW | 9 | 3 | 66.67% |
Additional files
-
Supplementary file 1
Overview of training data, model parameters, predictions and performance of the models trained and evaluated in this article, excluding the models trained and evaluated on the IMMREP 2022 dataset.
The listed Model Number for each model can be used to find the source data for the figures in this article (see the figure legends).
- https://cdn.elifesciences.org/articles/93934/elife-93934-supp1-v1.xlsx
-
Supplementary file 2
Overview of training data, model parameters, predictions and performance of the models trained and evaluated on the IMMREP 2022 dataset.
The listed Model Number for each model can be used to find the source data for the figures in this article (see the figure legends).
- https://cdn.elifesciences.org/articles/93934/elife-93934-supp2-v1.xlsx
-
MDAR checklist
- https://cdn.elifesciences.org/articles/93934/elife-93934-mdarchecklist1-v1.docx
Download links
A two-part list of links to download the article, or parts of the article, in various formats.
Downloads (link to download the article as PDF)
Open citations (links to open the citations from this article in various online reference manager services)
Cite this article (links to download the citations from this article in formats compatible with various reference manager tools)
Enhancing TCR specificity predictions by combined pan- and peptide-specific training, loss-scaling, and sequence similarity integration
eLife 12:RP93934.
https://doi.org/10.7554/eLife.93934.3


