Multi-omic analysis of bat versus human fibroblasts reveals altered central metabolism
- Cancer and Stem Cell Biology Programme, Duke-NUS Medical School, Singapore
- Centre for Computational Biology, Duke-NUS Medical School, Singapore
- Functional Proteomics Laboratory, Institute of Molecular and Cell Biology (IMCB), Agency for Science, Technology and Research, Singapore
- Programme in Emerging Infectious Diseases, Duke-NUS Medical School, Singapore
- Zhejiang University-University of Edinburgh Institute, Zhejiang University School of Medicine, Zhejiang University, China
- SingHealth Duke-NUS Global Health Institute, Singapore
Figures
Figure 1 with 2 supplements
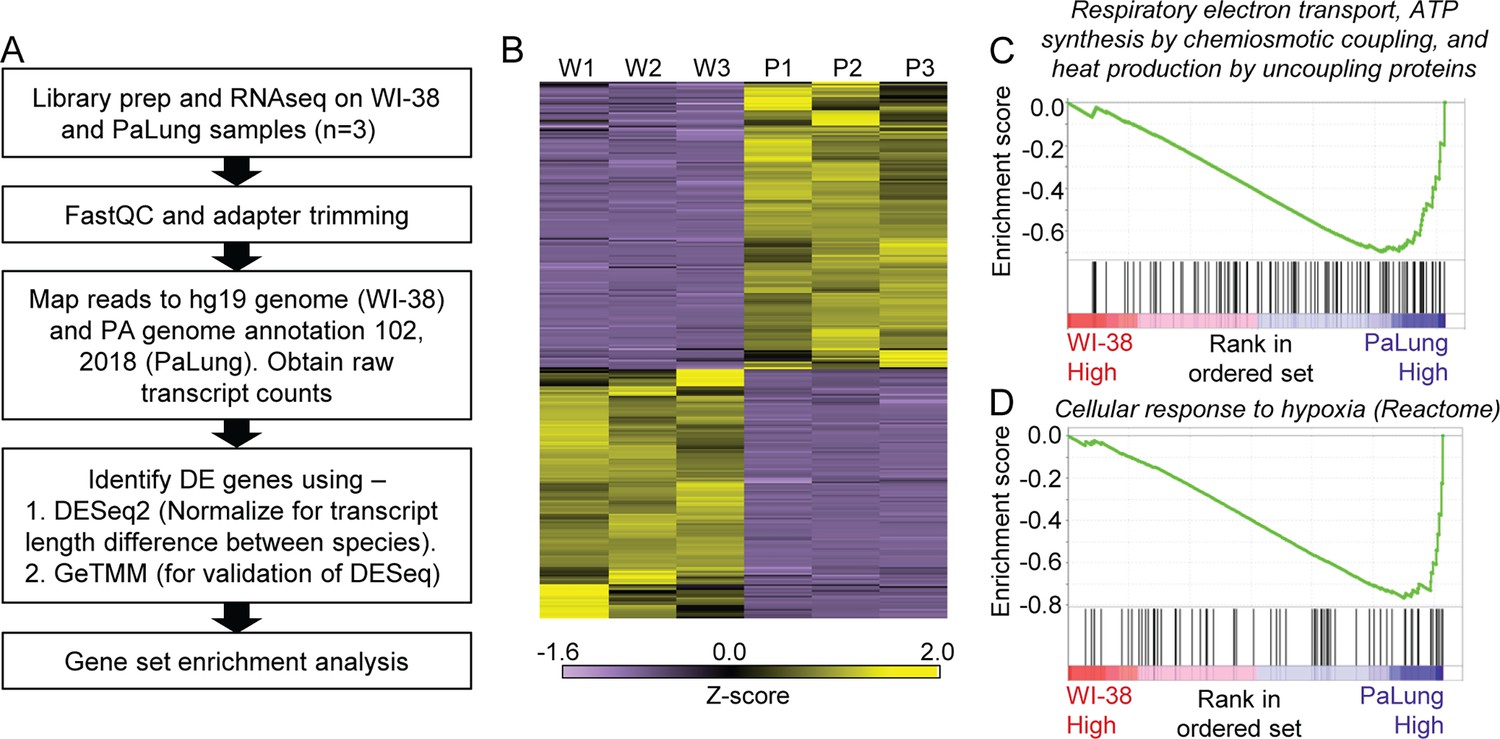
RNAseq data analysis of PaLung and WI-38 cells for differential expression and pathway enrichment.
(A) Workflow of bioinformatics analysis pipeline for RNAseq data from PaLung (P. alecto) and WI-38 (H. sapiens) cells (n=3). (B) Heatmap showing the expression patterns for genes that passed our differential expression thresholds in the three WI-38 samples (W1–W3) and the three PaLung samples (P1–P3). (C and D) Gene set enrichment analysis (GSEA) identifies respiratory electron transport and cellular response to hypoxia as top metabolic pathways that are differentially regulated between PaLung and WI-38 cells. Shown here are the enrichment score plots for (C) respiratory electron transport and (D) cellular response to hypoxia.
Figure 1—figure supplement 1
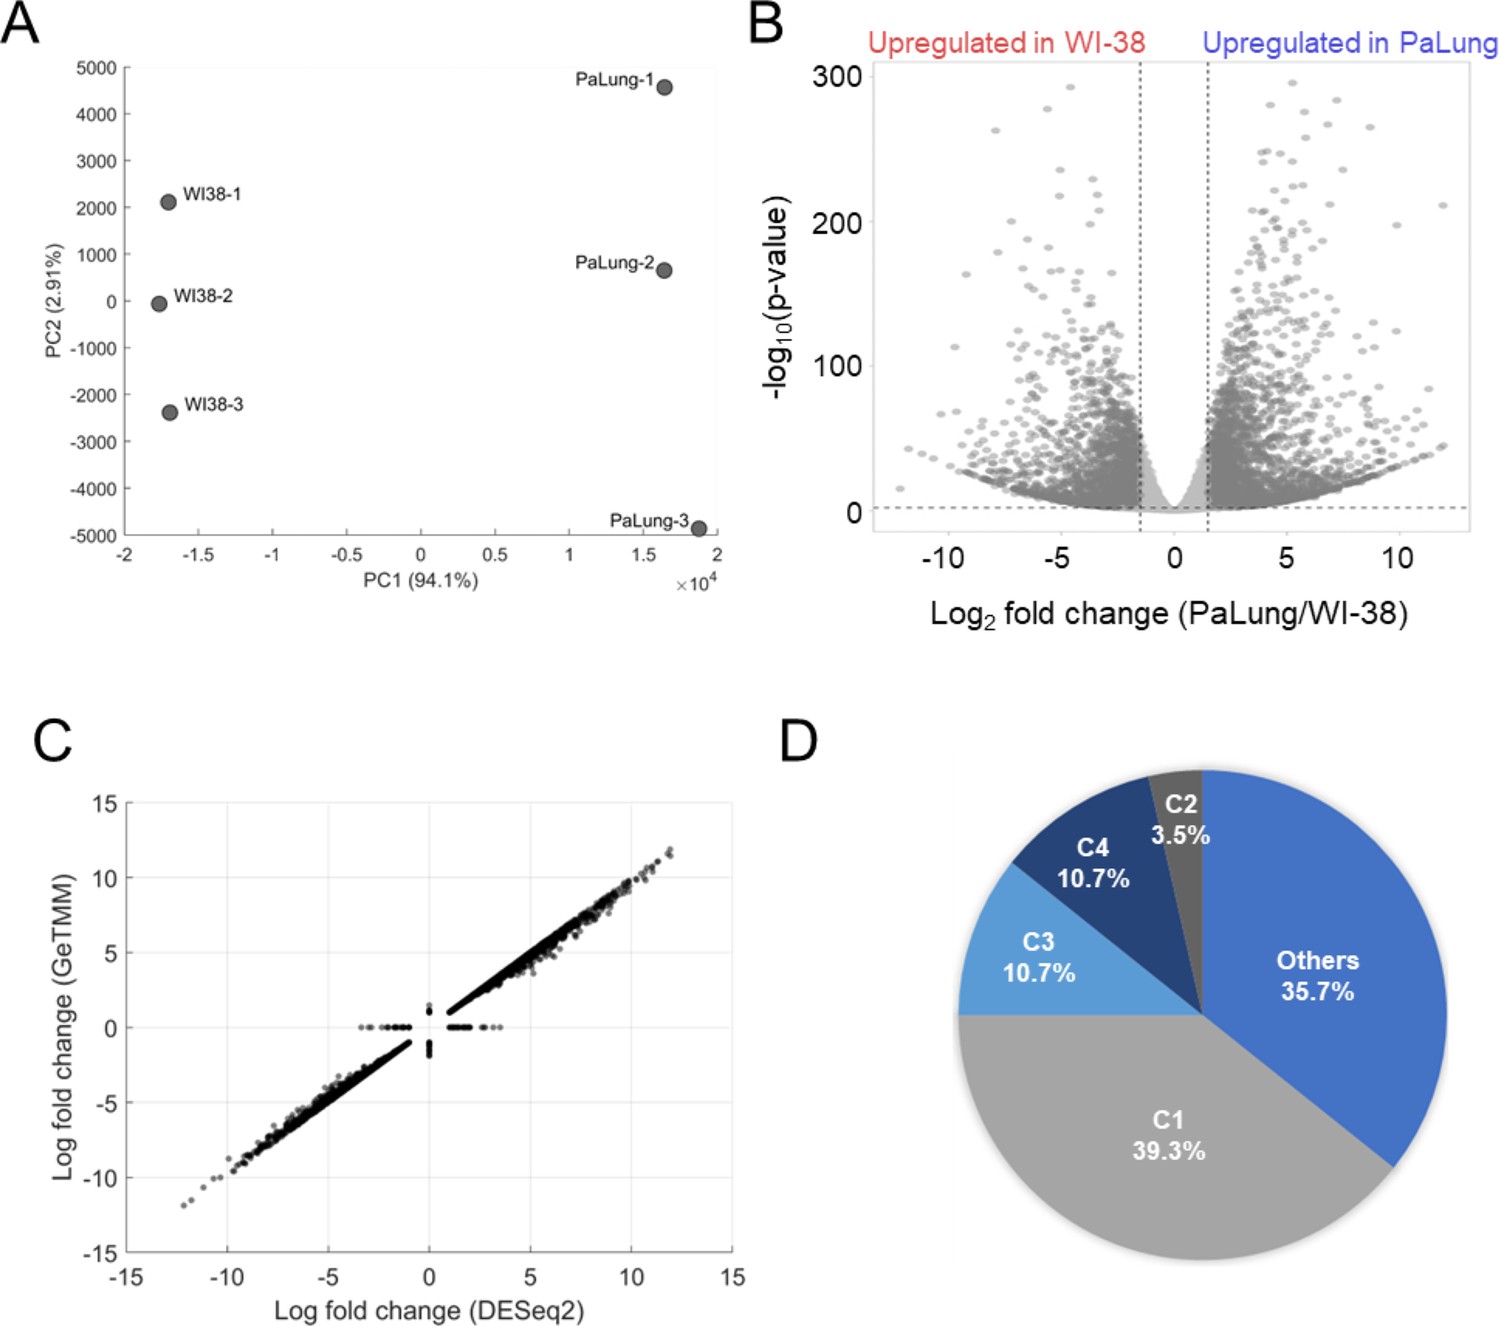
Analysis of transcriptomics data from PaLung and WI-38 cells.
(A) Principal component analysis plots showing the separation of the PaLung and WI-38 transcriptomics datasets. (B) Volcano plot showing the genes that passed our differential expression (DE) thresholds (|log2 fold change [LFC]| ≥ 1 and false discovery rate (FDR) < 0.05). (C) Correlation between the gene fold changes estimated via the DESeq2 pipeline and the gene length corrected trimmed mean of M-values (GeTMM) pipeline (see Materials and methods). The points on the X-axis represent LFC of genes that passed our DE thresholds in DESeq2 but not in GeTMM. Conversely, points on the Y-axis represent genes that passed our DE thresholds in the GeTMM pipeline but not in the DESeq2 pipeline. (D) Pie chart showing that the gene set enrichment analysis (GSEA)-suggested upregulation of electron transport chain (ETC) in transcriptomics data is a result dominated by genes corresponding to Complex I subunits. C1=Complex I; C2=Complex II; C3=Complex III; C4=Complex IV of the ETC.
Figure 1—figure supplement 2
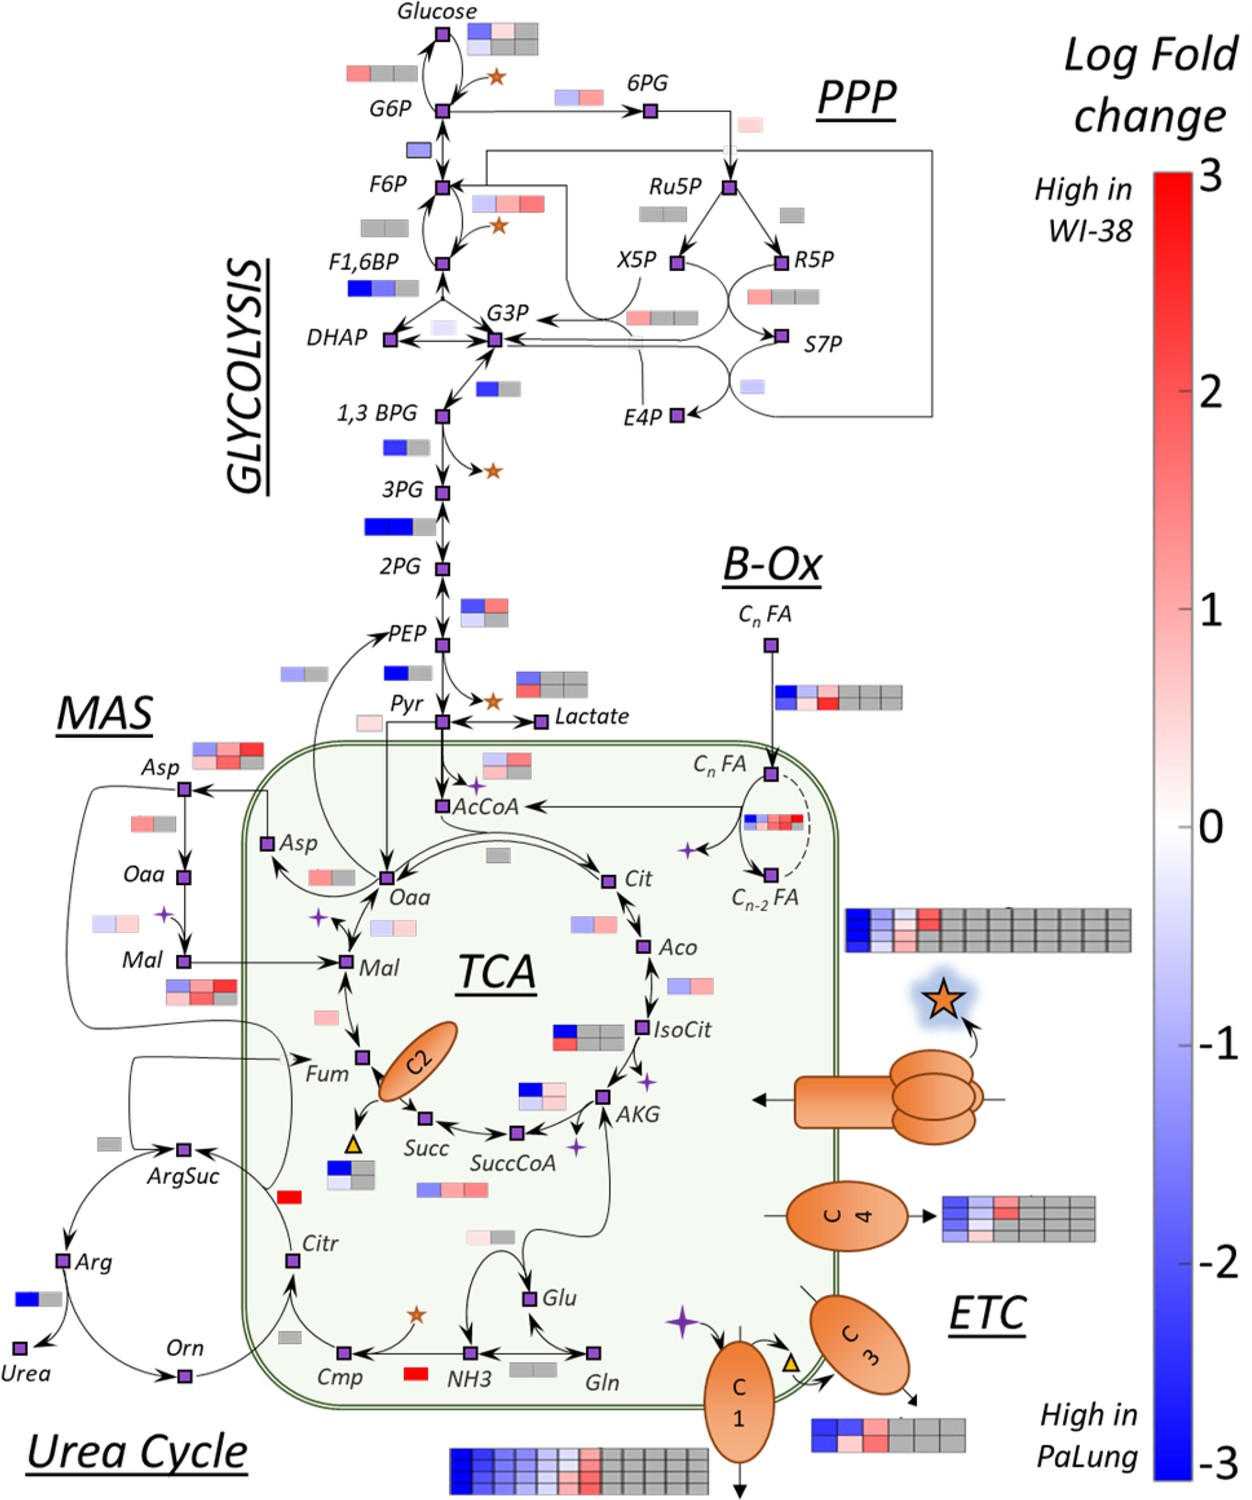
A summary of transcriptomics log fold changes (LFC) overlaid onto key metabolic reactions from central carbon metabolism.
Shown here is a network of reactions in central carbon metabolism that includes reactions from multiple pathways (glycolysis, pentose phosphate pathway, TCA cycle, fatty acid oxidation, electron transport chain, urea cycle, and malate aspartate shuttle). The nodes of the network indicate metabolites and are shown as purple boxes with black outlines. The black arrows represent metabolic reactions. The colored boxes adjacent to the arrows represent the LFC of a gene involved in catalyzing the specific metabolic reaction (subunit/isoform/alternate genes). The number of boxes corresponds to the total number of genes participating in the reaction. The color scale indicates the extent to which the gene is upregulated in PaLung (blue) or WI-38 (red). Gray squares indicate that a particular gene/transcript implicated in the reaction was either not detected or did not pass our differential expression thresholds between PaLung and WI-38 samples.
Figure 2 with 1 supplement
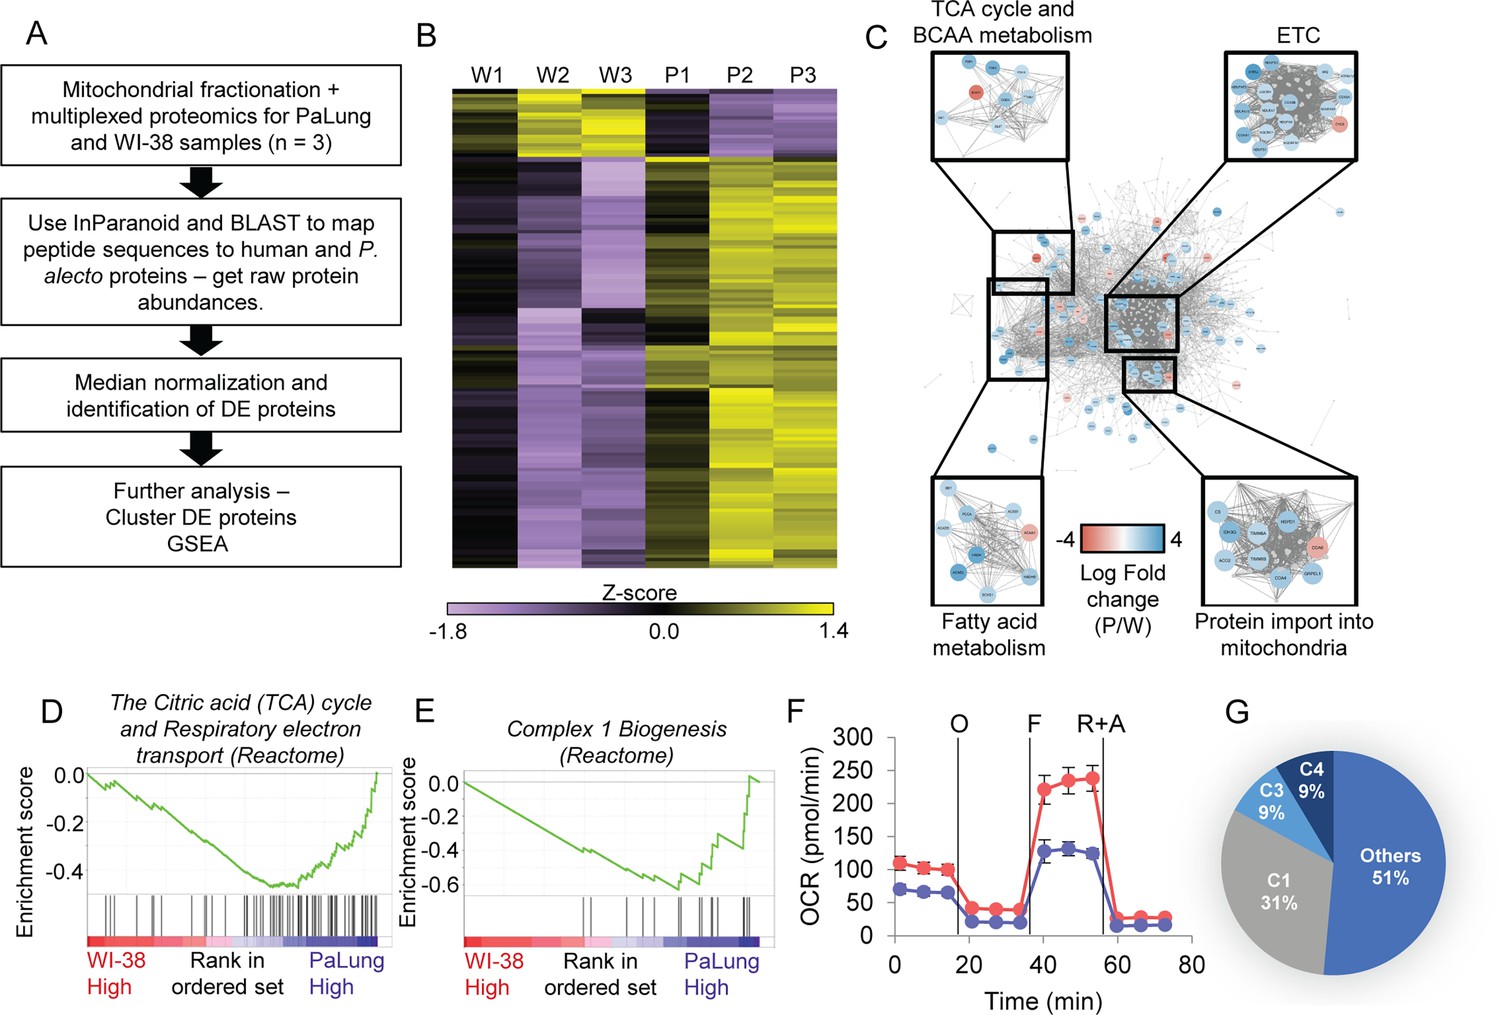
Proteomic data analysis of mitochondrial fractions of PaLung and WI-38 cells for differential expression, pathway enrichment, and electron transport chain (ETC) activity.
(A) Workflow of bioinformatics analysis pipeline for proteomics data from PaLung (P. alecto) and WI-38 (H. sapiens) cells (n=3). (B) Heatmap showing the expression patterns for the 129 differentially expressed mitochondrial proteins in the three WI-38 samples (W1–W3) and the three PaLung samples (P1–P3). (C) Differentially expressed mitochondrial proteins (nodes colored by log fold change) are overlaid on a network of mitochondrial protein-protein interactions (obtained from STRING) (W=WI-38 cells, P=PaLung cells). The nodes are then clustered with respect to reactome-annotated pathways. (D and E) Gene set enrichment analysis (GSEA) identifies citric acid cycle, oxidative phosphorylation, and Complex I biogenesis as top metabolic pathways that are differentially regulated between PaLung and WI-38 cells. Shown here are the enrichment score plots for (D) citric acid cycle and oxidative phosphorylation and (E) Complex I biogenesis. (F) Oxygen consumption rate (OCR) measurement of PaLung cells (blue) and WI-38 cells (red) plotted as mean ± SD from n>15 independent experiments. O=oligomycin, F=FCCP, R+A = rotenone+antimycin A. (G) Pie chart showing that the proteomic upregulation of the ETC, implied by GSEA, is dominated by genes for subunits of Complex I. C1=Complex I; C3=Complex III; C4=Complex IV of the ETC.
Figure 2—figure supplement 1
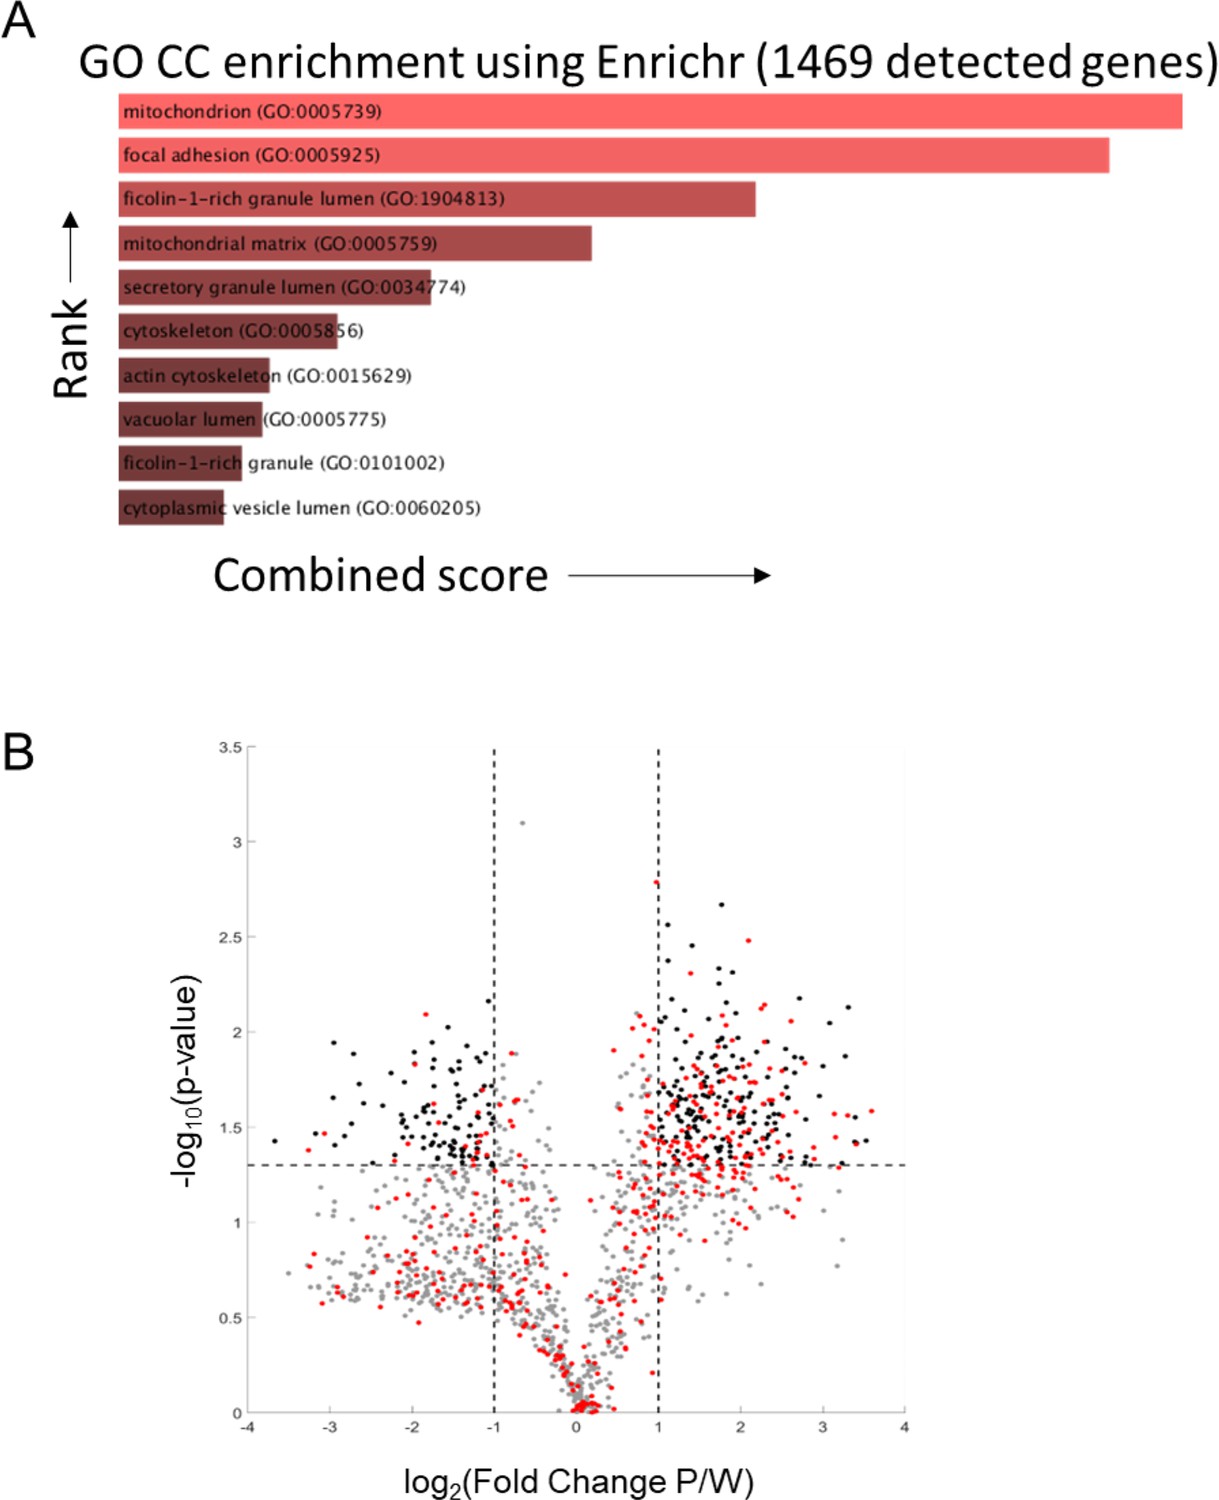
Proteomic analysis of PaLung and WI-38 data.
(A) Gene ontology category cellular (GO CC) enrichment using the Enrichr tool for compartmental enrichment on the 1469 genes detected in the proteomics dataset shows enrichment for the mitochondrial compartment. (B) Volcano plot showing the differentially expressed (DE) proteins (|log2 fold change| ≥ 1 and false discovery rate (FDR) < 0.05). Gray dots represent non-mitochondrial proteins that are not differentially expressed. Black dots show non-mitochondrial proteins that are differentially expressed. Red dots show all mitochondrial proteins.
Figure 3 with 2 supplements
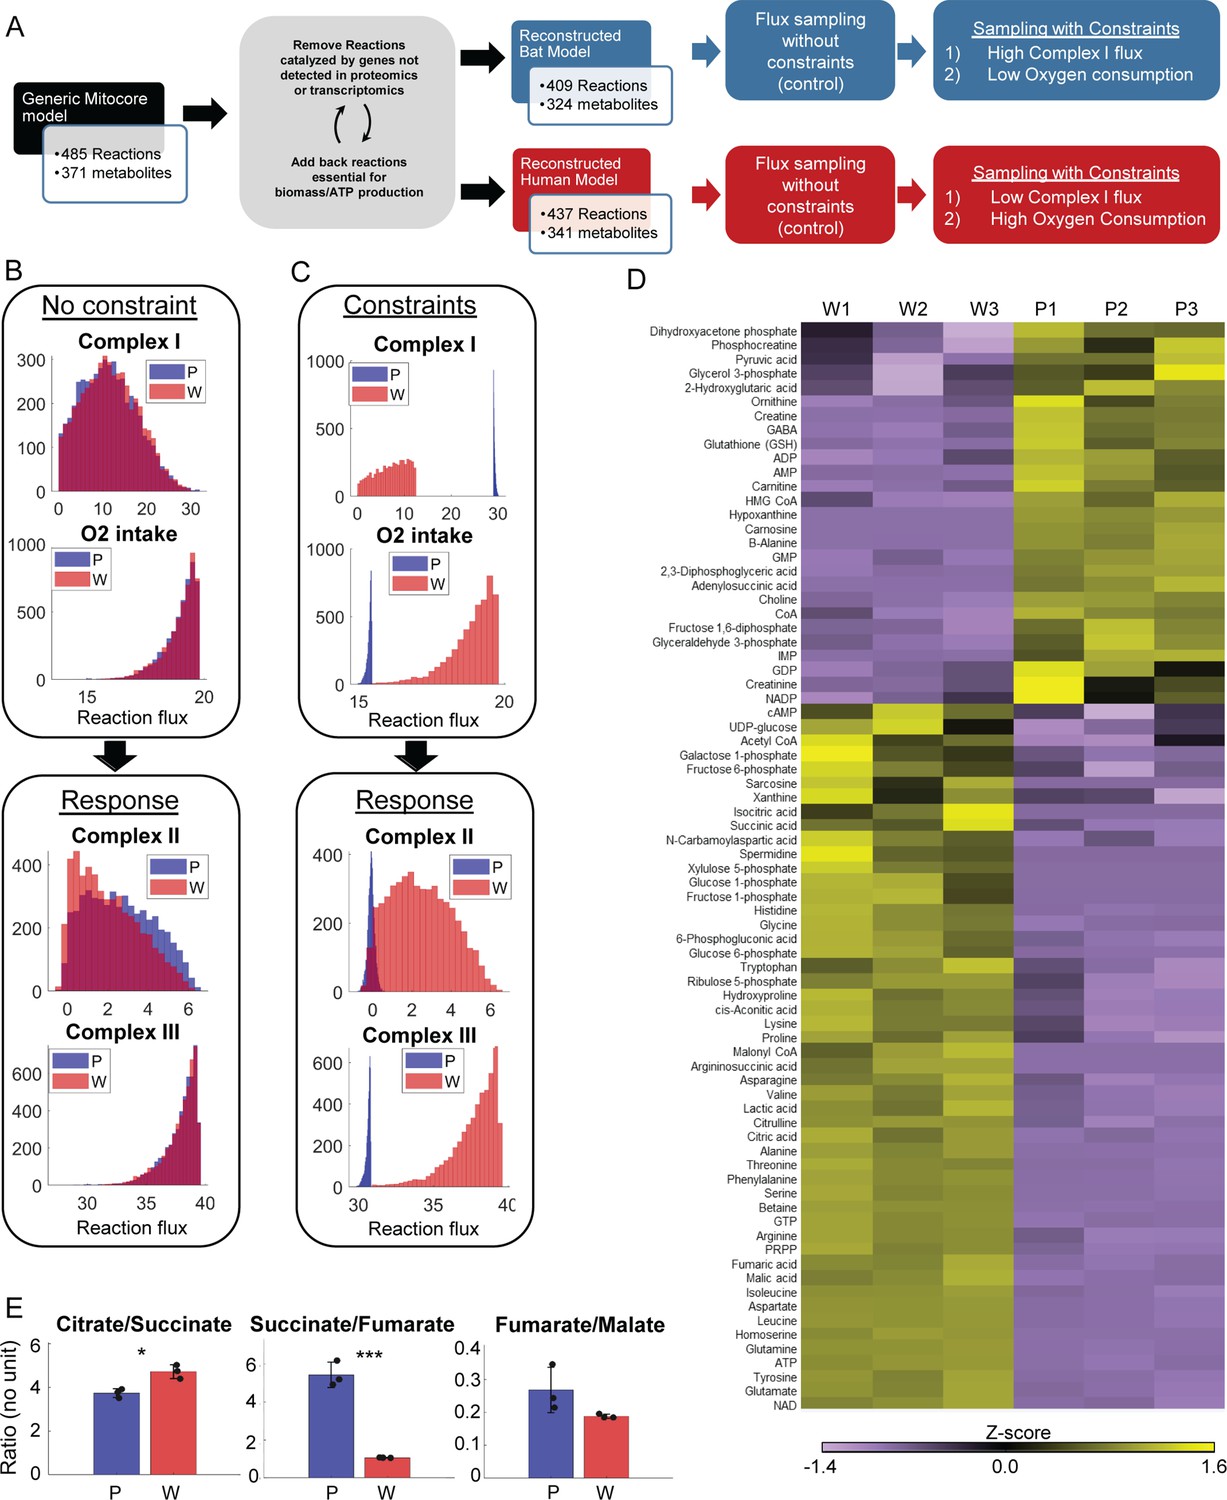
Metabolomic data and model-based analysis of mitochondrial metabolism in PaLung and WI-38 cells.
(A) Schematic showing the metabolic modeling pipeline. We begin with the context-specific reconstruction of a metabolic model – the process where a generic mitochondrial model (Smith et al., 2017) is tailored specifically to PaLung and WI-38 cells using proteomic and transcriptomic expression patterns. The individual metabolic models are then simulated using constraint-based flux sampling methods to give a distribution of possible fluxes for each reaction in the model. Comparing these flux distributions between the two models allows the detection of metabolic reactions that are likely to be differentially regulated in response to user-imposed constraints on metabolism. Simulations are performed on both the PaLung and WI-38 models under no constraints or with constraints on Complex I and mitochondrial O2 intake. (B) Sample histograms showing the feasible flux distributions for electron transport chain (ETC) reactions in the unconstrained PaLung (P) and WI-38 (W) metabolic models. (C) Flux distributions of ETC reactions in PaLung (P) and WI-38 (W) cells when PaLung cells are constrained to have higher flux through Complex I of ETC but lower oxygen intake in the mitochondria. (D) Heatmap showing differentially regulated metabolites from central carbon metabolism in the three WI-38 (W1–W3) and the three PaLung (P1–P3) samples. (E) Intra-sample ratios of metabolites from the TCA cycle in either PaLung (P) or WI-38 (W) cells, plotted as mean ± SD from three independent experiments. * and *** represent p-value≤0.05 or ≤0.001 respectively (unpaired Student’s two-sided t-test with Benjamini-Hochberg correction for multiple hypothesis testing).
Figure 3—figure supplement 1
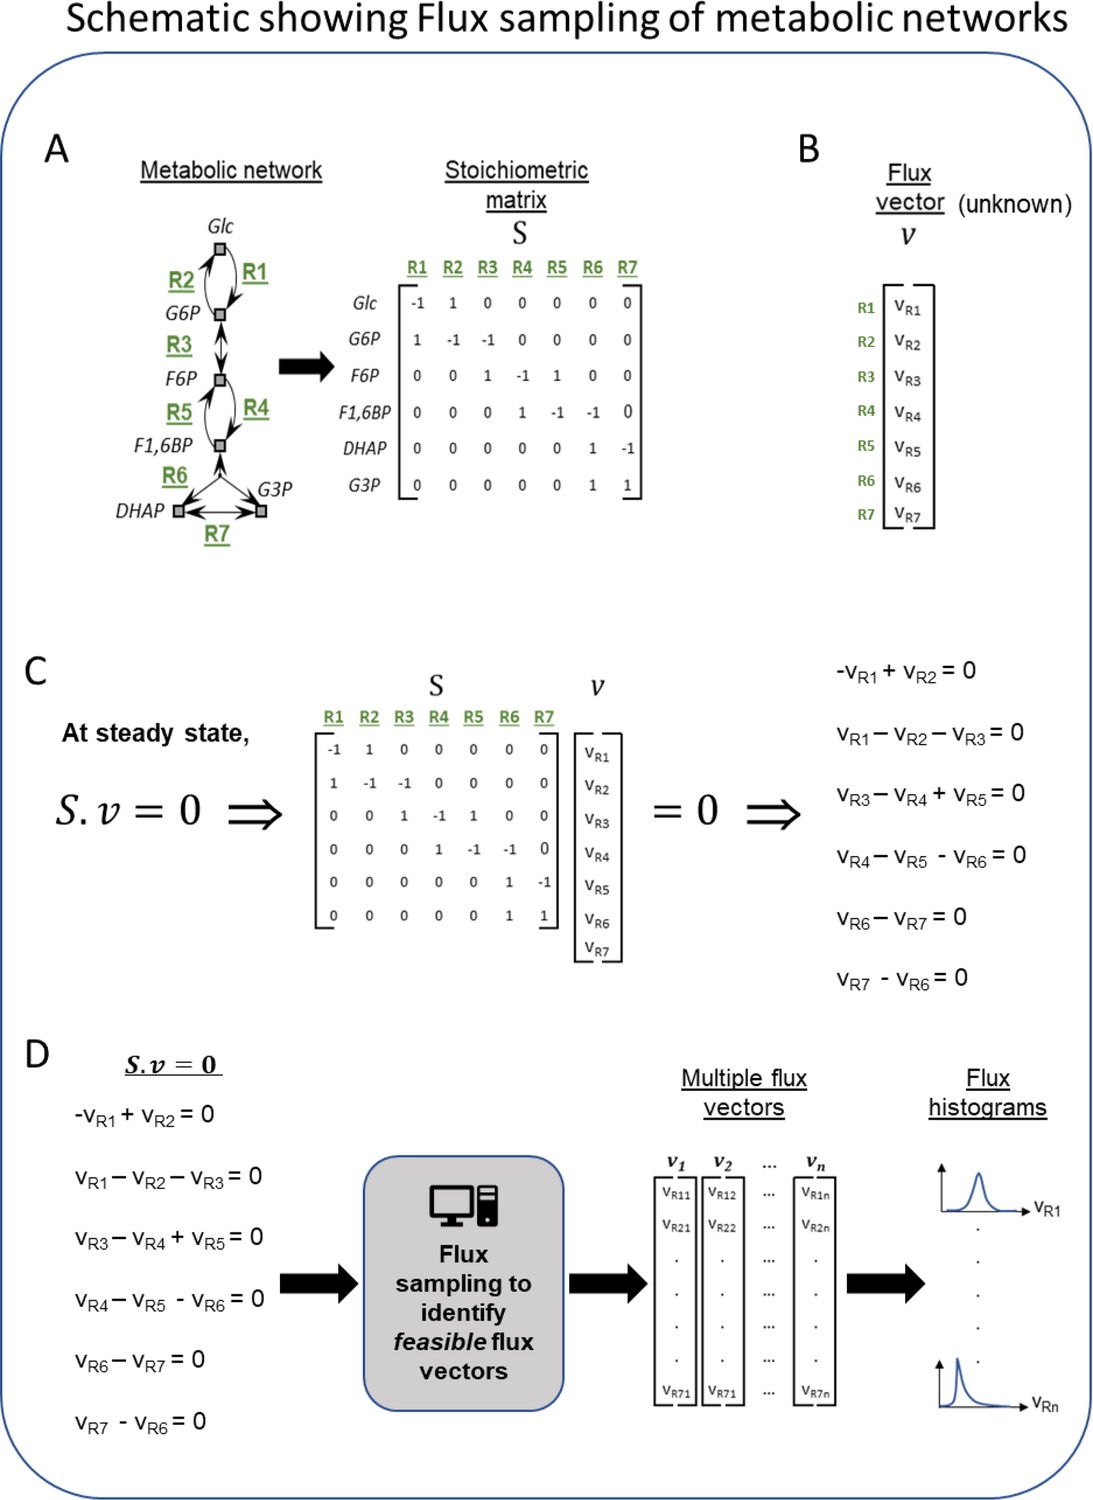
Schematic of the workflow for metabolic flux modeling.
(A) Left is a toy network of metabolic reactions showing a few reactions from the glycolysis pathway for illustration. This network of metabolic reactions (defined by nodes and arrows) is converted from the format of reaction equations into the format of a matrix called the stoichiometric matrix. Each row of the matrix represents a single metabolite in the network and each column represents a single reaction in the network. The (i,j) element of matrix S represents the stoichiometric coefficient of metabolite i in reaction j. Stoichiometric coefficients indicate how many copies of each reactant or product are consumed or produced when the reaction is utilized (often 1 or –1). By converting all the reactions of a metabolic network into this matrix format, a single column represents a single reaction in the metabolic network, including all metabolites produced or consumed in it. For example, the first column of the matrix (corresponding to reaction R1) has the value of –1 for the Glc row and 1 for G6P row, indicating that in reaction R1, one unit of Glc is consumed and one unit of G6P is produced. Likewise, each row of the matrix represents all sources of production and consumption for a single metabolite. For example, the second row of the matrix (corresponding to the metabolite G6P) has the values of 1, –1, and –1 for the reactions R1, R2, and R3, respectively. This indicates that one unit of G6P is produced in reaction R1, while one unit of G6P is consumed in reactions R2 and R3, respectively. (B) Example of a flux vector. A flux vector contains as many elements as the number of reactions in the network, and their values are typically unknown. Flux values indicate the rate at which the corresponding reaction is utilized (a forward reaction is a positive flux, and a reverse reaction is a negative flux). The goal of flux sampling is to obtain values (or distributions) for each element of the flux vector. (C) The product of the stoichiometric matrix and the flux vector (written as the product Sv) results in a set of linear algebra equations. Each linear equation has flux variables and stoichiometric coefficients. If we assume the flux is balanced in the system, then everything produced has somewhere to go or some reaction to consume it. This steady-state assumption is described mathematically by setting the matrix product to zero (Sv = 0). (D) The process of flux sampling searches the space of possible flux vectors v to find those that satisfy Sv = 0. Sampling is typically necessary because the set of equations from (C) is usually underdetermined and does not have a unique solution for the flux variables v. The computational sampling process outputs flux vectors that satisfy the equations (i.e. feasible vectors), and that also capture a diversity of feasible behaviors for how the metabolic network could achieve steady state. From this set of flux vectors, we plot histograms (distributions) of the feasible values of the flux variable for each reaction in the metabolic network. This theoretical delineation of feasible behaviors can be used for drawing biological inferences by assuming that the actual biological pathway activity falls within the feasible range of the theoretical model. When comparing two models such as bat and human, inferences arise from reactions or pathways where feasible behaviors become infeasible or vice versa. This can be seen by identifying reactions, whose flux histograms show large differences between the human and bat models.
Figure 3—figure supplement 2
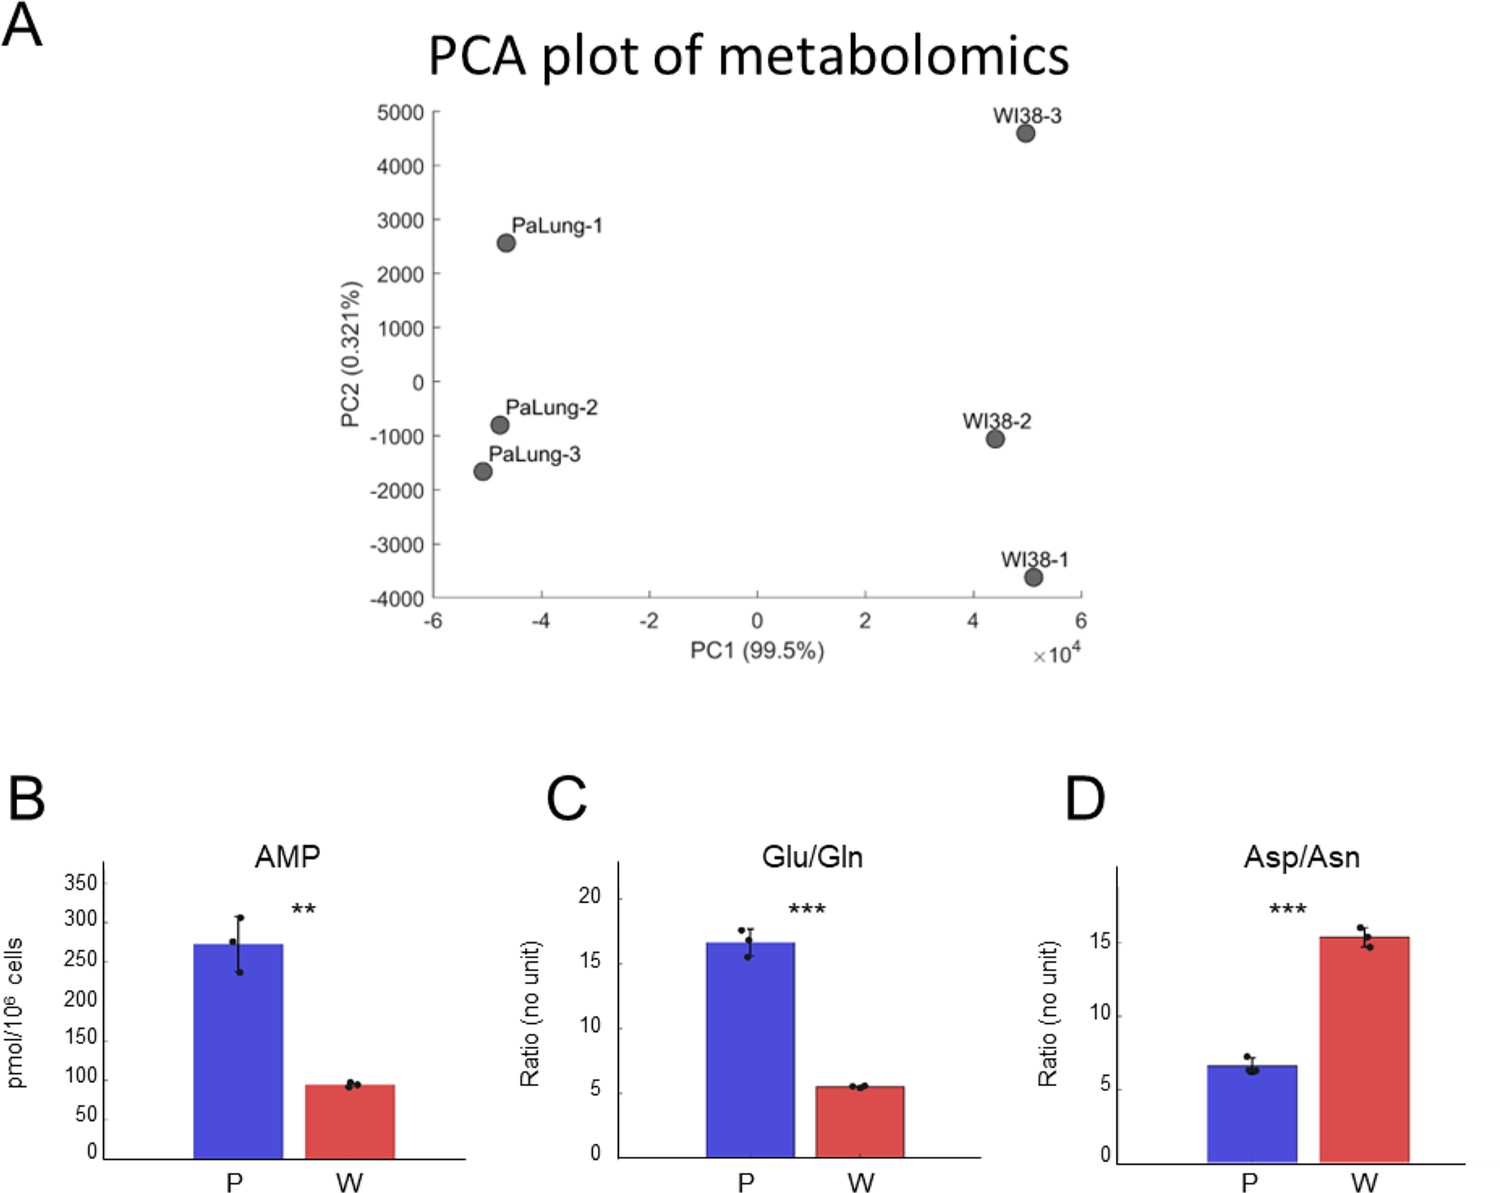
Analysis of the metabolomics data from PaLung and WI-38 cells.
(A) Principal component analysis (PCA) plot shows the separation between the three PaLung samples and the three WI-38 samples in the metabolomics data. (B–D) Bar plots of AMP (B), the ratios of Glu/Gln (C), and Asp/Asn (D) in PaLung cells (P, blue) and WI-38 cells (W, red) are shown. Bars are the mean ± SD from three independent experiments (n=3). ** or *** represents p-value≤0.01 or ≤0.001 respectively (unpaired Student’s two-sided t-test). Note that PaLung cells have a higher glutamate-to-glutamine ratio and a lower aspartate-to-asparagine ratio than WI-38 cells. This is also supported by the high expression of the gene ASNS (asparagine synthetase) in PaLung cells (Supplementary file 1). ASNS is a cytoplasmic enzyme that can convert aspartate to asparagine concomitantly with the hydrolysis of glutamine to glutamate, allowing for glutamate to be used as an alternative source for energy, or as a precursor metabolite for the synthesis of glutathione.
Figure 4
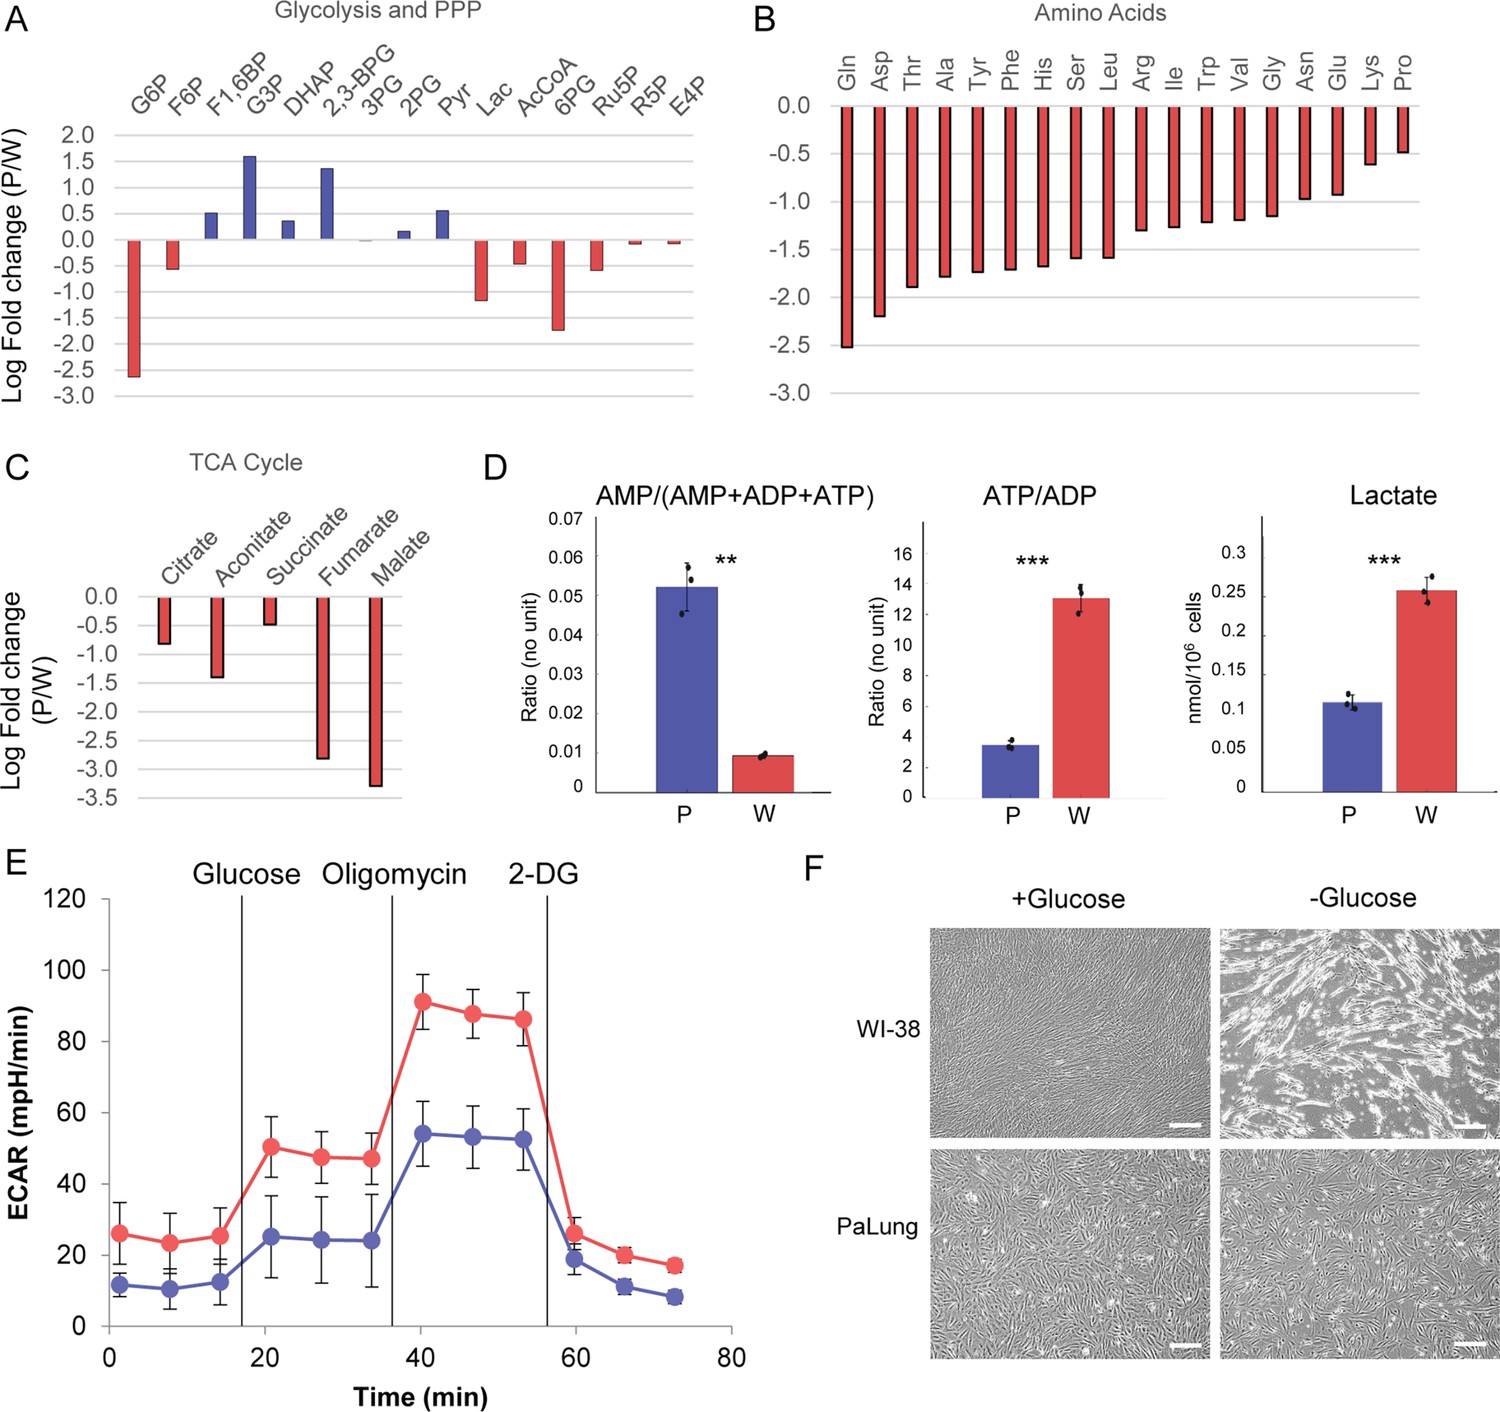
PaLung cells show basal metabolism that resembles an ischemic-like state.
(A) Fold changes (mean PaLung/mean WI-38) of metabolite abundances, obtained through targeted metabolomics profiling of central carbon metabolites in PaLung and WI-38 cells. (B and C) Amino acid and metabolite changes in TCA cycle (PaLung/WI-38) in PaLung cells and WI-38 cells. (D) Bar plots of AMP/(AMP+ADP+ATP), ATP/ADP ratio, and lactate amounts in PaLung (P) and WI-38 (W) cells plotted as mean ± SD from three independent experiments. ** and *** represent p-value≤0.01 or ≤0.001 respectively (unpaired Student’s two-sided t-test with Benjamini-Hochberg correction for multiple hypothesis testing). (E) Extracellular acidification rate (ECAR) measurement of PaLung (blue) and WI-38 (red) cells plotted as mean ± SD from n>15 independent experiments (2-DG=2-deoxy-D-glucose). (F) Phase contrast images of PaLung and WI-38 cells with or without glucose deprivation for 96 hr. Scale bar, 100 µm.
Figure 5 with 1 supplement
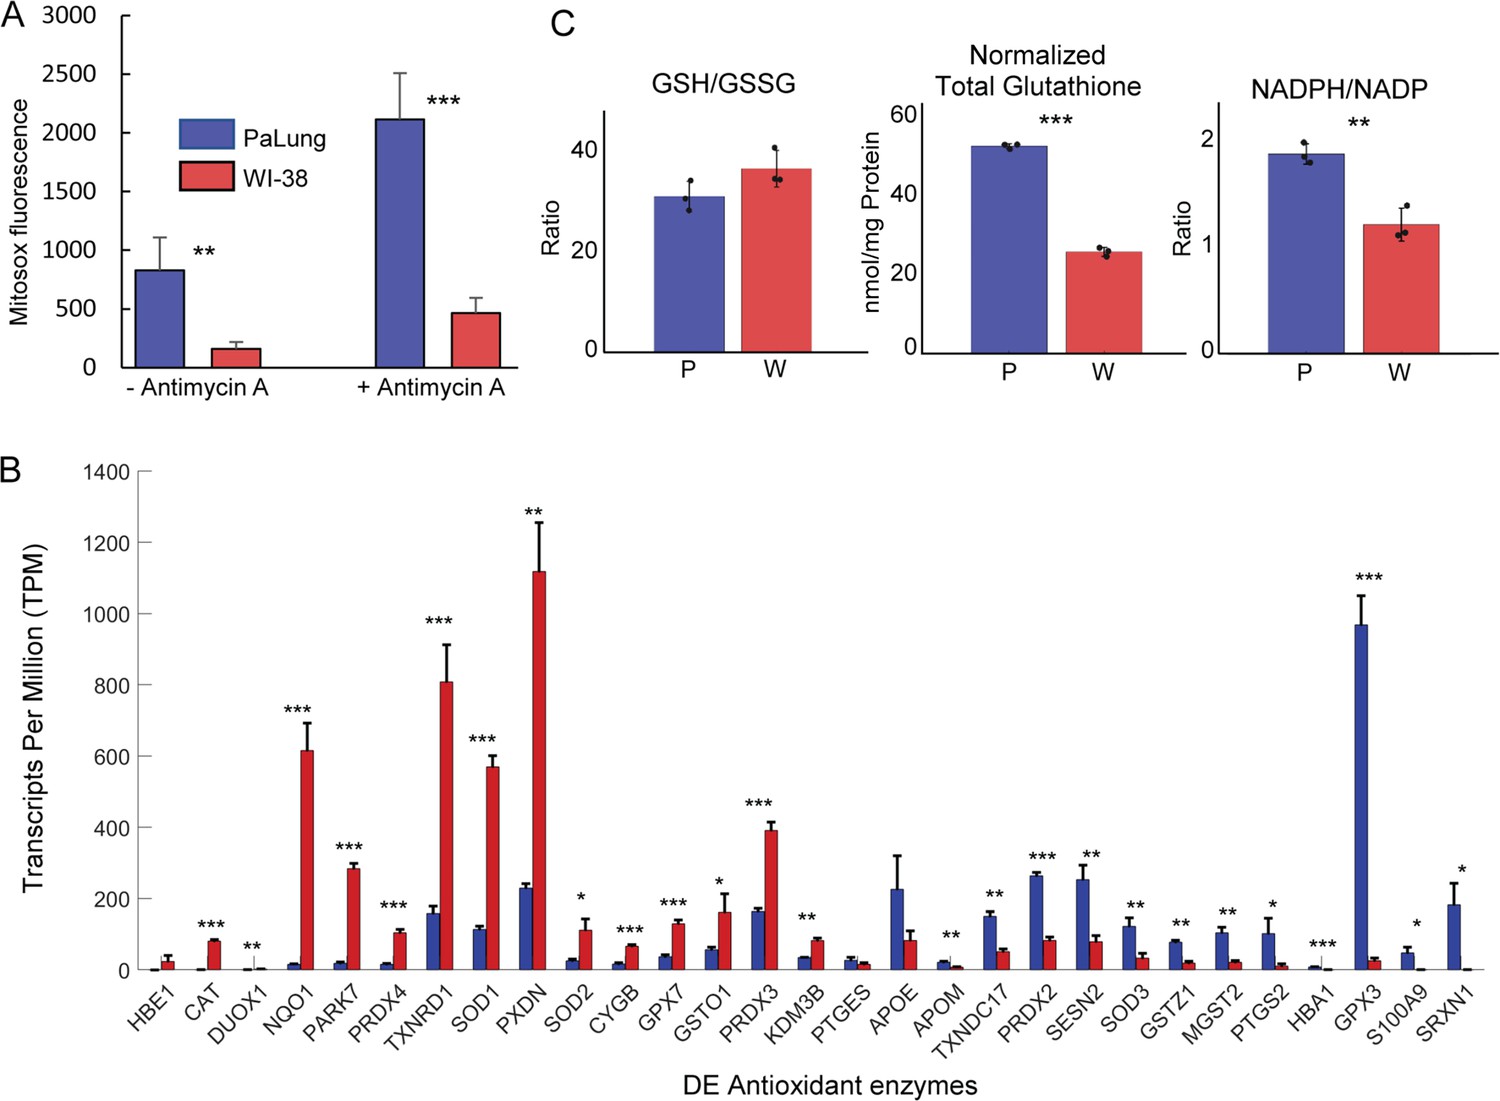
Reactive oxygen species (ROS) and antioxidant system measurements in PaLung and WI-38 cells.
(A) MitoSOX measurement of PaLung and WI-38 cells with or without antimycin A treatment for 1 hr. Antimycin A is an electron transport chain (ETC) inhibitor known to induce superoxide generation. (B) Bar charts showing the expression levels of antioxidant genes that passed our differential expression thresholds (as transcripts per million [TPM]) in PaLung (blue) and WI-38 (red) cells. Genes have been sorted in increasing order of P/W fold change. (C) Bar plots show the ratio of reduced to oxidized glutathione (GSH/GSSG), total glutathione normalized to protein content (GSH+GSSG), and the ratio of NADPH/NADP in PaLung (P) and WI-38 (W) cells. For all panels, bars are the mean ± SD from three independent experiments (n=3). *, **, or *** represents p-value<0.05, ≤0.01, or ≤0.001 respectively (unpaired Student’s two-sided t-test with Benjamini-Hochberg correction for multiple hypothesis testing).
Figure 5—figure supplement 1
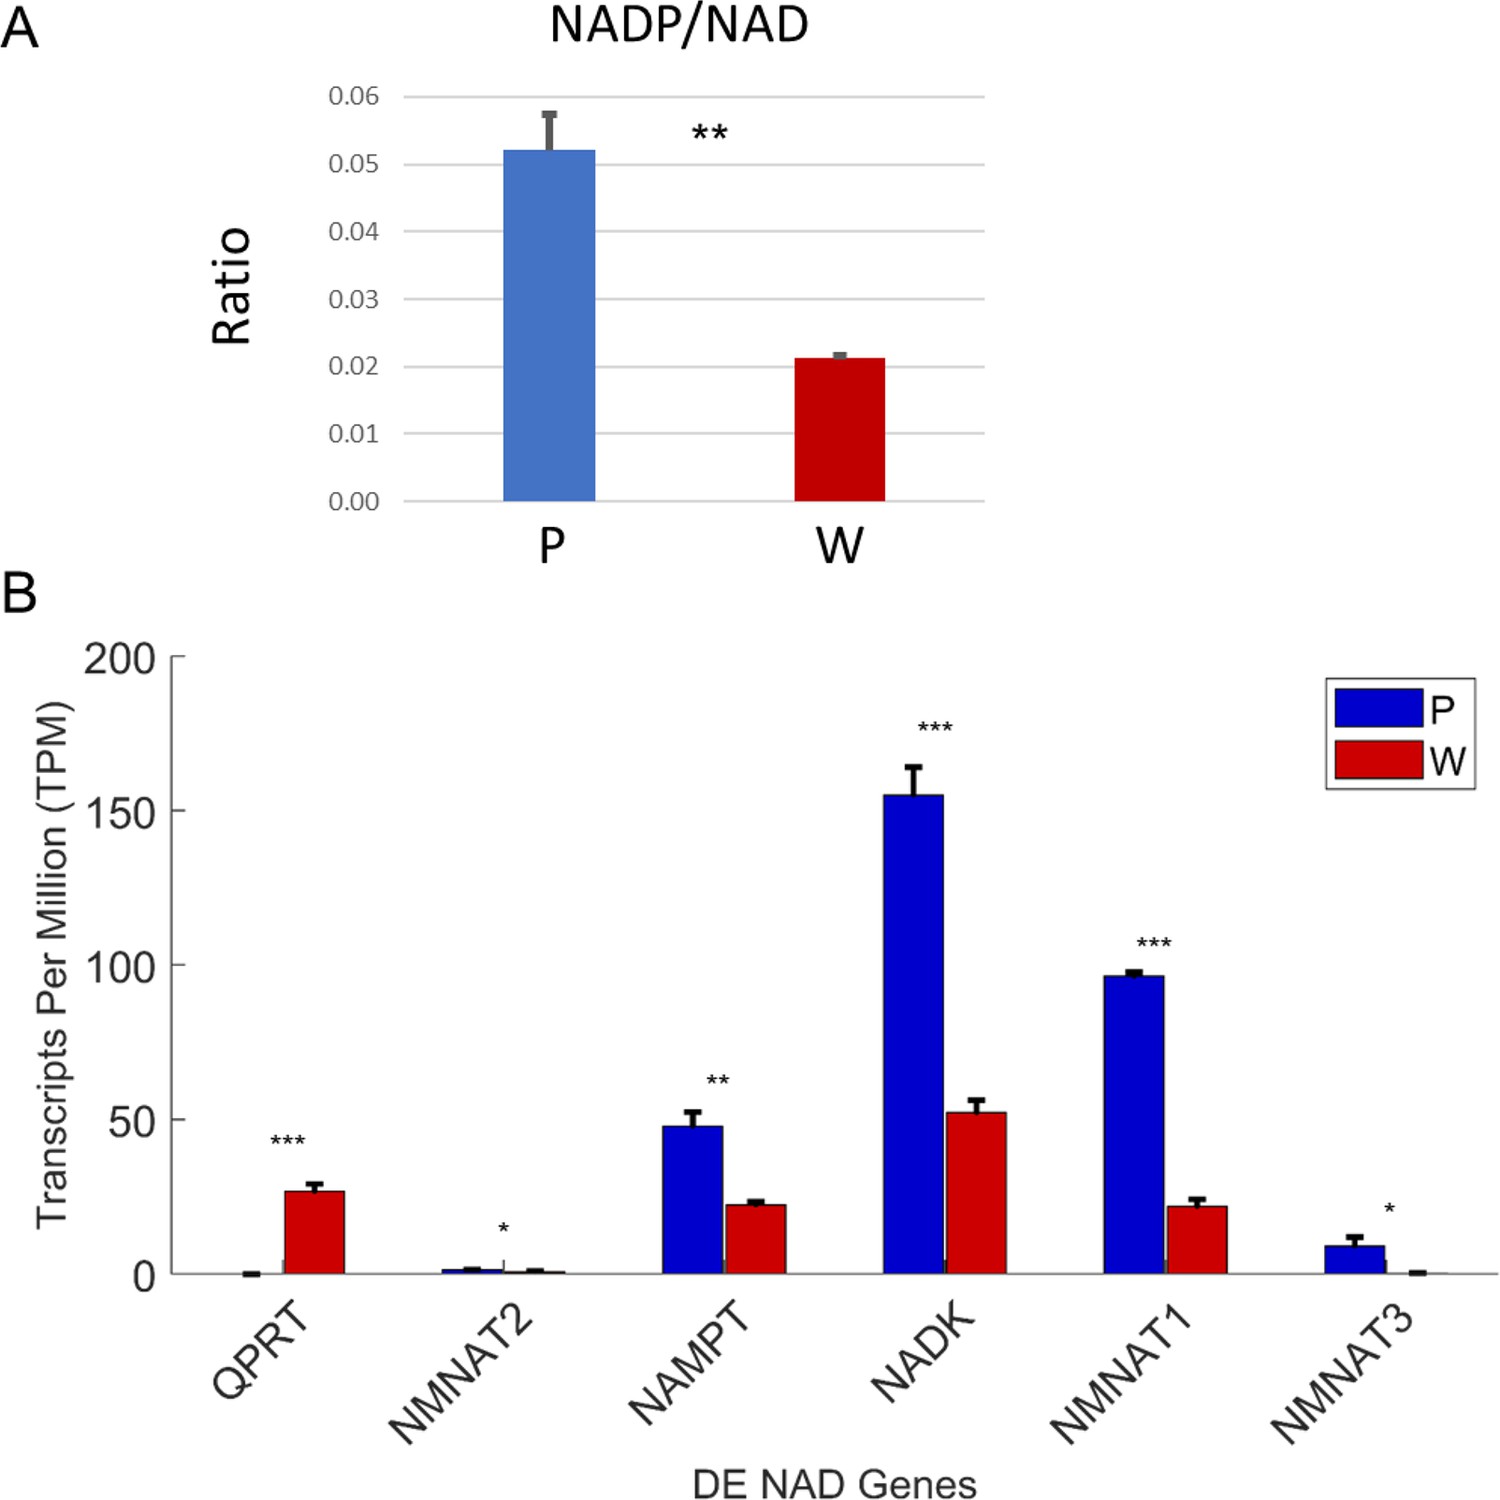
Increased phosphorylation of NAD cofactors in PaLung cells.
(A) Ratio of NADP/NAD in PaLung (P) and WI-38 (W) cells. (B) Bar graphs show the expression levels of the genes involved in NAD synthesis and phosphorylation (as transcripts per million [TPM]) in PaLung (blue) and WI-38 (red) cells. *, **, or *** represents p-value≤0.05, ≤0.01, or ≤0.001 respectively (unpaired Student’s two-sided t-test with Benjamini-Hochberg correction for multiple hypothesis testing).
Figure 6
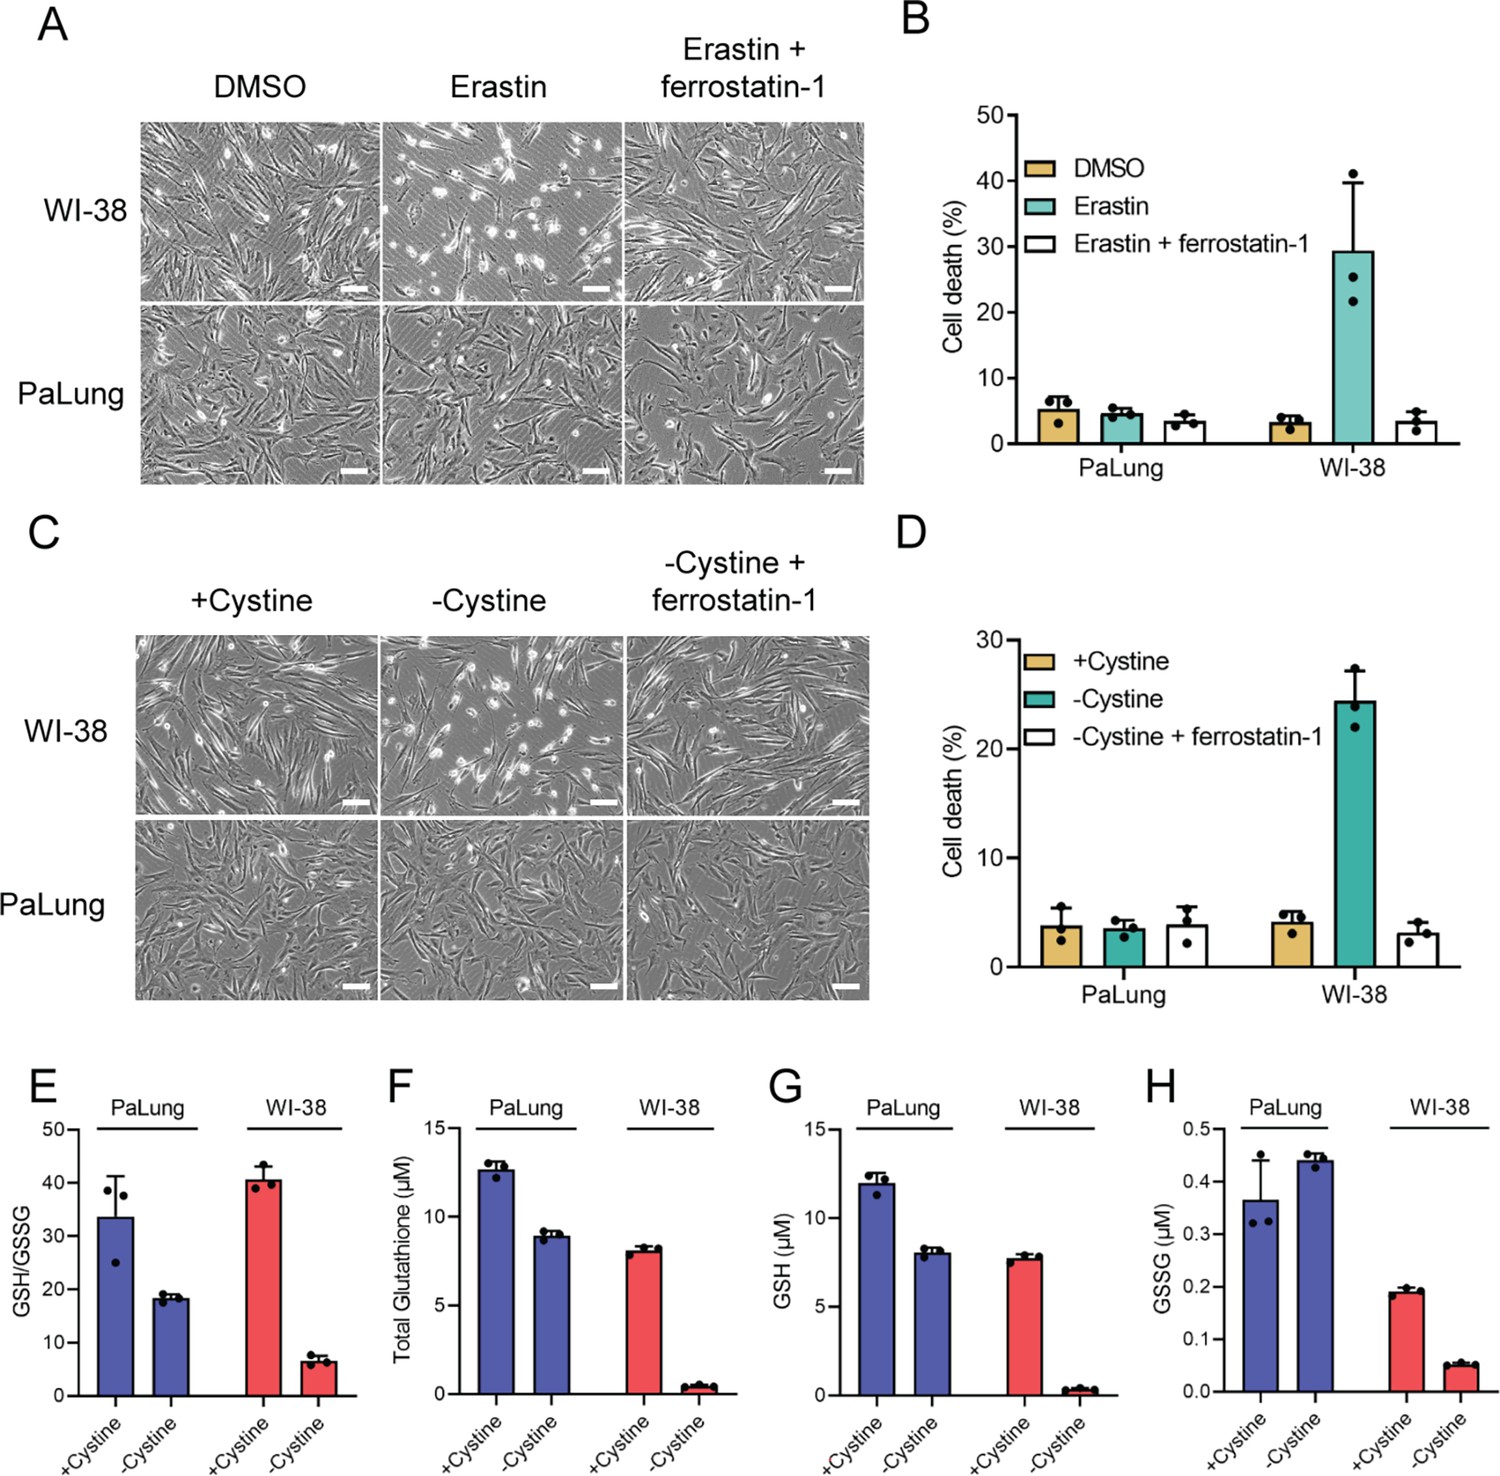
PaLung cells display high resistance to ferroptosis.
(A and B) WI-38 or PaLung cells were treated with 2.5 µM erastin and/or 1 µM ferrostatin-1. Representative images were taken at 6 hr using phase contrast microscopy (A). Propidium iodide (PI) exclusion assay was performed 24 hr after erastin treatment (B). (C and D) WI-38 or PaLung cells were cultured in media with or without cystine. Ferrostatin-1 (1 µM) was treated simultaneously. Representative images were taken at 8 hr using phase contrast microscopy (C). PI exclusion assay was performed at 24 hr after cystine deprivation (D). (E–H) WI-38 or PaLung cells were cultured in media with or without cystine for 6 hr. Intracellular glutathione levels were measured. Reduced glutathione (GSH)/oxidized glutathione (GSSG) ratio (E), total glutathione (the sum of GSH and GSSG) (F), GSH (G), and GSSG (H) levels were measured. Scale bars, 50 μm. The mean ± SD of three independent experiments is shown.
Appendix 1—figure 1
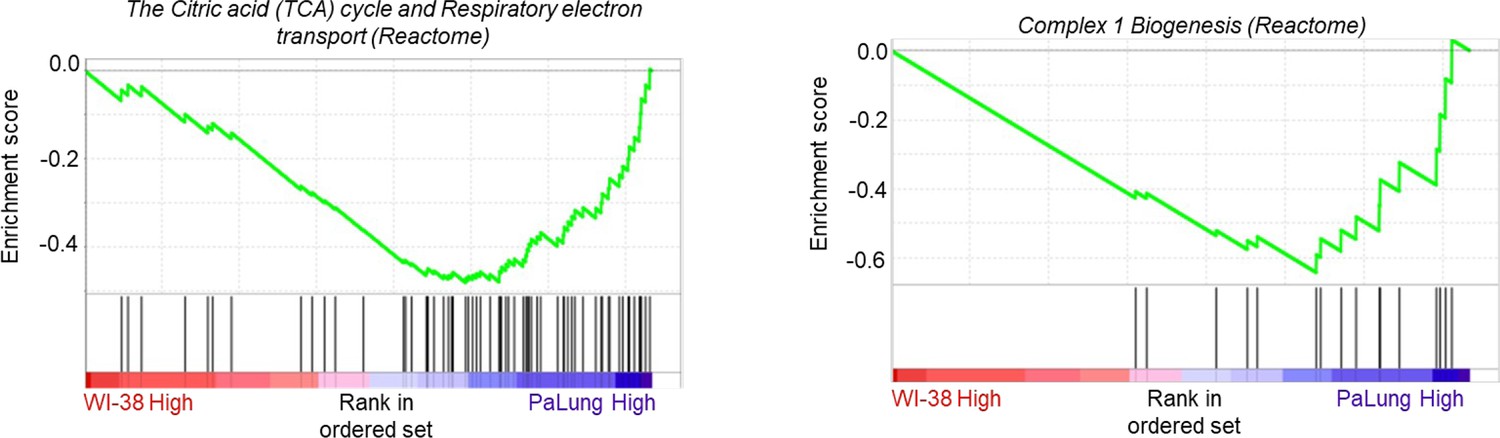
Gene set enrichment analysis (GSEA) enrichment plots of the same gene sets as shown in Figure 2D and E of the main text, after removing the outlier proteomic samples P1 and W1 from the analysis (n=2).
Appendix 2—figure 1
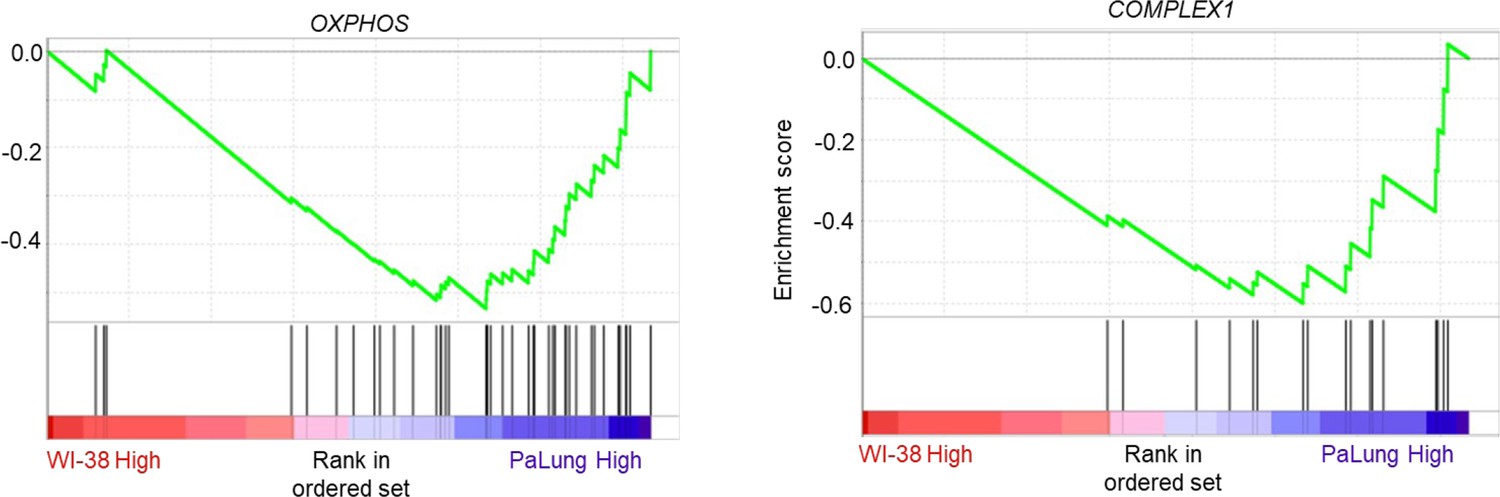
Gene set enrichment analysis (GSEA) enrichment plots of the gene sets that are biological equivalents of the gene sets shown in Figure 2D and E of the main text.
This analysis was performed using the MitoCarta 3.0 gene set list instead of the Gene Ontology Biological Process (GO BP) gene set list used to generate Figure 2D and E.
Appendix 3—figure 1
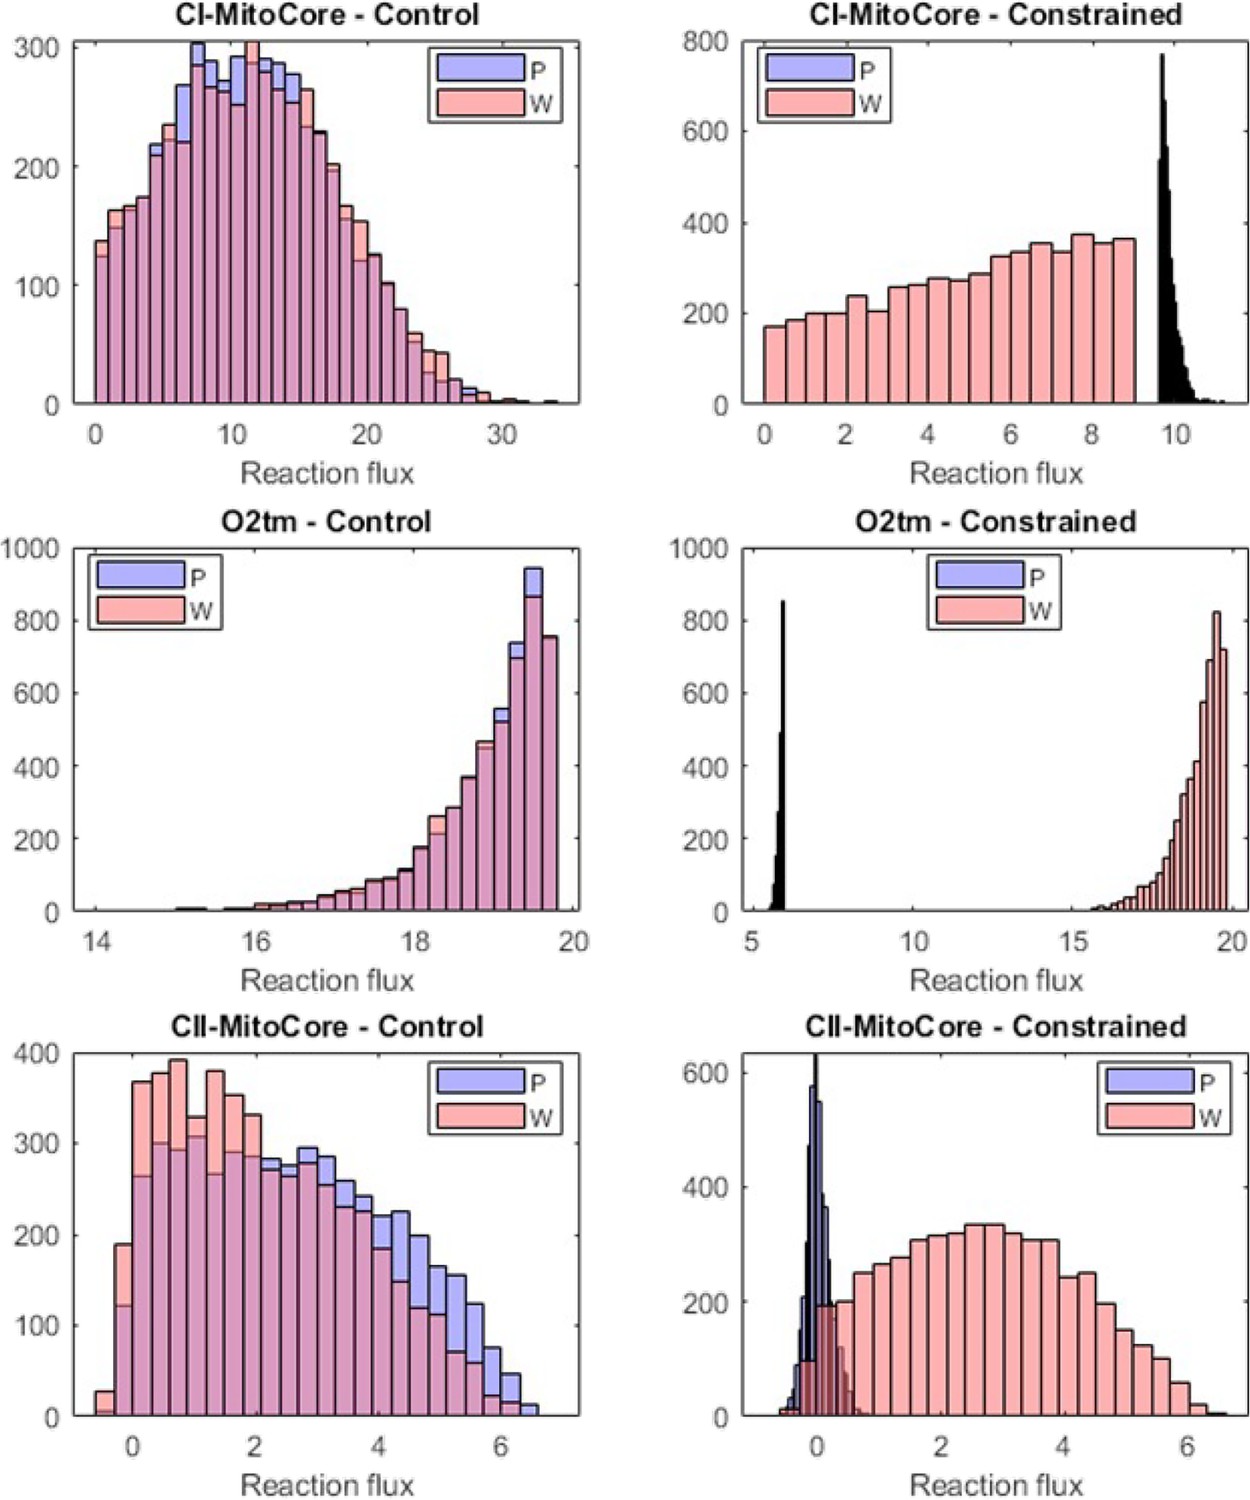
Flux sampling histograms of the P and W metabolic models in the unconstrained control (left column) and the constrained (right column) cases.
The P fluxes are in blue and the W fluxes in red. The first two rows show the constrained reactions (Complex I and O2), while the third row shows the flux histograms of the Complex II reaction.
Appendix 3—figure 2
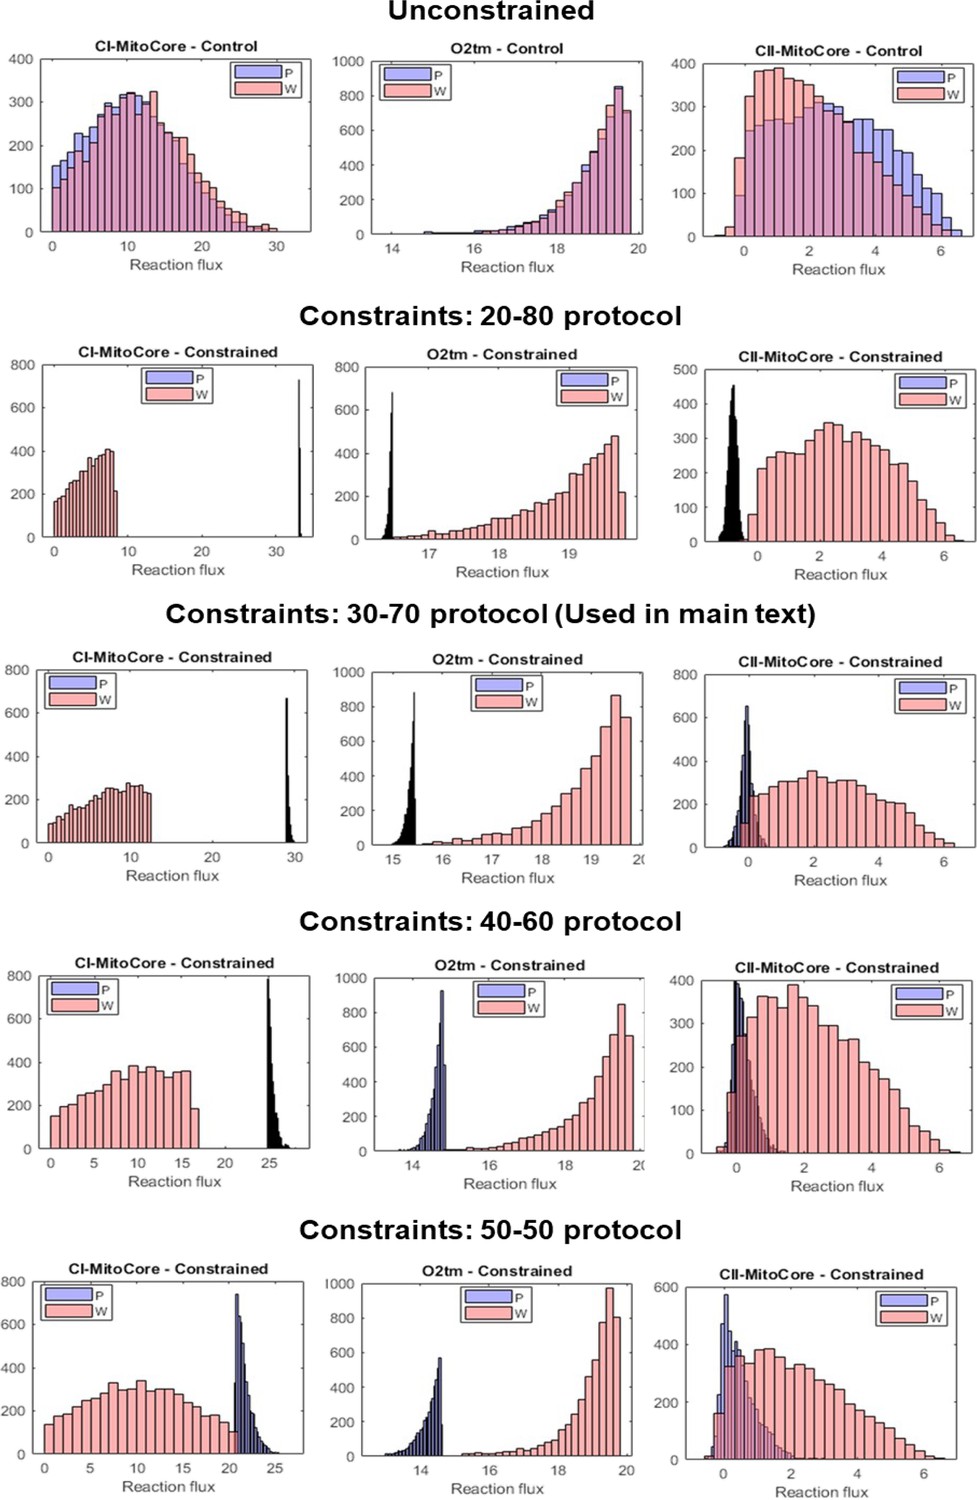
Flux sampling histograms of the P and W metabolic models under different threshold values for constraints.
Each row corresponds to a constraint scheme (unconstrained, 20-80, 30-70, 40-60, and 50-50), and was obtained by running our script with different minFrac values. Within each panel, the P model fluxes are in blue and the W model fluxes in red. The leftmost column shows the flux histograms of the Complex I reaction, the middle column shows flux histograms of the mitochondrial O2 transport reaction, and the rightmost column shows the flux histograms of the Complex II reaction.
Author response image 1

Histograms of coefficient-of-variation (CV) for the four protein subsets (defined by p-value and log fold change).
Each row corresponds to a different subset indicated by the title above. Within each row, the blue histogram corresponds to the CV from the 3 PaLung samples, and the red histogram corresponds to the CV from the 3 WI-38 samples. The one major discrepancy is that the histogram for the WI-38 samples in subset 1 (Row one right panel), contains much higher values than the other 7 histograms.
Author response image 2

Histograms of log(abundance) for the four protein subsets (defined by p-value and log fold change) for WI-38 samples.
Each panel corresponds to a different subset indicated by the title above.
Author response image 3

Scatter plot of Log fold change of proteomic data vs Log fold change of transcriptomics data.
Each point represents a protein/gene that was detected in both proteomics and transcriptomics experiments. Log fold change was computed in each case as log2(PaLung /WI-38).
Author response image 4

Flux histograms showing the feasible flux distributions for the Complex I (CI) and the mitochondrial oxygen transport (O2) reactions in the P (PaLung) and W (WI-38) metabolic models.
Each column corresponds to setting constraints as per one of the four experiments described above.
Tables
Appendix 1—table 1
Table showing the top 35 gene sets enriched in the PaLung mitochondrial proteomics samples, after removing the outlier samples P1 and W1.
Columns indicate the name of the gene set, size (number of genes in gene set), normalized enrichment score, and the false discovery rate (FDR) value.
| NAME | SIZE | NES | FDR q-val |
|---|---|---|---|
| MUSCLE CONTRACTION GOBP GO:0006936 | 35 | –2.301 | 0.002 |
| NICOTINIC ACETYLCHOLINE RECEPTOR SIGNALING PATHWAY PANTHER PATHWAY P00044 | 15 | –2.191 | 0.012 |
| REGULATION OF CELL JUNCTION ASSEMBLY GOBP GO:1901888 | 15 | –2.163 | 0.011 |
| THE CITRIC ACID (TCA) CYCLE AND RESPIRATORY ELECTRON TRANSPORT REACTOME R-HSA-1428517.1 | 64 | –2.154 | 0.011 |
| HALLMARK_OXIDATIVE_PHOSPHORYLATION MSIGDB_C2 HALLMARK_OXIDATIVE_PHOSPHORYLATION | 91 | –2.142 | 0.010 |
| COLLAGEN FORMATION REACTOME DATABASE ID RELEASE 71 1474290 | 31 | –2.096 | 0.015 |
| RESPIRATORY ELECTRON TRANSPORT, ATP SYNTHESIS BY CHEMIOSMOTIC COUPLING, AND HEAT PRODUCTION BY UNCOUPLING PROTEINS. REACTOME R-HSA-163200.1 | 32 | –2.074 | 0.017 |
| RESPIRATORY ELECTRON TRANSPORT REACTOME R-HSA-611105.3 | 32 | –2.059 | 0.019 |
| NADH DEHYDROGENASE COMPLEX ASSEMBLY GOBP GO:0010257 | 16 | –2.059 | 0.017 |
| EPH-EPHRIN SIGNALING REACTOME DATABASE ID RELEASE 71 2682334 | 30 | –2.057 | 0.016 |
| COMPLEX I BIOGENESIS REACTOME R-HSA-6799198.1 | 16 | –2.036 | 0.018 |
| MUSCLE SYSTEM PROCESS GOBP GO:0003012 | 40 | –2.033 | 0.017 |
| RHO GTPASES ACTIVATE PKNS REACTOME DATABASE ID RELEASE 71 5625740 | 17 | –2.030 | 0.016 |
| ACTIN FILAMENT-BASED MOVEMENT GOBP GO:0030048 | 17 | –2.022 | 0.017 |
| ACTOMYOSIN STRUCTURE ORGANIZATION GOBP GO:0031032 | 21 | –2.021 | 0.016 |
| MITOCHONDRIAL RESPIRATORY CHAIN COMPLEX I ASSEMBLY GOBP GO:0032981 | 16 | –1.999 | 0.019 |
| INTEGRIN SIGNALLING PATHWAY PANTHER PATHWAY P00034 | 44 | –1.994 | 0.019 |
| KERATINIZATION GOBP GO:0031424 | 15 | –1.976 | 0.021 |
| MITOCHONDRIAL ATP SYNTHESIS COUPLED ELECTRON TRANSPORT GOBP GO:0042775 | 26 | –1.971 | 0.021 |
| MITOCHONDRIAL ELECTRON TRANSPORT, NADH TO UBIQUINONE GOBP GO:0006120 | 15 | –1.968 | 0.021 |
| MITOCHONDRIAL RESPIRATORY CHAIN COMPLEX ASSEMBLY GOBP GO:0033108 | 19 | –1.966 | 0.020 |
| CORNIFICATION GOBP GO:0070268 | 15 | –1.963 | 0.019 |
| SYSTEM PROCESS GOBP GO:0003008 | 77 | –1.953 | 0.021 |
| MIDBRAIN DEVELOPMENT GOBP GO:0030901 | 15 | –1.953 | 0.020 |
| COLLAGEN BIOSYNTHESIS AND MODIFYING ENZYMES REACTOME R-HSA-1650814.3 | 25 | –1.949 | 0.020 |
| KERATINIZATION REACTOME DATABASE ID RELEASE 71 6805567 | 15 | –1.936 | 0.022 |
| ELECTRON TRANSPORT CHAIN (OXPHOS SYSTEM IN MITOCHONDRIA) WIKIPATHWAYS_20191210 WP111 HOMO SAPIENS | 28 | –1.933 | 0.022 |
| NABA_CORE_MATRISOME MSIGDB_C2 NABA_CORE_MATRISOME | 34 | –1.921 | 0.025 |
| CELLULAR RESPIRATION GOBP GO:0045333 | 52 | –1.905 | 0.028 |
| HALLMARK_ESTROGEN_RESPONSE_EARLY MSIGDB_C2 HALLMARK_ESTROGEN_RESPONSE_EARLY | 16 | –1.902 | 0.028 |
| EXTRACELLULAR MATRIX ORGANIZATION REACTOME DATABASE ID RELEASE 71 1474244 | 59 | –1.895 | 0.029 |
| RHO GTPASES ACTIVATE PAKS REACTOME R-HSA-5627123.2 | 16 | –1.863 | 0.038 |
| INFLAMMATION MEDIATED BY CHEMOKINE AND CYTOKINE SIGNALING PATHWAY PANTHER PATHWAY P00031 | 30 | –1.848 | 0.043 |
| ELECTRON TRANSPORT CHAIN GOBP GO:0022900 | 31 | –1.842 | 0.044 |
| ATP SYNTHESIS COUPLED ELECTRON TRANSPORT GOBP GO:0042773 | 27 | –1.832 | 0.048 |
Appendix 2—table 1
Table showing the top gene sets enriched in the PaLung mitochondrial proteomics samples, when gene set enrichment analysis (GSEA) was performed using the MitoCarta 3.0 gene set list instead of the Gene Ontology Biological Process (GO BP) gene set.
Columns indicate the name of the gene set, size (number of genes in gene set), normalized enrichment score, and the false discovery rate (FDR) value.
| NAME | SIZE | NES | FDR q-val |
|---|---|---|---|
| OXPHOS_SUBUNITS | 34 | –2.186 | 0.002 |
| OXPHOS | 41 | –2.166 | 0.001 |
| CARBOHYDRATE_METABOLISM | 36 | –2.004 | 0.005 |
| TRANSLATION | 16 | –1.987 | 0.005 |
| COMPLEX_I | 17 | –1.966 | 0.005 |
| CI_SUBUNITS | 15 | –1.892 | 0.007 |
| FATTY_ACID_OXIDATION | 20 | –1.864 | 0.007 |
| METALS_AND_COFACTORS | 30 | –1.794 | 0.011 |
| METABOLISM | 153 | –1.782 | 0.011 |
| AMINO_ACID_METABOLISM | 33 | –1.763 | 0.011 |
| MITOCHONDRIAL_CENTRAL_DOGMA | 24 | –1.609 | 0.030 |
| TCA_CYCLE | 15 | –1.510 | 0.053 |
| LIPID_METABOLISM | 43 | –1.480 | 0.057 |
| PROTEIN_IMPORT_SORTING_AND_HOMEOSTASIS | 24 | –1.200 | 0.223 |
| PROTEIN_HOMEOSTASIS | 18 | –1.053 | 0.377 |
Appendix 3—table 1
Minimum and maximum flux values possible for the Complex I and mitochondrial O2 transport reaction when different constraints are applied to the P and W metabolic models.
| Constraint description (all follow the 30-70 protocols) | Complex 1 | Oxygen transport | ||||||
|---|---|---|---|---|---|---|---|---|
| Bat (P model) | Human (W model) | Bat (P model) | Human (W model) | |||||
| Min | Max | Min | Max | Min | Max | Min | Max | |
| Control simulation – no constraints | 0 | 41.43 | 0 | 41.44 | 0 | 19.8 | 0 | 19.8 |
| Ideal target flux range expected with the 30-70 protocol, when CI and O2 are independent of each other | 29 | 41.43 | 0 | 12.43 | 0 | 5.94 | 13.86 | 19.8 |
| Constraining only the Complex I reaction | 29 | 41.43 | 0 | 12.43 | 13.58 | 19.8 | 0 | 19.8 |
| Constraining only the O2 reaction | 0 | 13.74 | 0 | 41.43 | 0 | 5.94 | 13.86 | 19.8 |
| Constraining CI first, then constraining O2, without avoiding flux range overlap | 29 | 32.72 | 0 | 12.43 | 13.58 | 15.45 | 13.86 | 19.8 |
| Constraining CI first, then constraining O2, avoiding flux range overlap | 29 | 32.72 | 0 | 12.43 | 13.58 | 15.45 | 15.45 | 19.8 |
| Constraining O2 first, then constraining CI, without avoiding flux range overlap | 9.61 | 13.73 | 0 | 12.43 | 3.88 | 5.94 | 13.86 | 19.8 |
| Constraining O2 first, then constraining CI, avoiding flux range overlap | 9.61 | 13.73 | 0 | 9.61 | 3.88 | 5.94 | 13.86 | 19.8 |
Author response table 1
| NAME | SIZE | NES | FDR |
|---|---|---|---|
| L13A-MEDIATED TRANSLATIONAL SILENCING OF CERULOPLASMIN EXPRESSION REACTOME DATABASE ID RELEASE 71 156827 | 102 | -1.86459 | 0 |
| CAP-DEPENDENT TRANSLATION INITIATION REACTOME DATABASE ID RELEASE 71 72737 | 110 | -1.85211 | 0 |
| TRANSLATIONAL INITIATION GOBP GO:0006413 | 114 | -1.8446 | 0 |
| REGULATION OF EXPRESSION OF SLITS AND ROBOS REACTOME DATABASE ID RELEASE 71 9010553 | 153 | -1.84266 | 0 |
| NONSENSE MEDIATED DECAY (NMD) ENHANCED BY THE EXON JUNCTION COMPLEX (EJC) REACTOME R-HSA-975957.1 | 107 | -1.83796 | 0 |
| GTP HYDROLYSIS AND JOINING OF THE 60S RIBOSOMAL SUBUNIT REACTOME R-HSA-72706.2 | 103 | -1.82911 | 0 |
| NUCLEAR-TRANSCRIBED MRNA CATABOLIC PROCESS GOBP GO:0000956 | 179 | -1.82134 | 0 |
| MRNA CATABOLIC PROCESS GOBP GO:0006402 | 191 | -1.81824 | 0 |
| EUKARYOTIC TRANSLATION INITIATION REACTOME DATABASE ID RELEASE 71 72613 | 110 | -1.81618 | 0 |
| EUKARYOTIC TRANSLATION ELONGATION REACTOME R-HSA-156842.2 | 85 | -1.81611 | 0 |
| SRP-DEPENDENT COTRANSLATIONAL PROTEIN TARGETING TO MEMBRANE REACTOME R-HSA-1799339.2 | 103 | -1.81578 | 0 |
| SELENOCYSTEINE SYNTHESIS REACTOME DATABASE ID RELEASE 71 2408557 | 84 | -1.81445 | 0 |
| NONSENSE-MEDIATED DECAY (NMD) REACTOME R-HSA-927802.2 | 107 | -1.81251 | 0 |
| TRANSLATION REACTOME DATABASE ID RELEASE 71 72766 | 278 | -1.8121 | 0 |
| RNA CATABOLIC PROCESS GOBP GO:0006401 | 214 | -1.81042 | 0 |
| PEPTIDE BIOSYNTHETIC PROCESS GOBP GO:0043043 | 313 | -1.8098 | 0 |
| FORMATION OF A POOL OF FREE 40S SUBUNITS REACTOME DATABASE ID RELEASE 71 72689 | 92 | -1.8098 | 0 |
| INFLUENZA LIFE CYCLE REACTOME DATABASE ID RELEASE 71 168255 | 129 | -1.80935 | 0 |
| RESPONSE OF EIF2AK4 (GCN2) TO AMINO ACID DEFICIENCY REACTOME DATABASE ID RELEASE 71 9633012 | 92 | -1.80856 | 0 |
| VIRAL MRNA TRANSLATION REACTOME DATABASE ID RELEASE 71 192823 | 81 | -1.80841 | 0 |
| PEPTIDE CHAIN ELONGATION REACTOME R-HSA-156902.2 | 81 | -1.80743 | 0 |
| NONSENSE MEDIATED DECAY (NMD) INDEPENDENT OF THE EXON JUNCTION COMPLEX (EJC) REACTOME R-HSA-975956.1 | 87 | -1.80499 | 0 |
| INFLUENZA VIRAL RNA TRANSCRIPTION AND REPLICATION REACTOME DATABASE ID RELEASE 71 168273 | 121 | -1.80381 | 0 |
| PROTEIN LOCALIZATION TO ENDOPLASMIC RETICULUM GOBP GO:0070972 | 119 | -1.80193 | 0 |
| NUCLEAR-TRANSCRIBED MRNA CATABOLIC PROCESS, NONSENSE-MEDIATED DECAY GOBP GO:0000184 | 107 | -1.79958 | 0 |
| SIGNALING BY ROBO RECEPTORS REACTOME R-HSA-376176.4 | 193 | -1.79657 | 0 |
| INFLUENZA INFECTION REACTOME R-HSA-168254.2 | 139 | -1.79422 | 0 |
| TRANSLATION GOBP GO:0006412 | 296 | -1.79232 | 0 |
| EUKARYOTIC TRANSLATION TERMINATION REACTOME R-HSA-72764.4 | 85 | -1.79057 | 0 |
| SELENOAMINO ACID METABOLISM REACTOME DATABASE ID RELEASE 71 2408522 | 105 | -1.7747 | 0 |
| MAJOR PATHWAY OF RRNA PROCESSING IN THE NUCLEOLUS AND CYTOSOL REACTOME R-HSA-6791226.3 | 170 | -1.77321 | 0 |
| ESTABLISHMENT OF PROTEIN LOCALIZATION TO ENDOPLASMIC RETICULUM GOBP GO:0072599 | 100 | -1.76931 | 0 |
| COTRANSLATIONAL PROTEIN TARGETING TO MEMBRANE GOBP GO:0006613 | 90 | -1.7682 | 0 |
| RRNA PROCESSING IN THE NUCLEUS AND CYTOSOL REACTOME R-HSA-8868773.3 | 180 | -1.76363 | 2.64E-05 |
| PROTEIN TARGETING TO MEMBRANE GOBP GO:0006612 | 134 | -1.76038 | 2.57E-05 |
| CYTOPLASMIC RIBOSOMAL PROTEINS WIKIPATHWAYS_20191210 WP477 HOMO SAPIENS | 82 | -1.75783 | 4.97E-05 |
| PROTEIN TARGETING TO ER GOBP GO:0045047 | 97 | -1.75446 | 7.25E-05 |
| VIRAL GENE EXPRESSION GOBP GO:0019080 | 122 | -1.75351 | 7.06E-05 |
| SRP-DEPENDENT COTRANSLATIONAL PROTEIN TARGETING TO MEMBRANE GOBP GO:0006614 | 85 | -1.75031 | 6.88E-05 |
| VIRAL TRANSCRIPTION GOBP GO:0019083 | 105 | -1.74701 | 6.71E-05 |
| ACTIVATION OF THE MRNA UPON BINDING OF THE CAP-BINDING COMPLEX AND EIFS, AND SUBSEQUENT BINDING TO 43S REACTOME R-HSA-72662.3 | 56 | -1.74344 | 8.72E-05 |
| AMIDE BIOSYNTHETIC PROCESS GOBP GO:0043604 | 383 | -1.74084 | 8.51E-05 |
| NUCLEOBASE-CONTAINING COMPOUND CATABOLIC PROCESS GOBP GO:0034655 | 322 | -1.73596 | 1.04E-04 |
| CYTOPLASMIC TRANSLATION GOBP GO:0002181 | 54 | -1.73436 | 1.02E-04 |
| RRNA PROCESSING REACTOME DATABASE ID RELEASE 71 72312 | 189 | -1.73364 | 9.96E-05 |
| TRANSLATION INITIATION COMPLEX FORMATION REACTOME DATABASE ID RELEASE 71 72649 | 55 | -1.73183 | 9.75E-05 |
| RIBOSOMAL SCANNING AND START CODON RECOGNITION REACTOME R-HSA-72702.3 | 55 | -1.71426 | 2.11E-04 |
| PROTEIN TARGETING GOBP GO:0006605 | 283 | -1.70904 | 2.62E-04 |
| FORMATION OF THE TERNARY COMPLEX, AND SUBSEQUENTLY, THE 43S COMPLEX REACTOME DATABASE ID RELEASE 71 72695 | 48 | -1.70325 | 4.03E-04 |
| CELLULAR NITROGEN COMPOUND CATABOLIC PROCESS GOBP GO:0044270 | 345 | -1.69784 | 4.66E-04 |
| ESTABLISHMENT OF PROTEIN LOCALIZATION TO ORGANELLE GOBP GO:0072594 | 325 | -1.69391 | 6.33E-04 |
| AROMATIC COMPOUND CATABOLIC PROCESS GOBP GO:0019439 | 347 | -1.6925 | 6.90E-04 |
| PEPTIDE METABOLIC PROCESS GOBP GO:0006518 | 392 | -1.69196 | 6.94E-04 |
| CELLULAR RESPONSES TO STRESS REACTOME DATABASE ID RELEASE 71 2262752 | 456 | -1.67591 | 0.001561 |
| HETEROCYCLE CATABOLIC PROCESS GOBP GO:0046700 | 343 | -1.66849 | 0.00217 |
| ESTABLISHMENT OF PROTEIN LOCALIZATION TO MEMBRANE GOBP GO:0090150 | 215 | -1.66714 | 0.00226 |
| CELLULAR RESPONSES TO EXTERNAL STIMULI REACTOME DATABASE ID RELEASE 71 8953897 | 459 | -1.66708 | 0.002236 |
| ORGANIC CYCLIC COMPOUND CATABOLIC PROCESS GOBP GO:1901361 | 365 | -1.64869 | 0.004763 |
| CALNEXIN CALRETICULIN CYCLE REACTOME R-HSA-901042.2 | 23 | -1.60474 | 0.022972 |
| N-GLYCAN TRIMMING IN THE ER AND CALNEXIN CALRETICULIN CYCLE REACTOME DATABASE ID RELEASE 71 532668 | 32 | -1.59981 | 0.026341 |
| RIBOSOMAL LARGE SUBUNIT BIOGENESIS GOBP GO:0042273 | 64 | -1.58547 | 0.041181 |
| OXYGEN-DEPENDENT PROLINE HYDROXYLATION OF HYPOXIA-INDUCIBLE FACTOR Α REACTOME DATABASE ID RELEASE 71 1234176 | 61 | -1.58214 | 0.045084 |
| ER QUALITY CONTROL COMPARTMENT (ERQC) REACTOME DATABASE ID RELEASE 71 901032 | 18 | -1.57559 | 0.054216 |
| RIBOSOME ASSEMBLY GOBP GO:0042255 | 49 | -1.56563 | 0.071338 |
| AMINO ACID AND DERIVATIVE METABOLISM REACTOME R-HSA-71291.6 | 282 | -1.56487 | 0.071759 |
| CITRIC ACID CYCLE (TCA CYCLE) REACTOME DATABASE ID RELEASE 71 71403 | 22 | -1.56128 | 0.078243 |
| TRANSLATION FACTORS WIKIPATHWAYS_20191210 WP107 HOMO SAPIENS | 48 | -1.55985 | 0.079794 |
| REGULATION OF TP53 DEGRADATION REACTOME R-HSA-6804757.1 | 31 | -1.55649 | 0.086393 |
| VIRAL PROCESS GOBP GO:0016032 | 259 | -1.5553 | 0.08777 |
| SIGNALING BY FGFR4 REACTOME R-HSA-5654743.2 | 27 | -1.55424 | 0.088823 |
| REGULATION OF CALCIUM-MEDIATED SIGNALING GOBP GO:0050848 | 47 | -1.55084 | 0.095609 |
| NEGATIVE REGULATION OF G0 TO G1 TRANSITION GOBP GO:0070317 | 36 | -1.54615 | 0.106841 |
| CYCLIN D ASSOCIATED EVENTS IN G1 REACTOME R-HSA-69231.7 | 40 | -1.54534 | 0.107785 |
| G1 PHASE REACTOME DATABASE ID RELEASE 71 69236 | 40 | -1.54481 | 0.107951 |
| INSULIN PROCESSING REACTOME R-HSA-264876.2 | 20 | -1.54226 | 0.114012 |
| ERROR-PRONE TRANSLESION SYNTHESIS GOBP GO:0042276 | 19 | -1.53741 | 0.126991 |
| TRANSLESION SYNTHESIS BY POLH REACTOME R-HSA-110320.1 | 18 | -1.53506 | 0.132554 |
| SMOOTH MUSCLE CONTRACTION REACTOME R-HSA-445355.3 | 29 | -1.53357 | 0.136112 |
| CELLULAR RESPONSE TO HYPOXIA REACTOME R-HSA-1234174.2 | 69 | -1.53084 | 0.143644 |
| INTERSPECIES INTERACTION BETWEEN ORGANISMS GOBP GO:0044419 | 322 | -1.53011 | 0.144136 |
| DUAL INCISION IN TC-NER REACTOME R-HSA-6782135.1 | 62 | -1.53011 | 0.142368 |
| TCA CYCLE (AKA KREBS OR CITRIC ACID CYCLE) WIKIPATHWAYS_20191210 WP78 HOMO SAPIENS | 18 | -1.52732 | 0.149964 |
| SYMBIONT PROCESS GOBP GO:0044403 | 316 | -1.52634 | 0.151093 |
| REGULATION OF TP53 EXPRESSION AND DEGRADATION REACTOME R-HSA-6806003.1 | 32 | -1.5262 | 0.149924 |
| ERROR-FREE TRANSLESION SYNTHESIS GOBP GO:0070987 | 19 | -1.52572 | 0.149766 |
| TRANSCRIPTIONAL REGULATION BY E2F6 REACTOME DATABASE ID RELEASE 71 8953750 | 34 | -1.52515 | 0.150193 |
| MITOPHAGY REACTOME DATABASE ID RELEASE 71 5205647 | 25 | -1.52402 | 0.152274 |
| GAP-FILLING DNA REPAIR SYNTHESIS AND LIGATION IN TC-NER REACTOME DATABASE ID RELEASE 71 6782210 | 62 | -1.52125 | 0.161169 |
| ER-PHAGOSOME PATHWAY REACTOME DATABASE ID RELEASE 71 1236974 | 69 | -1.52107 | 0.159943 |
| SYNTHESIS OF ACTIVE UBIQUITIN: ROLES OF E1 AND E2 ENZYMES REACTOME R-HSA-8866652.2 | 29 | -1.52027 | 0.160681 |
| FCERI MEDIATED NF-ΚB ACTIVATION REACTOME R-HSA-2871837.2 | 71 | -1.51881 | 0.164231 |
| SIGNALING BY Fgfr1 REACTOME DATABASE ID RELEASE 71 5654736 | 32 | -1.51836 | 0.164082 |
| CENTRAL NERVOUS SYSTEM NEURON DEVELOPMENT GOBP GO:0021954 | 29 | -1.51808 | 0.163292 |
| REGULATION OF TP53 ACTIVITY THROUGH METHYLATION REACTOME DATABASE ID RELEASE 71 6804760 | 17 | -1.51684 | 0.166234 |
| AUF1 (HNRNP D0) BINDS AND DESTABILIZES MRNA REACTOME DATABASE ID RELEASE 71 450408 | 50 | -1.51593 | 0.167798 |
| B CELL ACTIVATION REACTOME DATABASE ID RELEASE 71 983705 | 92 | -1.5138 | 0.173984 |
| CYTOPLASMIC PATTERN RECOGNITION RECEPTOR SIGNALING PATHWAY GOBP GO:0002753 | 32 | -1.51365 | 0.172791 |
| IKK COMPLEX RECRUITMENT MEDIATED BY RIP1 REACTOME DATABASE ID RELEASE 71 937041 | 18 | -1.51332 | 0.172421 |
| VIRION ASSEMBLY GOBP GO:0019068 | 35 | -1.51249 | 0.173743 |
| ENDOSOMAL SORTING COMPLEX REQUIRED FOR TRANSPORT (ESCRT) REACTOME R-HSA-917729.1 | 27 | -1.5117 | 0.174884 |
| INFECTIOUS DISEASE REACTOME DATABASE ID RELEASE 71 5663205 | 379 | -1.51083 | 0.176457 |
| CHONDROITIN SULFATE METABOLIC PROCESS GOBP GO:0030204 | 26 | -1.50909 | 0.181727 |
| PROTEIN LOCALIZATION TO MEMBRANE GOBP GO:0072657 | 357 | -1.5088 | 0.18113 |
| I-KAPPAB KINASE/NF-KAPPAB SIGNALING GOBP GO:0007249 | 51 | -1.50817 | 0.181788 |
| TICAM1, RIP1-MEDIATED IKK COMPLEX RECRUITMENT REACTOME R-HSA-168927.3 | 17 | -1.50722 | 0.183755 |
| RIBOSOME BIOGENESIS GOBP GO:0042254 | 227 | -1.50672 | 0.183798 |
| VESICLE-MEDIATED TRANSPORT BETWEEN ENDOSOMAL COMPARTMENTS GOBP GO:0098927 | 21 | -1.50447 | 0.190799 |
| DEGRADATION OF GLI2 BY THE PROTEASOME REACTOME R-HSA-5610783.1 | 56 | -1.50387 | 0.191333 |
| CITRATE METABOLIC PROCESS GOBP GO:0006101 | 29 | -1.50382 | 0.189784 |
| ATP METABOLIC PROCESS GOBP GO:0046034 | 136 | -1.50016 | 0.202786 |
| PRADER-WILLI AND ANGELMAN SYNDROME WIKIPATHWAYS_20191210 WP3998 HOMO SAPIENS | 31 | -1.49851 | 0.20778 |
| MYD88-INDEPENDENT TOLL-LIKE RECEPTOR SIGNALING PATHWAY GOBP GO:0002756 | 27 | -1.49841 | 0.206341 |
| ANTIGEN PROCESSING AND PRESENTATION OF PEPTIDE ANTIGEN VIA MHC CLASS I GOBP GO:0002474 | 80 | -1.49762 | 0.207835 |
| STABILIZATION OF P53 REACTOME R-HSA-69541.5 | 53 | -1.49515 | 0.216427 |
| DOWNSTREAM TCR SIGNALING REACTOME R-HSA-202424.3 | 76 | -1.49442 | 0.217854 |
| THE ROLE OF GTSE1 IN G2 M PROGRESSION AFTER G2 CHECKPOINT REACTOME DATABASE ID RELEASE 71 8852276 | 57 | -1.49062 | 0.233181 |
| ABC TRANSPORTER DISORDERS REACTOME DATABASE ID RELEASE 71 5619084 | 64 | -1.49037 | 0.232277 |
| GAP-FILLING DNA REPAIR SYNTHESIS AND LIGATION IN GG-NER REACTOME R-HSA-5696397.1 | 24 | -1.48948 | 0.234394 |
| TNFR2 NON-CANONICAL NF-ΚB PATHWAY REACTOME R-HSA-5668541.2 | 80 | -1.48934 | 0.233057 |
| CLEC7A (DECTIN-1) SIGNALING REACTOME R-HSA-5607764.1 | 89 | -1.4891 | 0.232317 |
| REGULATION OF G0 TO G1 TRANSITION GOBP GO:0070316 | 38 | -1.48792 | 0.235624 |
| NEGATIVE REGULATION OF FGFR4 SIGNALING REACTOME DATABASE ID RELEASE 71 5654733 | 19 | -1.48738 | 0.236268 |
| VIF-MEDIATED DEGRADATION OF APOBEC3G REACTOME DATABASE ID RELEASE 71 180585 | 50 | -1.48711 | 0.235552 |
| G1 S DNA DAMAGE CHECKPOINTS REACTOME R-HSA-69615.2 | 63 | -1.48708 | 0.233782 |
| GLI3 IS PROCESSED TO GLI3R BY THE PROTEASOME REACTOME R-HSA-5610785.1 | 56 | -1.48693 | 0.232652 |
| RESPIRATORY ELECTRON TRANSPORT, ATP SYNTHESIS BY CHEMIOSMOTIC COUPLING, AND HEAT PRODUCTION BY UNCOUPLING PROTEINS. REACTOME R-HSA-163200.1 | 107 | -1.48672 | 0.231731 |
| REGULATION OF TP53 ACTIVITY THROUGH PHOSPHORYLATION REACTOME DATABASE ID RELEASE 71 6804756 | 85 | -1.48642 | 0.231313 |
| BUDDING AND MATURATION OF HIV VIRION REACTOME DATABASE ID RELEASE 71 162588 | 24 | -1.48594 | 0.231623 |
| SIGNALING BY FGFR REACTOME R-HSA-190236.2 | 61 | -1.48574 | 0.230753 |
| PHOSPHODIESTERASES IN NEURONAL FUNCTION WIKIPATHWAYS_20191210 WP4222 HOMO SAPIENS | 29 | -1.48396 | 0.237066 |
| P53-DEPENDENT G1 DNA DAMAGE RESPONSE REACTOME DATABASE ID RELEASE 71 69563 | 61 | -1.48333 | 0.237846 |
| PINK PARKIN MEDIATED MITOPHAGY REACTOME R-HSA-5205685.2 | 20 | -1.48228 | 0.24089 |
| MFAP5 EFFECT ON PERMEABILITY AND MOTILITY OF ENDOTHELIAL CELLS VIA CYTOSKELETON REARRANGEMENT WIKIPATHWAYS_20191210 WP4560 HOMO SAPIENS | 16 | -1.48205 | 0.240132 |
| FC EPSILON RECEPTOR (FCERI) SIGNALING REACTOME DATABASE ID RELEASE 71 2454202 | 108 | -1.48203 | 0.238453 |
| OXIDATIVE STRESS INDUCED SENESCENCE REACTOME R-HSA-2559580.4 | 65 | -1.48099 | 0.241159 |
Author response table 2
| NAME | SIZE | NES | FDR |
|---|---|---|---|
| MUSCLE CONTRACTION GOBP GO:0006936 | 35 | -2.29 | 0.008034 |
| NICOTINIC ACETYLCHOLINE RECEPTOR SIGNALING PATHWAY PANTHER PATHWAY P00044 | 15 | -2.17947 | 0.018238 |
| REGULATION OF CELL JUNCTION ASSEMBLY GOBP GO:1901888 | 15 | -2.17782 | 0.012159 |
| THE CITRIC ACID (TCA) CYCLE AND RESPIRATORY ELECTRON TRANSPORT REACTOME R-HSA-1428517.1 | 64 | -2.13697 | 0.015138 |
| HALLMARK_OXIDATIVE_PHOSPHORYLATION MSIGDB_C2 HALLMARK_OXIDATIVE_PHOSPHORYLATION | 91 | -2.12375 | 0.013852 |
| COLLAGEN FORMATION REACTOME DATABASE ID RELEASE 71 1474290 | 31 | -2.11295 | 0.013374 |
| MUSCLE SYSTEM PROCESS GOBP GO:0003012 | 40 | -2.07522 | 0.017172 |
| EPH-EPHRIN SIGNALING REACTOME DATABASE ID RELEASE 71 2682334 | 30 | -2.06553 | 0.016753 |
| ACTIN FILAMENT-BASED MOVEMENT GOBP GO:0030048 | 17 | -2.05773 | 0.017006 |
| RESPIRATORY ELECTRON TRANSPORT REACTOME R-HSA-611105.3 | 32 | -2.0515 | 0.016612 |
| RHO GTPASES ACTIVATE PKNS REACTOME DATABASE ID RELEASE 71 5625740 | 17 | -2.0504 | 0.015369 |
| COLLAGEN BIOSYNTHESIS AND MODIFYING ENZYMES REACTOME R-HSA-1650814.3 | 25 | -2.03023 | 0.018264 |
| RESPIRATORY ELECTRON TRANSPORT, ATP SYNTHESIS BY CHEMIOSMOTIC COUPLING, AND HEAT PRODUCTION BY UNCOUPLING PROTEINS. REACTOME R-HSA-163200.1 | 32 | -2.0253 | 0.017967 |
| COMPLEX I BIOGENESIS REACTOME R-HSA-6799198.1 | 16 | -2.02379 | 0.016892 |
| MITOCHONDRIAL RESPIRATORY CHAIN COMPLEX I ASSEMBLY GOBP GO:0032981 | 16 | -2.01705 | 0.01673 |
| INTEGRIN SIGNALLING PATHWAY PANTHER PATHWAY P00034 | 44 | -2.00758 | 0.017239 |
| NADH DEHYDROGENASE COMPLEX ASSEMBLY GOBP GO:0010257 | 16 | -1.99919 | 0.017902 |
| MITOCHONDRIAL ATP SYNTHESIS COUPLED ELECTRON TRANSPORT GOBP GO:0042775 | 26 | -1.99497 | 0.01756 |
| ACTOMYOSIN STRUCTURE ORGANIZATION GOBP GO:0031032 | 21 | -1.98512 | 0.018578 |
| KERATINIZATION GOBP GO:0031424 | 15 | -1.96272 | 0.024099 |
Author response table 3
Gene sets enriched in phenotype P (3 samples).
| GS follow link to MSigDB | GS DETAILS | SIZE | ES | NES | NOM p-val | FOR q-val | FWER p-val | |
|---|---|---|---|---|---|---|---|---|
| OXPHOS SUBUNITS | Details. | 34 | -0.55 | -2.19 | o.ooo | 0.002 | 0.001 | |
| 2 | OXPHOS | Details. | 41 | -0.53 | -2.17 | o.ooo | 0.001 | 0.001 |
| 3 | CARBOHYDRATE METABOLISM | Details. | 36 | -0.50 | -2.00 | o.ooo | 0.005 | 0.009 |
| 4 | TRANSLATION | Details. | 16 | -0.62 | -1.99 | 0.002 | 0.005 | 0.011 |
| 5 | COMPLEX I | Details. | 17 | -0.60 | -1.97 | 0.004 | 0.005 | 0.013 |
| 6 | Cl SUBUNITS | Details. | 15 | -0.62 | -1.89 | 0.004 | 0.007 | 0.024 |
| 7 | FATTY ACID OXIDATION | Details. | 20 | -0.55 | -1.86 | 0.008 | 0.007 | 0.030 |
| 8 | METALS AND COFACTORS | Details. | 30 | -0.47 | 1.79 | 0.006 | 0.011 | 0.051 |
| 9 | METABOLISM | Details. | 153 | -0.34 | 1.78 | 0.002 | 0.011 | 0.058 |
| 10 | AMINO ACID METABOLISM | Details. | 33 | -0.46 | 1.76 | 0.011 | 0.011 | 0.066 |
| 11 | MITOCHONDRIAL CENTRAL DOGMA | Details. | -0.45 | -1.61 | 0.012 | 0.030 | o. 181 | |
| 12 | TCA CYCLE | Details. | 15 | -0.48 | -1.51 | 0.052 | 0.053 | 0.310 |
| 13 | LIPID METABOLISM | Details. | 43 | -0.36 | -1.48 | 0.032 | 0.057 | 0.359 |
| 14 | PROTEIN IMPORT SORTING AND HOMEOSTASIS | Details. | 24 | -0.34 | -1.20 | 0.205 | 0.223 | 0.846 |
Additional files
-
Supplementary file 1
Genes that pass our differential expression cutoffs (false discovery rate [FDR] < 0.05; |log fold change| > 1) in PaLung vs WI-38 samples from whole-cell transcriptomics data.
Differential expression analysis was performed using the DESeq2 pipeline. Fold changes are indicated as PaLung/WI-38.
- https://cdn.elifesciences.org/articles/94007/elife-94007-supp1-v1.xlsx
-
Supplementary file 2
Biological pathways upregulated in PaLung cells from gene set enrichment analysis (GSEA) of transcriptomics data.
GSEA was performed on the transcriptomics data using (PI) value as a metric. The table below lists the pathways detected as upregulated in PaLung cells (compared to WI-38 cells) and associated enrichment metrics.
- https://cdn.elifesciences.org/articles/94007/elife-94007-supp2-v1.xlsx
-
Supplementary file 3
Biological pathways upregulated in WI-38 cells from gene set enrichment analysis (GSEA) of transcriptomics data.
GSEA was performed on the transcriptomics data using (PI) value as a metric. The table below lists the pathways detected as upregulated in WI-38 cells (compared to PaLung cells) and associated enrichment metrics.
- https://cdn.elifesciences.org/articles/94007/elife-94007-supp3-v1.xlsx
-
Supplementary file 4
Differentially expressed (DE) mitochondrial proteins in PaLung vs WI-38 samples from mitochondrial proteomics data.
405 DE proteins were first identified using a Student’s t-test on median-corrected protein abundances from the mitochondrial samples of PaLung and WI-38. Of the 405 DE proteins, 127 were identified to be core mitochondrial proteins (as defined by MitoCarta and IMPI datasets) and are listed in this sheet. Fold changes are indicated as PaLung/WI-38.
- https://cdn.elifesciences.org/articles/94007/elife-94007-supp4-v1.xlsx
-
Supplementary file 5
Biological pathways upregulated in PaLung cells from gene set enrichment analysis (GSEA) of proteomics data.
GSEA was performed on the proteomics data using protein abundances as input. The table below lists the pathways detected as upregulated in PaLung cells (compared to WI-38 cells) and associated enrichment metrics.
- https://cdn.elifesciences.org/articles/94007/elife-94007-supp5-v1.xlsx
-
Supplementary file 6
Biological pathways upregulated in WI-38 cells from gene set enrichment analysis (GSEA) of proteomics data.
GSEA was performed on the proteomics data using protein abundances as input. The table below lists the pathways detected as upregulated in WI-38 cells (compared to PaLung cells) and associated enrichment metrics.
- https://cdn.elifesciences.org/articles/94007/elife-94007-supp6-v1.xlsx
-
Supplementary file 7
Metabolic model for PaLung cells.
A metabolic flux model was constructed for the central carbon metabolism of PaLung cells by overlaying proteomic and transcriptomic information onto the existing mitocore model from literature.
- https://cdn.elifesciences.org/articles/94007/elife-94007-supp7-v1.xlsx
-
Supplementary file 8
Metabolic model for WI-38 cells.
A metabolic flux model was constructed for the central carbon metabolism of WI-38 cells by overlaying proteomic and transcriptomic information onto the existing mitocore model from literature.
- https://cdn.elifesciences.org/articles/94007/elife-94007-supp8-v1.xlsx
-
Supplementary file 9
Flux sampling results comparing flux distributions in the constrained PaLung and WI-38 models.
Flux sampling was performed with 5000 flux vectors for the PaLung and WI-38 metabolic models each. The flux histograms for each reaction were compared across the two models and the following statistics were extracted from the histograms.
- https://cdn.elifesciences.org/articles/94007/elife-94007-supp9-v1.xlsx
-
Supplementary file 10
Absolute metabolite quantification in PaLung and WI-38 cells.
Absolute concentrations of metabolites detected in PaLung and WI-38 cells by Human Metabolome Technologies (HMT).
- https://cdn.elifesciences.org/articles/94007/elife-94007-supp10-v1.xlsx
-
MDAR checklist
- https://cdn.elifesciences.org/articles/94007/elife-94007-mdarchecklist1-v1.docx
Download links
A two-part list of links to download the article, or parts of the article, in various formats.
Downloads (link to download the article as PDF)
Open citations (links to open the citations from this article in various online reference manager services)
Cite this article (links to download the citations from this article in formats compatible with various reference manager tools)
Multi-omic analysis of bat versus human fibroblasts reveals altered central metabolism
eLife 13:e94007.
https://doi.org/10.7554/eLife.94007


