Germline cis variant determines epigenetic regulation of the anti-cancer drug metabolism gene dihydropyrimidine dehydrogenase (DPYD)
- Department of Molecular Pharmacology and Experimental Therapeutics, Mayo Clinic, United States
- Department of Clinical Chemistry, Inselspital, Bern University Hospital, University of Bern, Switzerland
- Graduate School for Cellular and Biomedical Sciences, University of Bern, Switzerland
- Eshelman School of Pharmacy, Division of Pharmacotherapy and Experimental Therapeutics, University of North Carolina at Chapel Hill, United States
- Division of Hematology, Department of Medicine, Mayo Clinic, United States
- Department of Visceral Surgery and Medicine, Inselspital, Bern University Hospital, University of Bern, Switzerland
- Department of Pathology, University of Iowa Carver College of Medicine, University of Iowa, United States
- Holden Comprehensive Cancer Center, University of Iowa Carver College of Medicine, University of Iowa, United States
Figures
Figure 1 with 1 supplement

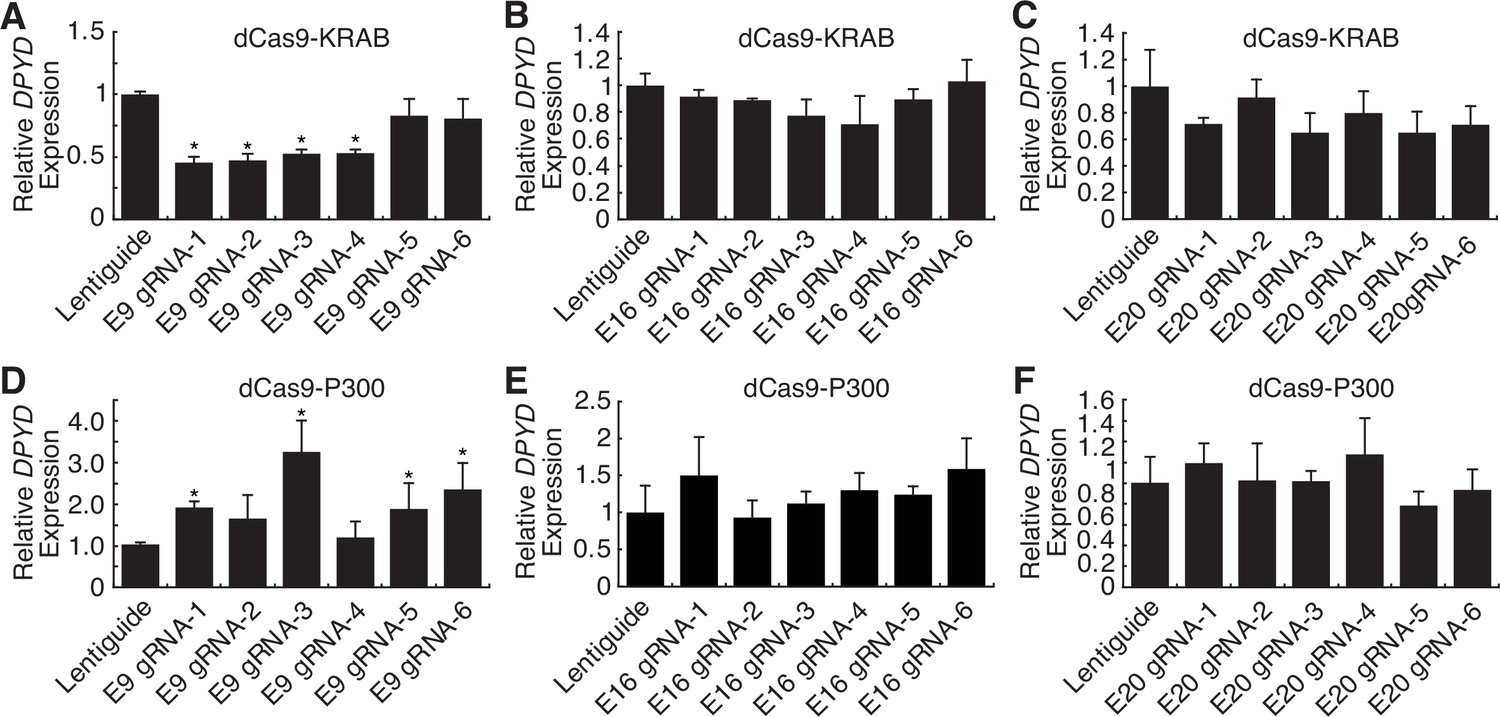
Identification of a novel dihydropyrimidine dehydrogenase (DPYD) enhancer.
(A) Candidate DPYD enhancer regions were selected for further study using data from GeneHancer and Ensembl Regulatory Build. Coordinates are based on GRCh37/hg19. Regions are termed E9, E16, and E20 based on the approximate distance upstream of the DPYD transcription start site. For CRISPR inhibition (CRISPRi), DPYD expression was measured in HepG2 cells expressing dCas9-KRAB following transfection with guide-RNAs specific to the E9 (B), E16 (C), and E20 (D) regions. For CRISPR activation (CRISPRa), DPYD expression was measured in HepG2 cells expressing dCas9-P300 following transfection with guide-RNAs specific to E9 (E), E16 (F), and E20 (G). Data represent the mean of three independent biological replicates ± SD. *p<0.05; **p<0.005. p-values were calculated using a two-tailed Student’s t-test comparing results to those from lentiguide controls.
Figure 1—figure supplement 1
CRISPR interference (CRISPRi) and CRISPR activation (CRISPRa) screen to identify dihydropyrimidine dehydrogenase (DPYD) cis-regulatory elements in HCT116 cells.
For CRISPRi, DPYD expression was measured in HCT116 cells expressing dCas9-KRAB following transfection with guide-RNAs specific to the E9 (A), E16 (B), and E20 (C) regions. For CRISPRa, DPYD expression was measured in HCT116 cells expressing dCas9-P300 following transfection with guide-RNAs specific to E9 (D), E16 (E), and E20 (F). Data represent the mean of three independent biological replicates ± SD. *p<0.05. p-values were calculated using a two-tailed Student’s t-test comparing results to those from lentiguide controls.
Figure 2 with 1 supplement
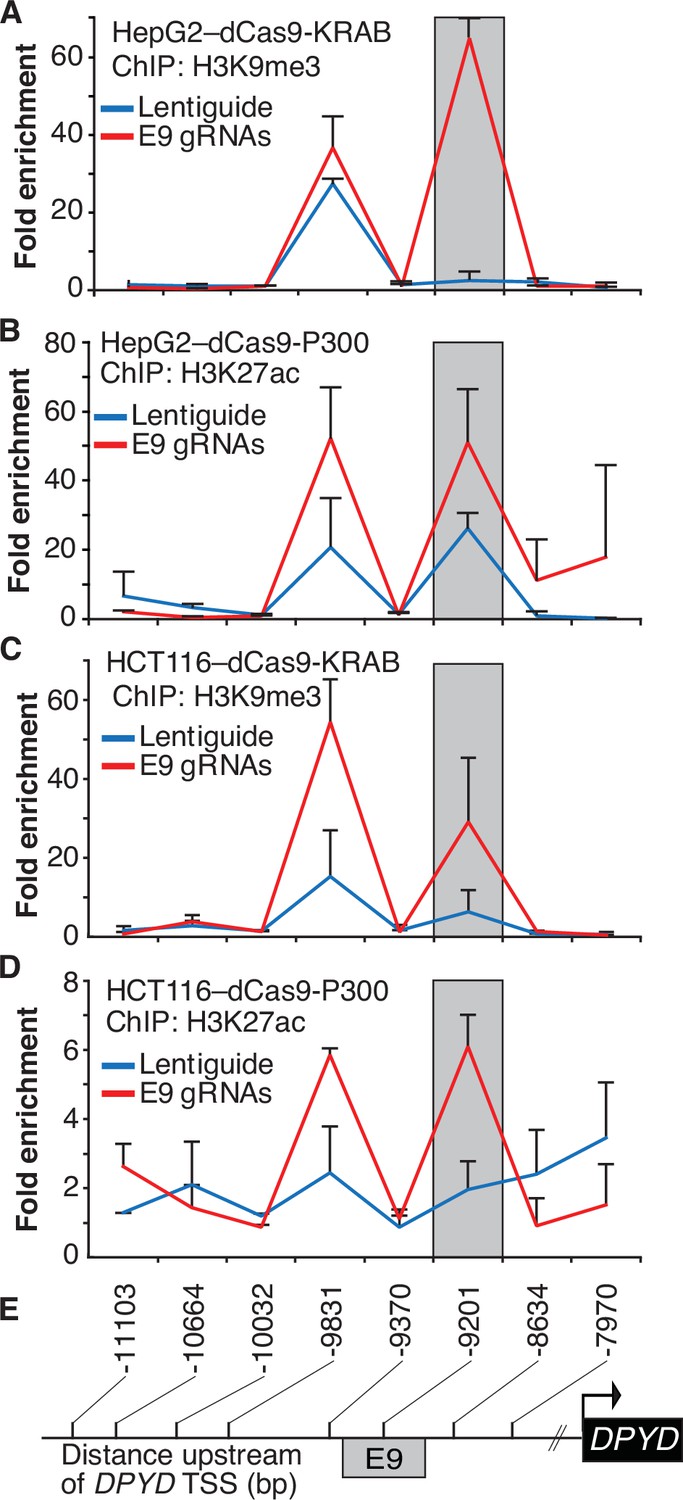
Epigenetic changes at the E9 region induced by CRISPR interference (CRISPRi)/CRISPR activation (CRISPRa).
Lentiguide vectors encoding guide-RNAs targeting the E9 region (E9 gRNAs) or empty vector control (Lentiguide) were transduced into HepG2 cells expressing dCas9-KRAB (A) or dcas9-P300 (B) and HCT116 cells expressing dCas9-KRAB (C) or dcas9-P300 (D). Chromatin immunoprecipitation (ChIP) was performed using antibodies specific to H3K9me3 (A, C) or H3K27ac (B, D). Quantitative PCR using primers centered at the indicated regions (E) was used to measure the relative abundance of H3K9me3 and H3K27ac. Data are presented relative to input DNA control and are further normalized to IgG control. Error bars represent the SD of three independent biological replicate experiments.
Figure 2—figure supplement 1
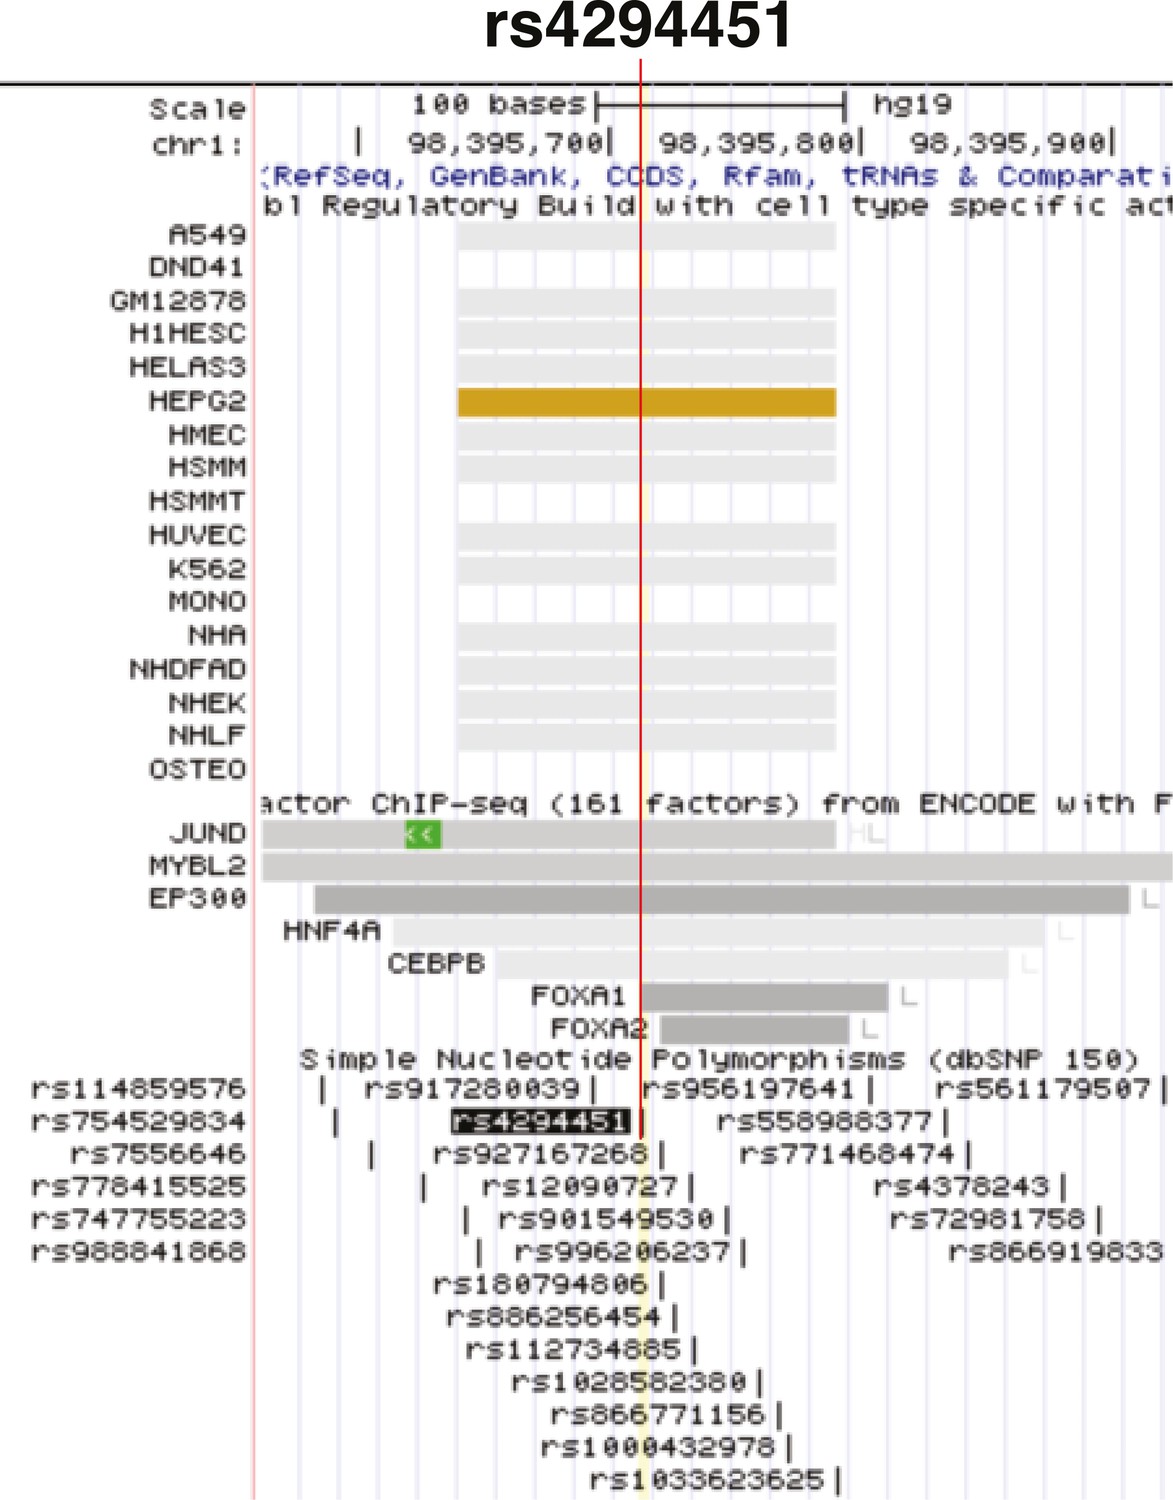
Genomic context of rs4294451.
Rs4294451 is located within a putative enhancer region showing evidence for regulatory activity in Ensembl Regulatory Build data and within transcription factor binding sites in ENCODE Factorbook data.
Figure 3 with 1 supplement
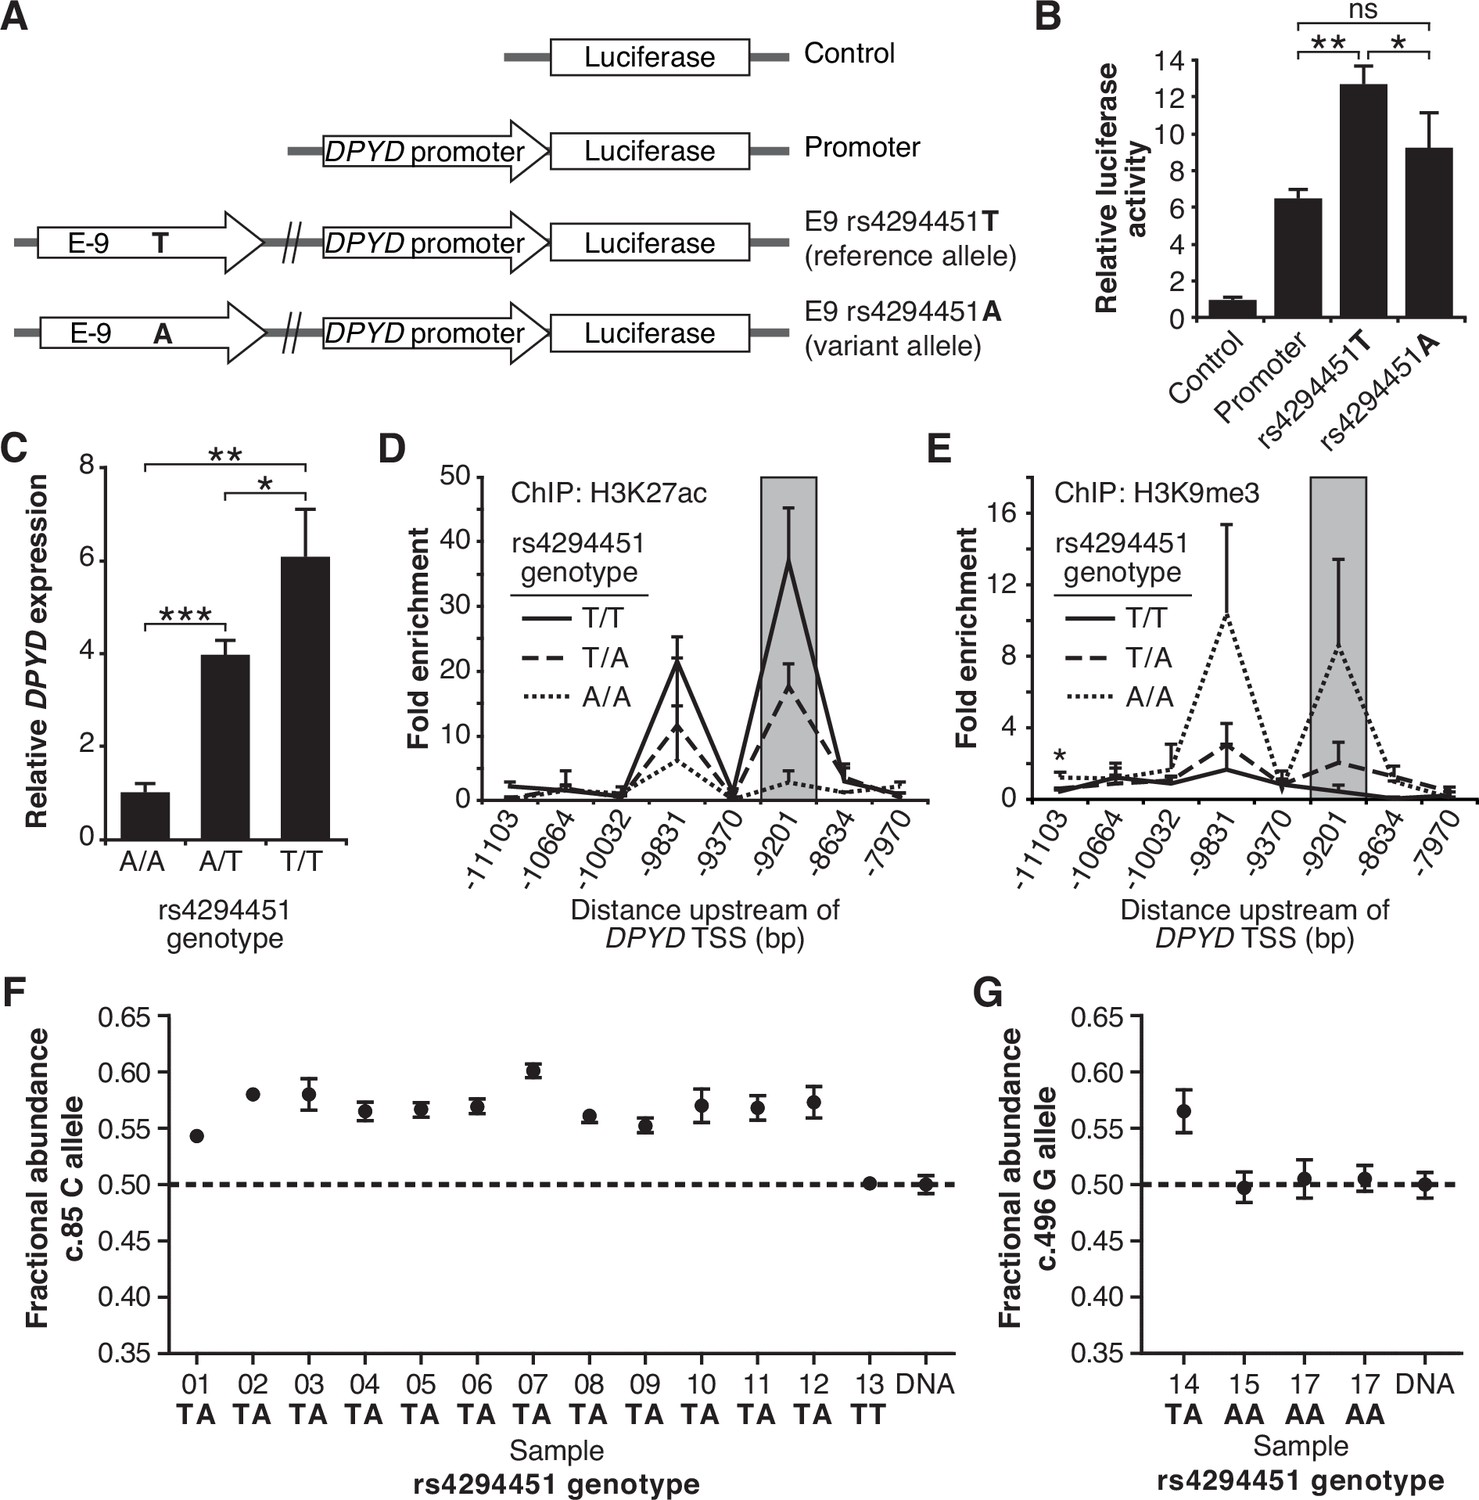
The rs4294451 T allele is associated with elevated dihydropyrimidine dehydrogenase (DPYD) expression.
(A) Luciferase reporter constructs were generated by cloning the E9 region containing the reference rs4294451 T allele or the variant rs4294451 A allele into reporter vectors containing the DPYD promoter. (B) Luciferase reporter activity was measured for vectors shown in panel A. Error bars represent the SD of three independent biological replicates. (C) Relative expression of endogenous DPYD measured via RT-qPCR in HCT116 cells engineered using CRISPR-mediated genome editing to contain the depicted genotypes for rs4294451. Chromatin enrichment of H3K27ac (D) and H3K9me3 (E) was measured using chromatin immunoprecipitation (ChIP) coupled with quantitative PCR (ChIP-qPCR) in HCT116 cells engineered to contain the indicated genotypes at rs4294451. (F) DPYD allele-specific expression was measured in human liver tissues using the C and T alleles at position c.85. (G) Allele-specific expression was measured using the c.496-A and G alleles. All panels: *p<0.05; **p<0.005; ***p<0.0005. p-values were calculated as pairwise comparisons between the indicated groups using a two-tailed Student’s t-tests. Error bars represent SD.
Figure 3—figure supplement 1

Rs4294451 A allele is associated with epigenetic repression at the E9 region in human liver specimens.
Chromatin enrichment of H3K27ac (A) and H3K9me3 (B) was measured using chromatin immunoprecipitation (ChIP) coupled with quantitative PCR (ChIP-qPCR) of liver specimens obtained from human donors carrying different rs4294451 genotypes. Data represent three independent measurements from a single liver specimen with each indicated genotype ± SD.
Figure 4
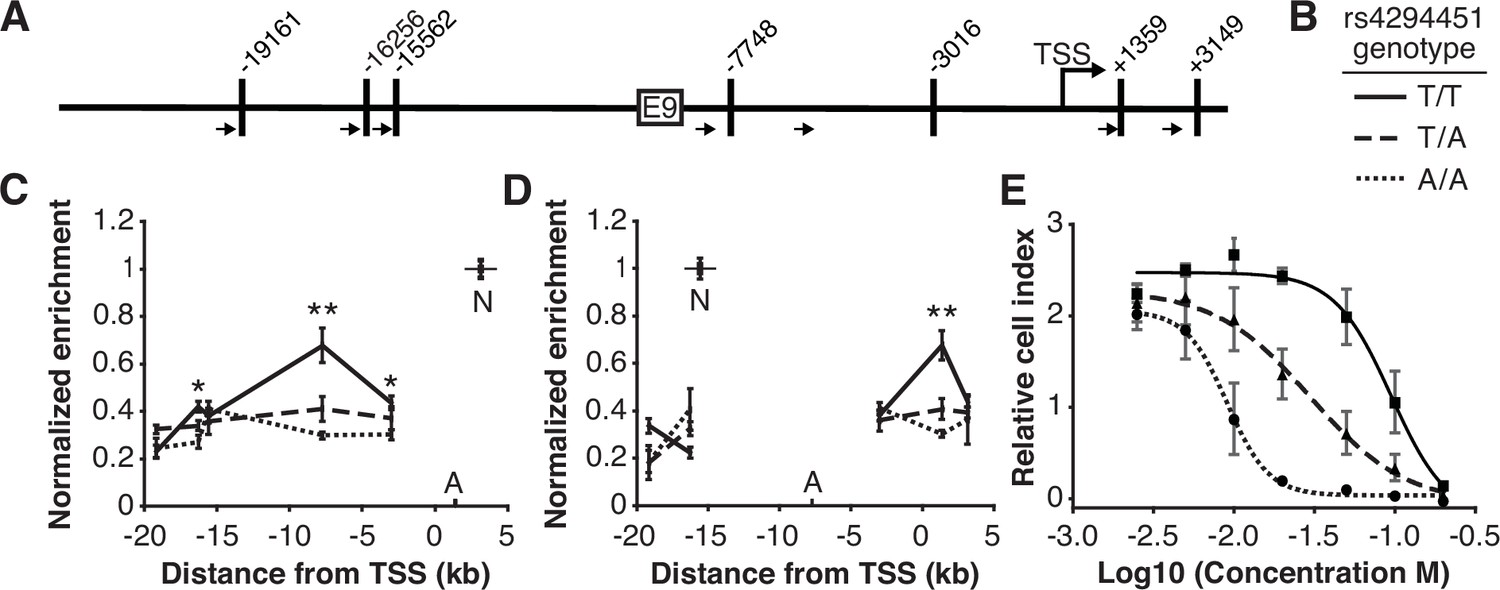
The rs4294451 T allele is associated with increased interaction between E9 and the dihydropyrimidine dehydrogenase (DPYD) promoter.
(A) Schematic of HindIII restriction enzyme sites (vertical bars) and primers (arrows) used for chromatin conformation capture (3 C) relative to the DPYD transcription start site (TSS) and E9 region. (B) Legend for panels C–E. (C) 3 C of chromatin interactions in rs4294451 knock-in HCT116 cells using anchor primer positioned within the digestion fragment containing the DPYD promoter. A, location of anchor primer; N, location of primer used for data normalization. (D) 3 C of knock-in cells using anchor primer positioned within the fragment containing the E9 region. For panels C–D: one-way ANOVA p: *p<0.01; **p<0.001; all other data points, p>0.01. (E) Knock-in cells were treated with dilutions of 5-fluorouracil (5-FU) and viability was assessed using real-time cell analysis (RTCA). Cell index is a measure of impedance between electrodes that are arrayed at the bottom of the RTCA plate and is representative of the number of live cells attached to the culture plate. Data are from 48 hr of 5-FU treatment. For all plotted data, the mean ± SD of three independent replicates is presented.
Figure 5
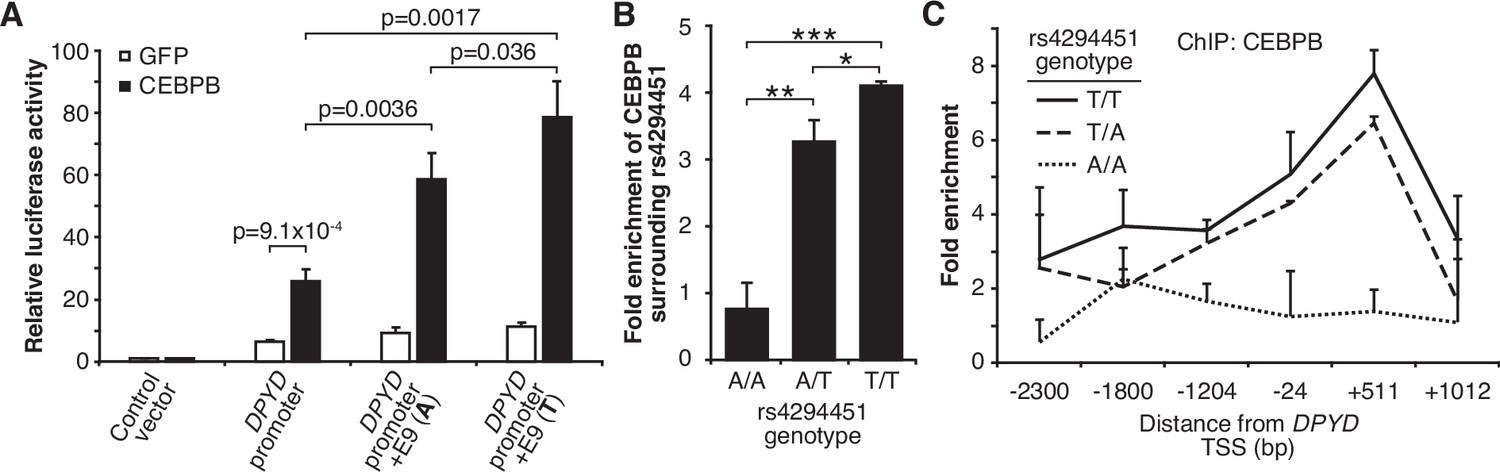
T allele is associated with higher occupancy of CEBPB at E9 and the dihydropyrimidine dehydrogenase (DPYD) promoter.
(A) Expression plasmids for CEBPB or GFP (control) were co-transfected into HEK293T cells with the luciferase reporter plasmids depicted in Figure 3A. (B) Chromatin immunoprecipitation (ChIP) coupled with quantitative PCR (ChIP-qPCR) was performed to examine the relative CEBPB enrichment at the DNA fragments within the E9 region in knock-in HCT116 cells for the rs4294451 genotypes indicated. Primers used for E9 are centered on the position at 9201 nucleotides upstream of the DPYD TSS. (C) ChIP-qPCR was used to measure CEBPB occupancy surrounding the DPYD promoter region. *p<0.05; **p<0.005; ***p<0.0005. p-values were calculated as pairwise comparisons between the indicated groups using a two-tailed Student’s t-tests. For all panels, error bars represent the SD of three independent replicates.
Figure 6 with 2 supplements

CEBPB-mediated upregulation of dihydropyrimidine dehydrogenase (DPYD) is dependent on rs4294451 T allele.
(A) Immunoblot showing knockdown of CEBPB expression in HCT116 cells carrying different rs4294451 genotypes transduced with lentiviral particles encoding two independent shRNAs against CEBPB (sh1 and sh2) or a scrambled control shRNA (scr) (see also Figure 6—source data 1, Figure 6—source data 2, and Figure 6—source data 3). CEBPB expression was measured by RT-qPCR in HCT116 A/A (B), T/A (C) and T/T cells (D) transduced with the indicated shRNA lentiviral particles. DPYD expression was measured in shCEBPB and scramble control HCT116 A/A (E), T/A (F), and T/T (G) cells. The effect of CEBPB knockdown on cell viability in HCT116 A/A cells (H) and HCT116 T/T cells (I) was measured by RTCA. Data shown are from 48 hr of 5-fluorouracil (5-FU) treatment at the indicated concentrations. *p<0.05, calculated as a pairwise two-sided Student’s t-test comparing the indicated data to that of the associated scr control. Error bars represent the SD from three independent replicates.
-
Figure 6—source data 1
Original file for western blot analysis in Figure 6A (anti-CEBPB).
- https://cdn.elifesciences.org/articles/94075/elife-94075-fig6-data1-v1.tif
-
Figure 6—source data 2
Original file for western blot analysis in Figure 6A (anti-tubulin).
- https://cdn.elifesciences.org/articles/94075/elife-94075-fig6-data2-v1.tif
-
Figure 6—source data 3
PDF containing Figure 6A and annotated western blots used to make figure, including highlighted bands and sample labels.
- https://cdn.elifesciences.org/articles/94075/elife-94075-fig6-data3-v1.pdf
Figure 6—figure supplement 1

Disruption of CEBPB reduces enrichment at the E9 region and dihydropyrimidine dehydrogenase (DPYD) promoter in rs4294451 T/T and A/T cells, but not in T/T cells.
CEBPB enrichment at the E9 region (A) and the DPYD promoter (B) was measured by chromatin immunoprecipitation (ChIP) coupled with quantitative PCR (ChIP-qPCR) in CEBPB knockdown and scramble (scr) control knock-in HCT116 cells containing the indicated rs4294451 genotype. Data represent the mean of three independent replicates ± SD. *p<0.05. p-values were calculated using a two-tailed Student’s t-test.
Figure 6—figure supplement 2

Allele frequency for rs4294451-T allele in global populations.
(A) Allele frequencies in various populations for the rs4294451-T allele was retrieved from the gnomAD browser v3.1.2. (B) Local ancestry-informed frequency data was retrieved for the rs4294451-T allele within Latino-Admixed American samples of gnomAD v3.1.
Additional files
-
Supplementary file 1
Table of primers used for chromatin immunoprecipitation (ChIP), cloning, quantitative PCR (qPCR), and site-directed mutagenesis.
- https://cdn.elifesciences.org/articles/94075/elife-94075-supp1-v1.docx
-
Supplementary file 2
Table of sequences and positions of the primers used for 3 C analysis.
- https://cdn.elifesciences.org/articles/94075/elife-94075-supp2-v1.docx
-
MDAR checklist
- https://cdn.elifesciences.org/articles/94075/elife-94075-mdarchecklist1-v1.docx
Download links
A two-part list of links to download the article, or parts of the article, in various formats.
Downloads (link to download the article as PDF)
Open citations (links to open the citations from this article in various online reference manager services)
Cite this article (links to download the citations from this article in formats compatible with various reference manager tools)
Germline cis variant determines epigenetic regulation of the anti-cancer drug metabolism gene dihydropyrimidine dehydrogenase (DPYD)
eLife 13:RP94075.
https://doi.org/10.7554/eLife.94075.3


