Hemodynamics regulate spatiotemporal artery muscularization in the developing circle of Willis
- Department of Genetics, Yale School of Medicine, United States
- Yale Cardiovascular Research Center, Section of Cardiology, Department of Internal Medicine, Yale School of Medicine, United States
- Vascular Biology & Therapeutics Program, Yale School of Medicine, United States
- Department of Cell Biology & Physiology, School of Medicine, Washington University in St. Louis, United States
eLife assessment
This study provides the first analysis of vascular stabilization on the critical and evolutionarily conserved structure around the Circle of Willis in the brain, strengthened by using parallel in vivo and in vitro experimental approaches. The evidence supporting the claims is solid and the work will be valuable for scientists studying developmental and disease-related vascular stabilization.
https://doi.org/10.7554/eLife.94094.3.sa0Significance of the findings:
Valuable: Findings that have theoretical or practical implications for a subfield
- Landmark
- Fundamental
- Important
- Valuable
- Useful
Strength of evidence:
Solid: Methods, data and analyses broadly support the claims with only minor weaknesses
- Exceptional
- Compelling
- Convincing
- Solid
- Incomplete
- Inadequate
During the peer-review process the editor and reviewers write an eLife Assessment that summarises the significance of the findings reported in the article (on a scale ranging from landmark to useful) and the strength of the evidence (on a scale ranging from exceptional to inadequate). Learn more about eLife Assessments
Abstract
Vascular smooth muscle cells (VSMCs) envelop vertebrate brain arteries and play a crucial role in regulating cerebral blood flow and neurovascular coupling. The dedifferentiation of VSMCs is implicated in cerebrovascular disease and neurodegeneration. Despite its importance, the process of VSMC differentiation on brain arteries during development remains inadequately characterized. Understanding this process could aid in reprogramming and regenerating dedifferentiated VSMCs in cerebrovascular diseases. In this study, we investigated VSMC differentiation on zebrafish circle of Willis (CoW), comprising major arteries that supply blood to the vertebrate brain. We observed that arterial specification of CoW endothelial cells (ECs) occurs after their migration from cranial venous plexus to form CoW arteries. Subsequently, acta2+ VSMCs differentiate from pdgfrb+ mural cell progenitors after they were recruited to CoW arteries. The progression of VSMC differentiation exhibits a spatiotemporal pattern, advancing from anterior to posterior CoW arteries. Analysis of blood flow suggests that earlier VSMC differentiation in anterior CoW arteries correlates with higher red blood cell velocity and wall shear stress. Furthermore, pulsatile flow induces differentiation of human brain PDGFRB+ mural cells into VSMCs, and blood flow is required for VSMC differentiation on zebrafish CoW arteries. Consistently, flow-responsive transcription factor klf2a is activated in ECs of CoW arteries prior to VSMC differentiation, and klf2a knockdown delays VSMC differentiation on anterior CoW arteries. In summary, our findings highlight blood flow activation of endothelial klf2a as a mechanism regulating initial VSMC differentiation on vertebrate brain arteries.
Introduction
Vascular smooth muscle cells (VSMCs) are contractile mural cells wrapping around endothelial cells (ECs) of large vessels, especially arteries (Ando et al., 2022; Donadon and Santoro, 2021; Stratman et al., 2020). The expression of contractile proteins, such as alpha-smooth muscle actin (encoded by acta2), distinguishes VSMCs from pericytes, the other type of mural cells primarily associated with small vessels (Bahrami and Childs, 2020; Donadon and Santoro, 2021; Stratman et al., 2020). VSMCs are important for arterial homeostasis (Basatemur et al., 2019). In the brain, VSMC constriction and relaxation are essential for functional hyperemia in neurovascular coupling (Hill et al., 2015; Kaplan et al., 2020). Phenotype switching or dedifferentiation of VSMCs, marked by lower expression of contractile proteins, is prominent in pathological progression of atherosclerosis (Basatemur et al., 2019). VSMC phenotype switching or dedifferentiation also contributes to cerebrovascular disease and neurodegeneration (Aguilar-Pineda et al., 2021; Chou et al., 2022; Frösen and Joutel, 2018; Milewicz et al., 2010; Oka et al., 2020; Poittevin et al., 2014). As development and regeneration share many common molecular and cellular mechanisms (Nowotarski and Sánchez Alvarado, 2016), insights into VSMC differentiation on brain arteries during development may inform strategies to reprogram and regenerate dedifferentiated VSMCs and alleviate cerebrovascular disease.
VSMCs differentiate from heterogenous perivascular progenitors of mesoderm and neural crest origins (Ando et al., 2019; Donadon and Santoro, 2021; Whitesell et al., 2019). Previous research described various mechanisms that regulate VSMC differentiation. Autonomous Notch activation is required for specification of pdgfrb+ mural cell progenitors from peri-arterial mesenchyme, and these progenitors later differentiate into acta2+ VSMCs (Ando et al., 2019). Arterial Notch signaling activated by blood flow is necessary for acta2+ VSMC emergence on zebrafish trunk dorsal aorta (Chen et al., 2017). Chemokine signaling promotes VSMC association with zebrafish dorsal aorta, whereas blood flow-responsive transcription factor krüppel-like factor 2 (encoded by klf2a in zebrafish) prevents their association with adjacent cardinal vein (Stratman et al., 2020). Endothelial BMP signaling and autonomous foxc1 expression regulate VSMC differentiation in zebrafish ventral head (Watterston et al., 2019; Whitesell et al., 2019). Autonomous expression of an ATP-sensitive potassium channel modulates VSMC differentiation from pdgfrb+ progenitors in the brain (Ando et al., 2022). These studies suggest that VSMC differentiation is highly organotypic.
The circle of Willis (CoW) consists of major arteries that supply blood to the vertebrate brain, including internal carotid arteries (ICAs) and posterior communicating arteries (PCAs) (Campbell et al., 2019; Schröder et al., 2020). In early development, ICAs are the first large arteries to form and supply all circulation in the developing brain (Kathuria et al., 2011; Menshawi et al., 2015). In adults, posterior circulation becomes independent, and ICAs remain major feeding arteries in anterior, while connected to posterior circulation with PCAs, completing a circle of arteries (Kathuria et al., 2011; Schröder et al., 2020). In adults, intracranial aneurysms are frequently found close to CoW arteries (Frösen and Joutel, 2018). CoW arteries are wrapped by VSMCs, and VSMC dedifferentiation and hyperplasia are described in carotid atherosclerosis and Moyamoya disease (Chou et al., 2022; Fox et al., 2021). Spatiotemporal dynamics of VSMC differentiation on vertebrate CoW arteries during development have not been thoroughly investigated. VSMC differentiation is difficult to observe in vivo with mammalian models, as mammalian embryos develop in utero and depend on maternal circulation. Zebrafish is an important vertebrate model for vascular development, as zebrafish embryos are externally fertilized, optically clear, and thus accessible to confocal live imaging of developing blood vessels (Stratman and Weinstein, 2021). Establishment of zebrafish fluorescent transgenic reporter lines with pdgfrb and acta2 promoters enables in vivo visualization and assessment of mural cells and VSMCs (Ando et al., 2016; Whitesell et al., 2014). In addition, zebrafish CoW shows comparable geometry to human CoW: the caudal division of the internal carotid artery (CaDI) in zebrafish is comparable to human ICA, and the posterior communicating segment (PCS) in zebrafish is comparable to human PCA (Isogai et al., 2001). Taking advantage of the zebrafish model, we describe the spatiotemporal pattern of VSMC differentiation on CoW arteries, and associate this pattern with blood flow activation of klf2a in arterial ECs.
| Zebrafish CoW vessel nomenclature | |
|---|---|
| CaDI | Caudal division of the internal carotid artery |
| BCA | Basal communicating artery |
| PCS | Posterior communicating segment |
Results
Artery muscularization is spatiotemporally regulated in CoW arteries
In zebrafish brain, arteries are formed by ECs from cranial venous plexus (Fujita et al., 2011). Recent single-cell transcriptome profiling of vascular cells in prenatal human brain also supports an endothelial differentiation trajectory from proliferative venous ECs to quiescent arterial ECs (Crouch et al., 2022). To establish the temporal sequence of CoW arterial specification and VSMC differentiation, we started with confocal live imaging of fluorescent transgenic reporter lines Tg(flt4:yfp)hu4881, which labels primitive venous ECs, and Tg(kdrl:hras-mcherry)s896, which is expressed in all ECs but enriched in arterial ECs, at four stages starting at 32 hours post fertilization (hpf), when CoW arteries are assembled (Chi et al., 2008; Hogan et al., 2009; Isogai et al., 2001). As arterial ECs express higher kdrl, we used the intensity of mcherry as an indicator of artery specification (Figure 1; Figure 1—source data 1; Chi et al., 2008). We found that when ECs from cranial venous plexus migrated to form CoW arteries at 32 hpf, they still retained primitive venous identity, as indicated by flt4 expression (Figure 1A). When connections between cranial venous plexus and CoW arteries disappeared at 54 hpf, CoW arteries no longer expressed primitive venous flt4 (Figure 1B). Expression of arterial enriched kdrl in CaDI and PCS at 3 days post fertilization (dpf) was significantly higher than 32 hpf (Figure 1A, C, and E). At 4 dpf, kdrl expression in CoW arteries remained comparable to 3 dpf, suggesting that arterial specification of CoW was completed by 3 dpf (Figure 1C–E). Together, these data suggest CoW morphogenesis precedes arterial specification.
Figure 1
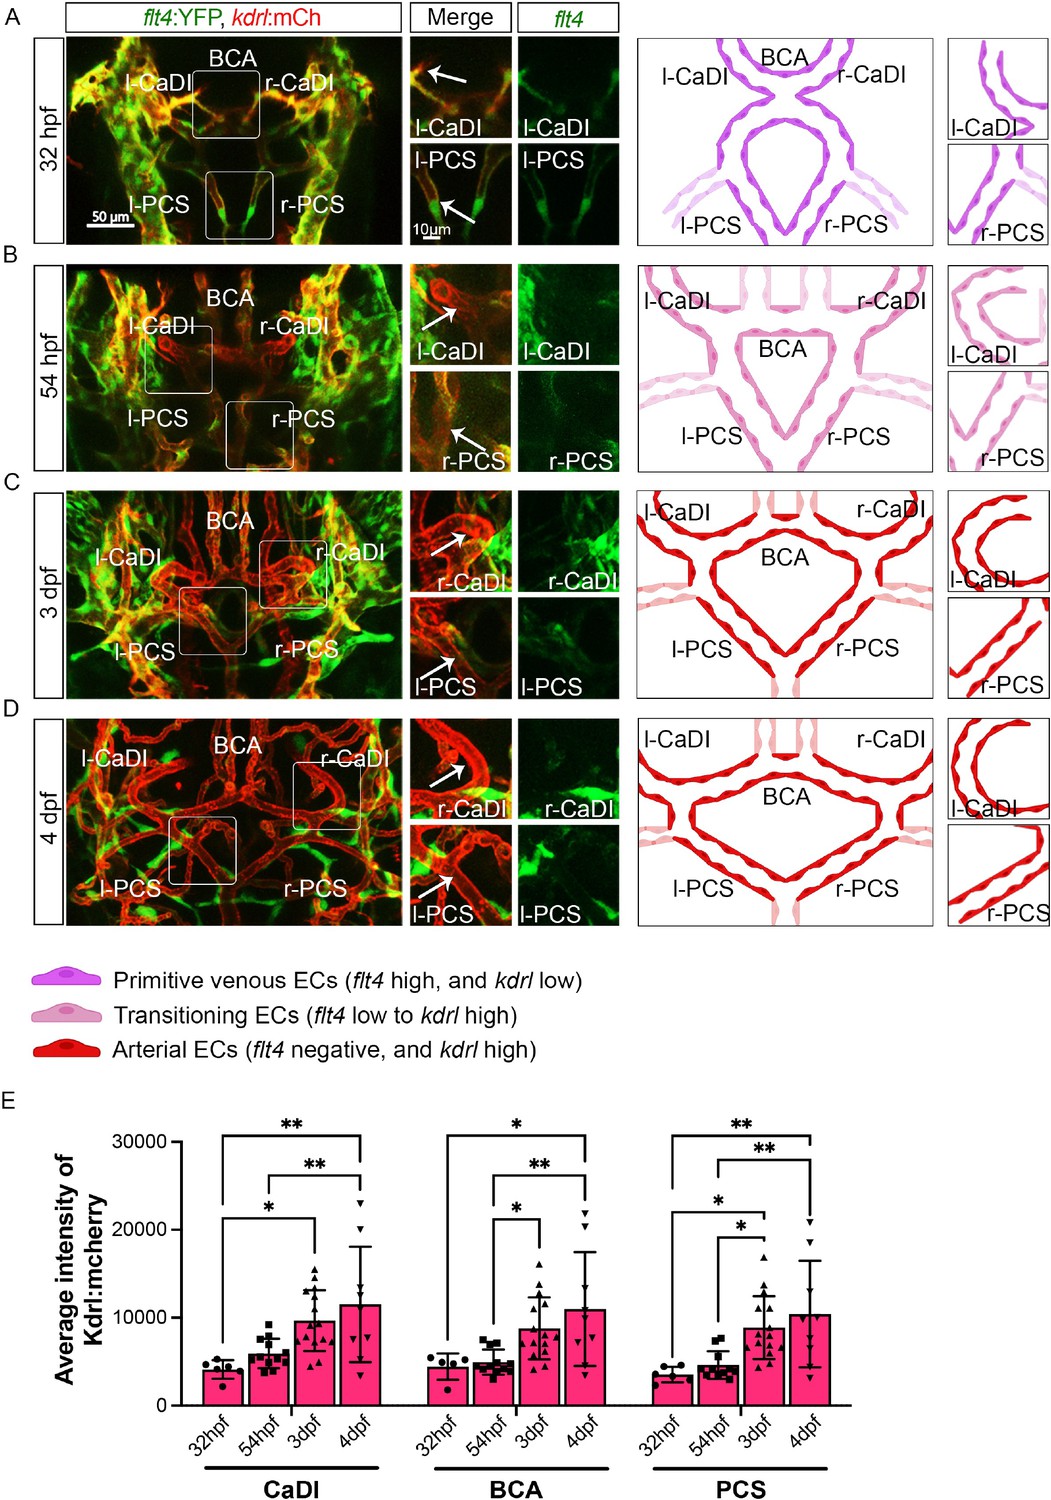
Arterial specification of endothelial cells (ECs) in circle of Willis (CoW) arteries.
(A–D) Confocal live images of CoW arteries in Tg(flt4:yfp, kdrl:hras-mcherry)hu4881/s896 and scheme representation of CoW arteries in zebrafish brain at 32 hours post fertilization (hpf) (A), 54 hpf (B), 3 days post fertilization (dpf) (C), and 4 dpf (D). Green channel represents flt4:yfp fluorescence, red channel represents kdrl:hras-mcherry fluorescence, and merge panel combines both channels. Arrows point to the CoW arteries with kdrl:hras-mcherry signal. Scale bar = 50 μm. (E) Average intensity of kdrl:hras-mcherry in caudal division of internal carotid arteries (CaDI), basal communicating artery (BCA), and posterior communicating segments (PCS) at 32 hpf (n=6, 2 independent experiments), 54 hpf (n=12, 4 independent experiments), 3 dpf (n=15, 4 independent experiments), and 4 dpf (n=9, 2 independent experiments), two-way analysis of variance followed by Tukey’s multiple comparisons, represented with mean ± SD, *p≤0.05, **p≤0.01. Abbreviations: hpf: hour post fertilization, dpf: day post fertilization, EC: endothelial cell, l-CaDI: left caudal division of internal carotid artery, r-CaDI: right caudal division of internal carotid artery, BCA: basal communicating artery, l-PCS: left posterior communicating segment, r-PCS: right posterior communicating segment.
-
Figure 1—source data 1
Source data for average intensity of kdrl:hras-mcherry in Figure 1E.
- https://cdn.elifesciences.org/articles/94094/elife-94094-fig1-data1-v1.xlsx
Previous research suggested that acta2+ VSMCs on CoW arteries differentiate from pdgfrb+ mural cell progenitors (Ando et al., 2022; Ando et al., 2019). Thus, to characterize spatiotemporal dynamics of VSMC differentiation on CoW arteries, we performed confocal live imaging of Tg(acta2:mcherry)ca8, TgBAC(pdgfrb:egfp)ncv22, and Tg(kdrl:cerulean)sd24, to visualize respectively VSMCs (red), pdgfrb+ progenitors (green), and developing arteries (white) at four stages starting from 32 hpf (Figure 2; Ando et al., 2016; Page et al., 2013; Whitesell et al., 2014). We found that pdgfrb+ progenitors emerged on CoW arteries around 54 hpf after CoW morphogenesis, and most pdgfrb+ progenitors did not express acta2 at 54 hpf (Figure 2A, B, E, and F, and Figure 2—figure supplement 1A, B, Figure 2—source data 1). The number of pdgfrb+ progenitors on CoW arteries increased temporally from 54 hpf to 3 dpf (Figure 2B, C, and E). Notably, while many pdgfrb+ cells on CaDI differentiated into acta2+ VSMCs by 3 dpf, acta2+ VSMCs were hardly observed on adjacent BCA or PCS, suggesting that VSMC differentiation started between 54 hpf and 3 dpf on CaDI but not BCA or PCS (Figure 2B, C, E, and F, and Figure 2—figure supplement 1A, B, Figure 2—source data 1). At 4 dpf, the number of pdgfrb+ cells on CoW arteries remained comparable to 3 dpf, while the number of acta2+ VSMCs on CaDI increased (Figure 2C–F and Figure 2—figure supplement 1A, B). Importantly, most pdgfrb+ cells on BCA and PCS only started to express acta2 around 4 dpf, much later than CaDI (Figure 2C–F and Figure 2—figure supplement 1A, B). These findings support that differentiation of acta2+ VSMCs from pdgfrb+ progenitors progresses spatially and temporally along the anterior to posterior direction on CoW arteries.
Figure 2 with 1 supplement see all
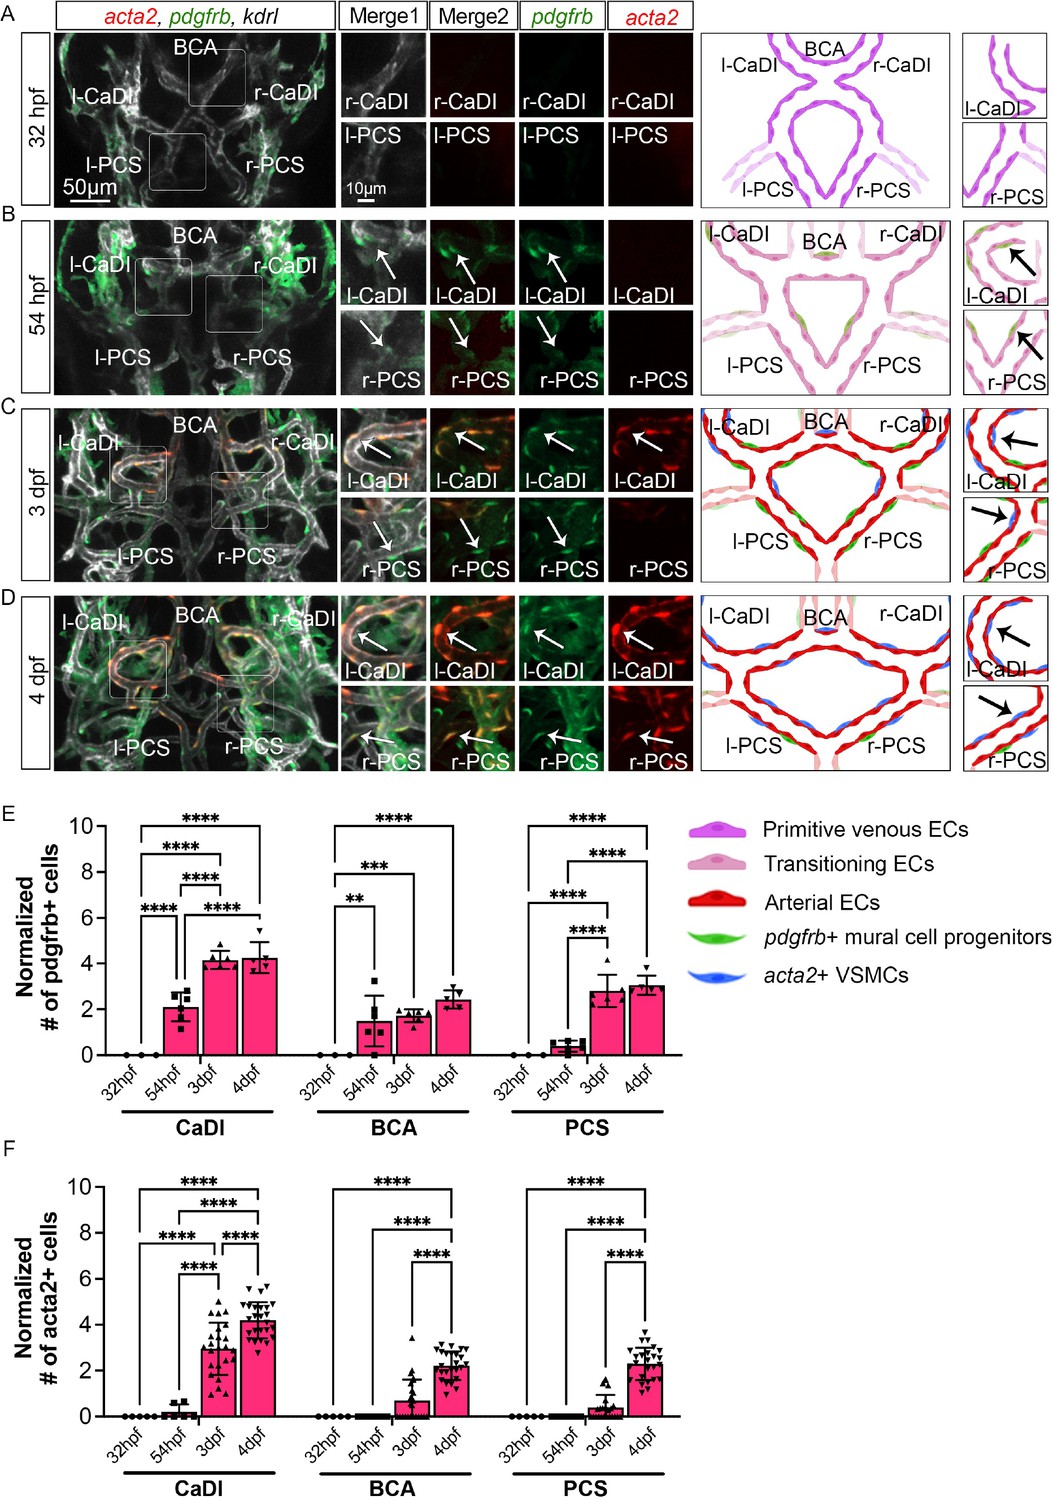
Vascular smooth muscle cell (VSMC) differentiation on circle of Willis (CoW) arteries.
(A–D) Confocal live images of CoW arteries in Tg(acta2:mcherry, kdrl:cerulean)ca8/sd24 TgBAC(pdgfrb:egfp)ncv22 and scheme representation of vascular endothelium and mural cells on CoW arteries in zebrafish brain at 32 hours post fertilization (hpf) (A), 54 hpf (B), 3 days post fertilization (dpf) (C), and 4 dpf (D). White channel represents kdrl:cerulean fluorescence, red channel represents acta2:mcherry, green channel represents pdgfrb:egfp, merge 1 panel combines all three channels, merge 2 combines acta2:mcherry in red and pdgfrb:egfp in green. Arrows point to the CoW arteries with pdgfrb:egfp and acta2:mcherry signal. Scale bar = 50 μm. (E) Number of pdgfrb+ vascular mural cell progenitors per 100 μm vessel length on caudal division of internal carotid arteries (CaDI), basal communicating artery (BCA), and posterior communicating segments (PCS) at 32 hpf (n=3, 1 independent experiment), 54 hpf (n=6, 1 independent experiment), 3 dpf (n=6, 1 independent experiment), and 4 dpf (n=5, 1 independent experiment), two-way analysis of variance (ANOVA) followed by Tukey’s multiple comparisons, represented with mean ± SD, **p≤0.01, ***p≤0.001, ****p≤0.0001. (F) Number of acta2+ VSMCs per 100 μm vessel length on CaDI, BCA, and PCS at 32 hpf (n=5, 1 independent experiment), 54 hpf (n=6, 2 independent experiments), 3 dpf (n=24, 6 independent experiments), and 4 dpf (n=25, 6 independent experiments), two-way ANOVA followed by Tukey’s multiple comparisons, represented with mean ± SD, ****p≤0.0001. Abbreviations: hpf: hour post fertilization, dpf: day post fertilization, EC: endothelial cell, VSMC: vascular smooth muscle cell, l-CaDI: left caudal division of internal carotid artery, r-CaDI: right caudal division of internal carotid artery, BCA: basal communicating artery, l-PCS: left posterior communicating segment, r-PCS: right posterior communicating segment.
-
Figure 2—source data 1
Source data for number of pdgfrb+ vascular mural cell progenitors and acta2+ vascular smooth muscle cells (VSMCs) in Figure 2E and F.
- https://cdn.elifesciences.org/articles/94094/elife-94094-fig2-data1-v1.xlsx
CoW arteries have spatiotemporal difference in hemodynamics
Our data suggest that VSMCs on CaDI of anterior CoW differentiate much earlier than BCA and PCS of posterior CoW, although all acta2+ VSMCs on CoW differentiated from pdgfrb+ progenitors after they were recruited to CoW (Figure 2 and Figure 2—figure supplement 1). In addition, anterior and posterior CoW vascular morphogenesis and arterial specification occurred around the same time (Figure 1). We speculate that hemodynamic distribution may contribute to the spatiotemporal difference in VSMC differentiation on CoW arteries. CaDI receive proximal arterial feed through lateral dorsal aorta from cardiac outflow tract (Isogai et al., 2001). Furthermore, CaDI differs from BCA and PCS in terms of overall vascular geometry, which is among determinants of local vascular hemodynamic forces such as wall shear stress (WSS) (Katritsis et al., 2007). To explore this possibility, we performed microangiography with a high molecular weight fluorescent dextran to determine each CoW artery diameter. We found that there was no significant difference among CaDI, BCA, and PCS (Figure 3A–D, Figure 3—source data 1). Then, we measured red blood cell (RBC) velocity with axial line scanning microscopy to analyze Tg(kdrl:gfp;gata1:DsRed)zn1/sd2 zebrafish at 54 hpf, 3 dpf, and 4 dpf (Barak et al., 2021). The RBC velocity across CoW arteries was differentially distributed, with CaDI having the highest RBC velocity from 54 hpf to 4 dpf (Figure 3E–G, Figure 3—source data 1). This is consistent with CaDI being the inlet vessel for arterial blood flow within the entire CoW circulation during development. Next, we used computational fluid dynamics (CFD) to simulate the effect of flow on CoW, based on dextran-filled CoW geometry and RBC velocity (ANSYS, 2014; Chen et al., 2019; Fernandes et al., 2022, Barak et al., 2021). We found an overall increase in average WSS from 54 hpf to 4 dpf (Figure 3A–C and H, Figure 3—source data 1). Further, the simulated flow pattern and WSS in CoW showed that WSS in CaDI was significantly higher than BCA and PCS at 54 hpf, 3 dpf, and 4 dpf (Figure 3A–C and I–K, Figure 3—source data 1). Moreover, upon comparing WSS with the number of acta2+ VSMCs on CaDI during development, we observed a Pearson correlation coefficient of r=0.595, indicating a moderate to strong positive correlation between these two variables (Figure 2—figure supplement 1C). In summary, the analysis of blood flow suggests that CoW arteries bear different hemodynamic WSS, which correlates with the spatiotemporal pattern of VSMC differentiation on CoW arteries.
Figure 3
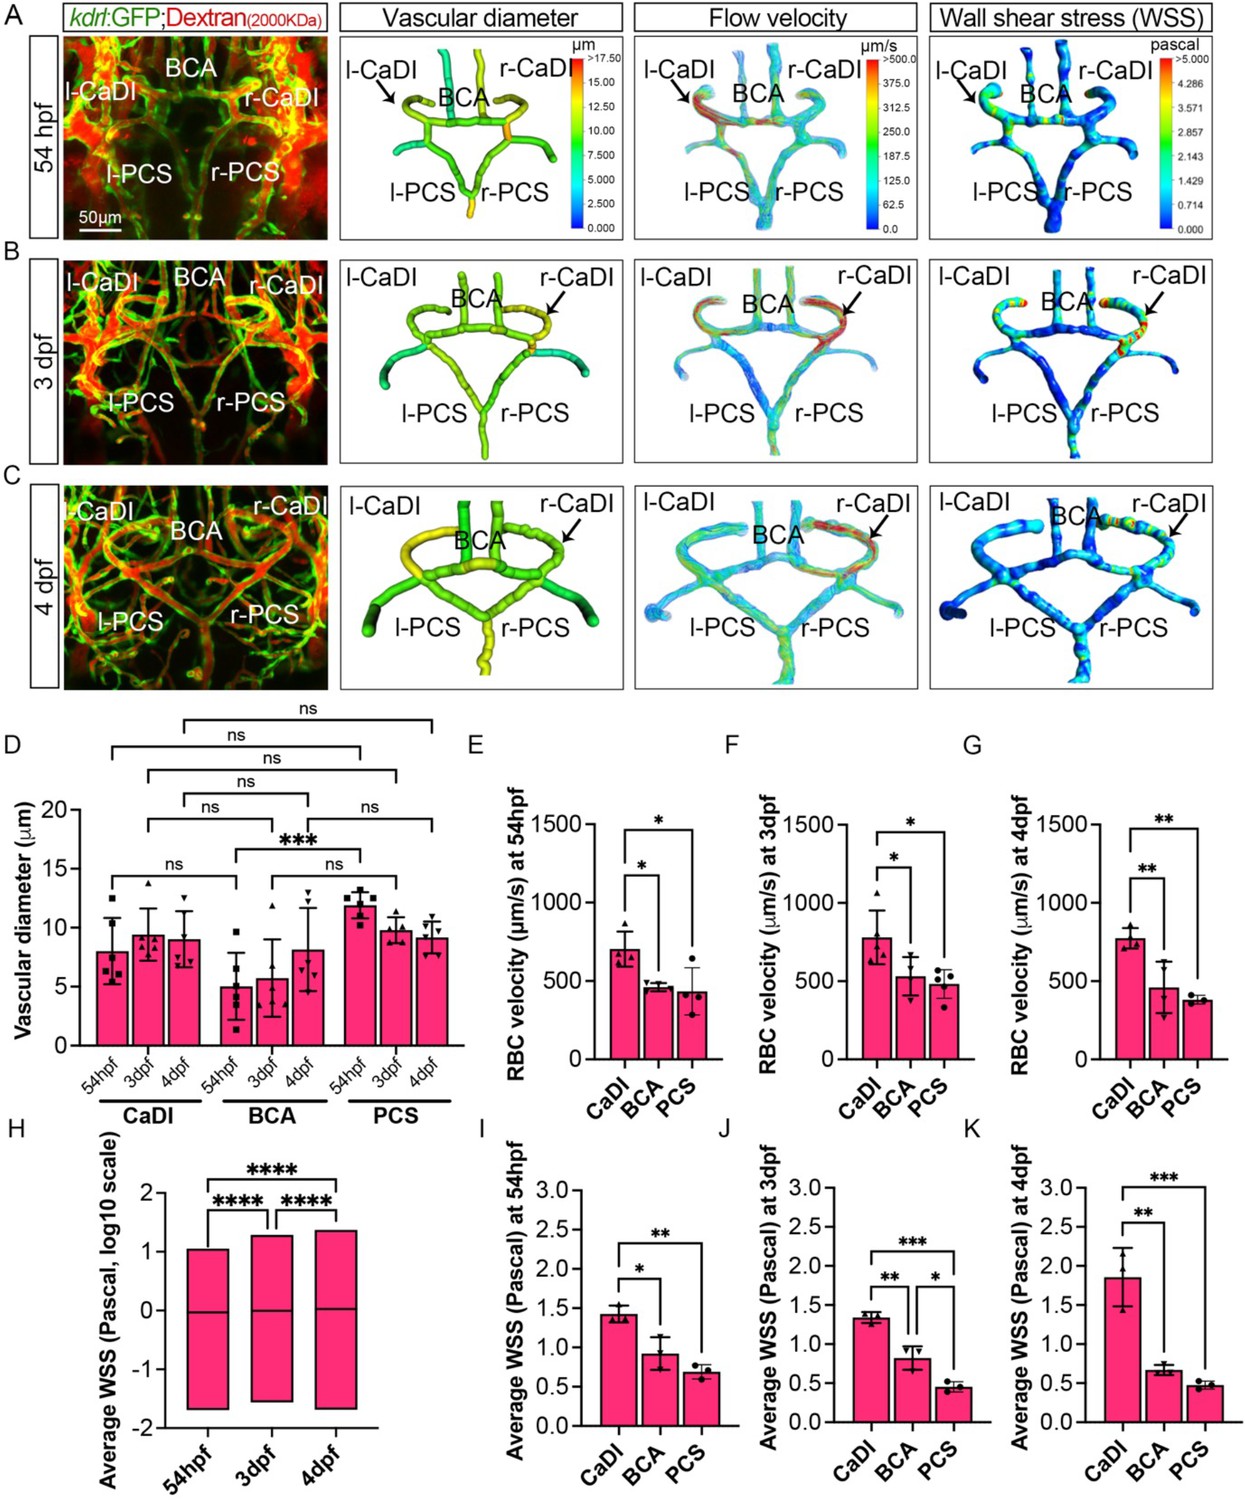
Computational fluid dynamic (CFD) simulation of circle of Willis (CoW) arteries.
(A–C) Confocal live images of CoW arteries in Tg(kdrl:gfp)zn1 injected with dextran and representation of vascular diameter, CFD simulated flow, and wall shear stress (WSS) at 54 hours post fertilization (hpf) (A), 3 days post fertilization (dpf) (B), and 4 dpf (C). Arrows point to CoW arteries with high flow velocity and WSS. Scale bar = 50 μm. (D) Average vascular diameter in caudal division of internal carotid arteries (CaDI), basal communicating artery (BCA), and posterior communicating segments (PCS) at 54 hpf (n=6, 1 independent experiment), 3 dpf (n=6, 1 independent experiment), and 4 dpf (n=6, 1 independent experiment), two-way analysis of variance (ANOVA) followed by Tukey’s multiple comparisons, ***p≤0.001. (E–G) Red blood cell (RBC) velocity in CaDI, BCA, and PCS at 54 hpf (n=4, 1 independent experiment) (E), 3 dpf (n=5, 1 independent experiment) (F), and 4 dpf (n=4, 1 independent experiment) (G), ordinary one-way ANOVA with Tukey’s multiple comparisons, represented with mean ± SD, *p≤0.05, **p≤0.01. (H) Average WSS throughout CoW arteries at 54 hpf (n=3 independent CFD simulation on CoW geometry), 3 dpf (n=3), and 4 dpf (n=3), ordinary one-way ANOVA with Tukey’s multiple comparisons, ****p≤0.0001. (I–K) Average WSS in CaDI, BCA, and PCS at 54 hpf (n=3) (I), 3 dpf (n=3) (J), and 4 dpf (n=3) (K), ordinary one-way ANOVA with Tukey’s multiple comparisons, represented with mean ± SD, *p≤0.05, **p≤0.01, ***p≤0.001. Abbreviations: hpf: hour post fertilization, dpf: day post fertilization, RBC: red blood cell, WSS: wall shear stress, l-CaDI: left caudal division of internal carotid artery, r-CaDI: right caudal division of internal carotid artery, BCA: basal communicating artery, l-PCS: left posterior communicating segment, r-PCS: right posterior communicating segment.
-
Figure 3—source data 1
Source data for vascular diameter, red blood cell (RBC) velocity, and wall shear stress in Figure 3D–K.
- https://cdn.elifesciences.org/articles/94094/elife-94094-fig3-data1-v1.xlsx
Blood flow is required for CoW artery muscularization
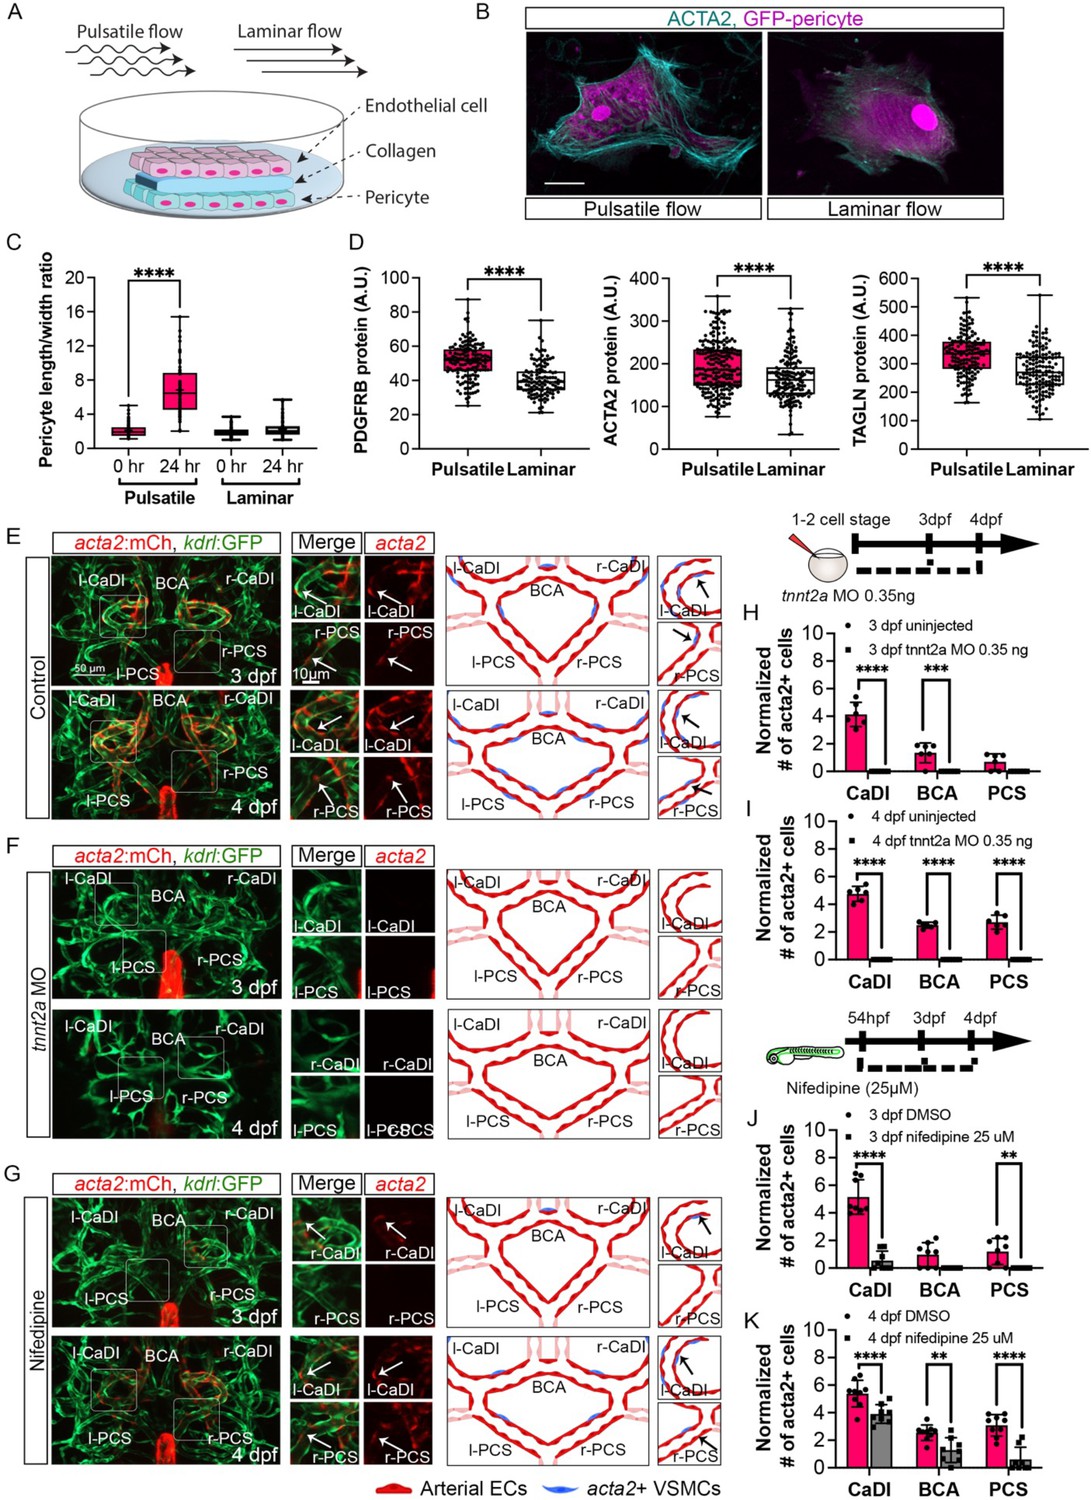
Our data suggest that ECs under arterial flow might favor acta2+ VSMC differentiation from pdgfrb+ progenitors. To test this hypothesis, we set up an in vitro cell co-culture experiment where GFP-PDGFRB+ human brain vascular pericytes (GFP-HBVPs) were cultured in flow amenable outlet slides, then covered by a thin layer of collagen type 1. Confluent human endothelial cells (HUVECs) were seeded on top of that and then exposed to steady-state laminar or pulsatile flow conditions (Figure 4A; Abello et al., 2022). Differentiation of PDGFRB+ human brain pericytes into VSMCs was then quantified after 24 hours of flow treatment. We found that brain pericytes under pulsatile flow were larger and showed higher expression of VSMC differentiation markers including PDGFRB, ACTA2, and TRANSGELIN (Robin et al., 2013; Figure 4B–D, Figure 4—source data 1), suggesting that pulsatile flow favored PDGFRB+ progenitor differentiation into VSMC.
Figure 4 with 1 supplement see all
Blood flow is required for vascular smooth muscle cell (VSMC) differentiation on circle of Willis (CoW) arteries.
(A) Scheme representation of in vitro cell co-culture experiment. (B) Representative immunofluorescence images of brain pericytes after exposure of pulsative flow and laminar flow. Cells were stained for ACTA2 (cyan) and cytosolic GFP label (magenta). Scale bar = 10 μm. (C) Morphological measurement of brain pericyte length/width ratio before and after exposure of pulsative flow and laminar flow (n=63 cells), two-tailed Mann–Whitney test, represented with mean ± SD, ****p≤0.0001. (D) Protein level of PDGFRB (n=153 cells), ACTA2 (n=222 cells), and TAGLN (n=150 cells) in arbitrary unit (A.U.) after exposure of pulsative flow and laminar flow, two-tailed Mann–Whitney test, represented with mean ± SD, ****p≤0.0001. (E–G) Confocal live images of CoW arteries in Tg(acta2:mcherry; kdrl:gfp)ca8/zn1 and scheme representation of vascular endothelium and VSMCs on CoW arteries at 3 days post fertilization (dpf) and 4 dpf in control embryos (E), embryos injected with 0.35 ng tnnt2a morpholino (MO) (F), and embryos treated with 25 μM nifedipine from 54 hpf (G). Red channel represents acta2:mcherry, green channel represents kdrl:gfp, and merge panel combines both channels. Arrows point to the CoW arteries with acta2:mcherry signal. Scale bar = 50 μm. (H) Number of acta2+ VSMCs per 100 μm vessel length on caudal division of internal carotid arteries (CaDI), basal communicating artery (BCA), and posterior communicating segments (PCS) at 3 dpf in uninjected control (n=6, 1 independent experiment) and embryos injected with 0.35 ng tnnt2a MO at one- to two-cell stage (n=6, 1 independent experiment), two-tailed Mann–Whitney test on each vessel’s comparison, represented with mean ± SD, ***p≤0.001, ****p≤0.0001. (I) Number of acta2+ VSMCs per 100 μm vessel length on CaDI, BCA, and PCS at 4 dpf in uninjected control (n=6, 1 independent experiment) and embryos injected with 0.35 ng tnnt2a MO at one- to two-cell stage (n=6, 1 independent experiment), two-tailed Mann–Whitney test on each vessel’s comparison, represented with mean ± SD, ****p≤0.0001. (J) Number of acta2+ VSMCs per 100 μm vessel length on CaDI, BCA, and PCS at 3 dpf in dimethyl sulfoxide (DMSO) control (n=8, 2 independent experiments) and embryos treated with 25 μM nifedipine from 54 hpf (n=8, 2 independent experiments), two-tailed Mann–Whitney test on each vessel’s comparison, represented with mean ± SD, **p≤0.01, ****p≤0.0001. (K) Number of acta2+ VSMCs per 100 μm vessel length on CaDI, BCA, and PCS at 4 dpf in DMSO control (n=9, 2 independent experiments) and embryos treated with 25 μM nifedipine from 54 hpf (n=8, 2 independent experiments), two-tailed Mann–Whitney test on each vessel’s comparison, represented with mean ± SD, **p≤0.01, ****p≤0.0001. Abbreviations: hpf: hour post fertilization, dpf: day post fertilization, EC: endothelial cell, VSMC: vascular smooth muscle cell, MO: morpholino, l-CaDI: left caudal division of internal carotid artery, r-CaDI: right caudal division of internal carotid artery, BCA: basal communicating artery, l-PCS: left posterior communicating segment, r-PCS: right posterior communicating segment.
-
Figure 4—source data 1
Source data for brain pericyte length/width ratio, proteins level, and acta2+ vascular smooth muscle cells (VSMCs) number in Figure 4C–D and H–K.
- https://cdn.elifesciences.org/articles/94094/elife-94094-fig4-data1-v1.xlsx
Previous research suggests that blood flow is dispensable for recruitment of pdgfrb+ progenitors on BCA and PCS (Ando et al., 2016). To corroborate this, we injected 0.35 ng of tnnt2a morpholino antisense oligonucleotide (MO) into Tg(pdgfrb:egfp, kdrl:hras-mcherry)ncv22/s896 at one- to two-cell stage, to abrogate cardiac contractility and thus blood flow (Ando et al., 2016; Chi et al., 2008; Sehnert et al., 2002). Indeed, the number of pdgfrb+ cells on CaDI, BCA, and PCS at 3 dpf in tnnt2a morphants was comparable to uninjected sibling control, suggesting blood flow did not affect pdgfrb+ progenitor recruitment to CoW arteries (Figure 4—figure supplement 1G, H). To determine the effect of blood flow on VSMC differentiation, we injected tnnt2a MO into Tg(acta2:mcherry, kdrl:gfp)ca8/zn1 (Cross et al., 2003; Sehnert et al., 2002; Whitesell et al., 2014). Notably, we found no acta2+ VSMCs on CoW arteries of tnnt2a morphants at either 3 dpf or 4 dpf (Figure 4E, F, H, and I, Figure 4—source data 1), suggesting that blood flow was required for acta2+ VSMC differentiation on CoW arteries.
To further explore the temporal requirement of blood flow, we treated embryos with 25 μM nifedipine, a drug shown to reduce heart rate in zebrafish embryos (Figure 4—figure supplement 1A–C; Gierten et al., 2020), from 54 hpf, right before the onset of pdgfrb+ progenitors’ expression of acta2 (Figure 2A–C). We found that at 3 dpf the number of acta2+ VSMCs on the CaDI of treated embryos is greatly reduced (Figure 4E, G, and J); acta2+ VSMCs on BCA and PCS at 4 dpf are also reduced significantly (Figure 4E, G, and K, Figure 4—source data 1), suggesting that blood flow reduction after 54 hpf impaired VSMC differentiation on CoW arteries.
To determine whether blood flow is required for short-term VSMC maintenance after differentiation on CoW arteries, we treated embryos with nifedipine from 4 dpf, after VSMC differentiation on CoW arteries, and imaged at 5 dpf. The number of acta2+ VSMCs on the CaDI and PCS in treated embryos was comparable to controls (Figure 4—figure supplement 1D–F), suggesting that blood flow was required for differentiation but not for short-term maintenance of VSMCs.
Blood flow-regulated transcription factor klf2a modulates CoW artery muscularization
Our results suggest that CoW ECs might express a flow-dependent transcriptional program that regulates spatiotemporal dynamics of VSMC differentiation on CoW arteries. Previous studies showed that expression pattern of transcription factor KLF2 in arterial ECs closely follows the pattern of flow-induced WSS (Lee et al., 2006; Parmar et al., 2006). Consistently, higher KLF2 expression can be induced by unidirectional pulsatile flow (Dekker et al., 2002). Furthermore, Klf2 is implicated in VSMC migration on arteries in mouse development: loss of Klf2 leads to aorta VSMC deficiency (Wu et al., 2008). Interestingly, klf2a expression in primitive veins of zebrafish trunk prevents VSMC association (Stratman et al., 2020). Hence, we tested the hypothesis that klf2a might be spatiotemporally regulated in CoW ECs and modulate VSMC differentiation. We first imaged Tg(klf2a:h2b-egfp, kdrl:hras-mcherry)ig11/s896, which labels nuclei with active klf2a signaling, and quantified the number of klf2a+ ECs in CoW arteries (Chi et al., 2008; Steed et al., 2016). To account for overall changes in EC number during development (Ulrich et al., 2011), and length of each vessel, we also imaged Tg(fli1:nls-gfp, kdrl:hras-mcherry)y7/s896, which labels all EC nuclei (Figure 5—figure supplement 1A–F; Roman et al., 2002). From 32 hpf to 54 hpf, the number of klf2a+ ECs in CaDI was comparable to PCS (Figure 5A–C, Figure 5—source data 1), however, the number of klf2a+ ECs in CaDI was significantly higher than BCA and PCS from 3 dpf (Figure 5A and D–E, Figure 5—source data 1), when acta2+ VSMCs differentiated on CaDI but not BCA and PCS (Figure 2C and F, and Figure 2—figure supplement 1A, B). Pearson correlation between the number of klf2a+ ECs and the number of acta2+ VSMCs on CaDI, BCA, and PCS at 3 dpf showed strong positive correlation with r=0.974 (Figure 5—figure supplement 1J). These results suggest that the number of klf2a+ ECs in CoW arteries is spatially correlated with VSMC differentiation.
Figure 5 with 1 supplement see all
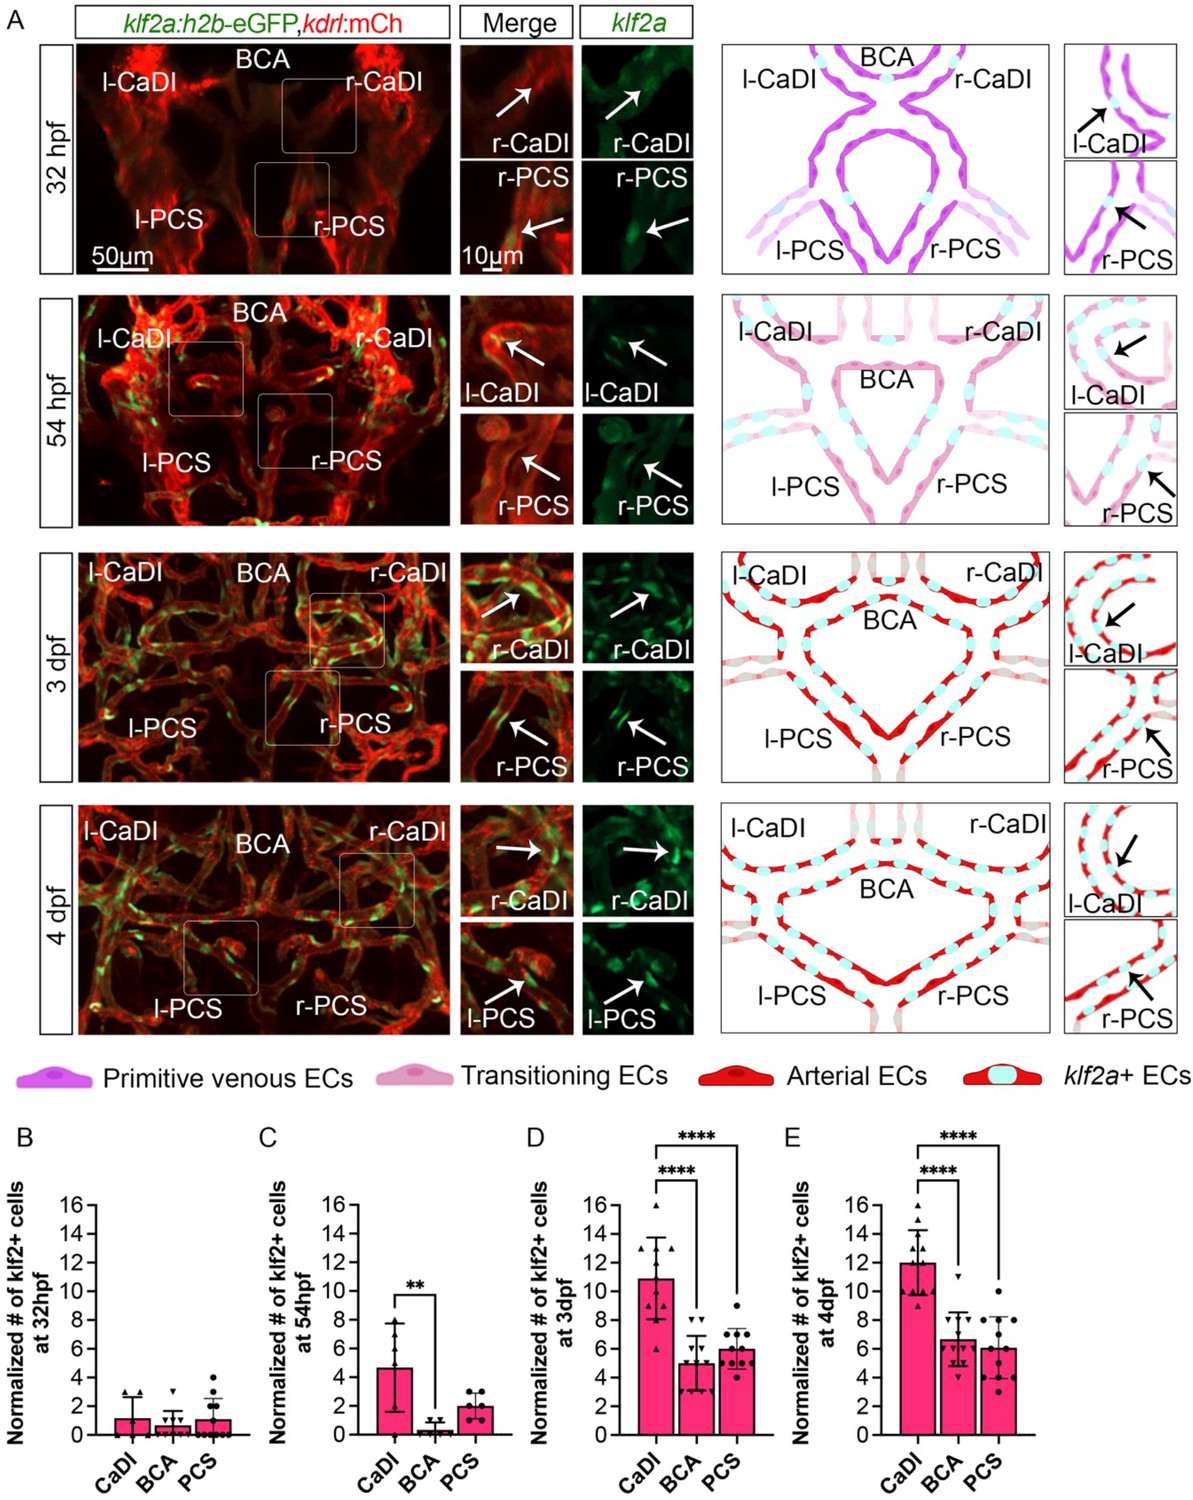
Blood flow-regulated transcription factor klf2a is expressed in circle of Willis (CoW) arteries.
(A) Confocal live images of CoW arteries in Tg(klf2a:h2b-gfp, kdrl:ras-mcherry)ig11/s896 and scheme representation of endothelial cells (ECs) in CoW arteries at 32 hours post fertilization (hpf), 54 hpf, 3 days post fertilization (dpf), and 4 dpf. Green channel represents klf2a:h2b-gfp, red channel represents kdrl:ras-mcherry, and merge panel combines both channels. Arrows point to the CoW arteries with klf2a:h2b-gfp signal. Scale bar = 50 μm. (B–E) Number of klf2a+ ECs per 100 μm vessel length on caudal division of internal carotid arteries (CaDI), basal communicating artery (BCA), and posterior communicating segments (PCS) at 32 hpf (n=6, 3 independent experiments) (B), 54 hpf (n=6, 2 independent experiments) (C), 3 dpf (n=11, 3 independent experiments) (D), and 4 dpf (n=12, 3 independent experiments) (E), ordinary one-way analyses of variance with Tukey’s multiple comparisons, represented with mean ± SD, **p≤0.01, ****p≤0.0001. Abbreviations: hpf: hour post fertilization, dpf: day post fertilization, EC: endothelial cell, l-CaDI: left caudal division of internal carotid artery, r-CaDI: right caudal division of internal carotid artery, BCA: basal communicating artery, l-PCS: left posterior communicating segment, r-PCS: right posterior communicating segment.
-
Figure 5—source data 1
Source data for number of klf2a+ endothelial cells (ECs) in Figure 5B–E.
- https://cdn.elifesciences.org/articles/94094/elife-94094-fig5-data1-v1.xlsx
To further define the role of klf2a in VSMC differentiation on CoW arteries, we knocked down klf2a in Tg(acta2:mcherry, kdrl:gfp)ca8/zn1 with 11 ng MO injection at one- to two-cell stage and imaged at 3–4 dpf (Nicoli et al., 2010; Whitesell et al., 2014; Zhong et al., 2006). We validated the effect of klf2a MO knockdown with Tg(klf2a:h2b-egfp, kdrl:hras-mcherry)ig11/s896 (Figure 5—figure supplement 1G–I; Chi et al., 2008; Steed et al., 2016). Compared to uninjected control, klf2a morphants have significantly less acta2+ VSMCs on CaDI at 3 dpf but a normal number by 4 dpf (Figure 6, Figure 6—source data 1), suggesting that klf2a knockdown delayed VSMC differentiation on CaDI. Together these data suggest that endothelial klf2a promotes initial VSMC differentiation on anterior CoW arteries.
Figure 6
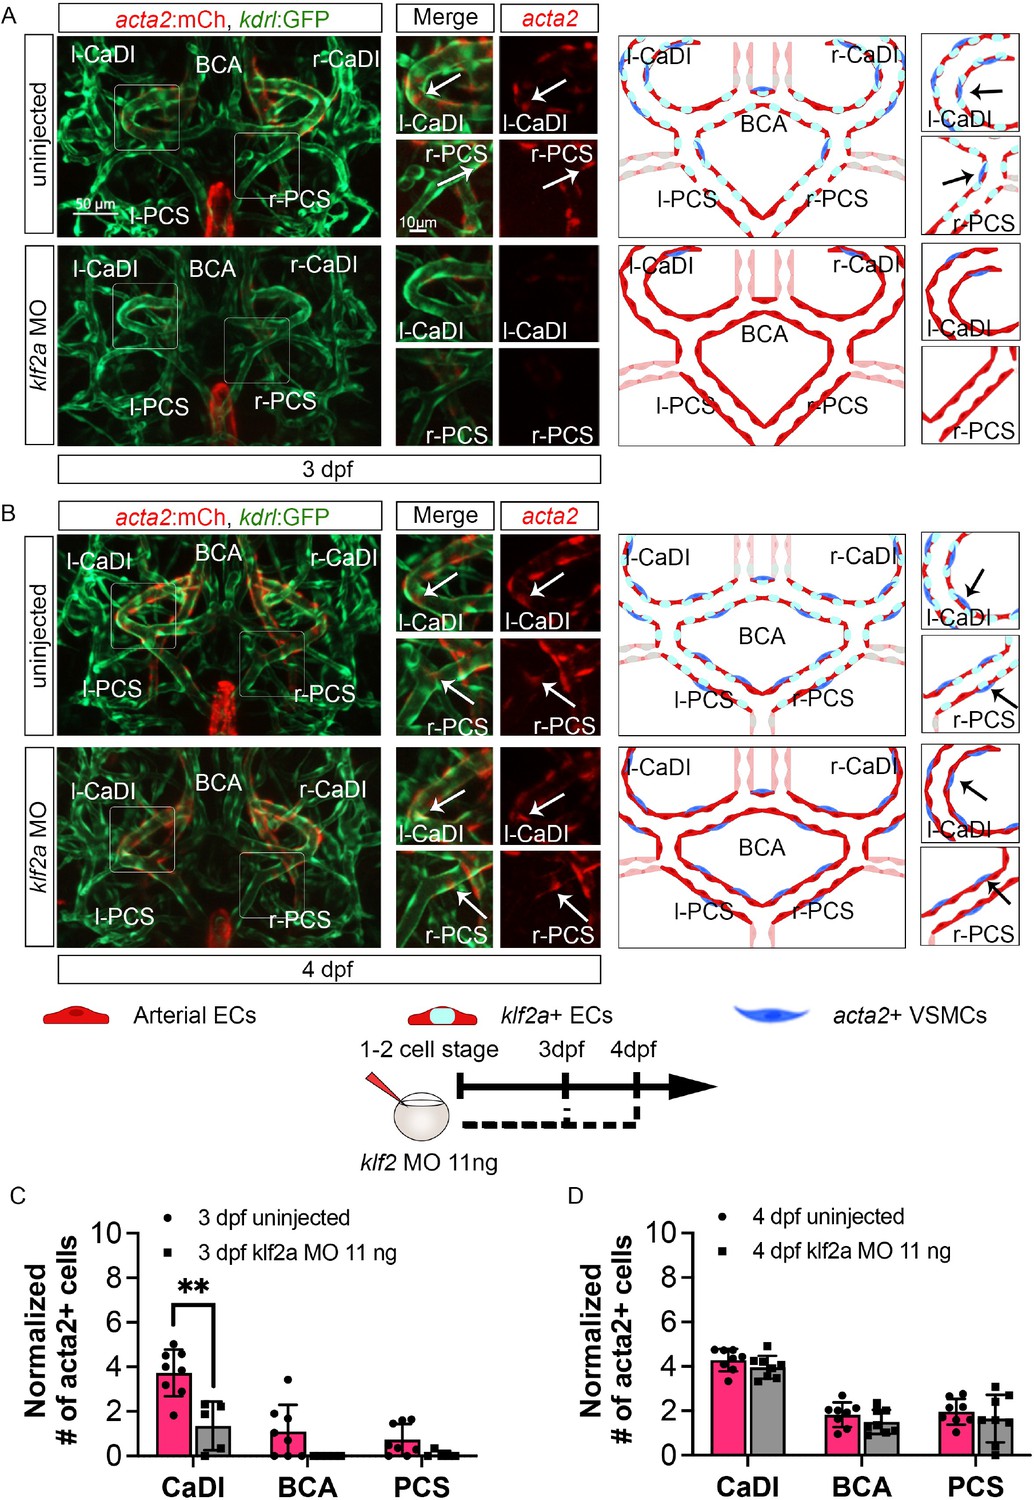
klf2a promotes vascular smooth muscle cell (VSMC) differentiation on anterior circle of Willis (CoW) arteries.
(A–B) Confocal live images of CoW arteries in Tg(acta2:mcherry; kdrl:gfp)ca8/zn1 and scheme representation of vascular endothelium and VSMCs on CoW arteries at 3 days post fertilization (dpf) (A) and 4 dpf (B) in uninjected control embryos and embryos injected with 11 ng klf2a morpholino (MO). Red channel represents acta2:mcherry, green channel represents kdrl:gfp, and merge panel combines both channels. Arrows point to the CoW arteries with acta2:mcherry signal. Scale bar = 50 μm. (C) Number of acta2+ VSMCs per 100 μm vessel length on caudal division of internal carotid arteries (CaDI), basal communicating artery (BCA), and posterior communicating segments (PCS) at 3 dpf in uninjected control (n=8, 2 independent experiments) and embryos injected with 11 ng klf2a MO at one- to two-cell stage (n=5, 2 independent experiments), two-tailed Mann–Whitney test on each vessel’s comparison, represented with mean ± SD, **p≤0.01. (D) Number of acta2+ VSMCs per 100 μm vessel length on CaDI, BCA, and PCS at 4 dpf in uninjected control (n=8, 3 independent experiments) and embryos injected with 11 ng klf2a MO at one- to two-cell stage (n=8, 3 independent experiments), two-tailed Mann–Whitney test on each vessel’s comparison, represented with mean ± SD. Abbreviations: hpf: hour post fertilization, dpf: day post fertilization, EC: endothelial cell, VSMC: vascular smooth muscle cell, MO: morpholino, l-CaDI: left caudal division of internal carotid artery, r-CaDI: right caudal division of internal carotid artery, BCA: basal communicating artery, l-PCS: left posterior communicating segment, r-PCS: right posterior communicating segment.
-
Figure 6—source data 1
Source data for acta2+ vascular smooth muscle cells (VSMCs) number in Figure 6C and D.
- https://cdn.elifesciences.org/articles/94094/elife-94094-fig6-data1-v1.xlsx
Discussion
In this study, we used confocal live imaging of fluorescence transgenic zebrafish embryos to investigate the spatiotemporal dynamics of VSMC differentiation on CoW, which comprises major arteries supplying blood to the vertebrate brain. Our observations revealed that CoW morphogenesis precedes arterial specification. Mural cell progenitors marked by pdgfrb+ initiate VSMC marker acta2 expression subsequent to their recruitment to CoW arteries. Notably, VSMC differentiation occurs earlier on anterior CoW arteries compared to their posterior counterparts, owing to elevated WSS resulting from higher velocity of RBCs in the incoming blood flow. To investigate the regulatory role of blood flow on spatiotemporal dynamics of VSMC differentiation, we employed in vitro co-culture assay along with genetic manipulation and drug treatment. Our findings indicate that blood flow indeed governs timing and location of VSMC differentiation on CoW arteries. Moreover, we observed that flow-responsive transcription factor klf2a is activated in a gradient manner from anterior to posterior CoW arteries, preceding VSMC differentiation. Knockdown experiments targeting klf2a revealed a delay in VSMC differentiation specifically on anterior CoW arteries. Taken together, these findings highlight endothelial klf2a activation by blood flow as a mechanism that promotes VSMC differentiation on CoW arteries in the vertebrate brain (see Figure 7 for a visual summary).
Figure 7
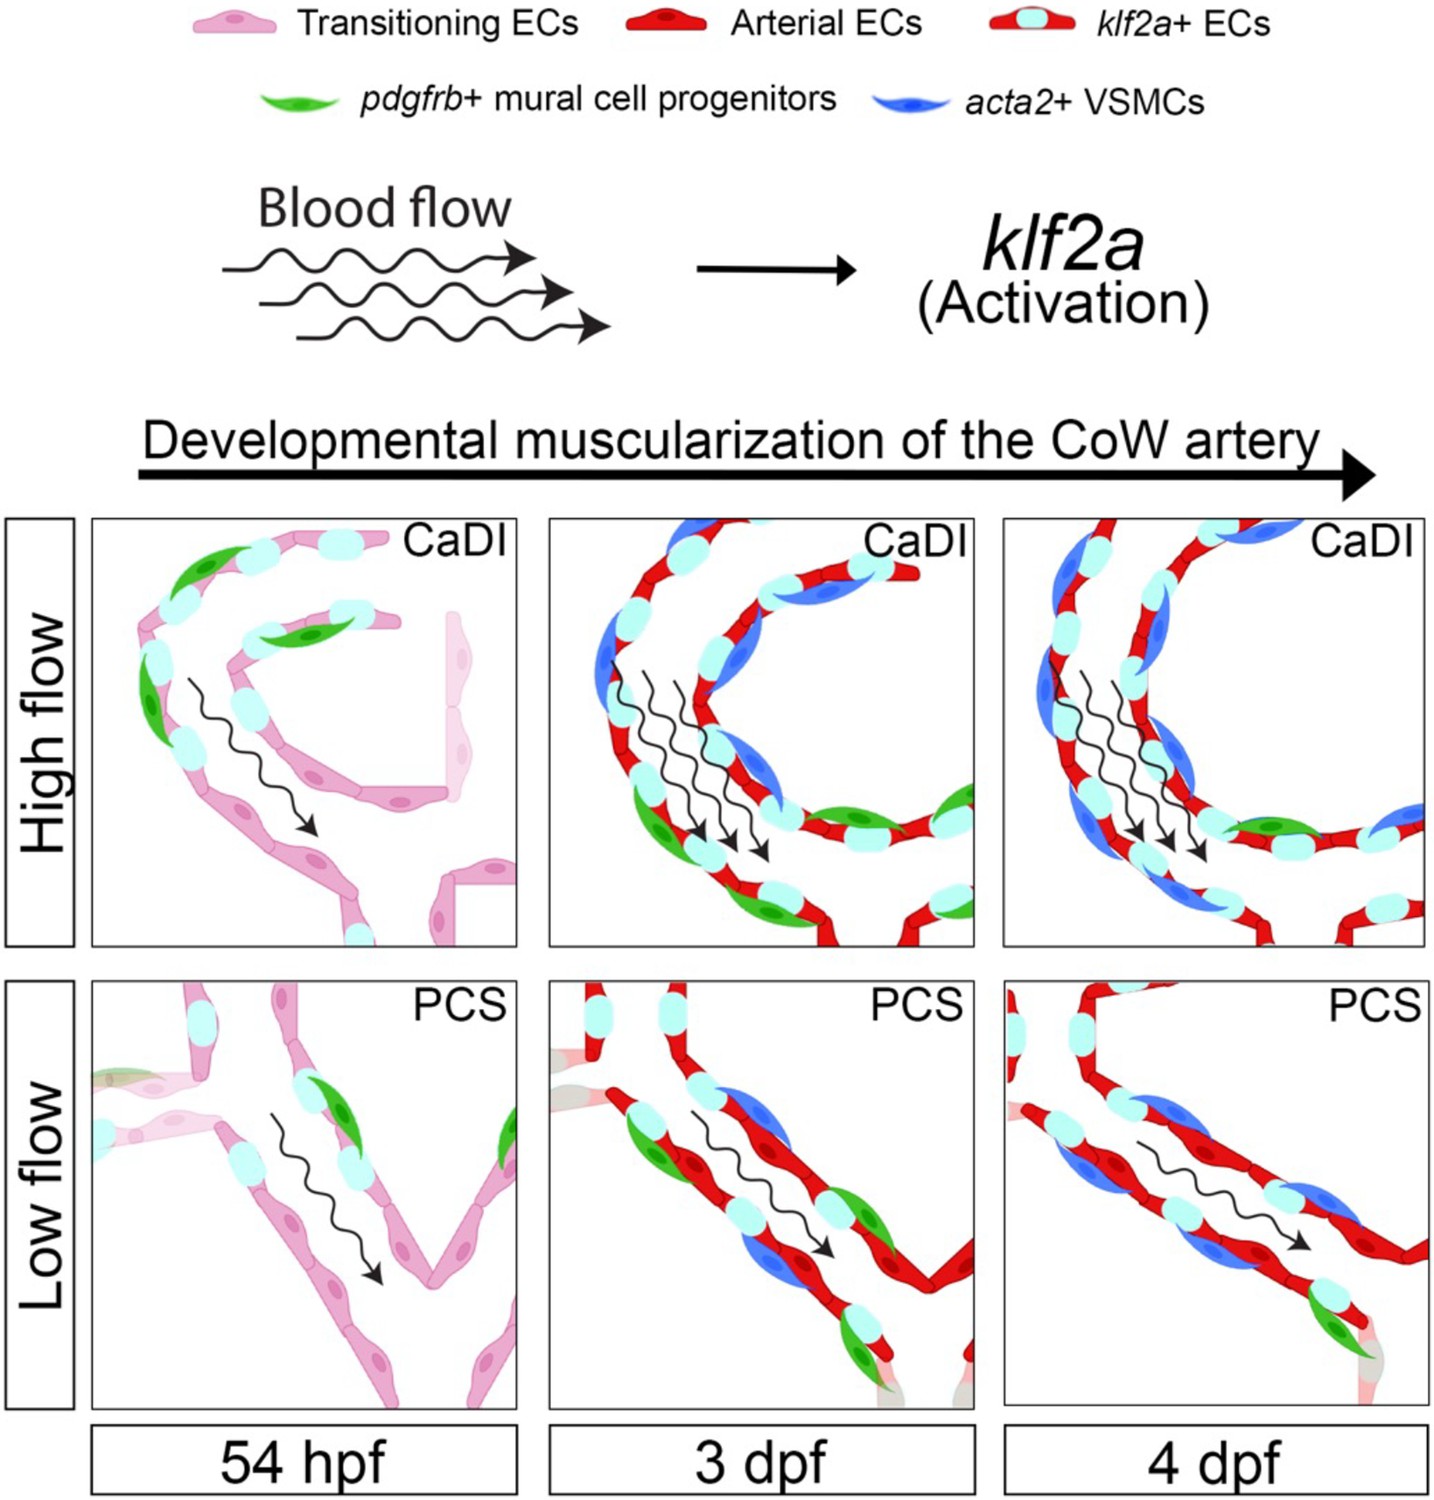
Schematic model of the developmental muscularization of circle of Willis (CoW) arteries.
The model shows how blood flow generates higher hemodynamics in anterior CoW arteries like caudal division of internal carotid artery (CaDI) and activates endothelial klf2a signaling. Other posterior CoW arteries with straight shape like posterior communicating segment (PCS) bear less hemodynamic force and show moderate klf2a activation and later VSMC differentiation. Abbreviations: hpf: hour post fertilization, dpf: day post fertilization, EC: endothelial cell, VSMC: vascular smooth muscle cell, CaDI: caudal division of internal carotid artery, PCS: posterior communicating segment.
Previous research shows that in zebrafish trunk, as soon as recruited to dorsal aorta, VSMCs express acta2 and transgelin (tagln), suggesting simultaneous recruitment and differentiation from sclerotome progenitors (Ando et al., 2016; Stratman et al., 2017). On CoW arteries in zebrafish brain, however, VSMC differentiation occurs after pdgfrb+ progenitor recruitment and proceeds from anterior to posterior (Figure 2B–F). The observed spatiotemporal dynamics of CoW VSMC differentiation again highlights organotypic development of blood vessels.
Our data suggest klf2a mediates blood flow regulation of VSMC differentiation on brain arteries, and thus raise the question of how klf2a transduces endothelial signals to mural cell progenitors and VSMCs. Notch signaling appears a plausible downstream effector of klf2a activation, as previous research suggests Notch responds to flow in heart valve development (Fontana et al., 2020), possibly downstream of klf2 (Duchemin et al., 2019). Wnt signaling is another possible downstream effector of klf2a, as previous research suggests endocardial klf2 upregulates Wnt signaling in neighboring mesenchymal cells in heart valve development (Goddard et al., 2017). The roles of Notch and Wnt signaling in organotypic VSMC differentiation on brain arteries remain to be determined.
The expression of klf2a in CoW arterial ECs remained stable from 3 dpf to 4 dpf (Figure 5), which raises an interesting question on whether sustained klf2a expression supports further maturation of VSMCs, as acta2+ VSMCs on CaDI showed distinct morphology at 4 dpf compared with 3 dpf, when they started differentiation from pdgfrb+ mural cell progenitors (Figure 2C, D and Figure 2—figure supplement 1A, B). Previous research found that acta2+ VSMCs on BCA and PCS express pericyte enriched abcc9 (ATP-binding cassette subfamily C member 9) at 4 dpf (Ando et al., 2022), when they started differentiation from pdgfrb+ mural cell progenitors and initiated acta2 expression; abcc9 expression is gradually lost from 5 dpf to 6 dpf (Ando et al., 2022). In addition, acta2+ VSMCs on CaDI, BCA, and PCS still retain expression of pdgfrb as late as 6 dpf (Ando et al., 2021). Thus, it is possible that stable expression of klf2a in CoW arterial ECs supports further VSMC maturation, as indicated by expression of tagln (Colijn et al., 2023). Another aspect of VSMC maturation is its function to confer vascular tone. A previous study found that VSMC covered vessels in zebrafish brain dilate as early as 4 dpf and constrict at 6 dpf (Bahrami and Childs, 2020). Future study may focus on the association between expression of different VSMC markers and VSMC functional maturation.
Another question is how flow activates klf2a in brain arteries. In a hypoxia-induced pulmonary hypertension model, Klf2 is activated by G-protein-coupled receptor-mediated Apelin signaling (Chandra et al., 2011). In heart valve development, endocardial klf2a is upregulated by membrane-bound mechanosensitive channels trpp2 and trpv4 (Heckel et al., 2015). The pathway through which flow activates klf2a in brain arterial ECs remains unknown. The CoW VSMC phenotype of klf2a morphants is similar to, but do not fully recapitulate, the phenotypes of tnnt2a morphants or nifedipine-treated embryos (Figure 4E–K and Figure 6). A proximal explanation is compensation by paralogous klf2b in zebrafish. Further characterization of CoW VSMC development in klf2a and klf2b genetic mutants (Rasouli et al., 2018; Steed et al., 2016) may help determine whether klf2b compensates klf2a in CoW VSMC differentiation.
In addition to WSS, transmural pressure and associated mechanical stretch is another mechanical input of vascular wall that may contribute to VSMC differentiation. VSMCs autonomously sense and adapt to mechanical stretch (Haga et al., 2007). Cyclic stretching activates arterial VSMC production of certain components of extracellular matrix (ECM) (Leung et al., 1976). In turn, specific interactions between ECM and integrins enable VSMCs to sense mechanical stretch (Goldschmidt et al., 2001; Wilson et al., 1995). Connection to ECM is essential for VSMC force generation (Milewicz et al., 2017). VSMCs express stretch activated Trpp2, which enables myogenic response to autoregulate resting arterial diameter (Sharif-Naeini et al., 2009). Interestingly, ex vivo stretching promotes expression of contractile proteins, such as Acta2 and Tagln in VSMCs on murine portal veins (Albinsson et al., 2004; Turczyńska et al., 2013). In addition, excessive mechanical stretch promotes VSMC dedifferentiation and inflammation (Cao et al., 2017; Wang et al., 2018). Further investigation is needed to determine the potential role of increasing transmural pressure and associated mechanical stretch during development in VSMC differentiation.
There are a few limitations to our current study. Genetic manipulation and drug treatment that reduce heart rate would also reduce nutrients carried by blood flow, and the effects of nutrient and flow reduction could not be uncoupled in live zebrafish embryos. In addition, these methods are only capable of qualitative reduction of flow but not specific dampening of pulsations. In vitro three-dimensional (3D) vascular culture models, which combine ECs and mural cells (Mirabella et al., 2017; Vila Cuenca et al., 2021), could be further optimized to simulate complex geometry of brain arteries. Combining these models with microfluidics, which allows precise calibration of nutrient composition in culture media, flow velocity, and pulse, would enable more thorough analysis of endothelial mechanotransduction and its contribution to VSMC differentiation (Abello et al., 2022; Gray and Stroka, 2017; Griffith et al., 2020).
We used nifedipine to temporally reduce heart rate and blood flow. Nifedipine is a blocker of L-type voltage-dependent calcium channels (VDCCs) (Quevedo et al., 1998). A previous study shows that ML218, a T-type VDCC-selective inhibitor, tends to increase VSMC differentiation (Ando et al., 2022). In addition to the difference in drug targets, we also noted that in the previous study, the increase in VSMC differentiation only occur on anterior metencephalic central arteries (AMCtAs) that are more than 40 μm away from the BCA; these AMCtAs are much smaller than CoW arteries and have different geometry (Ando et al., 2022). Although the most obvious effect of nifedipine in zebrafish embryos is heart rate and blood flow reduction (Gierten et al., 2020), it is possible that nifedipine affects VSMC through VDCCs. Further investigation is needed to uncouple the roles of different VDCCs in VSMC differentiation and their association with hemodynamics.
We used Tg(flt4:yfp, kdrl:ras-mcherry)hu4881/s896 to show CoW arterial specification from primitive venous ECs (Chi et al., 2008; Hogan et al., 2009). kdrl is not the best arterial marker as its expression is only enriched but not restricted to arteries. While the use of the two fluorescence transgenic lines helped us establish the temporal sequence of CoW morphogenesis, arterial specification and VSMC differentiation, analysis of additional arterial and venous markers is needed to fully characterize arterial specification in vertebrate brain vascular development.
In summary, our work identifies flow-induced endothelial klf2a activation as a mechanism that regulates spatiotemporal dynamics of VSMC differentiation on CoW arteries in vertebrate brain. Our data may help advance approaches to regenerate dedifferentiated VSMCs in cerebrovascular disease. It would be important to further investigate mechanisms upstream and downstream of klf2a activation in brain arterial ECs and additional mechanotransduction pathways that may contribute to VSMC differentiation on brain arteries.
Materials and methods
Zebrafish husbandry and transgenic lines
Request a detailed protocolZebrafish were raised and maintained at 28.5°C using standard methods. Protocols are approved by the Yale Institutional Animal Care and Use Committee (2020-11473). TgBAC(pdgfrb:egfp)ncv22 was generated by Ando et al., 2016. They reported that pdgfrb:egfp+ cells express another pericyte enriched marker abcc9 (ATP-binding cassette subfamily C member 9) (Ando et al., 2019, Ando et al., 2022). With this transgenic line, they also observed that pdgfrb mutant lacks brain pericytes and exhibits loss of VSMC coverage (Ando et al., 2021). Thus, we used TgBAC(pdgfrb:egfp)ncv22 to study mural cell coverage of vascular endothelium in zebrafish CoW arteries. All transgenic lines in Table 1 were established previously.
Table 1
List of zebrafish fluorescent transgenic lines used in the study.
| Transgenic line | ID | Lab of origin | Reference |
|---|---|---|---|
| Tg(flt4:yfp)hu4881 | ZDB-ALT-100208-1 | S Schulte-Merker | Hogan et al., 2009 |
| Tg(kdrl:hras-mcherry)s896 [Tg(kdrl:ras-mcherry)s896] | ZDB-ALT-081212-4 | DYR Stainier | Chi et al., 2008 |
| Tg(acta2:mcherry)ca8 | ZDB-ALT-120508-2 | SJ Childs | Whitesell et al., 2014 |
| TgBAC(pdgfrb:egfp)ncv22 | ZDB-ALT-160609-1 | N Mochizuki | Ando et al., 2016 |
| Tg(kdrl:cerulean)sd24 | ZDB-ALT-131024-2 | D Traver | Page et al., 2013 |
| Tg(kdrl:grcfp)zn1 [Tg(kdrl:gfp)zn1] | ZDB-ALT-051114-10 | Zygogen Research Department | Cross et al., 2003 |
| Tg(klf2a:h2b-egfp)ig11 | ZDB-ALT-161017-10 | J Vermot | Steed et al., 2016 |
| Tg(fli1:negfp)y7 [Tg(fli1:nls-gfp)y7] | ZDB-ALT-060821-4 | BM Weinstein | Roman et al., 2002 |
| Tg(gata1:dsRed)sd2 | ZDB-ALT-051223-6 | LI Zon | Traver et al., 2003 |
-
.
Confocal fluorescence microscopy
Request a detailed protocolZebrafish embryos were raised in 0.003% 1-phenyl-2-thiourea (PTU, phenylthiocarbamide, or n-phenylthiourea, Sigma P7629) from gastrulation stage to prevent pigmentation. Embryos imaged live by confocal fluorescence microscopy were anesthetized in 0.1% tricaine methanesulfonate (TMS, MS-222, or Syncaine, Western Chemical, NC0872873) and mounted in 1% low melt agarose within glass-bottom microwell dishes. Fluorescence images were captured with an upright Zeiss LSM 980 confocal microscope using a 20× objective.
Image analysis
Request a detailed protocolConfocal fluorescence images were analyzed with Imaris microscopy image analysis software (Bitplane, Oxford Instruments). Average fluorescence intensity of mCherry in Tg(flt4:yfp, kdrl:hras-mcherry)hu4881/s896 was estimated by generating volume objects covering the artery of interest with Surface module. Vessel lengths of the arteries were manually traced with Filament module. Numbers of pdgfrb+ mural cell progenitors, acta2+ VSMCs, and klf2a+ and fli1+ endothelial nuclei were counted with Spots module.
Morpholino injections
Request a detailed protocolMorpholino antisense oligonucleotides were synthesized by Gene Tools. Morpholinos in Table 2 were validated previously. Optimized dose injected into each embryo are listed. Uninjected siblings were used as controls.
Table 2
List of morpholino antisense oligonucleotides used in the study.
| Morpholino | Sequence | ID | Reference | Dose (ng/embryo) |
|---|---|---|---|---|
| MO1-tnnt2a | 5' - CATGTTTGCTCTGATCTGACACGCA -3' | ZDB-MRPHLNO-060317-4 | Sehnert et al., 2002 | 0.35 |
| MO1-klf2a | 5' - GGACCTGTCCAGTTCATCCTTCCAC -3' | ZDB-MRPHLNO-100610-8 | Nicoli et al., 2010 | 11 |
Nifedipine treatment
Request a detailed protocolNifedipine was dissolved into 20 mM in dimethyl sulfoxide (DMSO). The stock solution was diluted into 25 μM in egg water with 0.003% PTU to treat zebrafish embryos from 54 hpf to 3 dpf or 4 dpf. The stock solution was diluted into 20 μM in egg water with 0.003% PTU to treat zebrafish embryos from 4 dpf to 5 dpf. The same volume of DMSO was added into egg water with 0.003% PTU for sibling control embryos.
Microangiography
Request a detailed protocolEmbryos were anesthetized in 0.1% TMS, placed on an agarose mold, and injected pericardially with 4 nL tetramethylrhodamine dextran (2,000,000 molecular weight, Thermo Fisher) at a concentration of 10 mg/mL. Subsequently, the vasculature of embryos was checked for dextran fluorescence signal under a stereomicroscope (Olympus, MVX10). Embryos with dextran fluorescence were mounted in 1% low melt agarose within glass-bottom microwell dishes and imaged with confocal microscope.
RBC velocity
Request a detailed protocolRBC velocity was measured with axial line scanning to analyze zebrafish in Tg(kdrl:gfp;gata1:DsRed)zn1/sd2 background, in which blood vessels and RBCs are labeled with green and red fluorescent protein, respectively (Cross et al., 2003; Traver et al., 2003). As described previously (Barak et al., 2021), this axial line scan was conducted in a Zeiss LSM980 confocal microscope. A line was drawn inside the lumen of CoW vessels and parallel to the longitudinal axis of the vessel. The average length of the line was 21.21 μm. The scan speed was chosen as maximum per second for 20,000 cycles (total scan duration was 5.86 s; line scan time is 292.80 μs). A kymograph was exported in TIFF format after every measurement by ZEN 3.5 and analyzed RBC recognition and segmentation by using Fiji (ImageJ). First, the RBC kymography image was processed using ‘noise despeckle’ and ‘enhance contrast’ steps. The brightness and contrast were appropriately adjusted if needed. Next, the RBCs were segmented, thresholding was adjusted, and the slope of the RBCs was calculated automatically using the ‘Analyze particle’ option. Finally, the velocity of each RBC was calculated using the following equation: velocity = (1/tan(a)) * (length of the y-axis of the kymograph/duration of the total scan). We averaged systolic peak velocities and end diastolic velocities to measure the mean RBC velocity in CoW arteries.
CFD simulation
Request a detailed protocolCFD simulation was performed according to CoW geometry at 54 hpf, 3 dpf, and 4 dpf as previously described with modification (ANSYS, 2014; Barak et al., 2021). First, 3D geometry models of CoW arteries were reconstructed from confocal z-stack microangiography images of dextran-injected Tg(kdrl:gfp) embryos with Filament module in Imaris (9.9.0, Bitplane, Oxford Instruments). These CoW 3D geometry models were pre-processed in ANSYS SpaceClaim 2022 R1 software. For example, the computational mesh on the CoW vascular wall was created and the boundary conditions were set up for the simulation. Meshing orthogonal quality was calculated, and objects less than 0.01 were excluded. Inlets and outlets were determined in the 3D model for flow simulation. Next, the pre-processed models were imported in ANSYS Fluent 2022 R1 software. The non-Newtonian behavior of blood flow was modeled using the Carreau model provided by ANSYS. Blood density was considered as 1060 kg/m3. The computational simulation used average RBC velocity in CoW arteries at 54 hpf (532.72 μm/s), 3 dpf (602.34 μm/s), and 4 dpf (552.83 μm/s), respectively. After the CoW geometry and numerical solution of blood flow were ready, the flow simulation was implemented with 200 iterations to identify the magnitude and distribution of WSS in the CoW.
Cell culture
Request a detailed protocolPooled primary HUVECs (PCS-100-010, ATCC) were seeded at an initial concentration of 5000 cells/cm2, in 1× M119 media (110343-023, Gibco) supplemented with 16% FBS (Gibco), 84 µg/mL of heparin sodium salt (H3393, Sigma-Aldrich), 25 µg/mL of EC growth supplement (02-102, EMD Millipore Corp.) and 1× Antibiotic-antimycotic solution (15240-062, Gibco). Cell cultures were maintained at 37°C, 5% CO2, and 95% humidity, until the cells reached 80% confluence.
To facilitate cell visualization in cell co-cultures, HBVPs (1200, ScienCell) were transfected using lentiviral particles (LVP310, GenTarget, Inc) to induce GFP expression under EF1a promotor. Cell cultures were initiated by seeding 5000 cells/cm2 in 175 cm2 plastic flasks precoated with gelatin and 1× DMEM (11995-065, Gibco) supplemented with 10% FBS (Gibco), and 1× Antibiotic-antimycotic solution under the same cell culture conditions described above. When cell cultures were at 80% confluence, 200 µL containing 2×10⁶ GFP-lentiviral particles were added to each 175 flasks. After 72 hours, fresh cell culture media supplemented with 10 µg/mL of Blasticidin (15205, Sigma-Aldrich) were added to each flask to select the positive transfected cells.
Flow assays and immunostaining
Request a detailed protocolHBVP cells were harvested and seeded at a concentration of 1.3×10⁵ cells in 0.4 optical plastic flow microslides (80176, Ibidi) precoated with 1 mg/mL gelatin and incubated for 24 hours under standard culture conditions. After the initial incubation, 100 µg/mL of collagen I (354249, Corning) diluted in DMEM cell culture media was added to the slides to create a thin layer on top of the HBVP cells. After 2 hours, the media was removed and 2.5×10⁵ HUVECs were seeded on top of the collagen I layer and incubated for additional 24 hours. After cell co-cultures were established, the slides were exposed to laminar (15 dyn/cm2) or pulsatile (12–15 dyn/cm2) flow for 24 hours, implementing a peristaltic pump adapted to produce different types of flow (Abello et al., 2022). After 24 hours, cultures were rinsed with 1× PBS and fixed for 30 min in 4% paraformaldehyde at room temperature. Cell cultures were immunostained with alpha-smooth muscle actin D4K9N XP rabbit monoclonal antibody (19245, Cell Signaling), followed by Alexa Fluor 633 goat anti-rabbit IgG (A21071, Invitrogen). Confocal images were obtained using a 40× objective with a W1 Spinning Disk confocal microscope, a Fusion camera, and the Nikon Eclipse Ti2-E base. Fiji image processing software was used for image analysis and fluorescence intensity quantification.
Statistics
All statistical analyses were performed with GraphPad Prism (version 10.0.3). Sample size and statistical test are specified in each legend. All quantifications are represented with mean ± SD. ns, not significant p > 0.05, *p ≤ 0.05, **p ≤ 0.01, ***p ≤ 0.001, ****p ≤ 0.0001. Mann–Whitney test was used to compare two groups to test mean differences (protein level, morpholino, and nifedipine treatment). Two-way analysis of variance (ANOVA) followed by Tukey’s multiple comparisons was used to test mean differences compared more than two groups under different conditions (average fluorescence intensity, cell number, vascular diameter). Ordinary one-way ANOVA with Tukey’s multiple comparisons was used to test mean differences among three groups (RBC velocity, WSS, and cell number). Pearson correlation analysis was used to measure the strength and direction of a linear relationship between two variables with a covariance (WSS vs acta2+ EC, acta2+ EC vs klf2+ EC).
Data availability
All data generated or analysed during this study are included in the manuscript and supporting files; source data files have been provided for the figures.
References
-
Peristaltic pumps adapted for laminar flow experiments enhance invitro modeling of vascular cell behaviorThe Journal of Biological Chemistry 298:102404.https://doi.org/10.1016/j.jbc.2022.102404
-
Stretch of the vascular wall induces smooth muscle differentiation by promoting actin polymerizationThe Journal of Biological Chemistry 279:34849–34855.https://doi.org/10.1074/jbc.M403370200
-
Development of vascular regulation in the zebrafish embryoDevelopment 147:dev183061.https://doi.org/10.1242/dev.183061
-
Vascular smooth muscle cells in atherosclerosisNature Reviews. Cardiology 16:727–744.https://doi.org/10.1038/s41569-019-0227-9
-
Disruption of the apelin-APJ system worsens hypoxia-induced pulmonary hypertensionArteriosclerosis, Thrombosis, and Vascular Biology 31:814–820.https://doi.org/10.1161/ATVBAHA.110.219980
-
Foxn4 directly regulates tbx2b expression and atrioventricular canal formationGenes & Development 22:734–739.https://doi.org/10.1101/gad.1629408
-
Rapid analysis of angiogenesis drugs in a live fluorescent zebrafish assayArteriosclerosis, Thrombosis, and Vascular Biology 23:911–912.https://doi.org/10.1161/01.ATV.0000068685.72914.7E
-
BookImplementation and comparison of non-Newtonian viscosity models in hemodynamic simulations of patient coronary arteriesIn: Fernandes MC, editors. Theoretical Analyses, Computations, and Experiments of Multiscale Materials: A Tribute to Francesco Dell’Isola. Springer. pp. 403–428.https://doi.org/10.1007/978-3-031-04548-6
-
Pathophysiology of vascular stenosis and remodeling in moyamoya diseaseFrontiers in Neurology 12:661578.https://doi.org/10.3389/fneur.2021.661578
-
Smooth muscle cells of intracranial vessels: from development to diseaseCardiovascular Research 114:501–512.https://doi.org/10.1093/cvr/cvy002
-
Vascular endothelial cell mechanosensing: New insights gained from biomimetic microfluidic modelsSeminars in Cell & Developmental Biology 71:106–117.https://doi.org/10.1016/j.semcdb.2017.06.002
-
Microfluidics for the study of mechanotransductionJournal of Physics D 53:22.https://doi.org/10.1088/1361-6463/ab78d4
-
Molecular basis of the effects of mechanical stretch on vascular smooth muscle cellsJournal of Biomechanics 40:947–960.https://doi.org/10.1016/j.jbiomech.2006.04.011
-
Imaging blood vessels in the zebrafishMethods in Cell Biology 100:27–54.https://doi.org/10.1016/B978-0-12-384892-5.00002-5
-
Neuronal regulation of the blood-brain barrier and neurovascular couplingNature Reviews. Neuroscience 21:416–432.https://doi.org/10.1038/s41583-020-0322-2
-
Normal cerebral arterial development and variationsSeminars in Ultrasound, CT, and MR 32:242–251.https://doi.org/10.1053/j.sult.2011.02.002
-
Wall shear stress: theoretical considerations and methods of measurementProgress in Cardiovascular Diseases 49:307–329.https://doi.org/10.1016/j.pcad.2006.11.001
-
Klf2 is an essential regulator of vascular hemodynamic forces in vivoDevelopmental Cell 11:845–857.https://doi.org/10.1016/j.devcel.2006.09.006
-
Altered smooth muscle cell force generation as a driver of thoracic aortic aneurysms and dissectionsArteriosclerosis, Thrombosis, and Vascular Biology 37:26–34.https://doi.org/10.1161/ATVBAHA.116.303229
-
3D-printed vascular networks direct therapeutic angiogenesis in ischaemiaNature Biomedical Engineering 1:0083.https://doi.org/10.1038/s41551-017-0083
-
Widening perspectives on regenerative processes through growthNpj Regenerative Medicine 1:16015.https://doi.org/10.1038/npjregenmed.2016.15
-
Integration of flow-dependent endothelial phenotypes by Kruppel-like factor 2The Journal of Clinical Investigation 116:49–58.https://doi.org/10.1172/JCI24787
-
Smooth muscle cell phenotypic switching in strokeTranslational Stroke Research 5:377–384.https://doi.org/10.1007/s12975-013-0306-x
-
L-type voltage-dependent calcium channel blocker nifedipine enhances memory retention when infused into the hippocampusNeurobiology of Learning and Memory 69:320–325.https://doi.org/10.1006/nlme.1998.3822
-
BookThe mouse circle of willisIn: Schröder H, Moser N, editors. Neuroanatomy of the Mouse: An Introduction. Springer International Publishing. pp. 333–340.https://doi.org/10.1007/978-3-030-19898-5
-
Assessment of vascular patterning in the ZebrafishMethods in Molecular Biology 2206:205–222.https://doi.org/10.1007/978-1-0716-0916-3_15
-
Regulation of vascular smooth muscle mechanotransduction by microRNAs and L-type calcium channelsCommunicative & Integrative Biology 6:e22278.https://doi.org/10.4161/cib.22278
-
Neurovascular development in the embryonic zebrafish hindbrainDevelopmental Biology 357:134–151.https://doi.org/10.1016/j.ydbio.2011.06.037
-
arterial wall stress induces phenotypic switching of arterial smooth muscle cells in vascular remodeling by activating the YAP/TAZ signaling pathwayCellular Physiology and Biochemistry 51:842–853.https://doi.org/10.1159/000495376
-
Mechanical strain of rat vascular smooth muscle cells is sensed by specific extracellular matrix/integrin interactionsThe Journal of Clinical Investigation 96:2364–2372.https://doi.org/10.1172/JCI118293
-
KLF2 transcription factor modulates blood vessel maturation through smooth muscle cell migrationThe Journal of Biological Chemistry 283:3942–3950.https://doi.org/10.1074/jbc.M707882200
Article and author information
Author details
Funding
National Institutes of Health (R01NS109160)
- Stefania Nicoli
National Institutes of Health (R01DK118728)
- Stefania Nicoli
American Heart Association (AHA23POST1025829)
- Ivan Fan Xia
The funders had no role in study design, data collection and interpretation, or the decision to submit the work for publication.
Acknowledgements
We thank the labs of S Schulte-Merker, DYR Stainier, SJ Childs, N Mochizuki, D Traver, J Vermot, BM Weinstein, and LI Zon for sharing zebrafish transgenic lines. We thank N Semanchik for all the assistance with zebrafish adult colonies and husbandry. Experiments in the manuscript were supported by R01NS109160 and R01DK118728 awarded to SN and AHA23POST1025829 post-doctoral fellowship awarded to IFX. The paper is based on a dissertation submitted by SC to fulfill in part the requirements for the degree of Doctor of Philosophy, Yale University. SC was supported by a Gruber Science Fellowship from Yale Graduate School of Arts and Sciences.
Ethics
This study was performed in strict accordance with the recommendations in the Guide for the Care and Use of Laboratory Animals of the National Institutes of Health. Protocols are approved by the Yale Institutional Animal Care and Use Committee (IACUC #2020-11473).
Version history
- Sent for peer review:
- Preprint posted:
- Reviewed Preprint version 1:
- Reviewed Preprint version 2:
- Version of Record published:
Cite all versions
You can cite all versions using the DOI https://doi.org/10.7554/eLife.94094. This DOI represents all versions, and will always resolve to the latest one.
Copyright
© 2024, Cheng, Xia et al.
This article is distributed under the terms of the Creative Commons Attribution License, which permits unrestricted use and redistribution provided that the original author and source are credited.
Metrics
-
- 1,425
- views
-
- 125
- downloads
-
- 9
- citations
Views, downloads and citations are aggregated across all versions of this paper published by eLife.
Citations by DOI
-
- 7
- citations for umbrella DOI https://doi.org/10.7554/eLife.94094
-
- 2
- citations for Version of Record https://doi.org/10.7554/eLife.94094.3
Download links
A two-part list of links to download the article, or parts of the article, in various formats.
Downloads (link to download the article as PDF)
Open citations (links to open the citations from this article in various online reference manager services)
Cite this article (links to download the citations from this article in formats compatible with various reference manager tools)
Hemodynamics regulate spatiotemporal artery muscularization in the developing circle of Willis
eLife 13:RP94094.
https://doi.org/10.7554/eLife.94094.3


