Hemodynamics regulate spatiotemporal artery muscularization in the developing circle of Willis
- Department of Genetics, Yale School of Medicine, United States
- Yale Cardiovascular Research Center, Section of Cardiology, Department of Internal Medicine, Yale School of Medicine, United States
- Vascular Biology & Therapeutics Program, Yale School of Medicine, United States
- Department of Cell Biology & Physiology, School of Medicine, Washington University in St. Louis, United States
Figures
Figure 1
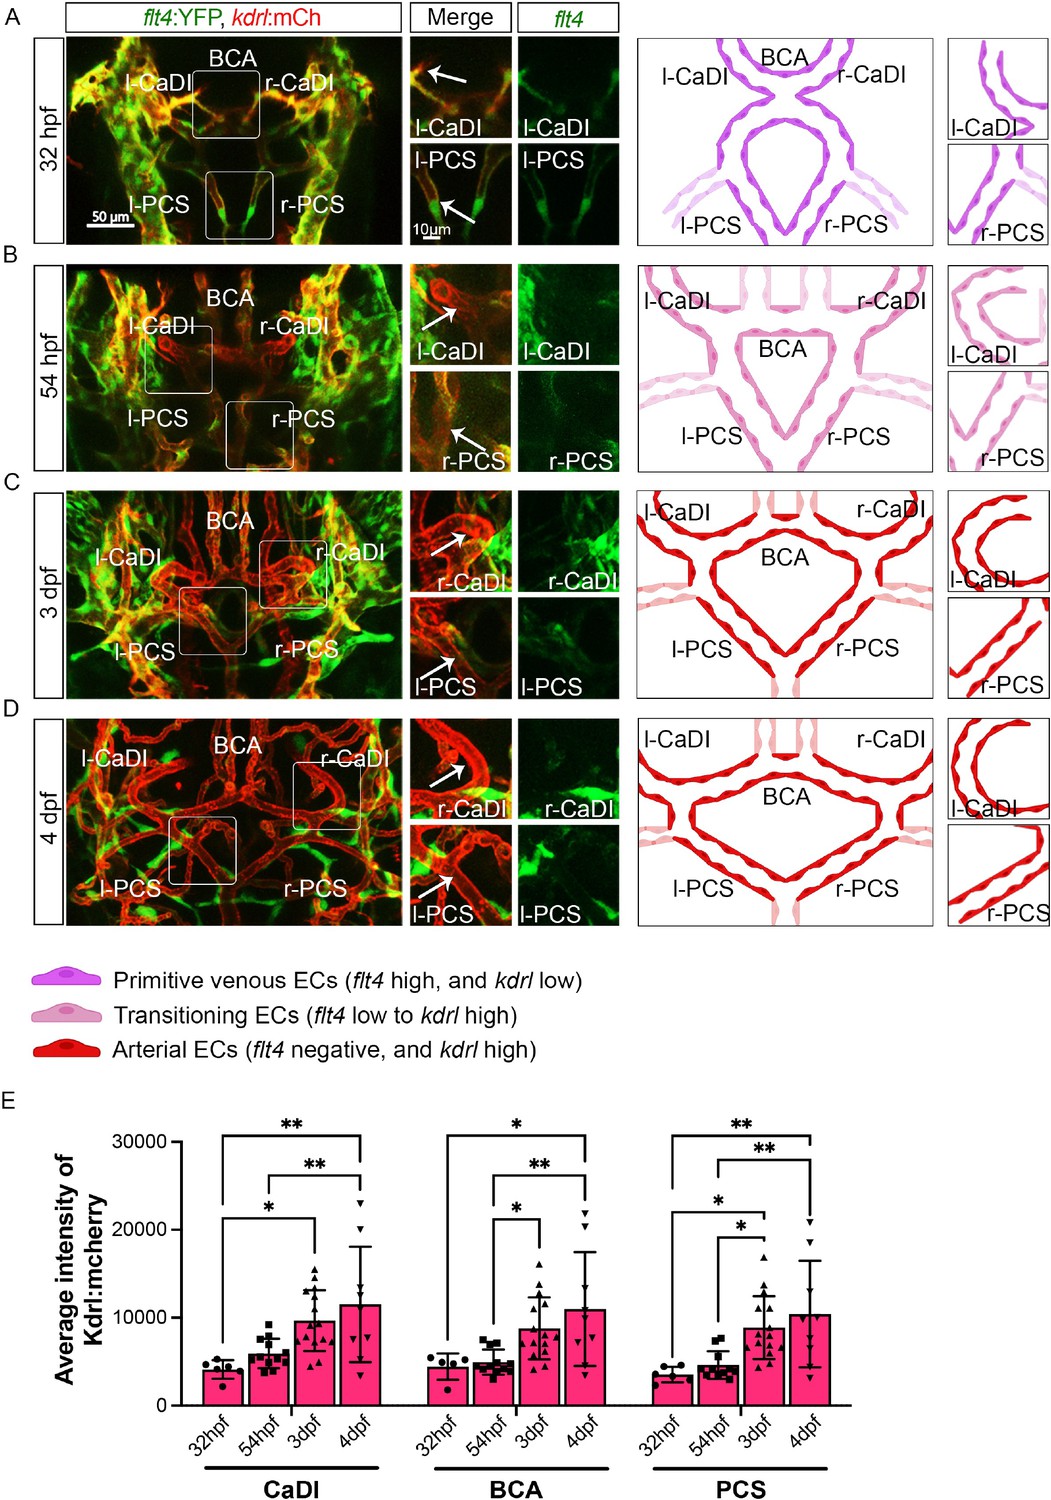
Arterial specification of endothelial cells (ECs) in circle of Willis (CoW) arteries.
(A–D) Confocal live images of CoW arteries in Tg(flt4:yfp, kdrl:hras-mcherry)hu4881/s896 and scheme representation of CoW arteries in zebrafish brain at 32 hours post fertilization (hpf) (A), 54 hpf (B), 3 days post fertilization (dpf) (C), and 4 dpf (D). Green channel represents flt4:yfp fluorescence, red channel represents kdrl:hras-mcherry fluorescence, and merge panel combines both channels. Arrows point to the CoW arteries with kdrl:hras-mcherry signal. Scale bar = 50 μm. (E) Average intensity of kdrl:hras-mcherry in caudal division of internal carotid arteries (CaDI), basal communicating artery (BCA), and posterior communicating segments (PCS) at 32 hpf (n=6, 2 independent experiments), 54 hpf (n=12, 4 independent experiments), 3 dpf (n=15, 4 independent experiments), and 4 dpf (n=9, 2 independent experiments), two-way analysis of variance followed by Tukey’s multiple comparisons, represented with mean ± SD, *p≤0.05, **p≤0.01. Abbreviations: hpf: hour post fertilization, dpf: day post fertilization, EC: endothelial cell, l-CaDI: left caudal division of internal carotid artery, r-CaDI: right caudal division of internal carotid artery, BCA: basal communicating artery, l-PCS: left posterior communicating segment, r-PCS: right posterior communicating segment.
-
Figure 1—source data 1
Source data for average intensity of kdrl:hras-mcherry in Figure 1E.
- https://cdn.elifesciences.org/articles/94094/elife-94094-fig1-data1-v1.xlsx
Figure 2 with 1 supplement
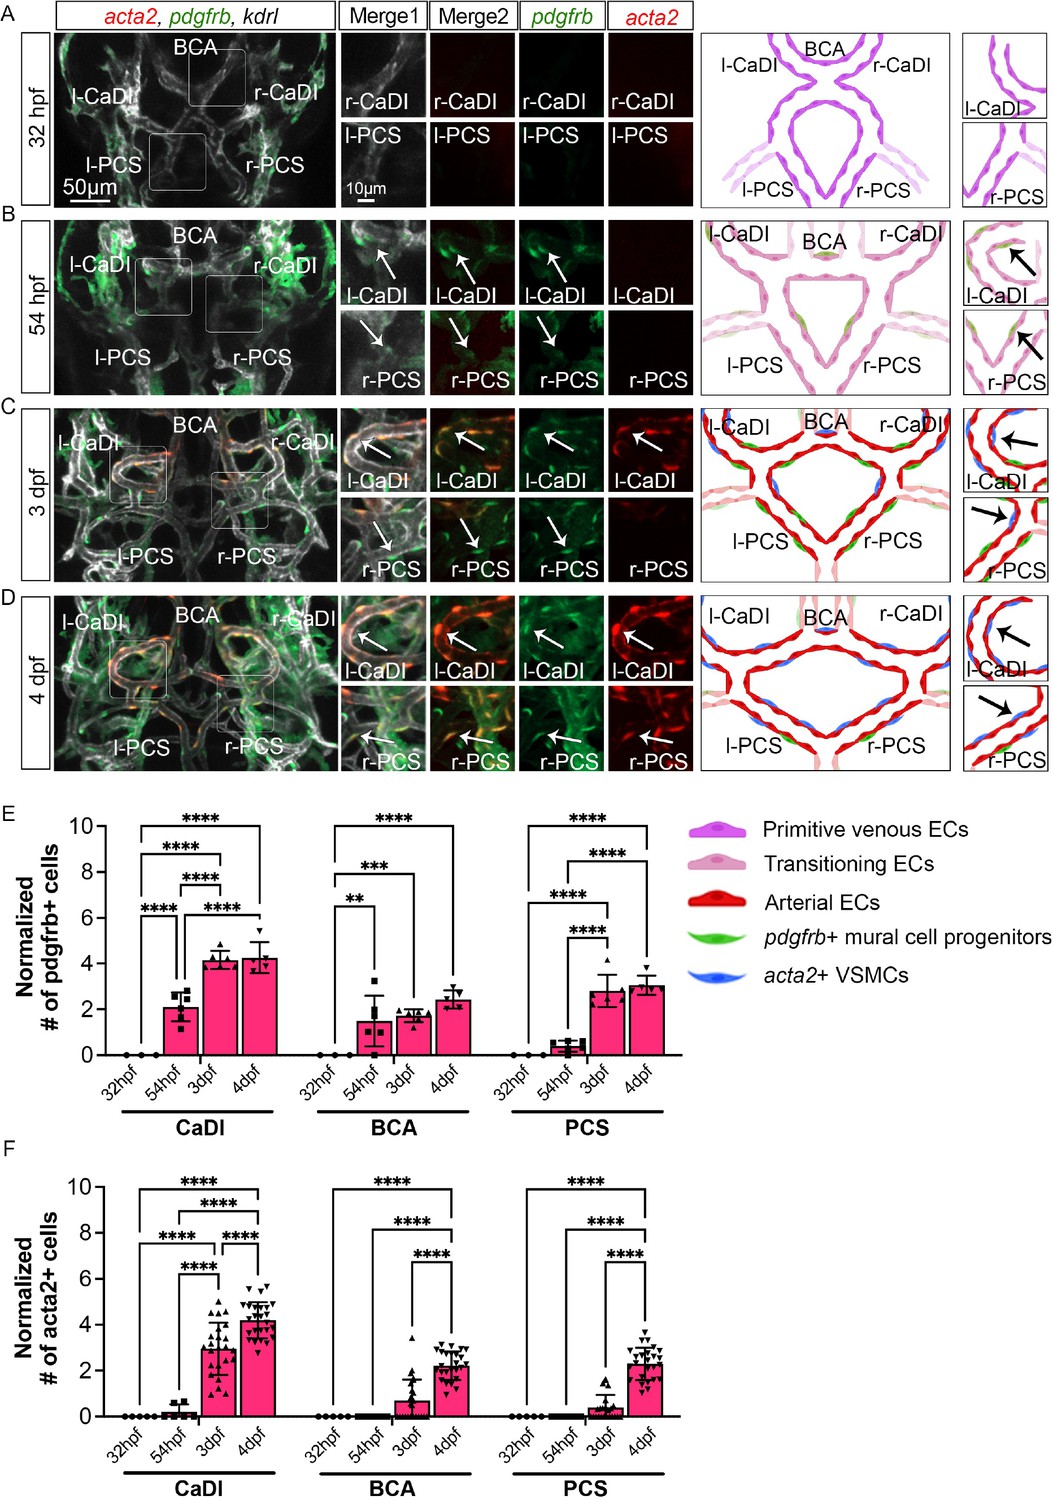
Vascular smooth muscle cell (VSMC) differentiation on circle of Willis (CoW) arteries.
(A–D) Confocal live images of CoW arteries in Tg(acta2:mcherry, kdrl:cerulean)ca8/sd24 TgBAC(pdgfrb:egfp)ncv22 and scheme representation of vascular endothelium and mural cells on CoW arteries in zebrafish brain at 32 hours post fertilization (hpf) (A), 54 hpf (B), 3 days post fertilization (dpf) (C), and 4 dpf (D). White channel represents kdrl:cerulean fluorescence, red channel represents acta2:mcherry, green channel represents pdgfrb:egfp, merge 1 panel combines all three channels, merge 2 combines acta2:mcherry in red and pdgfrb:egfp in green. Arrows point to the CoW arteries with pdgfrb:egfp and acta2:mcherry signal. Scale bar = 50 μm. (E) Number of pdgfrb+ vascular mural cell progenitors per 100 μm vessel length on caudal division of internal carotid arteries (CaDI), basal communicating artery (BCA), and posterior communicating segments (PCS) at 32 hpf (n=3, 1 independent experiment), 54 hpf (n=6, 1 independent experiment), 3 dpf (n=6, 1 independent experiment), and 4 dpf (n=5, 1 independent experiment), two-way analysis of variance (ANOVA) followed by Tukey’s multiple comparisons, represented with mean ± SD, **p≤0.01, ***p≤0.001, ****p≤0.0001. (F) Number of acta2+ VSMCs per 100 μm vessel length on CaDI, BCA, and PCS at 32 hpf (n=5, 1 independent experiment), 54 hpf (n=6, 2 independent experiments), 3 dpf (n=24, 6 independent experiments), and 4 dpf (n=25, 6 independent experiments), two-way ANOVA followed by Tukey’s multiple comparisons, represented with mean ± SD, ****p≤0.0001. Abbreviations: hpf: hour post fertilization, dpf: day post fertilization, EC: endothelial cell, VSMC: vascular smooth muscle cell, l-CaDI: left caudal division of internal carotid artery, r-CaDI: right caudal division of internal carotid artery, BCA: basal communicating artery, l-PCS: left posterior communicating segment, r-PCS: right posterior communicating segment.
-
Figure 2—source data 1
Source data for number of pdgfrb+ vascular mural cell progenitors and acta2+ vascular smooth muscle cells (VSMCs) in Figure 2E and F.
- https://cdn.elifesciences.org/articles/94094/elife-94094-fig2-data1-v1.xlsx
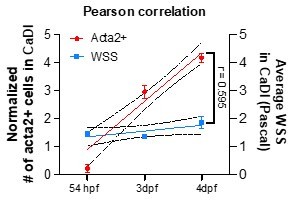
Figure 2—figure supplement 1
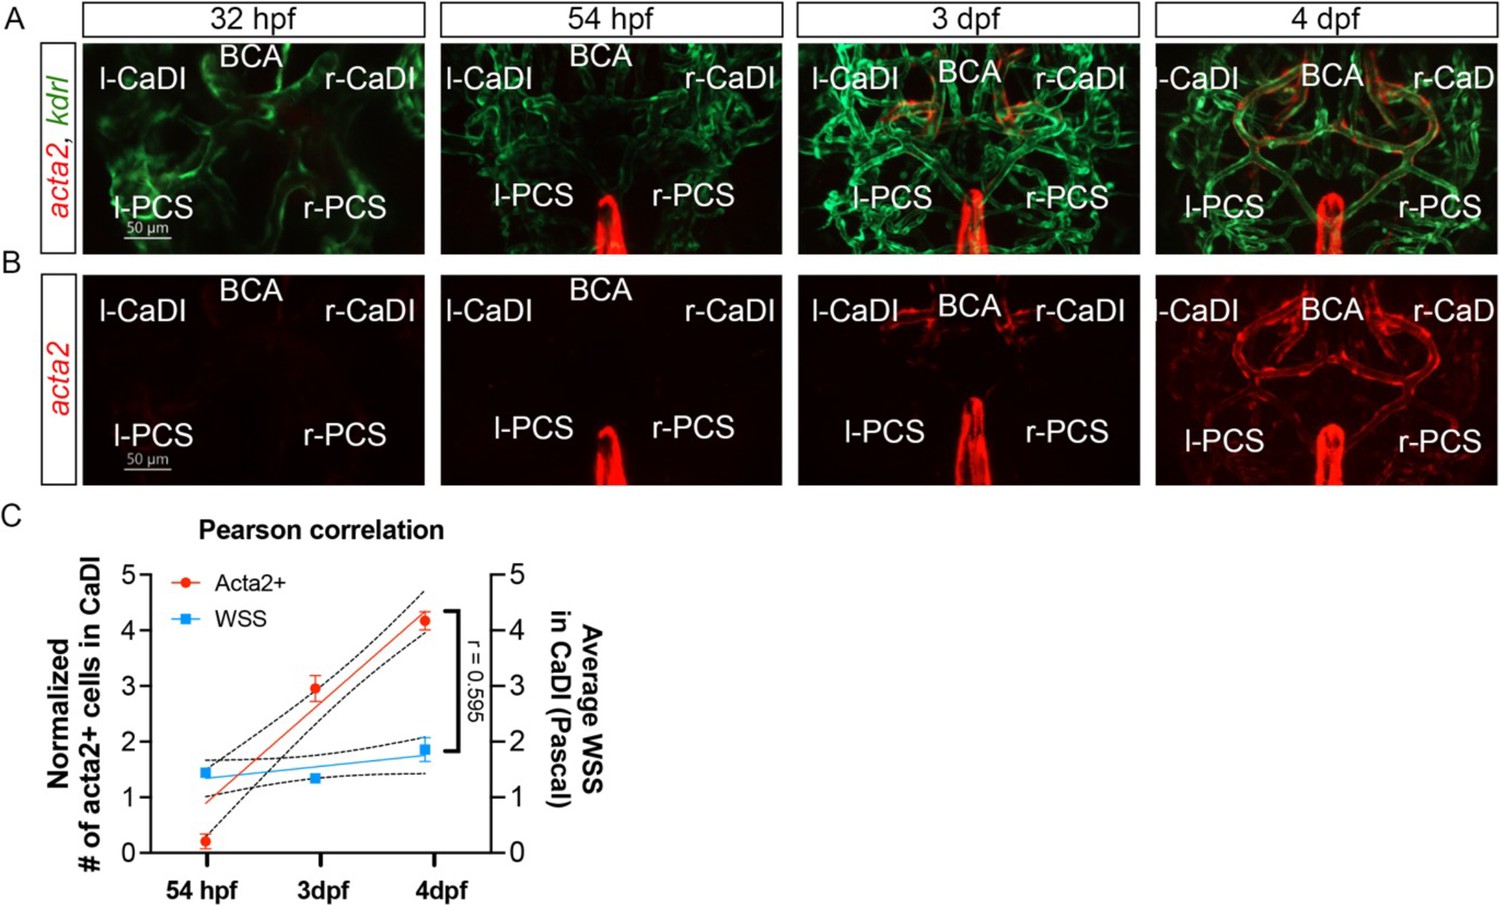
Vascular smooth muscle cell (VSMC) differentiation on circle of Willis (CoW) arteries.
(A–B) Confocal live images of CoW arteries in Tg(acta2:mcherry, kdrl:gfp)ca8/zn1 zebrafish brain at 32 hours post fertilization (hpf), 54 hpf, 3 days post fertilization (dpf), and 4 dpf. Red channel represents acta2:mcherry, green channel represents kdrl:gfp, and merge panel combines both channels. Scale bar = 50 μm. (C) Linear regression between normalized # acta2+ cells on CaDI (left y-axis, 54 hpf n=6, 3 dpf n=24, and 4 dpf n=25) and average wall shear stress (WSS) in CaDI (right y-axis, for each stage n=3) at different developmental stages (54 hpf, 3 dpf, and 4 dpf, x-axis), and Pearson correlation coefficient (r) is provided, indicating the degree of linear relationship between two variables with 95% confidence interval. Abbreviations: hpf: hour post fertilization, dpf: day post fertilization, l-CaDI: left caudal division of internal carotid artery, r-CaDI: right caudal division of internal carotid artery, BCA: basal communicating artery, l-PCS: left posterior communicating segment, r-PCS: right posterior communicating segment.
Figure 3
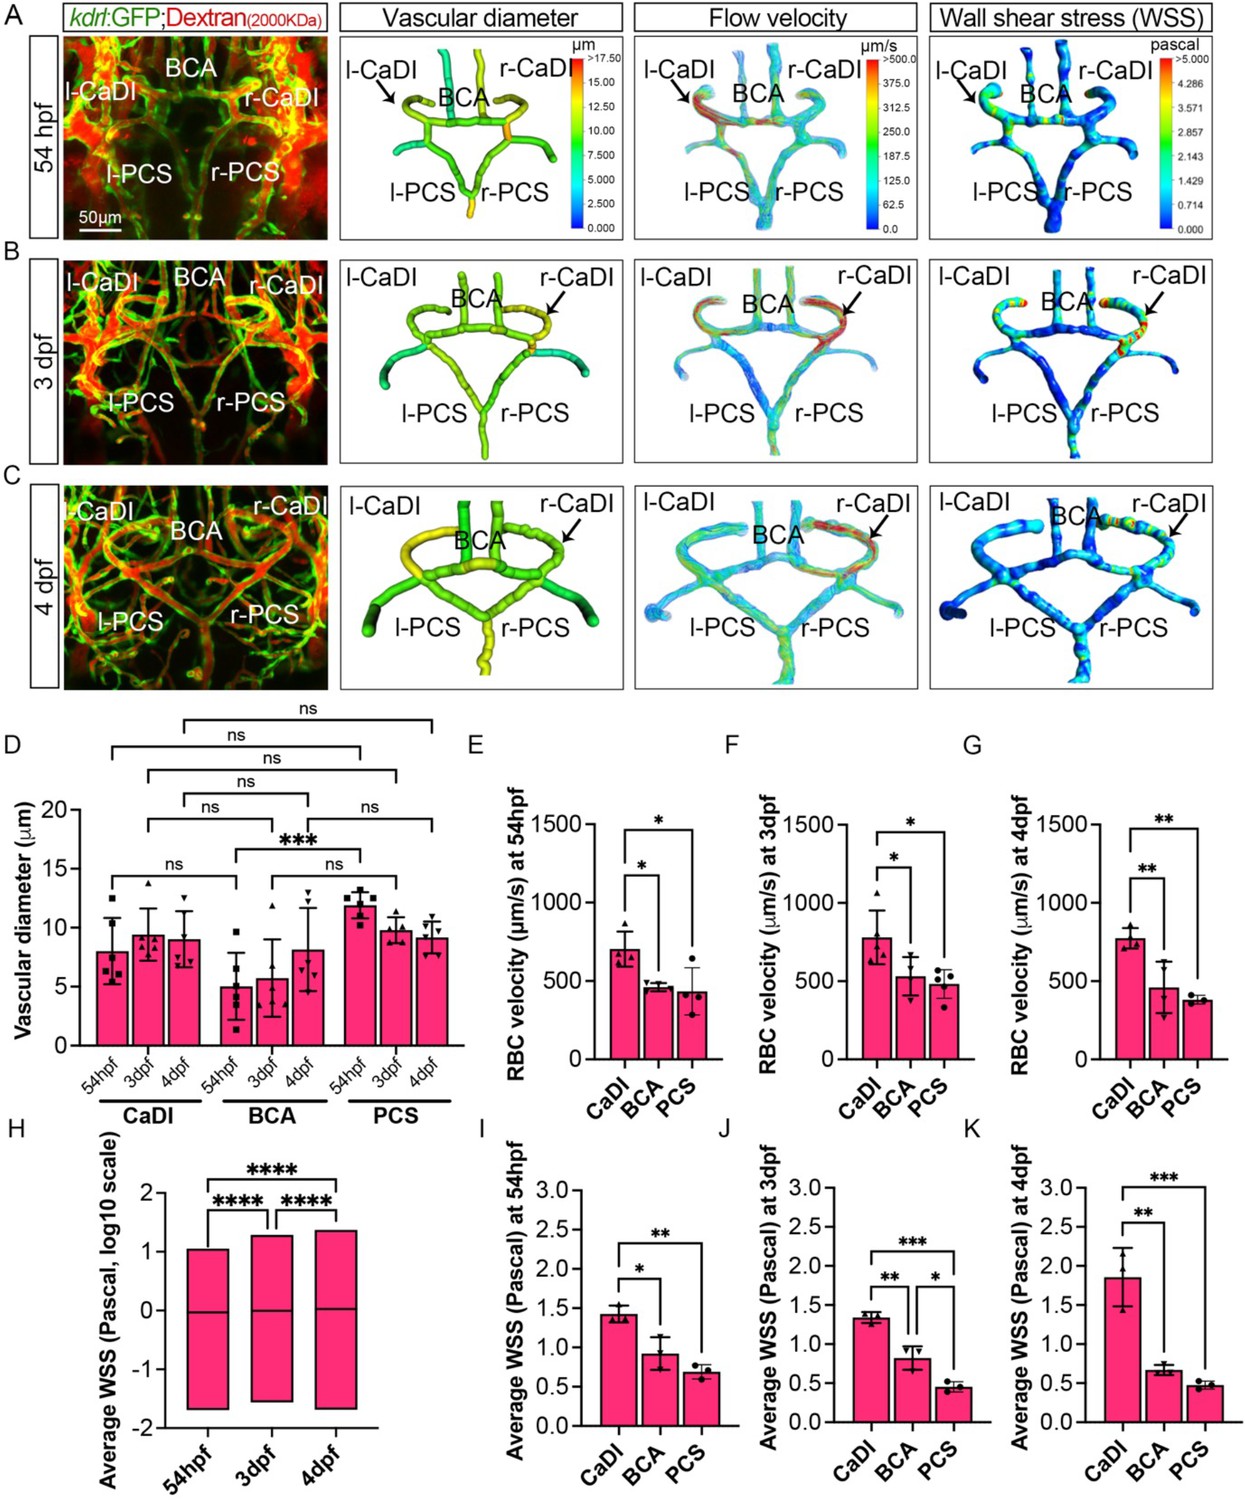
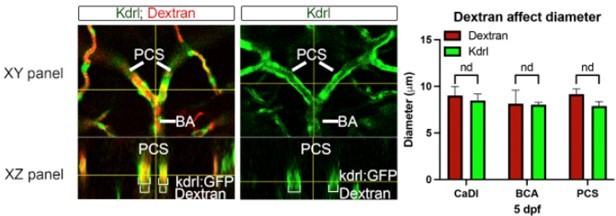
Computational fluid dynamic (CFD) simulation of circle of Willis (CoW) arteries.
(A–C) Confocal live images of CoW arteries in Tg(kdrl:gfp)zn1 injected with dextran and representation of vascular diameter, CFD simulated flow, and wall shear stress (WSS) at 54 hours post fertilization (hpf) (A), 3 days post fertilization (dpf) (B), and 4 dpf (C). Arrows point to CoW arteries with high flow velocity and WSS. Scale bar = 50 μm. (D) Average vascular diameter in caudal division of internal carotid arteries (CaDI), basal communicating artery (BCA), and posterior communicating segments (PCS) at 54 hpf (n=6, 1 independent experiment), 3 dpf (n=6, 1 independent experiment), and 4 dpf (n=6, 1 independent experiment), two-way analysis of variance (ANOVA) followed by Tukey’s multiple comparisons, ***p≤0.001. (E–G) Red blood cell (RBC) velocity in CaDI, BCA, and PCS at 54 hpf (n=4, 1 independent experiment) (E), 3 dpf (n=5, 1 independent experiment) (F), and 4 dpf (n=4, 1 independent experiment) (G), ordinary one-way ANOVA with Tukey’s multiple comparisons, represented with mean ± SD, *p≤0.05, **p≤0.01. (H) Average WSS throughout CoW arteries at 54 hpf (n=3 independent CFD simulation on CoW geometry), 3 dpf (n=3), and 4 dpf (n=3), ordinary one-way ANOVA with Tukey’s multiple comparisons, ****p≤0.0001. (I–K) Average WSS in CaDI, BCA, and PCS at 54 hpf (n=3) (I), 3 dpf (n=3) (J), and 4 dpf (n=3) (K), ordinary one-way ANOVA with Tukey’s multiple comparisons, represented with mean ± SD, *p≤0.05, **p≤0.01, ***p≤0.001. Abbreviations: hpf: hour post fertilization, dpf: day post fertilization, RBC: red blood cell, WSS: wall shear stress, l-CaDI: left caudal division of internal carotid artery, r-CaDI: right caudal division of internal carotid artery, BCA: basal communicating artery, l-PCS: left posterior communicating segment, r-PCS: right posterior communicating segment.
-
Figure 3—source data 1
Source data for vascular diameter, red blood cell (RBC) velocity, and wall shear stress in Figure 3D–K.
- https://cdn.elifesciences.org/articles/94094/elife-94094-fig3-data1-v1.xlsx
Figure 4 with 1 supplement
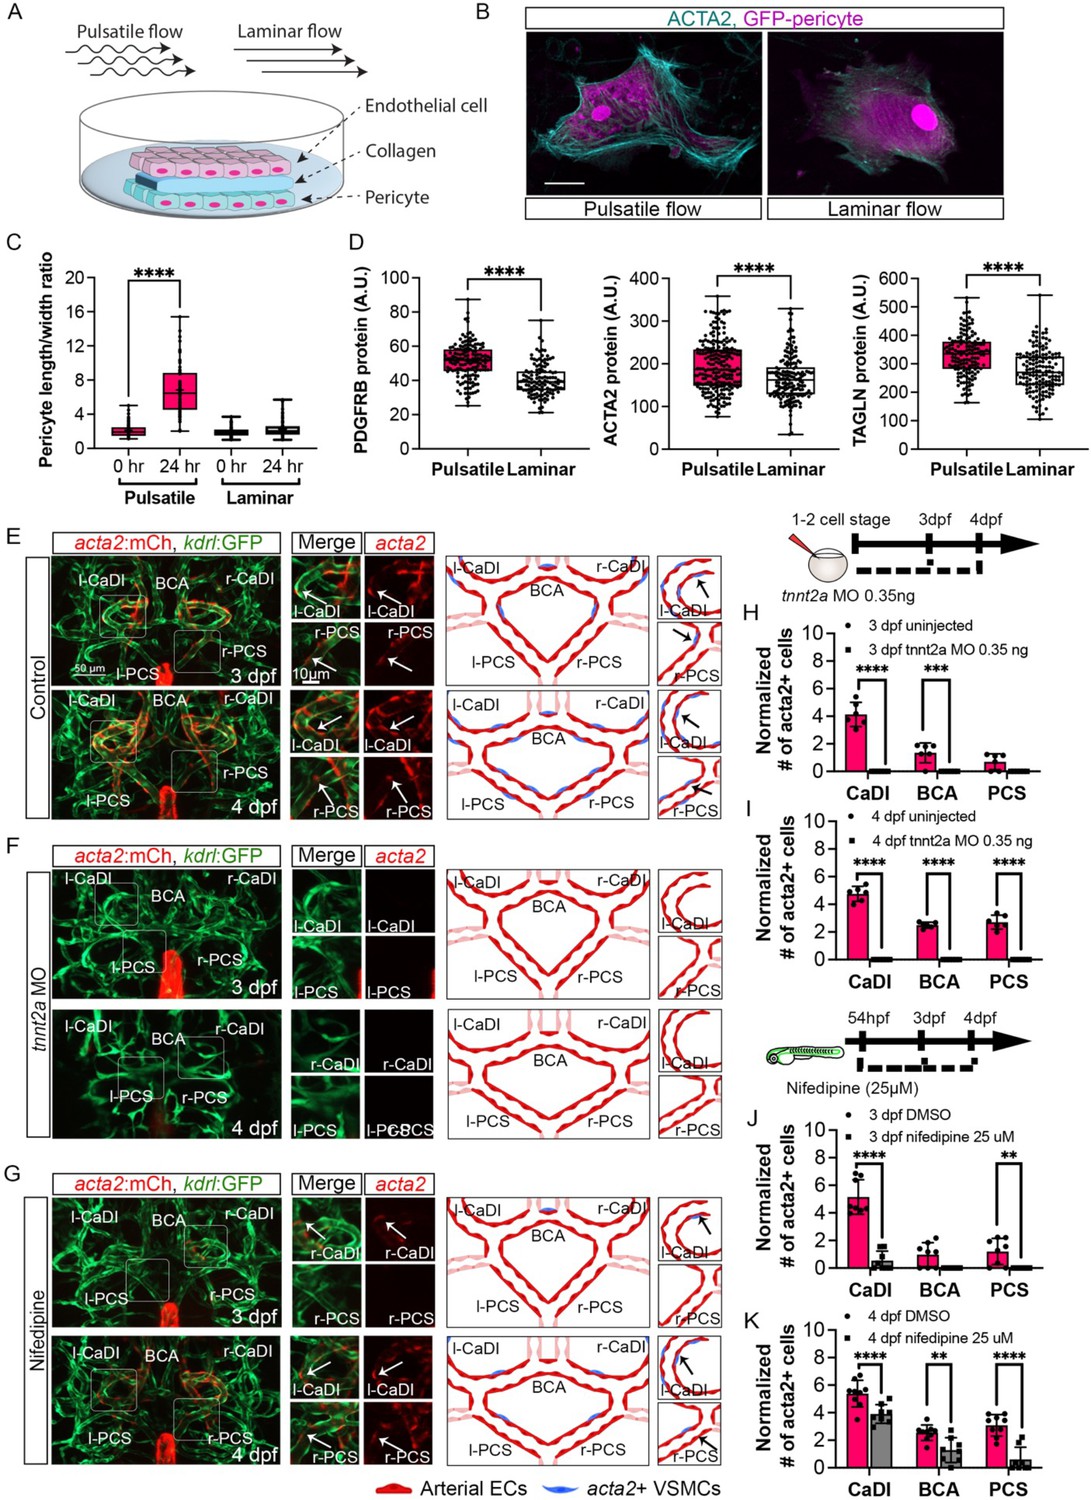
Blood flow is required for vascular smooth muscle cell (VSMC) differentiation on circle of Willis (CoW) arteries.
(A) Scheme representation of in vitro cell co-culture experiment. (B) Representative immunofluorescence images of brain pericytes after exposure of pulsative flow and laminar flow. Cells were stained for ACTA2 (cyan) and cytosolic GFP label (magenta). Scale bar = 10 μm. (C) Morphological measurement of brain pericyte length/width ratio before and after exposure of pulsative flow and laminar flow (n=63 cells), two-tailed Mann–Whitney test, represented with mean ± SD, ****p≤0.0001. (D) Protein level of PDGFRB (n=153 cells), ACTA2 (n=222 cells), and TAGLN (n=150 cells) in arbitrary unit (A.U.) after exposure of pulsative flow and laminar flow, two-tailed Mann–Whitney test, represented with mean ± SD, ****p≤0.0001. (E–G) Confocal live images of CoW arteries in Tg(acta2:mcherry; kdrl:gfp)ca8/zn1 and scheme representation of vascular endothelium and VSMCs on CoW arteries at 3 days post fertilization (dpf) and 4 dpf in control embryos (E), embryos injected with 0.35 ng tnnt2a morpholino (MO) (F), and embryos treated with 25 μM nifedipine from 54 hpf (G). Red channel represents acta2:mcherry, green channel represents kdrl:gfp, and merge panel combines both channels. Arrows point to the CoW arteries with acta2:mcherry signal. Scale bar = 50 μm. (H) Number of acta2+ VSMCs per 100 μm vessel length on caudal division of internal carotid arteries (CaDI), basal communicating artery (BCA), and posterior communicating segments (PCS) at 3 dpf in uninjected control (n=6, 1 independent experiment) and embryos injected with 0.35 ng tnnt2a MO at one- to two-cell stage (n=6, 1 independent experiment), two-tailed Mann–Whitney test on each vessel’s comparison, represented with mean ± SD, ***p≤0.001, ****p≤0.0001. (I) Number of acta2+ VSMCs per 100 μm vessel length on CaDI, BCA, and PCS at 4 dpf in uninjected control (n=6, 1 independent experiment) and embryos injected with 0.35 ng tnnt2a MO at one- to two-cell stage (n=6, 1 independent experiment), two-tailed Mann–Whitney test on each vessel’s comparison, represented with mean ± SD, ****p≤0.0001. (J) Number of acta2+ VSMCs per 100 μm vessel length on CaDI, BCA, and PCS at 3 dpf in dimethyl sulfoxide (DMSO) control (n=8, 2 independent experiments) and embryos treated with 25 μM nifedipine from 54 hpf (n=8, 2 independent experiments), two-tailed Mann–Whitney test on each vessel’s comparison, represented with mean ± SD, **p≤0.01, ****p≤0.0001. (K) Number of acta2+ VSMCs per 100 μm vessel length on CaDI, BCA, and PCS at 4 dpf in DMSO control (n=9, 2 independent experiments) and embryos treated with 25 μM nifedipine from 54 hpf (n=8, 2 independent experiments), two-tailed Mann–Whitney test on each vessel’s comparison, represented with mean ± SD, **p≤0.01, ****p≤0.0001. Abbreviations: hpf: hour post fertilization, dpf: day post fertilization, EC: endothelial cell, VSMC: vascular smooth muscle cell, MO: morpholino, l-CaDI: left caudal division of internal carotid artery, r-CaDI: right caudal division of internal carotid artery, BCA: basal communicating artery, l-PCS: left posterior communicating segment, r-PCS: right posterior communicating segment.
-
Figure 4—source data 1
Source data for brain pericyte length/width ratio, proteins level, and acta2+ vascular smooth muscle cells (VSMCs) number in Figure 4C–D and H–K.
- https://cdn.elifesciences.org/articles/94094/elife-94094-fig4-data1-v1.xlsx
Figure 4—figure supplement 1
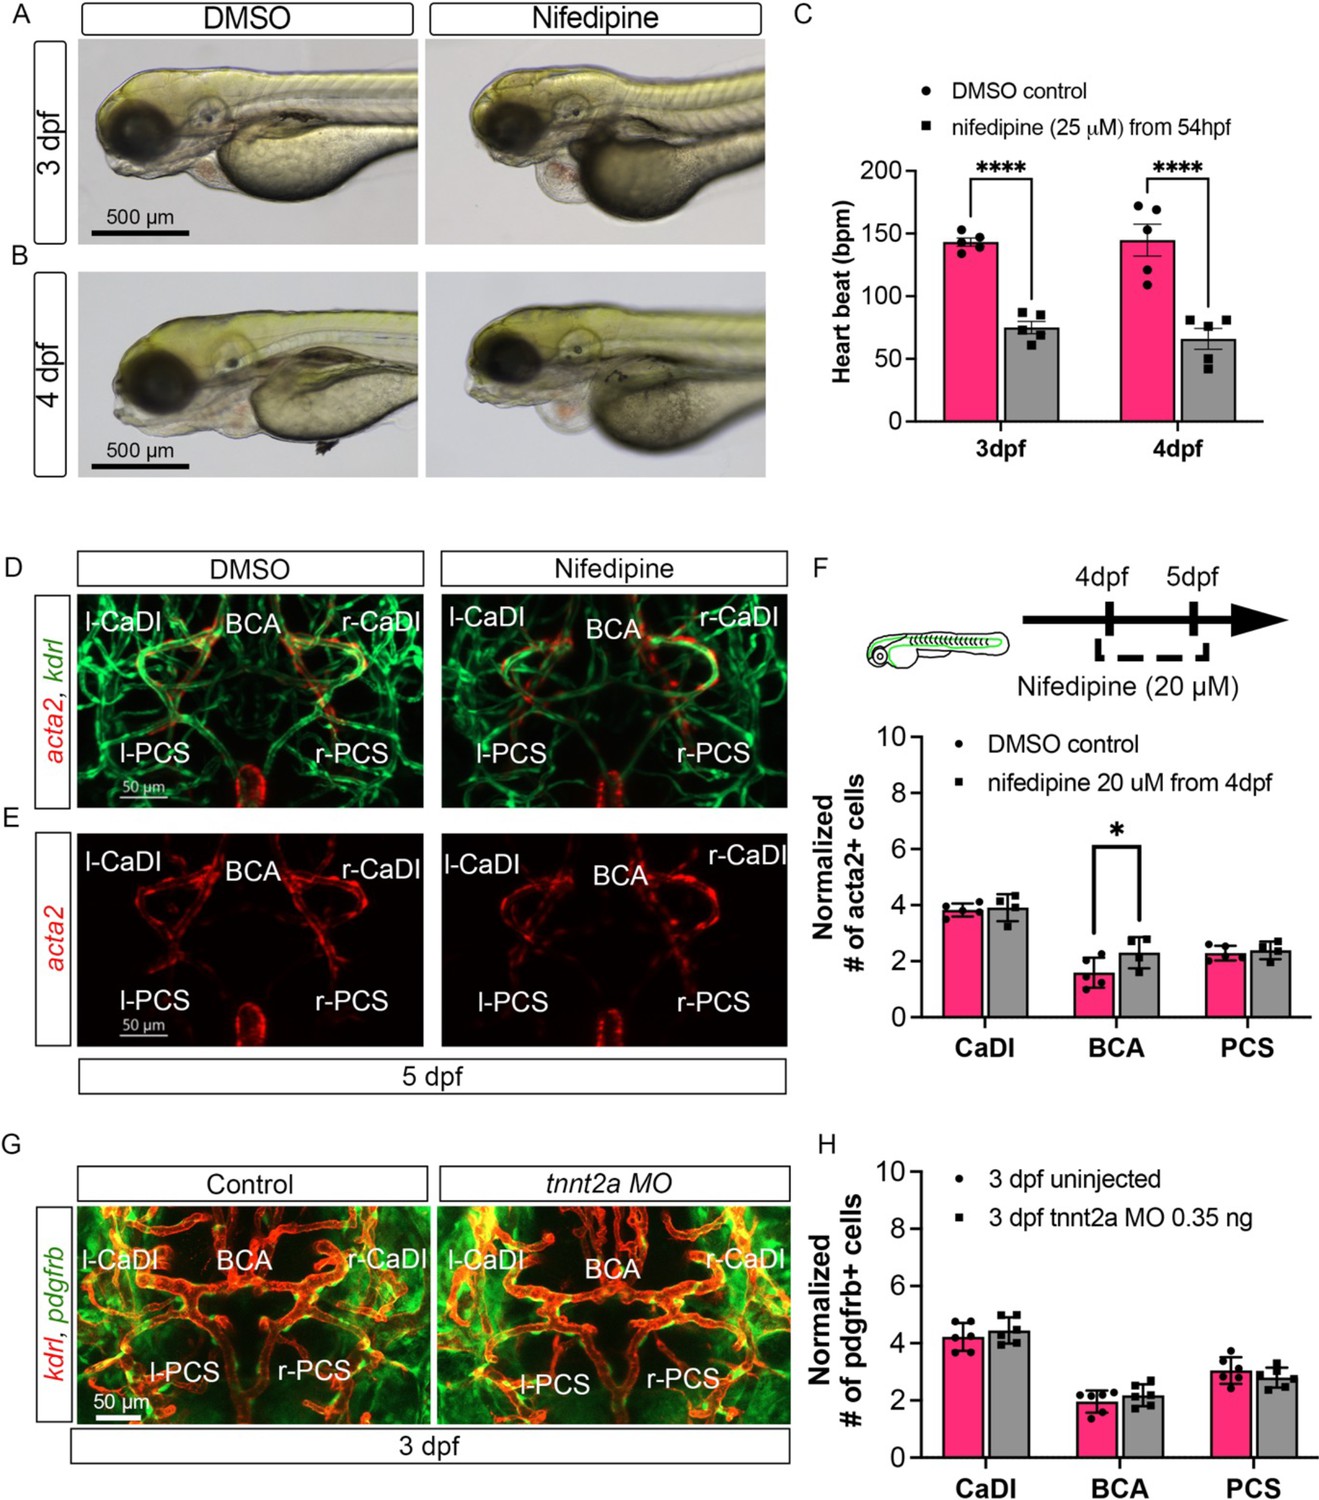
Blood flow is not required for vascular smooth muscle cell (VSMC) short-term maintenance or pdgfrb+ mural cell progenitor recruitment on circle of Willis (CoW) arteries.
(A–B) Bright-field images of Tg(acta2:mcherry; kdrl:gfp)ca8/zn1 control embryos treated with dimethyl sulfoxide (DMSO) and embryos treated with 25 μM nifedipine from 54 hours post fertilization (hpf) at 3 days post fertilization (dpf) (A) and 4 dpf (B). Scale bar = 500 μm. (C) Quantitative heartbeat rate at 3 dpf and 4 dpf in DMSO control embryos and embryos treated with 25 μM nifedipine from 54 hpf (n=5 each group, 2 independent experiments), two-tailed Mann–Whitney test on each vessel’s comparison, represented with mean ± SD, ****p≤0.0001. (D–E) Confocal live images of CoW arteries in Tg(acta2:mcherry; kdrl:gfp)ca8/zn1 zebrafish brain at 5 dpf in DMSO control embryos and embryos treated with 20 μM nifedipine from 4 dpf. Red channel represents acta2:mcherry, green channel represents kdrl:gfp, and merge panel combines both channels. Scale bar = 50 μm. (F) Number of acta2+ VSMCs per 100 μm vessel length on caudal division of internal carotid arteries (CaDI), basal communicating artery (BCA), and posterior communicating segments (PCS) at 5 dpf in DMSO control (n=5, 1 independent experiment) and embryos treated with 20 μM nifedipine from 4 dpf (n=4, 1 independent experiment), two-tailed Mann–Whitney test on each vessel’s comparison, represented with mean ± SD, *p≤0.05. (G) Confocal live images of CoW arteries in Tg(pdgfrb:egfp, kdrl:ras-mcherry)ncv22/s896 labeling vascular endothelium and pdgfrb+ vascular mural cell progenitors in zebrafish brain at 3 dpf. Red channel represents kdrl:ras-mcherry, green channel represents pdgfrb:egfp, and merge panel combines both channels. Scale bar = 50 μm. (H) Number of pdgfrb+ vascular mural cell progenitors per 100 μm vessel length on CaDI, BCA, and PCS at 3 dpf in control embryos and embryos injected with 0.35 ng tnnt2a morpholino (MO) (n=6, 1 independent experiment), two-tailed Mann–Whitney test on each vessel’s comparison, represented with mean ± SD. Abbreviations: hpf: hour post fertilization, dpf: day post fertilization, MO: morpholino, l-CaDI: left caudal division of internal carotid artery, r-CaDI: right caudal division of internal carotid artery, BCA: basal communicating artery, l-PCS: left posterior communicating segment, r-PCS: right posterior communicating segment.
-
Figure 4—figure supplement 1—source data 1
Source data for heartbeat rate and number of pdgfrb+ vascular mural cell progenitors in Figure 4—figure supplement 1C and H.
- https://cdn.elifesciences.org/articles/94094/elife-94094-fig4-figsupp1-data1-v1.xlsx
Figure 5 with 1 supplement
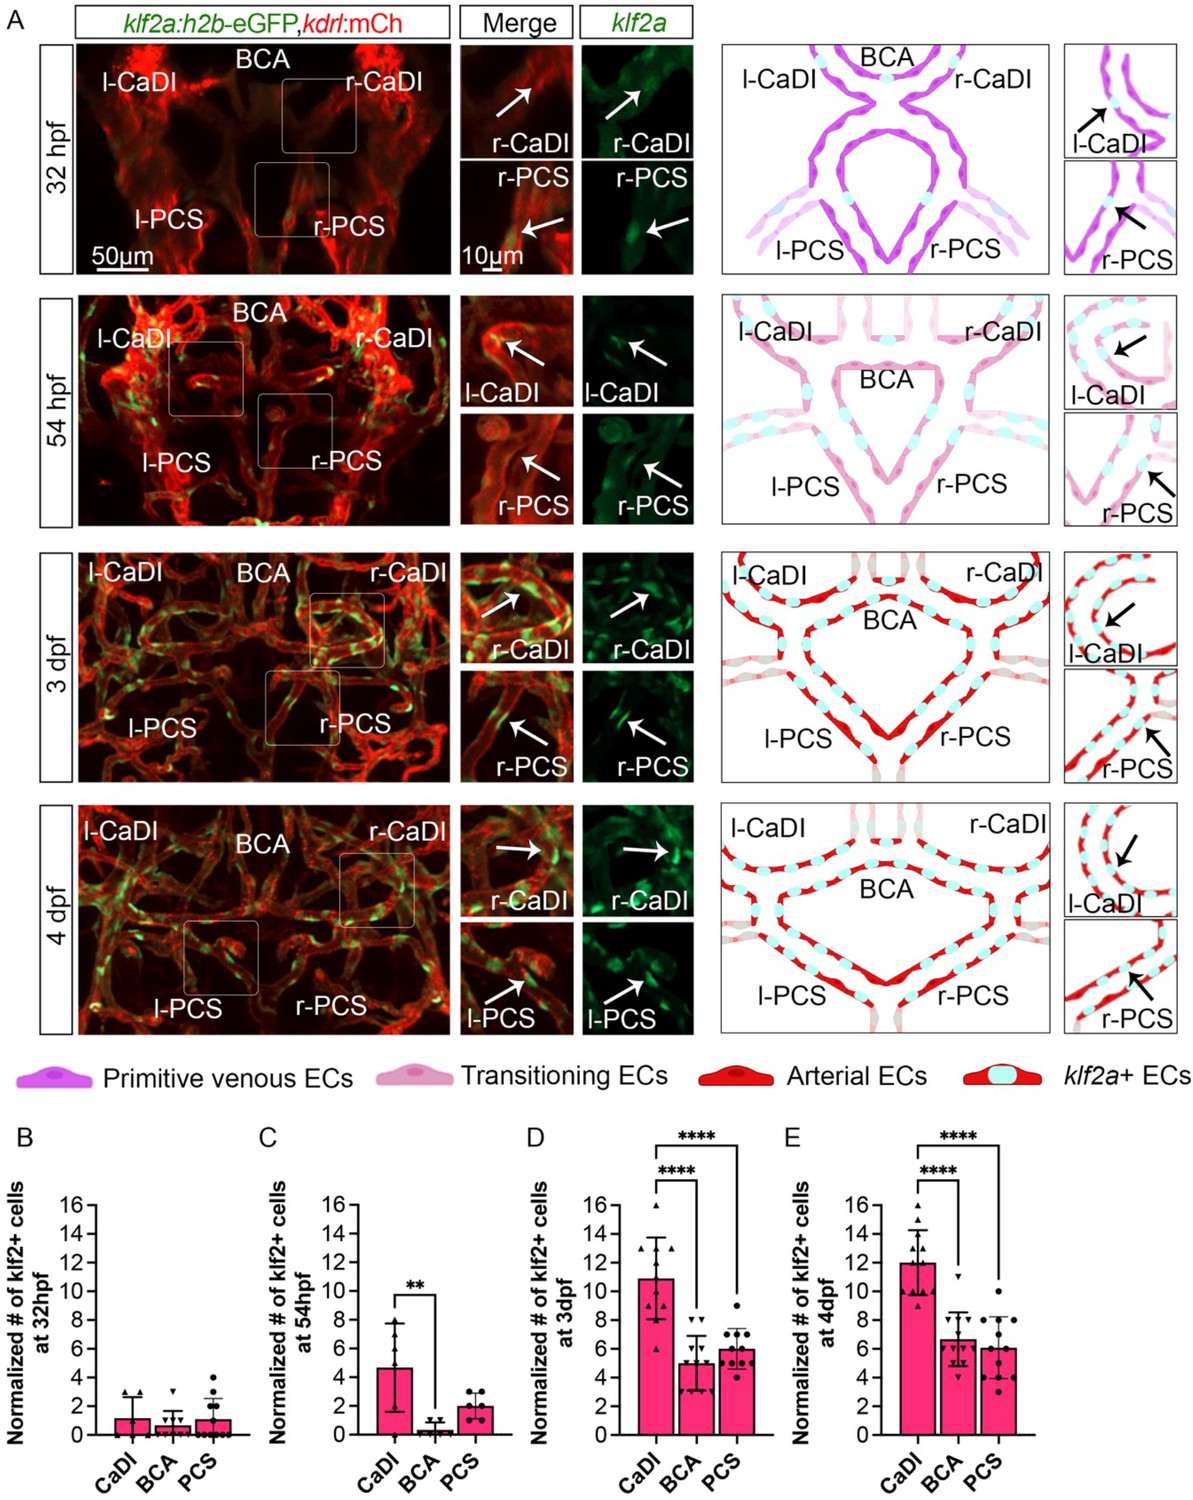
Blood flow-regulated transcription factor klf2a is expressed in circle of Willis (CoW) arteries.
(A) Confocal live images of CoW arteries in Tg(klf2a:h2b-gfp, kdrl:ras-mcherry)ig11/s896 and scheme representation of endothelial cells (ECs) in CoW arteries at 32 hours post fertilization (hpf), 54 hpf, 3 days post fertilization (dpf), and 4 dpf. Green channel represents klf2a:h2b-gfp, red channel represents kdrl:ras-mcherry, and merge panel combines both channels. Arrows point to the CoW arteries with klf2a:h2b-gfp signal. Scale bar = 50 μm. (B–E) Number of klf2a+ ECs per 100 μm vessel length on caudal division of internal carotid arteries (CaDI), basal communicating artery (BCA), and posterior communicating segments (PCS) at 32 hpf (n=6, 3 independent experiments) (B), 54 hpf (n=6, 2 independent experiments) (C), 3 dpf (n=11, 3 independent experiments) (D), and 4 dpf (n=12, 3 independent experiments) (E), ordinary one-way analyses of variance with Tukey’s multiple comparisons, represented with mean ± SD, **p≤0.01, ****p≤0.0001. Abbreviations: hpf: hour post fertilization, dpf: day post fertilization, EC: endothelial cell, l-CaDI: left caudal division of internal carotid artery, r-CaDI: right caudal division of internal carotid artery, BCA: basal communicating artery, l-PCS: left posterior communicating segment, r-PCS: right posterior communicating segment.
-
Figure 5—source data 1
Source data for number of klf2a+ endothelial cells (ECs) in Figure 5B–E.
- https://cdn.elifesciences.org/articles/94094/elife-94094-fig5-data1-v1.xlsx
Figure 5—figure supplement 1
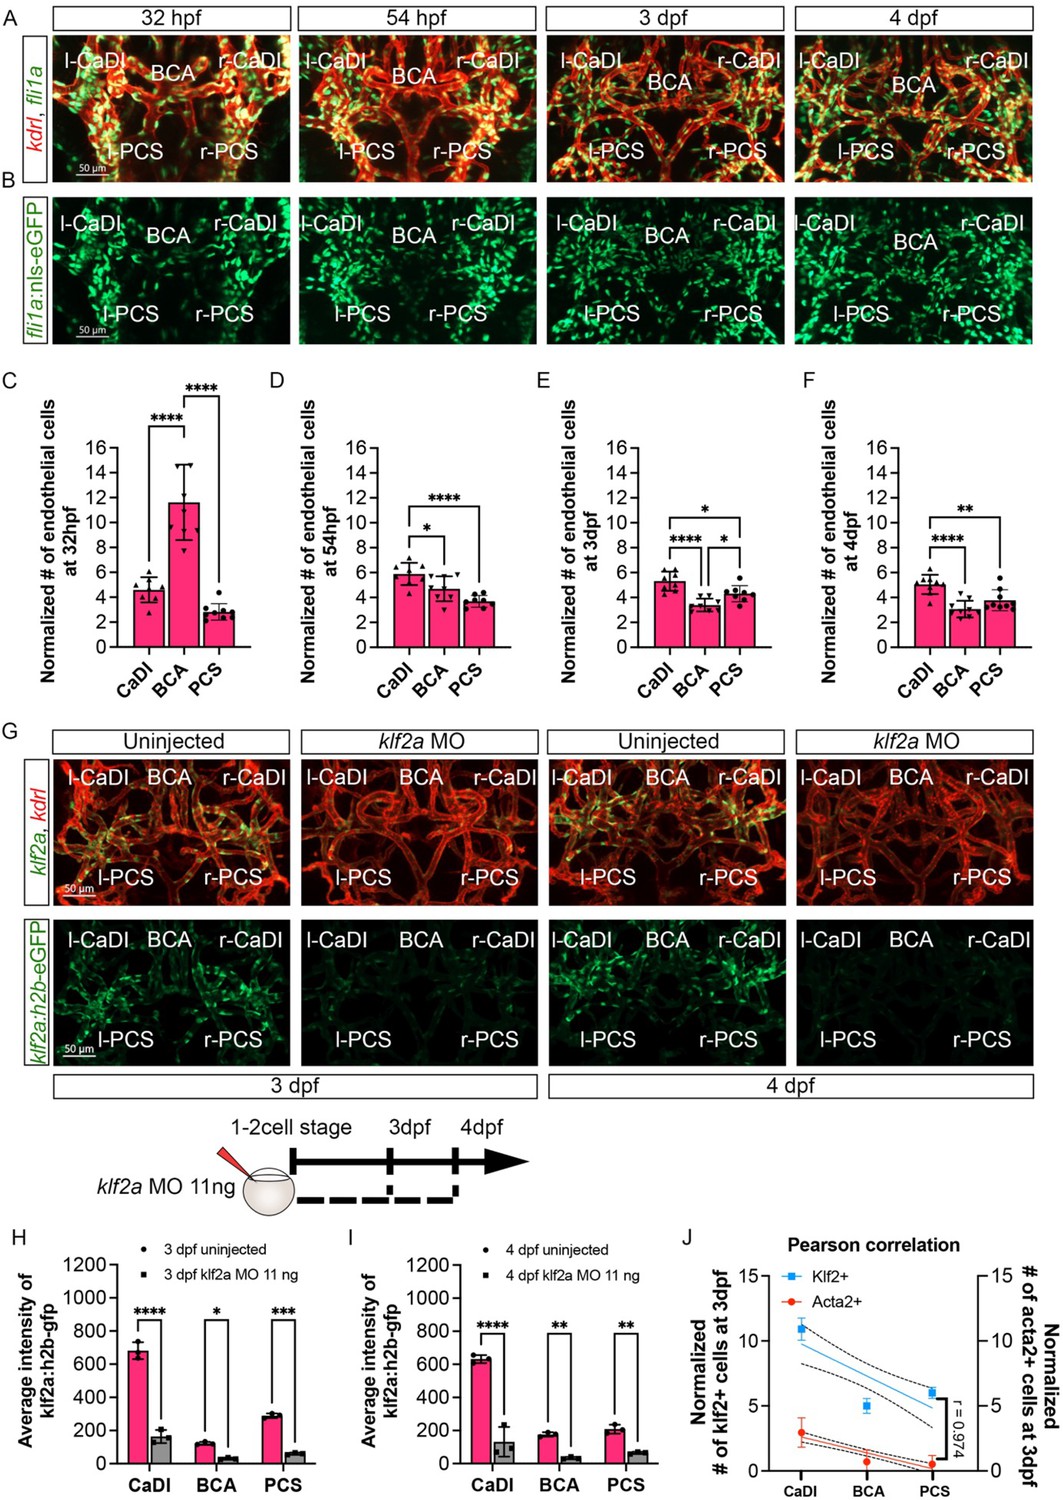
Number of endothelial cells (ECs) in circle of Willis (CoW) arteries does not increase significantly during klf2a activation.
(A–B) Confocal live images of CoW arteries in Tg(fli1:nls-gfp, kdrl:ras-mcherry)y7/s896 zebrafish brain at 32 hours post fertilization (hpf), 54 hpf, 3 days post fertilization (dpf), and 4 dpf. Red channel represents kdrl:ras-mcherry, green channel represents fli1:nls-gfp, and merge panel combines both channels. Scale bar = 50 μm. (C–F) Number of ECs per 100 μm vessel length on caudal division of internal carotid arteries (CaDI), basal communicating artery (BCA), and posterior communicating segments (PCS) at 32 hpf (n=9, 1 independent experiment) (C), 54 hpf (n=8, 1 independent experiment) (D), 3 dpf (n=8, 1 independent experiment) (E), and 4 dpf (n=9, 1 independent experiment) (F), ordinary one-way analyses of variance (ANOVA) with Tukey’s multiple comparisons, represented with mean ± SD, *p≤0.05, **p≤0.01, ****p≤0.0001. (G) Confocal live images of CoW arteries in Tg(klf2a:h2b-gfp, kdrl:ras-mcherry)ig11/s896 zebrafish brain at 3 dpf and 4 dpf in uninjected control and embryos injected with 11 ng of klf2a morpholino (MO). Red channel represents kdrl:ras-mcherry and green channel represents klf2a:h2b-gfp, and merge panel combines both channels. Scale bar = 50 μm. (H) Average intensity of klf2a:h2b-gfp in CaDI, BCA, and PCS at 3 dpf in uninjected control (n=3, 1 independent experiment) and embryos injected with 11 ng of klf2a MO (n=3, 1 independent experiment), two-tailed Mann–Whitney test on each vessel’s comparison, represented with mean ± SD, *p≤0.05, ***p≤0.001, ****p≤0.0001. (I) Average intensity of klf2a:h2b-gfp in CaDI, BCA, and PCS at 4 dpf in uninjected control (n=3, 1 independent experiment) and embryos injected with 11 ng of klf2a MO (n=3, 1 independent experiment), two-tailed Mann–Whitney test on each vessel’s comparison, represented with mean ± SD, **p≤0.01, ****p≤0.0001. (J) Linear regression between normalized # klf2a+ cells at 3 dpf (left y-axis, n=11 from 3 independend experiments) and normalized # acta2+ cells (right y-axis, n=24 from 6 independend experiments) on different CoW arteries (CaDI, BCA, and PCS, x-axis), and Pearson correlation coefficient (r) is provided, indicating the degree of linear relationship between two variables with 95% confidence interval. Abbreviations: hpf: hour post fertilization, dpf: day post fertilization, MO: morpholino, l-CaDI: left caudal division of internal carotid artery, r-CaDI: right caudal division of internal carotid artery, BCA: basal communicating artery, l-PCS: left posterior communicating segment, r-PCS: right posterior communicating segment.
-
Figure 5—figure supplement 1—source data 1
Source data for number of endothelial cells (ECs) and average intensity of klf2a:h2b-gfp in Figure 5—figure supplement 1C–F and H–I.
- https://cdn.elifesciences.org/articles/94094/elife-94094-fig5-figsupp1-data1-v1.xlsx
Figure 6
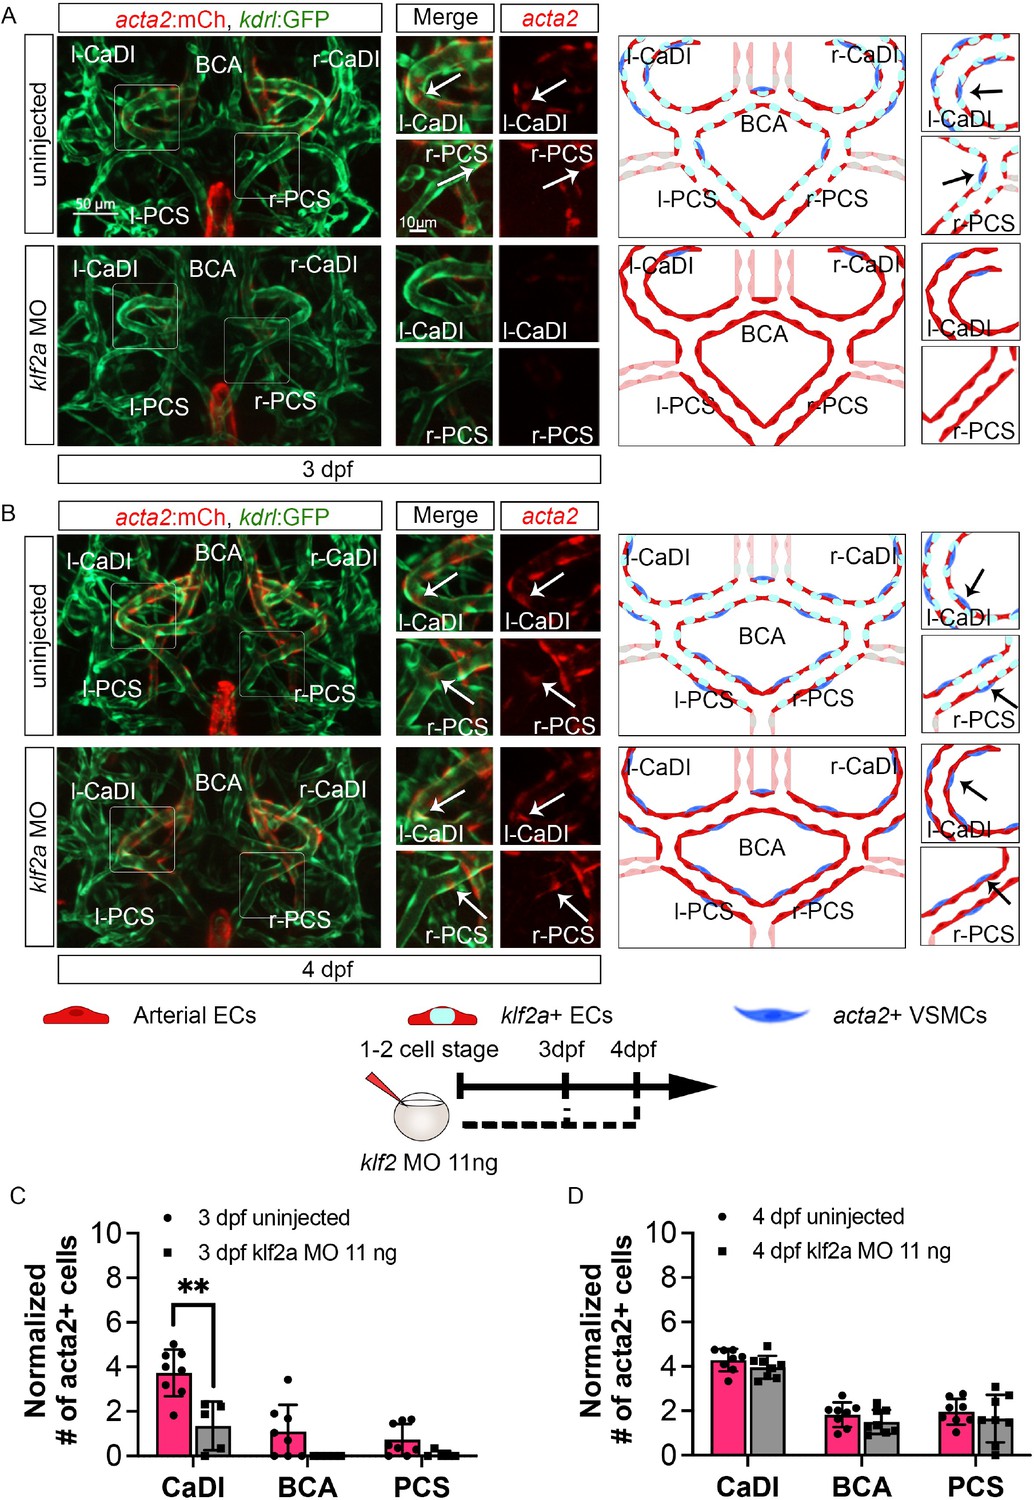
klf2a promotes vascular smooth muscle cell (VSMC) differentiation on anterior circle of Willis (CoW) arteries.
(A–B) Confocal live images of CoW arteries in Tg(acta2:mcherry; kdrl:gfp)ca8/zn1 and scheme representation of vascular endothelium and VSMCs on CoW arteries at 3 days post fertilization (dpf) (A) and 4 dpf (B) in uninjected control embryos and embryos injected with 11 ng klf2a morpholino (MO). Red channel represents acta2:mcherry, green channel represents kdrl:gfp, and merge panel combines both channels. Arrows point to the CoW arteries with acta2:mcherry signal. Scale bar = 50 μm. (C) Number of acta2+ VSMCs per 100 μm vessel length on caudal division of internal carotid arteries (CaDI), basal communicating artery (BCA), and posterior communicating segments (PCS) at 3 dpf in uninjected control (n=8, 2 independent experiments) and embryos injected with 11 ng klf2a MO at one- to two-cell stage (n=5, 2 independent experiments), two-tailed Mann–Whitney test on each vessel’s comparison, represented with mean ± SD, **p≤0.01. (D) Number of acta2+ VSMCs per 100 μm vessel length on CaDI, BCA, and PCS at 4 dpf in uninjected control (n=8, 3 independent experiments) and embryos injected with 11 ng klf2a MO at one- to two-cell stage (n=8, 3 independent experiments), two-tailed Mann–Whitney test on each vessel’s comparison, represented with mean ± SD. Abbreviations: hpf: hour post fertilization, dpf: day post fertilization, EC: endothelial cell, VSMC: vascular smooth muscle cell, MO: morpholino, l-CaDI: left caudal division of internal carotid artery, r-CaDI: right caudal division of internal carotid artery, BCA: basal communicating artery, l-PCS: left posterior communicating segment, r-PCS: right posterior communicating segment.
-
Figure 6—source data 1
Source data for acta2+ vascular smooth muscle cells (VSMCs) number in Figure 6C and D.
- https://cdn.elifesciences.org/articles/94094/elife-94094-fig6-data1-v1.xlsx
Figure 7
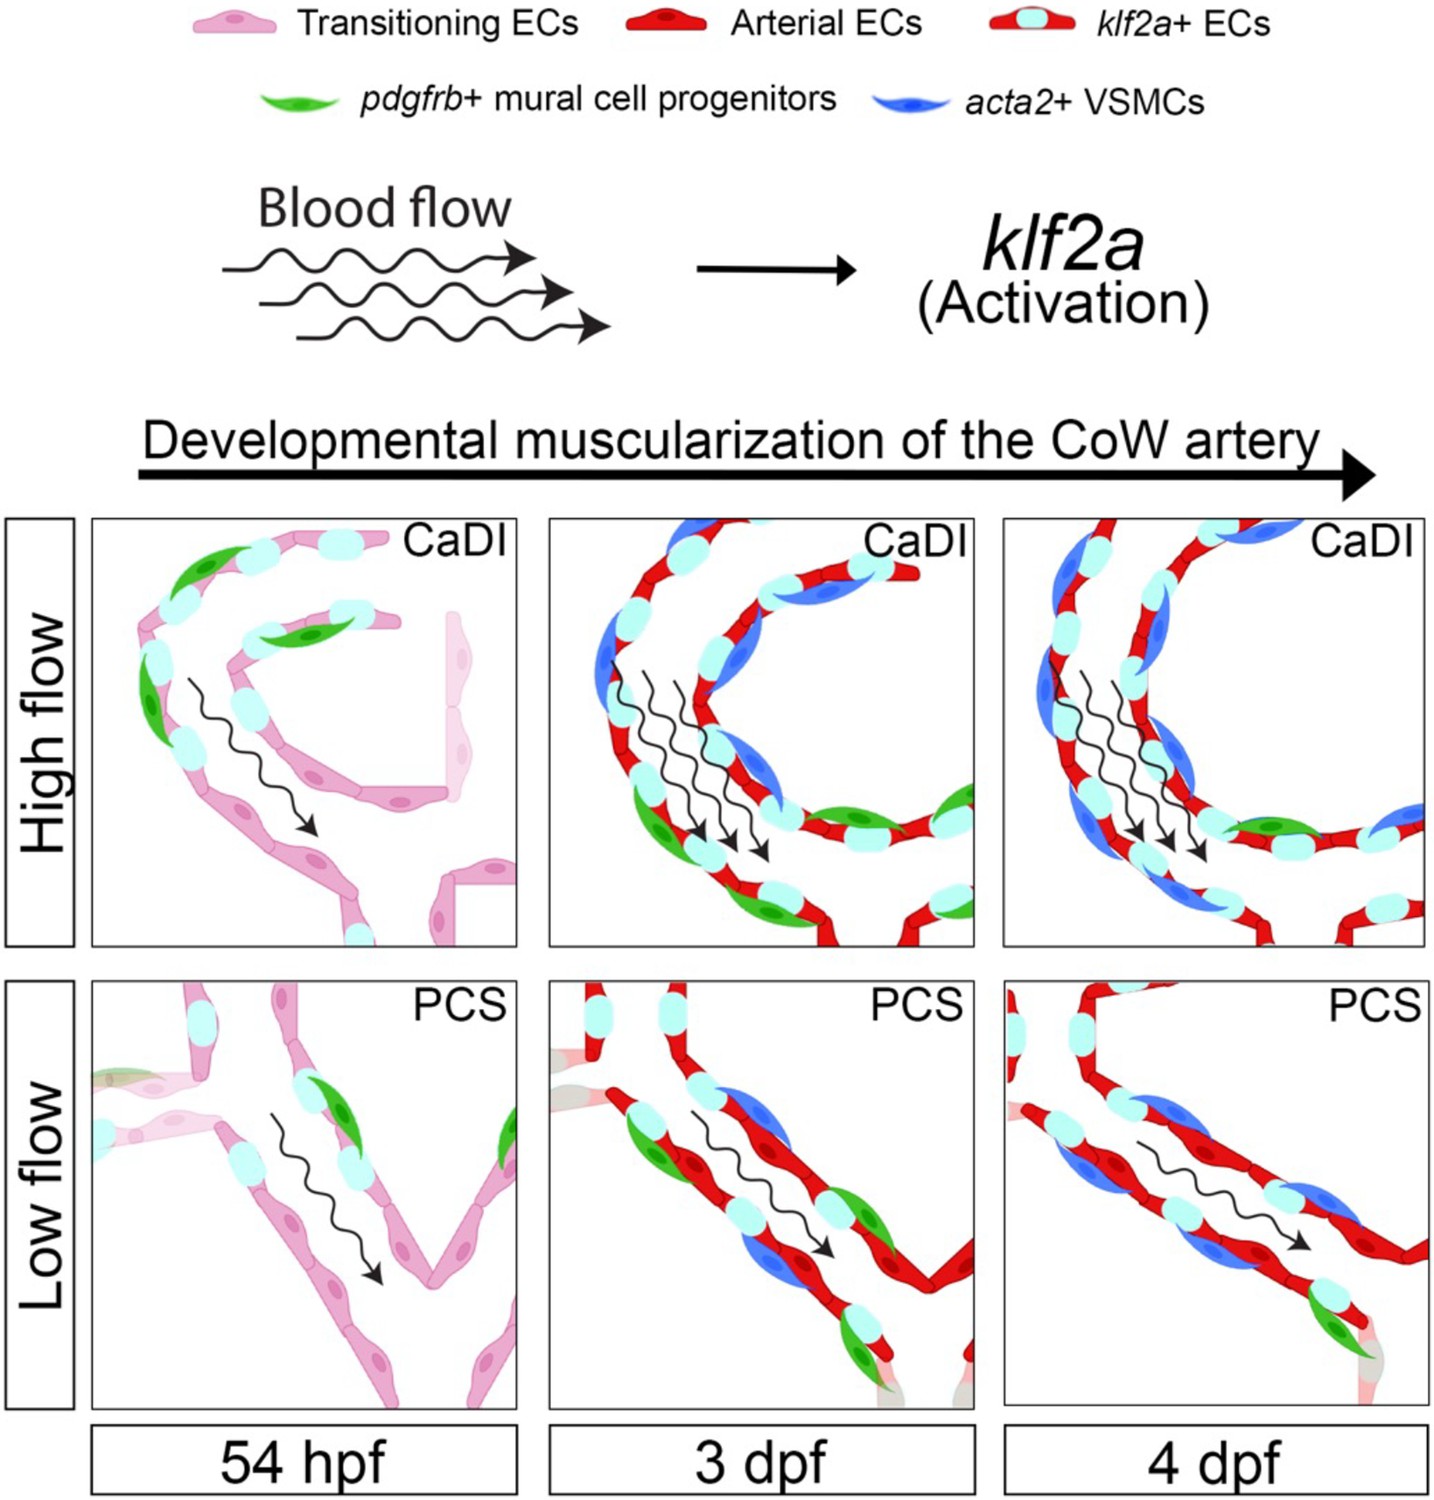
Schematic model of the developmental muscularization of circle of Willis (CoW) arteries.
The model shows how blood flow generates higher hemodynamics in anterior CoW arteries like caudal division of internal carotid artery (CaDI) and activates endothelial klf2a signaling. Other posterior CoW arteries with straight shape like posterior communicating segment (PCS) bear less hemodynamic force and show moderate klf2a activation and later VSMC differentiation. Abbreviations: hpf: hour post fertilization, dpf: day post fertilization, EC: endothelial cell, VSMC: vascular smooth muscle cell, CaDI: caudal division of internal carotid artery, PCS: posterior communicating segment.
Author response image 1
Author response image 2
Tables
Table 1
List of zebrafish fluorescent transgenic lines used in the study.
| Transgenic line | ID | Lab of origin | Reference |
|---|---|---|---|
| Tg(flt4:yfp)hu4881 | ZDB-ALT-100208-1 | S Schulte-Merker | Hogan et al., 2009 |
| Tg(kdrl:hras-mcherry)s896 [Tg(kdrl:ras-mcherry)s896] | ZDB-ALT-081212-4 | DYR Stainier | Chi et al., 2008 |
| Tg(acta2:mcherry)ca8 | ZDB-ALT-120508-2 | SJ Childs | Whitesell et al., 2014 |
| TgBAC(pdgfrb:egfp)ncv22 | ZDB-ALT-160609-1 | N Mochizuki | Ando et al., 2016 |
| Tg(kdrl:cerulean)sd24 | ZDB-ALT-131024-2 | D Traver | Page et al., 2013 |
| Tg(kdrl:grcfp)zn1 [Tg(kdrl:gfp)zn1] | ZDB-ALT-051114-10 | Zygogen Research Department | Cross et al., 2003 |
| Tg(klf2a:h2b-egfp)ig11 | ZDB-ALT-161017-10 | J Vermot | Steed et al., 2016 |
| Tg(fli1:negfp)y7 [Tg(fli1:nls-gfp)y7] | ZDB-ALT-060821-4 | BM Weinstein | Roman et al., 2002 |
| Tg(gata1:dsRed)sd2 | ZDB-ALT-051223-6 | LI Zon | Traver et al., 2003 |
-
.
Table 2
List of morpholino antisense oligonucleotides used in the study.
| Morpholino | Sequence | ID | Reference | Dose (ng/embryo) |
|---|---|---|---|---|
| MO1-tnnt2a | 5' - CATGTTTGCTCTGATCTGACACGCA -3' | ZDB-MRPHLNO-060317-4 | Sehnert et al., 2002 | 0.35 |
| MO1-klf2a | 5' - GGACCTGTCCAGTTCATCCTTCCAC -3' | ZDB-MRPHLNO-100610-8 | Nicoli et al., 2010 | 11 |
Additional files
Download links
A two-part list of links to download the article, or parts of the article, in various formats.
Downloads (link to download the article as PDF)
Open citations (links to open the citations from this article in various online reference manager services)
Cite this article (links to download the citations from this article in formats compatible with various reference manager tools)
Hemodynamics regulate spatiotemporal artery muscularization in the developing circle of Willis
eLife 13:RP94094.
https://doi.org/10.7554/eLife.94094.3


