Association with TFIIIC limits MYCN localisation in hubs of active promoters and chromatin accumulation of non-phosphorylated RNA polymerase II
- Theodor Boveri Institute, Department of Biochemistry and Molecular Biology, Biocenter, University of Würzburg, Germany
- Comprehensive Cancer Center Mainfranken, Germany
- Astbury Centre for Structural Molecular Biology, Faculty of Biological Sciences, University of Leeds, United Kingdom
- Mildred Scheel Early Career Center, University Hospital Würzburg, Germany
- Theodor Boveri Institute, Core Unit High-Content Microscopy, Biocenter, University of Würzburg, Germany
Figures
Figure 1 with 1 supplement
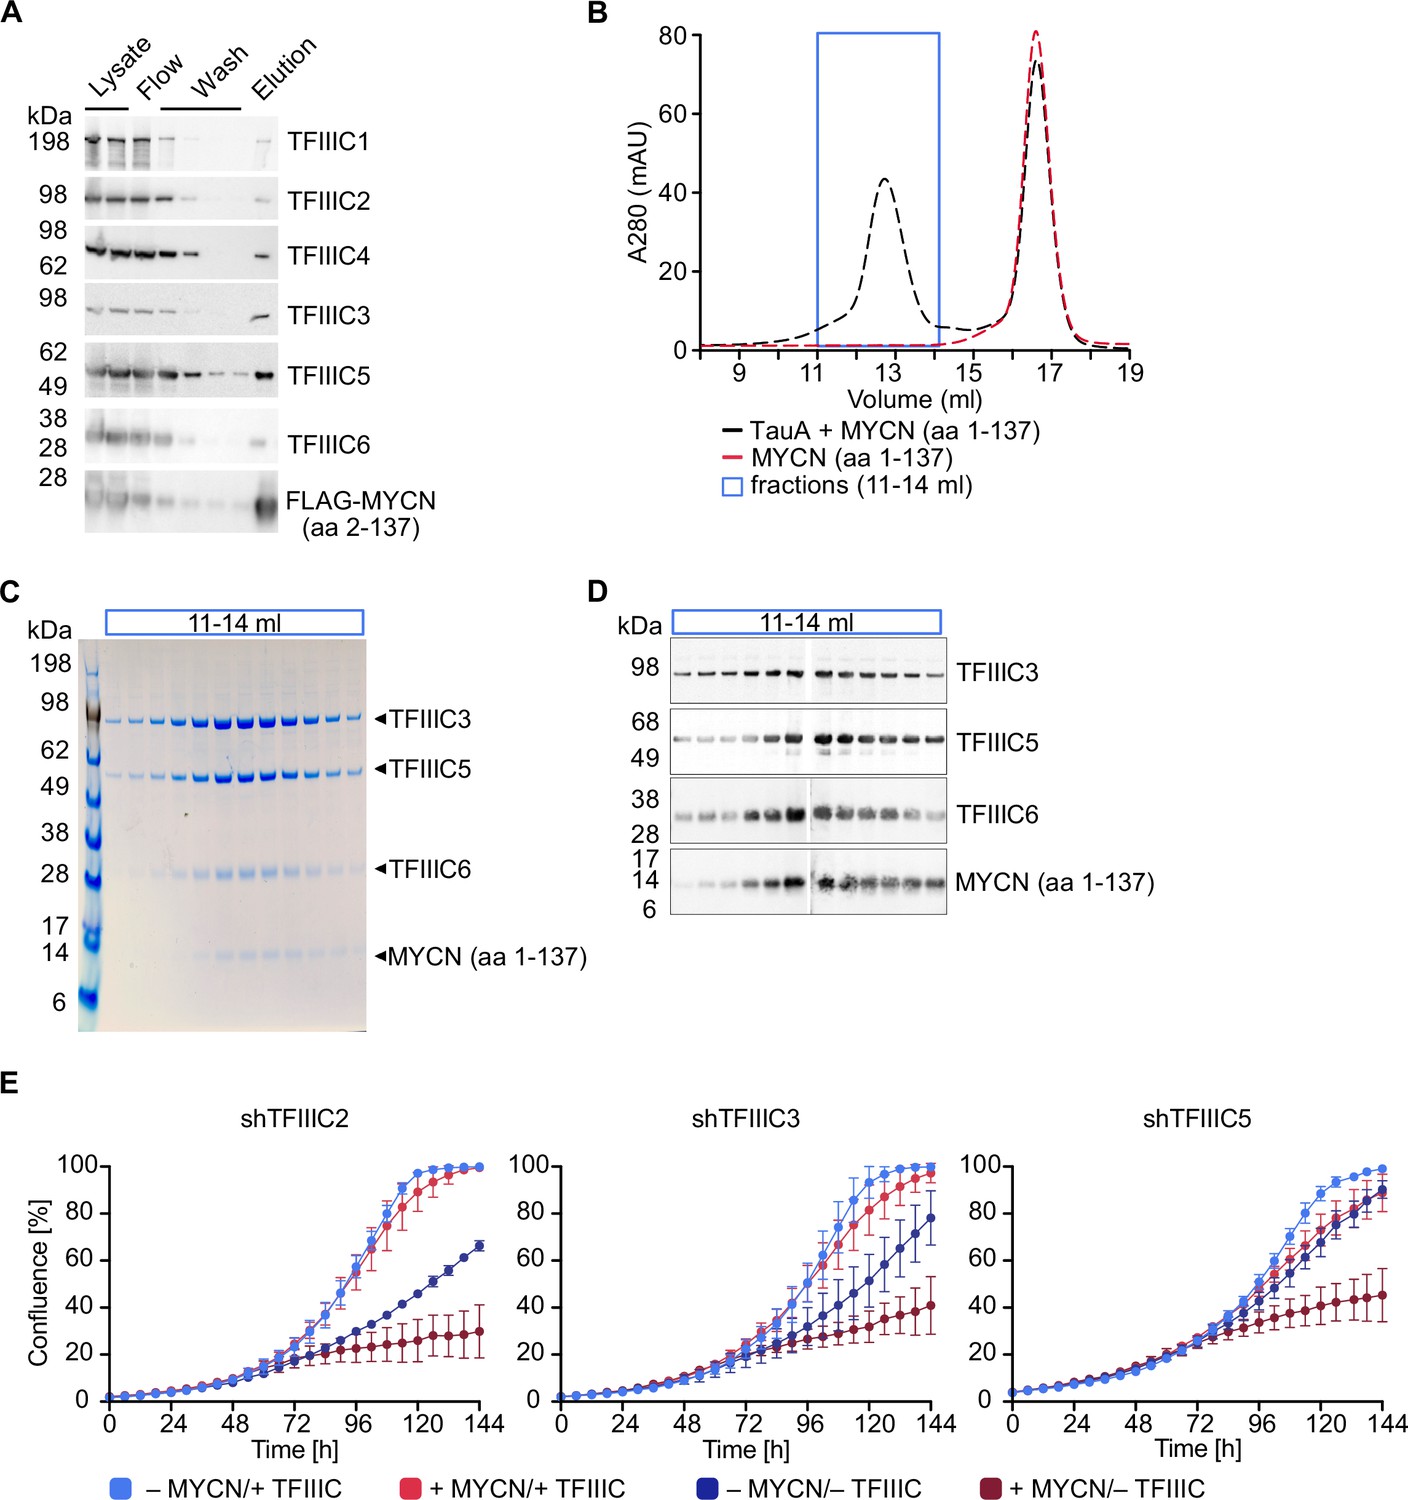
TFIIIC directly interacts with MYCN.
(A) Immunoblots showing levels of FLAG-tagged MYCN (amino acids [aa] 2–137) and the six subunits of the TFIIIC complex after a pull-down assay using anti-FLAG affinity columns. Multiple columns labelled ‘Wash’ represent the sequential washings (n=2). (B) Size exclusion chromatography graph of MYCN (aa 1–137)/TauA (τA) (black trace) or MYCN alone (red trace). The blue box marks the fractions used for panels C and D (n=2). (C) Coomassie staining of fractions of the MYCN (aa 1–137)/τA complex (fractions marked with blue box in panel B). (D) Immunoblot of fractions of the MYCN (aa 1–137)/τA complex (fractions marked with blue box in panel B). (E) Growth curve (measured as % confluence) of SH-EP-MYCN-ER cells expressing doxycycline (Dox)-inducible shRNA targeting TFIIIC2, TFIIIC3, or TFIIIC5 under the indicated conditions. Data show mean ± standard deviation (SD) (n=3).
-
Figure 1—source data 1
Raw unedited gels for Figure 1A and D.
- https://cdn.elifesciences.org/articles/94407/elife-94407-fig1-data1-v1.zip
-
Figure 1—source data 2
Uncropped and labelled gels for Figure 1A and D.
- https://cdn.elifesciences.org/articles/94407/elife-94407-fig1-data2-v1.zip
-
Figure 1—source data 3
Raw unedited Coomassie images for Figure 1C.
- https://cdn.elifesciences.org/articles/94407/elife-94407-fig1-data3-v1.zip
-
Figure 1—source data 4
Uncropped and labelled Coomassie images for Figure 1C.
- https://cdn.elifesciences.org/articles/94407/elife-94407-fig1-data4-v1.zip
-
Figure 1—source data 5
Raw data for graphs shown in Figure 1B and E.
- https://cdn.elifesciences.org/articles/94407/elife-94407-fig1-data5-v1.zip
Figure 1—figure supplement 1
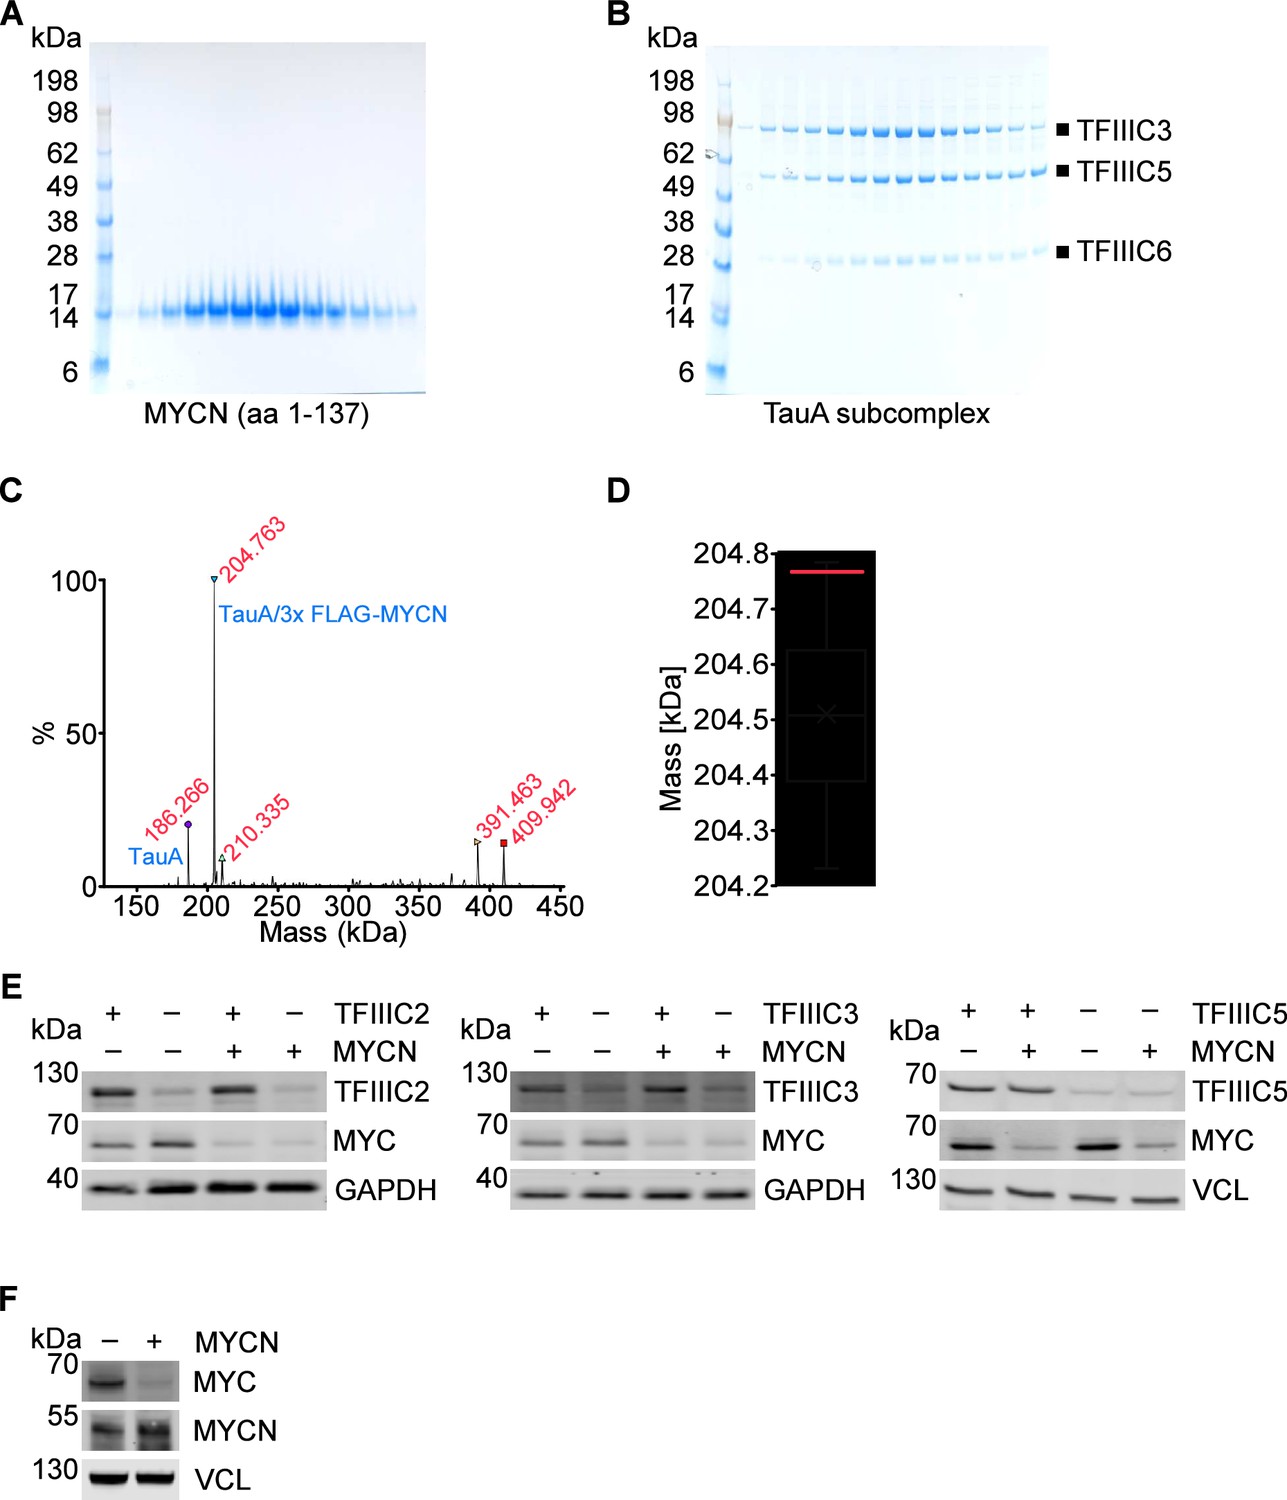
Characterisation of MYCN/TFIIIC complexes.
(A) SDS-PAGE gel of recombinant purified MYCN (amino acids [aa] 1–137) expressed in Escherichia coli cells. (B) SDS-PAGE gel of recombinant purified TauA (τA) subcomplex which was expressed in Spodoptera frugiperda (Sf9) cells. (C) Deconvoluted spectra of native mass spectrometry for the τA/3x FLAG-MYCN complex. Masses are shown in red, identities of complexes are marked in blue. (D) Boxplot of the 30 possibleτA/3x FLAG-MYCN complex molecular weights based on the masses observed using intact mass spectrometry. The red line indicates the mass observed for the complex by native mass spectrometry (204,763 Da). (E) Immunoblot showing levels of TFIIIC2, TFIIIC3, or TFIIIC5 and MYC in SH-EP-MYCN-ER cells expressing doxycycline (Dox)-inducible shRNAs targeting the different TFIIIC subunits (n=3). Where indicated cells were treated with Dox (1 µg/ml, 48 hr) and/or 4-hydroxytamoxifen (4-OHT) (200 nM, 4 hr), respectively. EtOH was used as control. In the following panels addition of 4-OHT is indicated by ‘+MYCN’ and Dox treatment by ‘– TFIIIC’. (F) Immunoblot of MYC and MYCN in SH-EP-MYCN-ER cells after induction of MYCN with 4-OHT (200 nM, 4 hr). VCL was used as a loading control.
-
Figure 1—figure supplement 1—source data 1
Raw unedited Coomassie images for Figure 1—figure supplement 1A and B.
- https://cdn.elifesciences.org/articles/94407/elife-94407-fig1-figsupp1-data1-v1.zip
-
Figure 1—figure supplement 1—source data 2
Uncropped and labelled Coomassie images for Figure 1—figure supplement 1A and B.
- https://cdn.elifesciences.org/articles/94407/elife-94407-fig1-figsupp1-data2-v1.zip
-
Figure 1—figure supplement 1—source data 3
Raw data for graphs shown in Figure 1—figure supplement 1D.
- https://cdn.elifesciences.org/articles/94407/elife-94407-fig1-figsupp1-data3-v1.zip
-
Figure 1—figure supplement 1—source data 4
Raw unedited gels for Figure 1—figure supplement 1E and F.
- https://cdn.elifesciences.org/articles/94407/elife-94407-fig1-figsupp1-data4-v1.zip
-
Figure 1—figure supplement 1—source data 5
Uncropped and labelled gels for Figure 1—figure supplement 1E, F.
- https://cdn.elifesciences.org/articles/94407/elife-94407-fig1-figsupp1-data5-v1.zip
Figure 2 with 1 supplement
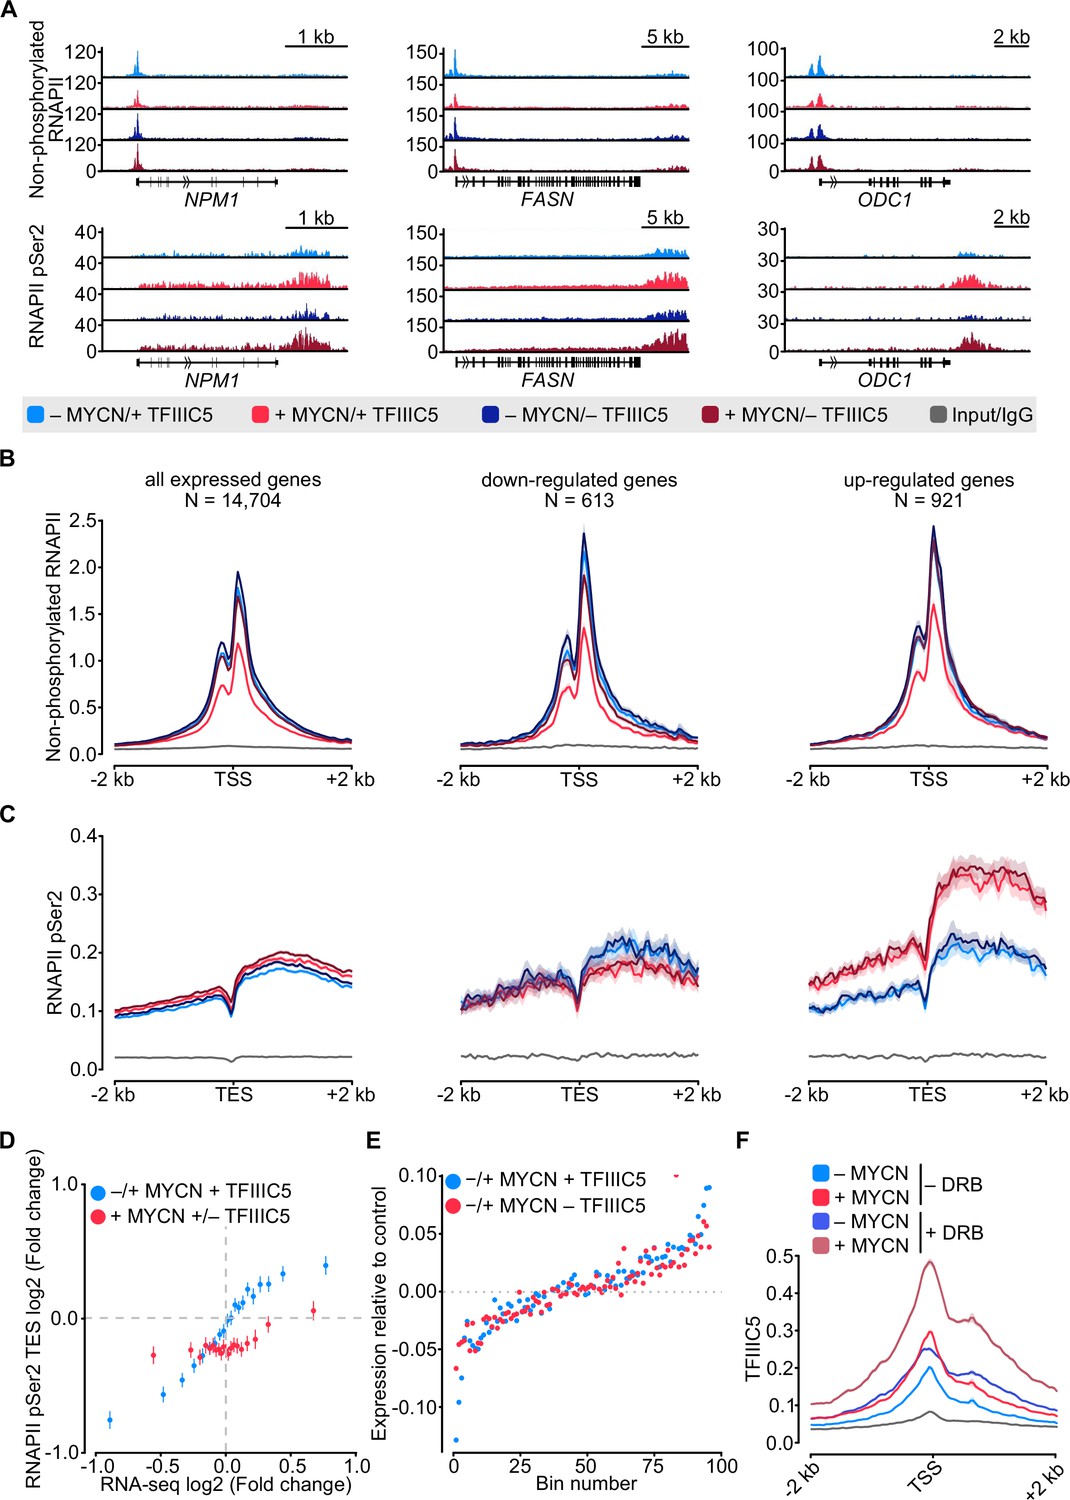
MYCN and TFIIIC antagonise accumulation of non-phosphorylated RNA polymerase II (RNAPII).
(A) Browser tracks for non-phosphorylated RNAPII (top) and RNAPII pSer2 (bottom) ChIP-Rx at the indicated gene loci. SH-EP-MYCN-ER cells were treated with doxycycline (Dox) (1 µg/ml, 48 hr) and/or 4-hydroxytamoxifen (4-OHT), respectively. EtOH was used as control. (B) Average density plot of ChIP-Rx signal for non-phosphorylated RNAPII. Data show mean (line) ± standard error of the mean (SEM indicated by the shade) of different gene sets based on an RNA-sequencing (RNA-seq) of SH-EP-MYCN-ER cells ± 4-OHT. The y-axis shows the number of spike-in normalised reads and it is centred to the TSS ± 2 kb. N=number of genes in the gene set defined in the Methods (n=2). (C) Density plot of ChIP-Rx signal for RNAPII pSer2 as described for panel B. The signal is centred to the transcription end site (TES) ± 2 kb (n=2). (D) Average bin dot plot showing fold change for RNAPII pSer2 ChIP-Rx reads over TES ± 2 kb and RNA-seq of SH-EP-MYCN-ER for the same genes ± MYCN + TFIIIC5 (blue) or + MYCN ± TFIIIC5 (red). The plot shows 20 bins representing a total of 13,239 and 12,330 genes for ± MYCN + TFIIIC5 and + MYCN ± TFIIIC5 datasets, respectively (n=3 for RNA-seq, n=2 pSer2 RNAPII ChIP-Rx). (E) Average bin dot plot for RNA-seq of SH-EP-MYCN-ER showing log2 mRNA expression normalised by control per bin. Cells were treated with 1 µg/ml Dox (‘– TFIIIC5’, 48 hr) and/or 4-OHT (‘+MYCN’, 4 hr) or EtOH as control. Expression was normalised by its control. Each bin represents 150 genes of a total of 14,085 genes. Dotted line marks the relative expression at 0 (n=3). (F) Density plot of ChIP-Rx signal for TFIIIC5. Data show mean (line) ± SEM (shade) for 14,722 genes. The signal is centred to the TSS ± 2 kb (n=2).
Figure 2—figure supplement 1
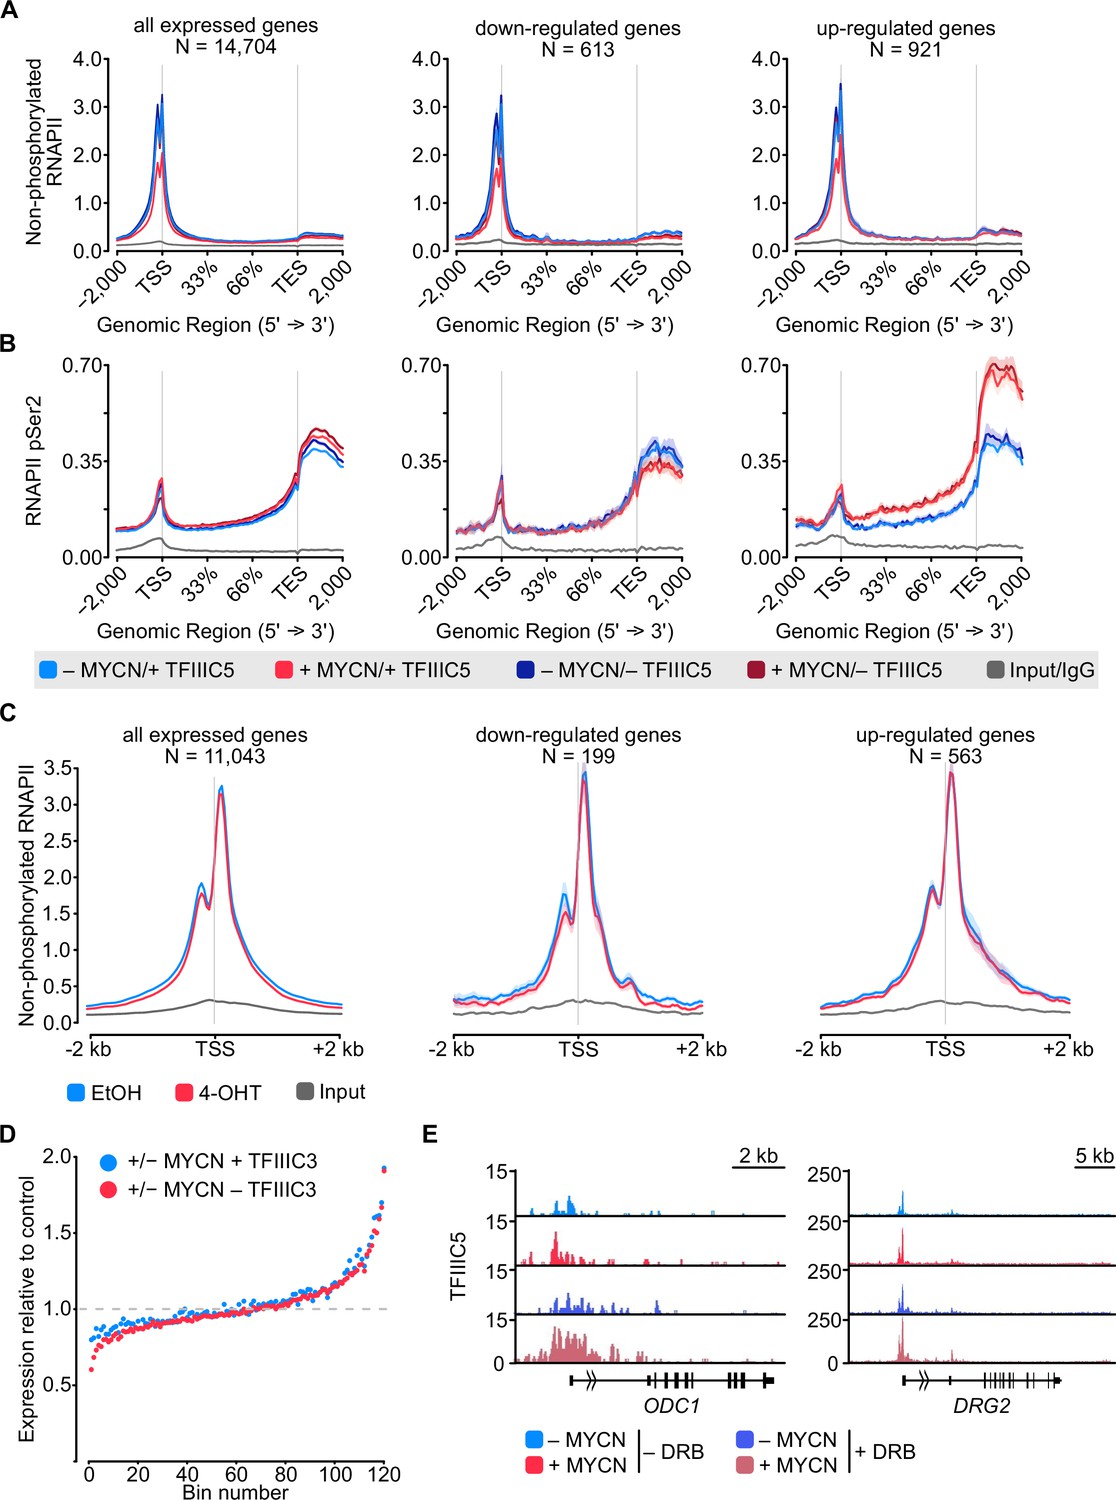
Effects of MYCN and TFIIIC on RNA polymerase II (RNAPII).
(A) Metagene plot of ChIP-Rx signal for non-phosphorylated RNAPII. Data show mean (line) ± standard error of the mean (SEM indicated by the shade) of different gene sets based on an RNA-sequencing (RNA-seq) of SH-EP-MYCN-ER cells ± 4-hydroxytamoxifen (4-OHT). (B) Metagene plot of ChIP-Rx signal for RNAPII pSer2. Data are presented as described in (A). (C) Average density plot of ChIP-Rx signal for non-phosphorylated RNAPII in SH-EP cells treated with 4-OHT. Data show mean (line) ± SEM (indicated by the shade) of different gene sets based on an RNA-seq of SH-EP-MYCN-ER cells ±4 OHT. The signal is centred to the TSS ± 2 kb (n=2). (D) Average bin dot plot for RNA-seq of SH-EP-MYCN-ER showing mRNA expression normalised by control per bin. Cells were co-treated with 1 µg/ml doxycycline (Dox) (‘– TFIIIC3’, 48 hr) and/or 4-OHT (‘+ MYCN’, 4 hr) as EtOH as control. Expression was normalised by its control. Each bin represents 100 genes of a total of 12,091 genes. Dotted line marks the relative expression at 1 (n = 3). (E) Browser tracks for TFIIIC5 ChIP-Rx at the indicated gene loci. SH-EP-MYCN-ER cells were treated with 5,6-dichlorobenzimidazole-1-β-D-ribofuranoside (DRB) and/or 4-OHT, respectively. EtOH was used as control.
Figure 3 with 1 supplement
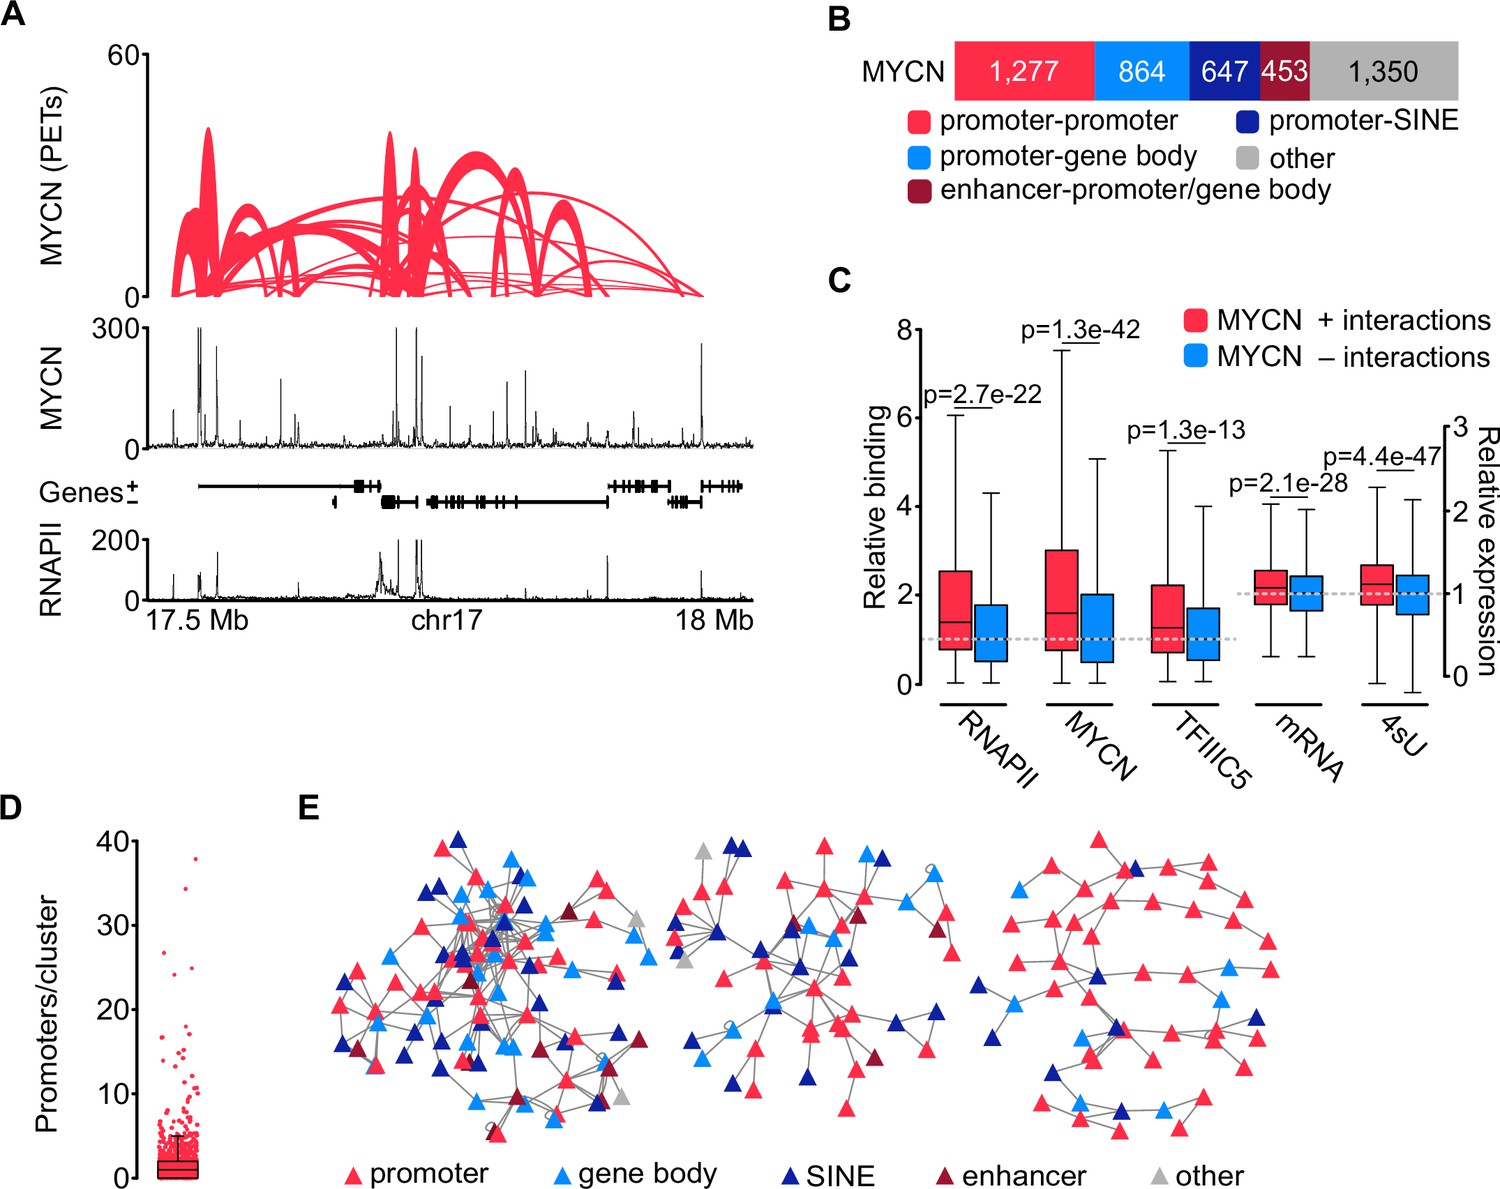
MYCN is part of three-dimensional promoter hubs.
(A) Top: Representative browser track of MYCN three-dimensional chromatin interactions. Height shows the number of paired end tags (PETs) indicating the interaction intensity and the width of the line shows the start and end positions of each anchor. Middle and bottom: Browser tracks showing the number of reads of MYCN and total RNAPII ChIP-Rx, respectively. Unless stated, all experiments were performed in SH-EP-MYCN-ER cells treated with 4-hydroxytamoxifen (4-OHT) (200 nM, 4 hr). The ruler at the bottom shows the genomic coordinates (n=3 independent biological replicates for MYCN phosphorylated linker HiChIP [pLHiChIP]; n=2 for RNAPII ChIP-Rx). (B) Bar chart listing functional annotations of all binary MYCN interactions (N=4591; N indicates total number). (C) Boxplots showing relative binding of the indicated proteins (RNAPII, MYCN, TFIIIC5) to promoter regions or expression levels of the corresponding genes (mRNA by RNA-sequencing [RNA-seq]; 4sU by 4sU-seq). Red boxes: Genes bound by MYCN and part of MYCN-hubs. Blue boxes: Genes bound by MYCN that are not part of MYCN-hubs. Each pair was normalised to the median of the corresponding ‘blue’ gene set. p-Values were obtained by pairwise comparisons using Student’s t-test (n=2 for TFIIIC5 and RNAPII ChIP-Rx). (D) Boxplot showing the number of promoters in each cluster, with each red dot representing one cluster. (E) Network reconstruction of the three biggest clusters based on MYCN pLHiChIP interactions. Each anchor is represented by a node (‘triangle’) and the lines show interactions between the anchors. The colours are indicating the different functional annotation.
Figure 3—figure supplement 1
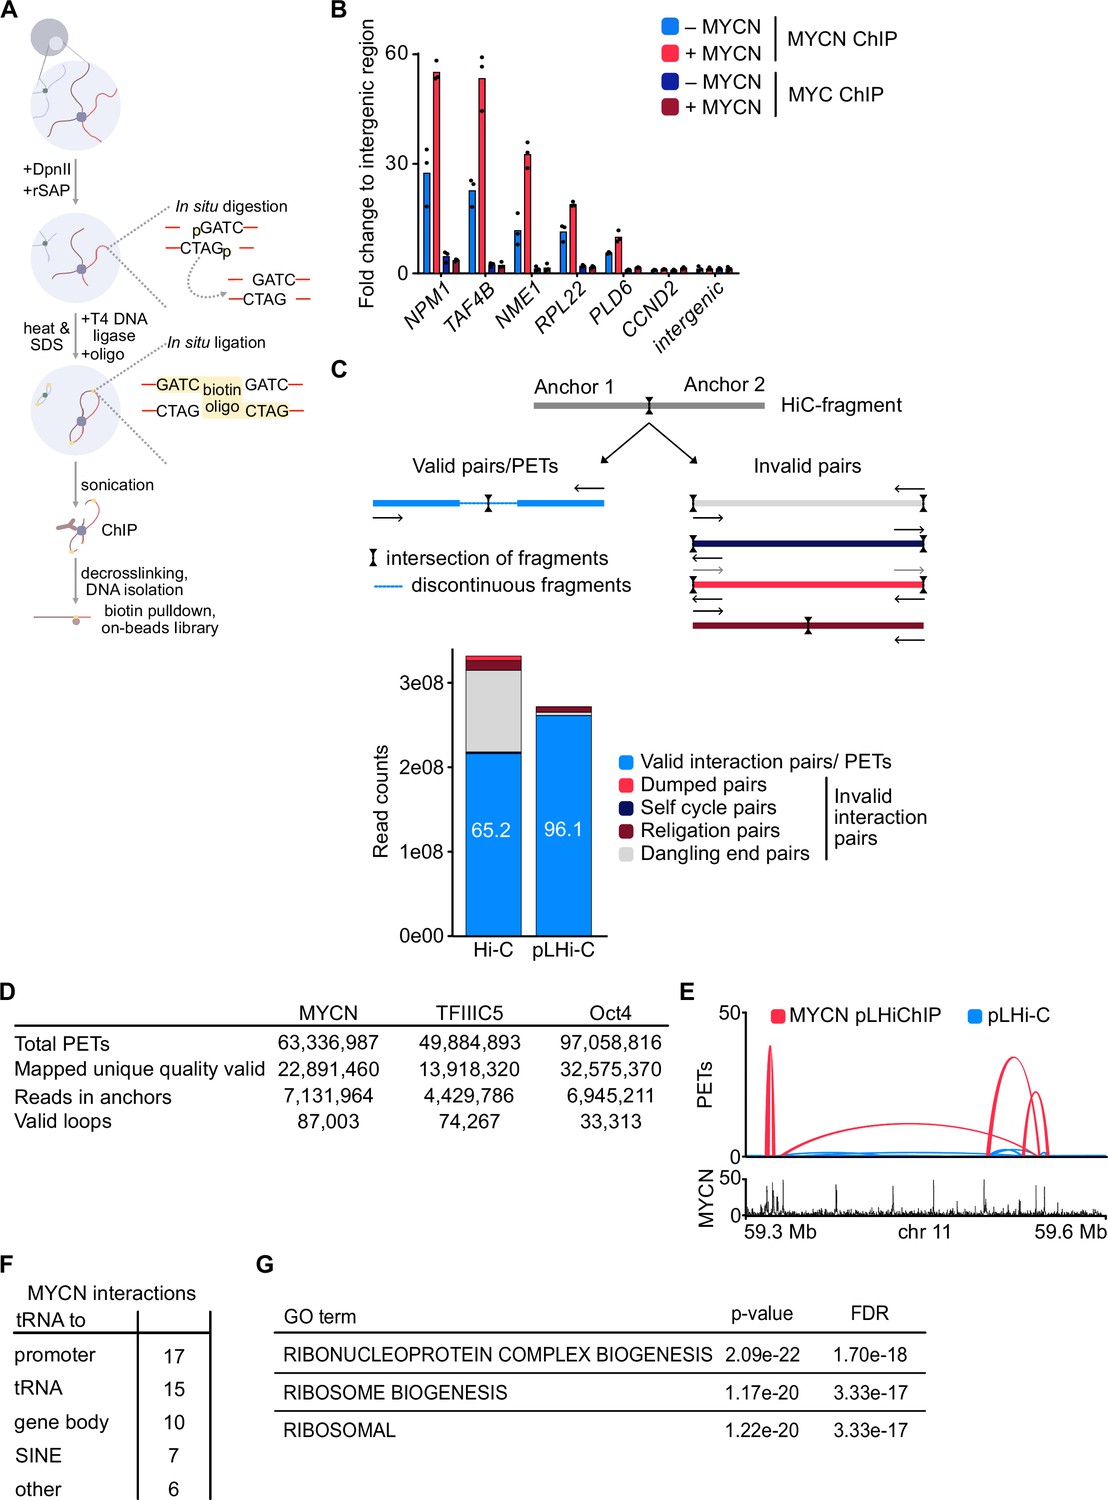
Characterisation of HiChip methods.
(A) Diagram showing the workflow of phosphorylated linker HiChIP (pLHiChIP). The workflow corresponds to the original HiChIP protocol. For a detailed description, see Methods. (B) MYCN and MYC ChIP in SH-EP-MYCN-ER cells before and after activation of MYCN with 4-hydroxytamoxifen (4-OHT) (200 nM, 24 hr). Shown is the mean and points of technical triplicates normalised to an intergenic region (n=2). (C) (Top) Diagram illustrating the difference between valid and invalid pairs after mapping of spike-in phosphorylated linker HiChIP (spLHiChIP) data. Valid pairs harbour non-contiguous elements of chromosomal DNA, whereas invalid pairs harbour contiguous stretches of chromosomal DNA. (Bottom) Bar graph showing percentage of valid and invalid reads in our dataset (right) compared to a published HiC protocol (left). (D) Table showing quality controls for MYCN and TFIIIC5 spLHiChIP compared to the original Oct4 HiChIP. (E) Representative example of pLHiChIP track for MYCN (red) and a phosphorylated linker Hi-C (pLHi-C) track (blue) showing the strongly increased PETs number of the MYCN interactions after MYCN immunoprecipitation relative to input (pLHi-C). Data are superimposed with a browser view of an MYCN ChIP-sequencing (ChIP-seq). (F) Table showing interactions involving tRNA genes in MYCN pLHiChIP. (G) Table showing the top three terms, their p-values, and the false discovery rate (FDR) from enrichment analysis for MSigDB C5 collection of all MYCN network.
-
Figure 3—figure supplement 1—source data 1
Raw data for data shown in Figure 3—figure supplement 1B.
- https://cdn.elifesciences.org/articles/94407/elife-94407-fig3-figsupp1-data1-v1.zip
Figure 4 with 1 supplement
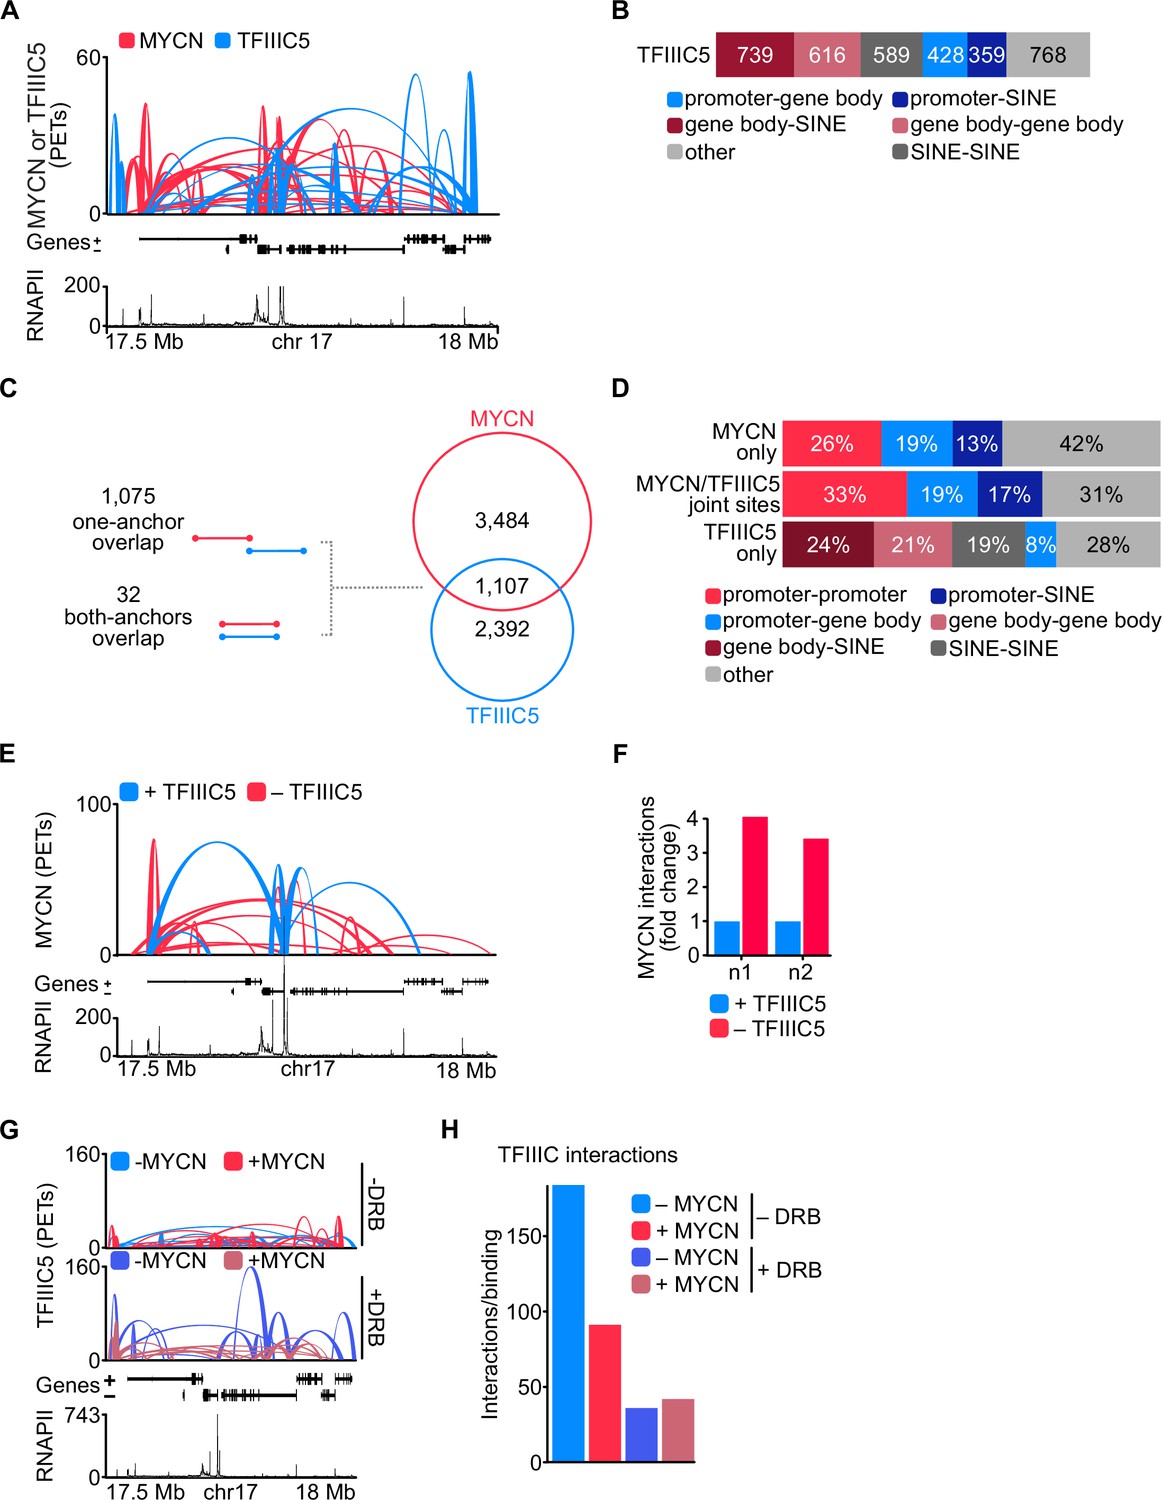
TFIIIC antagonises MYCN participation in promoter hubs.
(A) Representative example of phosphorylated linker HiChIP (pLHiChIP) track for MYCN (red) and TFIIIC5 (blue) interactions (conventions as in Figure 3A) (n=2). (B) Bar chart listing the total number of functional annotations for all TFIIIC5 binary interactions (N=3499). (C) Venn diagram showing the number of interactions shared between MYCN and TFIIIC5. The diagram at the left shows the types of overlaps between connections. (D) Bar chart listing the interaction functional annotations for MYCN anchors not overlapping with TFIIIC5 anchors (‘MYCN only’) as well as TFIIIC5 anchors without overlapping MYCN anchors (‘TFIIIC5 only’) and their joint anchors. (E) Representative example of MYCN spike-in phosphorylated linker HiChIP (spLHiChIP) track for MYCN interactions in the presence (blue) or absence (red) of TFIIIC5 (n=2). (F) Bar graph showing the fold change of all MYCN spLHiChIP interactions comparing ‘+TFIIIC5’ and ‘– TFIIIC5’ in SH-EP-MYCN-ER cells expressing a doxycycline (Dox)-inducible shRNA targeting TFIIIC5. n1,2 indicates two independent biological replicates. (G) Representative example of TFIIIC5 spLHiChIP track without (blue) or with (red) induction of MYCN for SH-EP-MYCN-ER cells (conventions as in Figure 3A). (H) Bar graph showing the number of TFIIIC5 interactions normalised by the relative binding of TFIIIC5 ChIP-Rx signals for the same coordinates. Coordinates defined as TSS ± 2 kb of 14,722 genes.
Figure 4—figure supplement 1
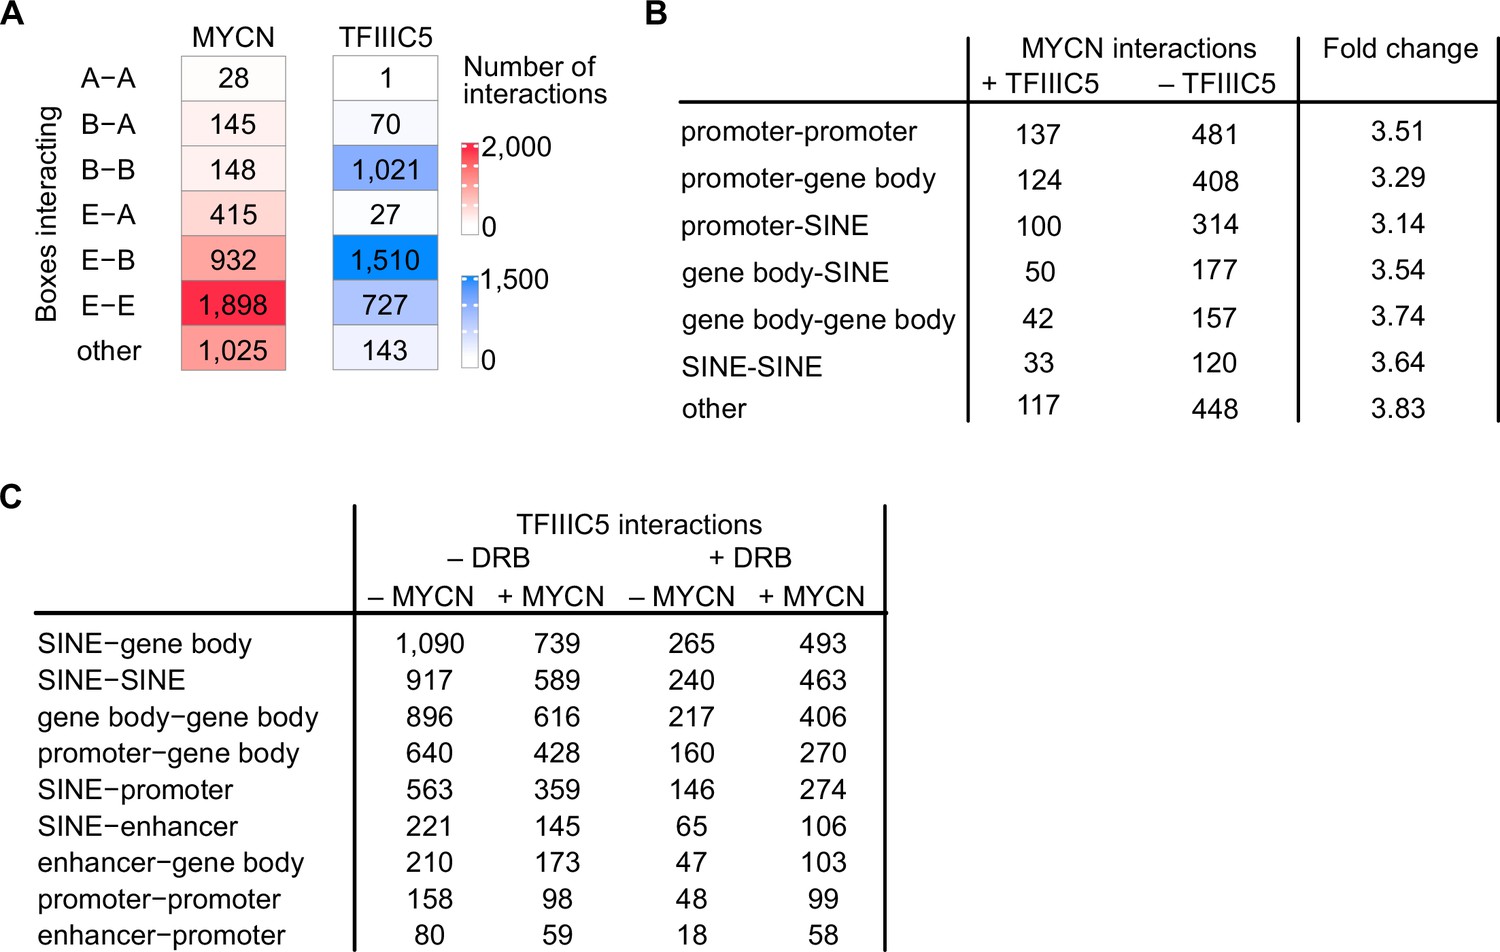
Three-dimensional interactions of MYCN and TFIIIC.
(A) Heatmap showing analysis of sequence motifs characteristic for interacting boxes on both anchors of the interactions. Colour reflects the number of interactions. (B) Table summarising numbers of MYCN interactions in the presence and absence of TFIIIC5 in SH-EP-MYCN-ER cells and the TFIIIC5-dependent change. Data merged of two independent biological replicates. (C) Table displaying total numbers of TFIIIC5 interactions in SH-EP-MYCN-ER±MYCN + 5,6-dichlorobenzimidazole-1-β-D-ribofuranoside (DRB).
Figure 5 with 1 supplement
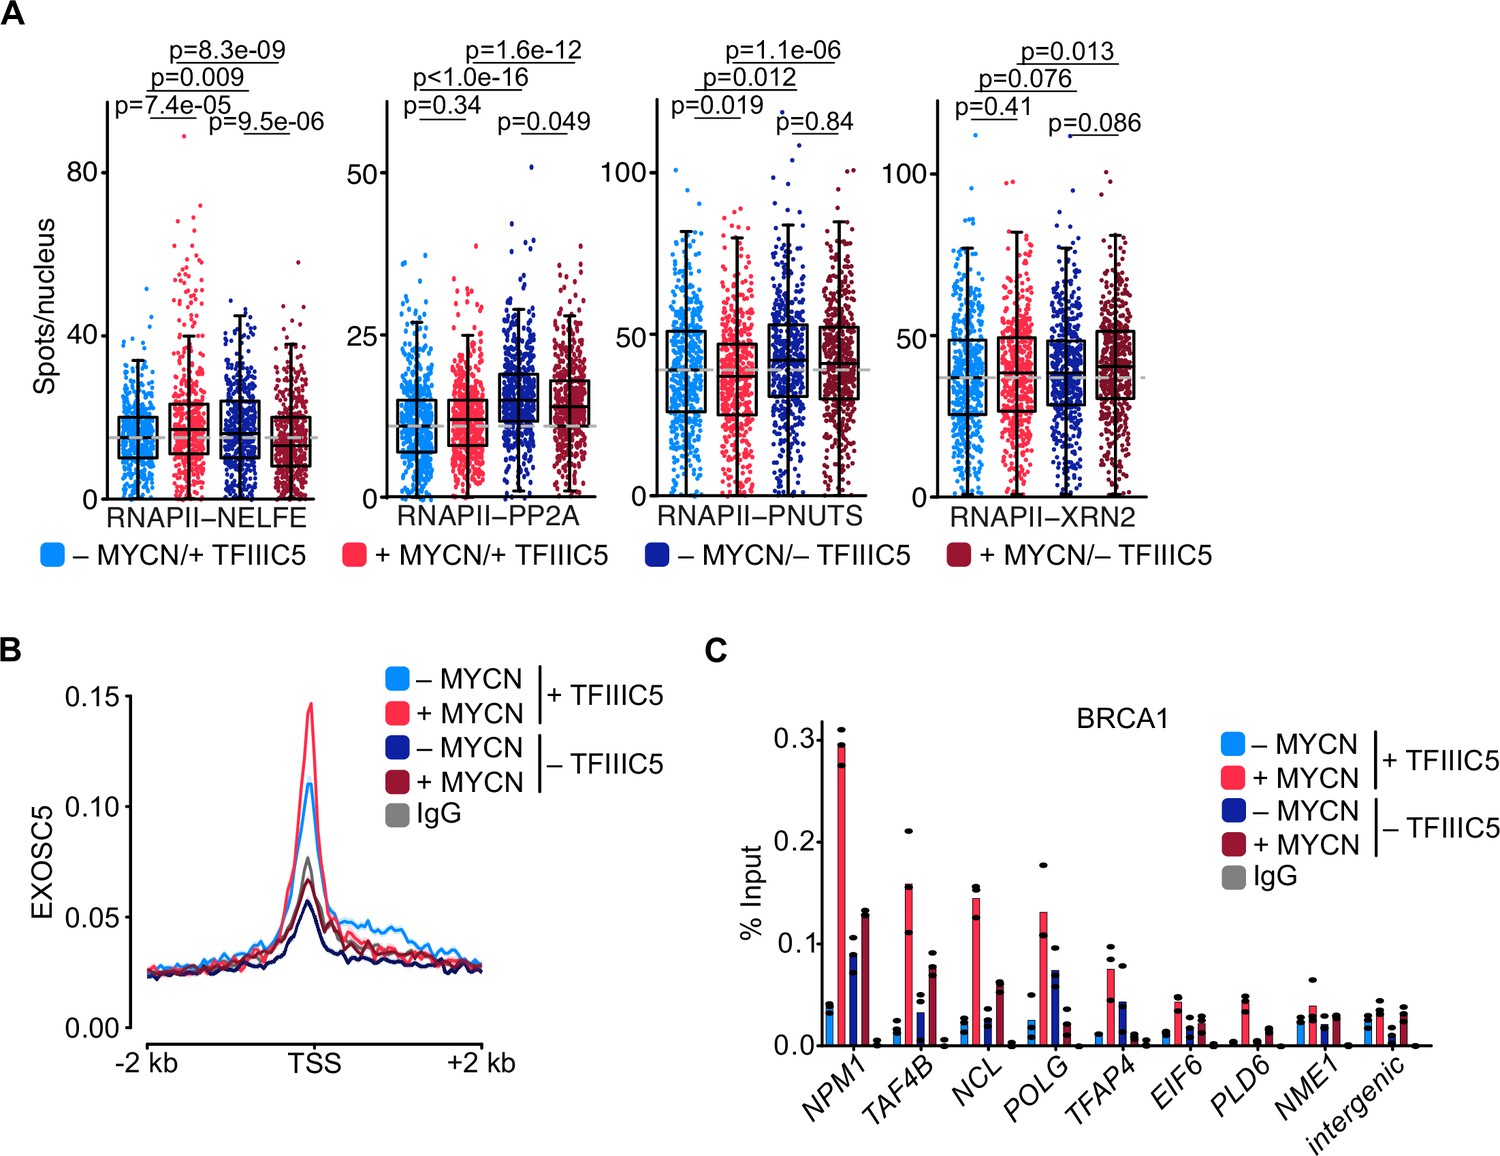
TFIIIC is required for promoter association of the exosome and of BRCA1.
(A) Boxplots showing the number of proximity ligation assay (PLA) signals between RNA polymerase II (RNAPII) and NELFE, PP2A, PNUTS, or XRN2. SH-EP-MYCN-ER cells were treated with 1 µg/ml doxycycline (Dox) (‘– TFIIIC5’, 48 hr) and/or 4-hydroxytamoxifen (4-OHT) (‘+MYCN’). EtOH was used as control. For clarity purposes, 500 cells pooled from different replicates were plotted. p-Values were calculated comparing the PLA signal of all cells using unpaired Wilcoxon rank sum test. The grey dotted line indicates the median in the control condition (n=3). (B) Density plot of CUT&RUN for EXOSC5 binding (N=14,704 genes) in SH-EP-MYCN-ER cells expressing a Dox-inducible shRNA targeting TFIIIC5 treated with 4-OHT. Data show mean ± SEM (shade). (C) BRCA1 ChIP in SH-EP-MYCN-ER cells expressing a Dox-inducible shRNA targeting TFIIIC5 treated with 4-OHT (4 hr). Shown is the mean of technical triplicates of one representative experiment with identical results (n=2).
-
Figure 5—source data 1
Raw data for plots shown in Figure 5A and C.
- https://cdn.elifesciences.org/articles/94407/elife-94407-fig5-data1-v1.zip
Figure 5—figure supplement 1
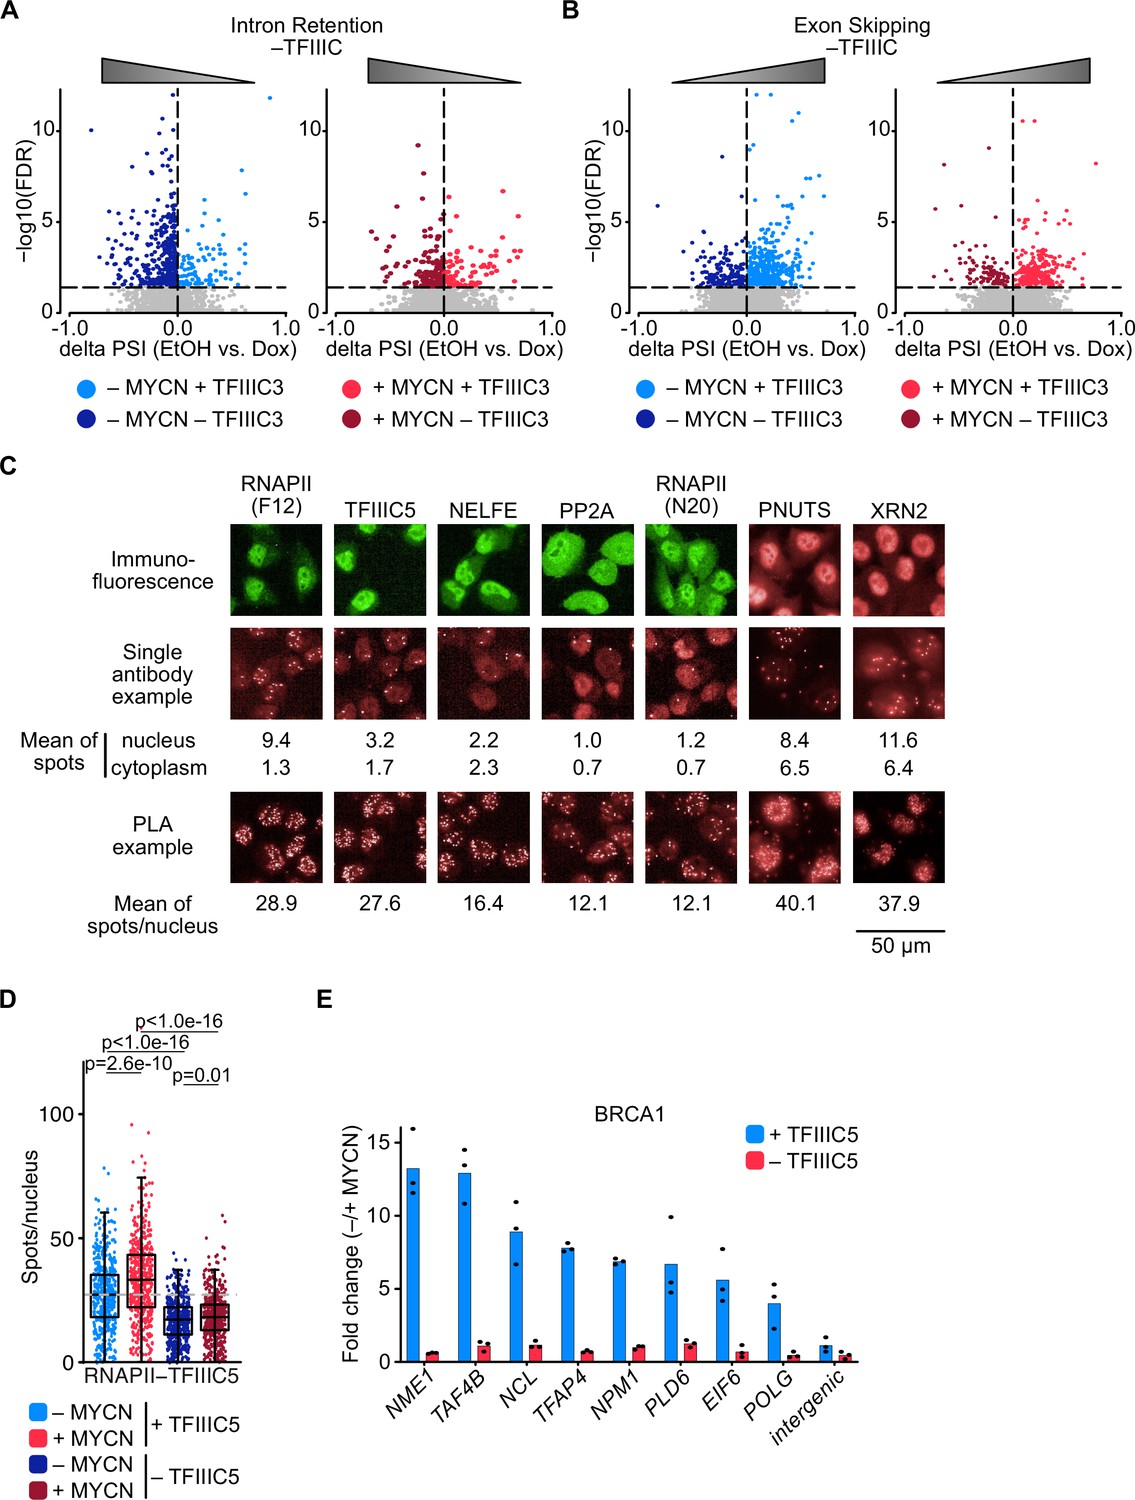
Effects of TFIIIC on splicing and termination factors.
(A) Volcano plot depicting changes in intron retention upon TFIIIC3 knock-down in the absence (left) and presence (right) of MYCN. Triangle reflects the effect of the splicing error after TFIIIC knock-down. (B) Volcano plot depicting changes in exon skipping upon TFIIIC3 knock-down in the absence (left) and presence (right) of MYCN. Triangle reflects the effect of the splicing error after TFIIIC knock-down. (C) Controls for proximity ligation assays (PLAs) shown in Figure 5A. Immunofluorescence show specificity of the antibody. Single antibodies PLAs were performed in parallel to each PLA. Mean of signal in the nucleus and cytoplasm was calculated and compared to mean of the signal per nucleus of the PLA. (D) Boxplots showing the number of PLA signals between RNAPII and TFIIIC5. SH-EP-MYCN-ER cells were treated with 1 µg/ml doxycycline (Dox) (‘– TFIIIC5’, 48 hr) and/or 4-hydroxytamoxifen (4-OHT) (‘+MYCN’). EtOH was used as control. For clarity purposes, 500 cells pooled from different replicates were plotted. p-Values were calculated comparing the PLA signal of all cells using unpaired Wilcoxon rank sum test. The grey dotted line indicates the median in the control condition (n=3). (E) BRCA1 ChIP in SH-EP-MYCN-ER cells expressing a Dox-inducible shRNA targeting TFIIIC5 treated with 4-OHT. Data show fold change of BRCA1 binding after induction of MYCN in the presence (blue) or absence (red) of TFIIIC5 (n=2).
-
Figure 5—figure supplement 1—source data 1
Raw data for plots shown in Figure 5—figure supplement 1D and E.
- https://cdn.elifesciences.org/articles/94407/elife-94407-fig5-figsupp1-data1-v1.zip
Figure 6
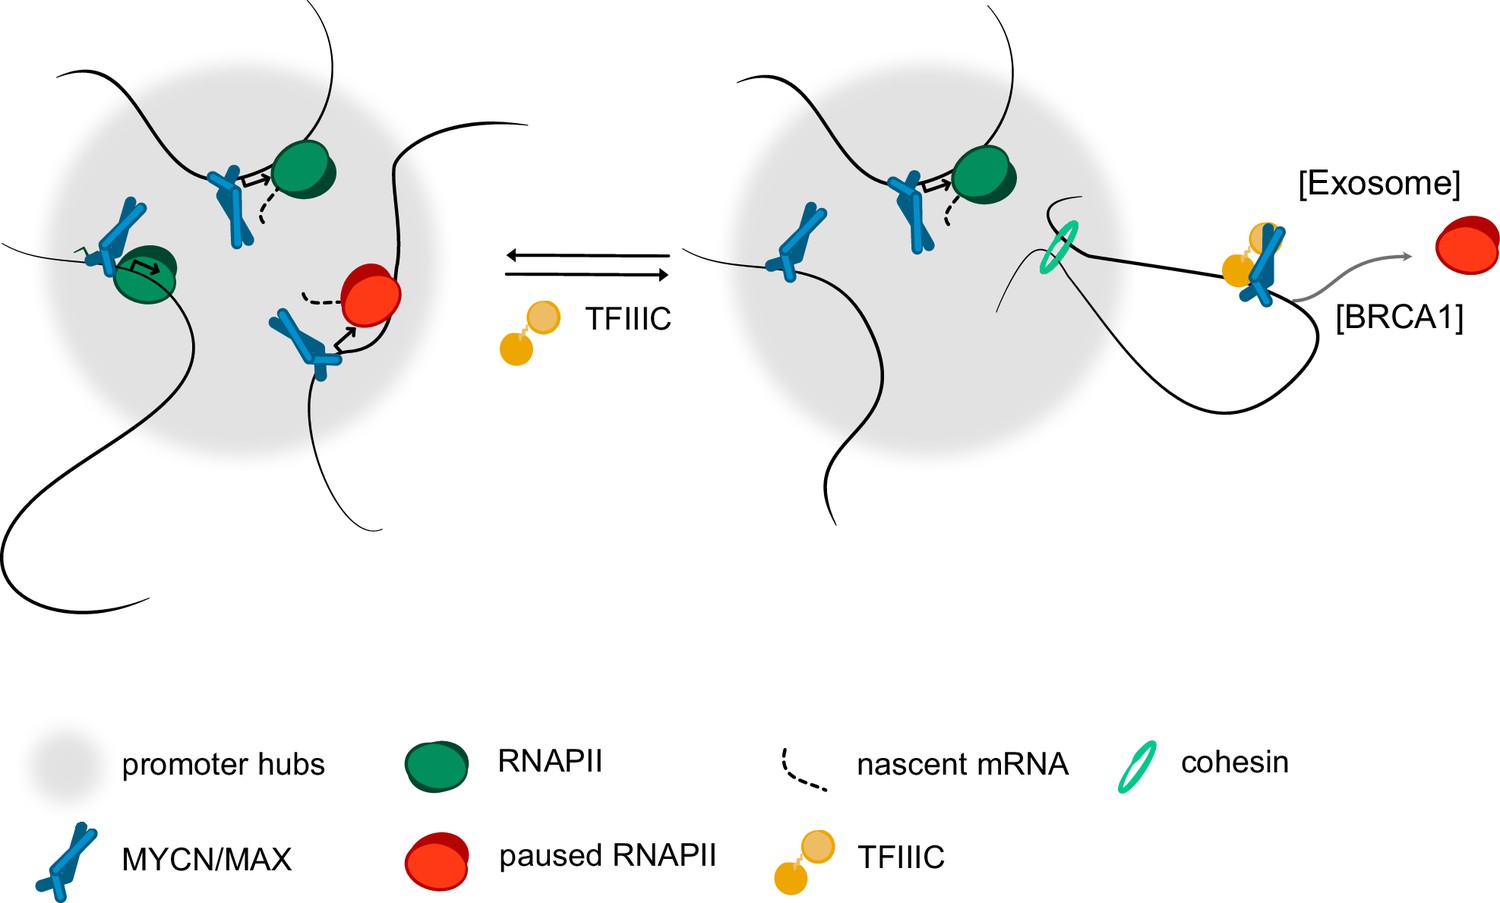
Model.
Model summarising our findings. We propose that complex formation with the TFIIIC complex antagonise the localisation of MYCN in promoter hubs and that this enables access of the nuclear exosome and BRCA1 to promoters with paused or stalled RNA polymerase II (RNAPII). Both the exosome and BRCA1 have been implicated in fostering the degradation of nascent RNA at promoters. The precise mechanisms by which MYCN and TFIIIC limit accumulation of non-phosphorylated RNAPII at promoters remain to be determined.
Author response image 1

(A) Density plot of ChIP-Rx signal for non-phosphorylated RNAPII. Data show mean (line) ± standard error of the mean (SEM indicated by the shade) of different gene sets based on an RNA-seq of SH-EP-MYCN-ER cells ± 4-OHT. The y-axis shows the number of spike-in normalized reads and it is centred to the TES ± 2 kb. N = number of genes in the gene set defined in the methods. (B) Density plot of ChIP-Rx signal for RNAPII pSer2 as described for panel A. The signal is centred to the TSS ± 2 kb.
Author response image 2

Bin dot plot for RNA-seq of SH-EP-MYCN-ER showing mRNA expression normalized by control per bin comparing the fold average using DESEQ2 (A), normalization to TMM in edgeR (B) and to quantile normalization (C).
Author response image 3

Average density plot of ChIP-Rx signal for non-phosphorylated RNAPII (A) or RNAPII pSer2 (B) at promoters with MYCN interactions.
Tables
Appendix 1—key resources table
| Reagent type (species) or resource | Designation | Source or reference | Identifiers | Additional information |
|---|---|---|---|---|
| Cell line (human) | SH-EP | Schwab | CVCL_RR78 | |
| Cell line (human) | SH-EP-MYCN-ER | Eilers | https://doi.org/10.1038/s41586-019-1030-9 | |
| Cell line (murine) | NIH-3T3 | ATCC | CVCL_0594, Cat# CRL-1658 | |
| Cell line (murine) | NHO2A | Schramm | https://doi.org/10.1080/2162402X.2015.1131378 | |
| Cell line (human) | HEK293TN | ATCC | CVCL_UL49, Cat# CRL-11268 | |
| Cell line (insect) | SF9 | Gibco | Cat# 11496015 | Recombinant protein expression |
| Strain, strain background (Escherichia coli) | BL21(DE3)RIL | Merck | Cat# 69,450M | |
| Antibody | TFIIIC90 (rabbit polyclonal) | Bethyl Laboratories | Cat# A301-239A RRID:AB_890667 | WB (1:2000) |
| Antibody | TFIIIC5 (rabbit polyclonal) | Bethyl Laboratories | Cat# A301-242A RRID:AB_890669 | WB (1:1000) Seq (10–15 µg) PLA (1:1000) |
| Antibody | TFIIIC102 (rabbit polyclonal) | Bethyl Laboratories | Cat# A301-238A RRID:AB_890671 | WB (1:2000) |
| Antibody | TFIIIC110 (mouse monoclonal) | Santa Cruz | Cat# sc-81406 RRID:AB_2115237 | WB (1:1000) |
| Antibody | MYCN (B8.4.B) (mouse monoclonal) | Santa Cruz | Cat# sc-53993 RRID:AB_831602 | WB (1:1000) Seq (10–15 µg) ChIP (3 µg) |
| Antibody | TFIIIC35 (rabbit polyclonal) | Novus Biologicals | Cat# NBP2-31851 RRID:AB_2891101 | WB (1:1000) |
| Antibody | TFIIIC1 (rabbit polyclonal) | Novus Biologicals | Cat# NBP2-14077 RRID:AB_2891102 | WB (1:1000) |
| Antibody | FLAG (mouse monoclonal) | Sigma-Aldrich | Cat# F1804 RRID:AB_262044 | WB (1:2000) |
| Antibody | MYC (Y69) (rabbit monoclonal) | abcam | Cat# ab32072 RRID:AB_731658 | WB (1:1000) ChIP (3 µg) |
| Antibody | Vinculin (hVin-1) (mouse monoclonal) | Sigma-Aldrich | Cat# V9131 RRID:AB_477629 | WB (1:5000) |
| Antibody | GAPDH (14C10) (rabbit monoclonal) | Cell Signaling | Cat# 2118 RRID:AB_561053 | WB (1:5000) |
| Antibody | RNAPII (F12) (mouse monoclonal) | Santa Cruz | Cat# sc-55492 RRID:AB_630203 | PLA (1:2000) |
| Antibody | NELFE (rabbit polyclonal) | Merck | Cat# ABE48 RRID:AB_10806770 | PLA (1:1000) |
| Antibody | PP2A (rabbit polyclonal) | Cell Signaling | Cat# 2038 RRID:AB_2169495 | PLA (1:1000) |
| Antibody | BRCA1 (rabbit polyclonal) | Bethyl Laboratories | Cat# A300-000A RRID:AB_67367 | ChIP (3 µg) |
| Antibody | PNUTS (rabbit polyclonal) | Bethyl Laboratories | Cat# A300-439-A RRID:AB_420948 | PLA (1:1000) |
| Antibody | XRN2 (rabbit polyclonal) | Bethyl Laboratories | Cat# A301-103-A RRID:AB_2218876 | PLA (1:2000) |
| Antibody | RNA polymerase II CTD repeat YSPTSPS (phospho Ser2) (rabbit polyclonal) | Abcam | Cat# ab5095 RRID:AB_304749 | Seq (10–15 µg) |
| Antibody | RNA polymerase II (unphosphorylated, 8WG16) (mouse monoclonal) | Santa Cruz | Cat# sc-56767 RRID:AB_785522 | Seq (10–15 µg) |
| Antibody | EXOSC5 (rabbit polyclonal) | Novus Biologicals | Cat# NBP2-14952 | C&R (1:100) |
| Antibody | Donkey Anti-rabbit HRP (polyclonal secondary) | Amersham | Cat# NA934 RRID:AB_772206 | WB (1:3000) |
| Antibody | Sheep Anti-mouse HRP (monoclonal secondary) | Amersham | Cat# NA931 RRID:AB_772210 | WB (1:3000) |
| Recombinant DNA reagent | pInducer11 | Addgene | Cat# 44363 Meerbrey et al., 2011 | Inducible lentiviral gene silencing vector |
| Recombinant DNA reagent | LT3GEPIR | Addgene | Cat# 111177 Zuber | Tet-ON miR-E (miR-30 variant)-based RNAi |
| Recombinant DNA reagent | psPAX.2 | Addgene | Cat# 12260 Trono | Second-generation lentiviral packaging plasmid |
| Recombinant DNA reagent | pMD2.G | Addgene | Cat# 12259 Trono | VSV-G envelope expressing plasmid |
| Sequence-based reagent | shRNA targeting TFIIIC5 | Fellmann et al., 2013 | shRNA ID: GTF3C5.1361 | AAGCGCAGCACCTACAACTACA |
| Sequence-based reagent | shRNA targeting TFIIIC5 | Pelossof et al., 2017 | shRNA ID: GTF3C5_9328_847 | TTGATAAATCTTGGCATCTGGG |
| Sequence-based reagent | shRNA targeting TFIIIC2 | Pelossof et al., 2017 | shRNA ID: GTF3C2_2976_2623 | TGAAGCAGAAGAATGGTCTGGA |
| Sequence-based reagent | shRNA targeting TFIIIC3 | Policarpi et al., 2017 | shRNA ID: GTF3C3_9330_545 | TTCATCATTTTCTTGGTTTCAC |
| Sequence-based reagent | TFAP4 | This paper | ChIP qPCR Primer | (forward: CCGGGCGCTGTTTACTA; reverse: CAGGACACGGAGAACTACAG) |
| Sequence-based reagent | POLG | This paper | ChIP qPCR Primer | (forward: CTTCTCAAGGAGCAGGTGGA; reverse: TCATAACCTCCCTTCGACCG) |
| Sequence-based reagent | NPM1 | This paper | ChIP qPCR Primer | (forward: TTCACCGGGAAGCATGG; reverse: CACGCGAGGTAAGTCTACG) |
| Sequence-based reagent | Intergenic region | This paper | ChIP qPCR Primer | (forward: TTTTCTCACATTGCCCCTGT; reverse: TCAATGCTGTACCAGGCAAA) |
| Sequence-based reagent | NCL | This paper | ChIP qPCR Primer | (forward: CTACCACCCTCATCTGAATCC; reverse: TTGTCTCGCTGGGAAAGG) |
| Sequence-based reagent | NME1 | This paper | ChIP qPCR Primer | (forward: GGGGTGGAGAGAAGAAAGCA; reverse: TGGGAGTAGGCAGTCATTCT) |
| Sequence-based reagent | PLD6 | This paper | ChIP qPCR Primer | (forward: GCTGTGGGTCCCGGATTA; reverse: CCTCCAGAGTCAGAGCCA) |
| Sequence-based reagent | TAF4B | This paper | ChIP qPCR Primer | (forward: AAGGTCGTCGCTCACAC, reverse: GCGTGGCTATATAAACATGGCT) |
| Sequence-based reagent | RPL22 | This paper | ChIP qPCR Primer | (forward: CCGTAGCTTCCTCTCTGCTC, reverse: ACCTCTTGGGCTTCCTGTCT) |
| Sequence-based reagent | CCND2 | This paper | ChIP qPCR Primer | (forward: GCCAGCTGCTGTTCTCCTTA, reverse: CCCCTCCTCCTTTCAATCTC) |
| Sequence-based reagent | DNA oligos for Hi-C | This paper | DNA oligos for Hi-C | GATCCCCAAATCT |
| Sequence-based reagent | DNA oligos for Hi-C | This paper | DNA oligos for Hi-C | GATCAGAT[BtndT]TGGG |
| Commercial assay or kit | Duolink In Situ PLA Probe Anti-Rabbit PLUS, Affinity purified Donkey anti-Rabbit IgG (H+L) | Sigma-Aldrich | Cat# DUO92002 | |
| Commercial assay or kit | Duolink In Situ PLA Probe Anti-Mouse MINUS, Affinity purified Donkey anti-Mouse IgG (H+L) | Sigma-Aldrich | Cat# DUO92004 | |
| Commercial assay or kit | Duolink In Situ Detection Reagents Red | Sigma-Aldrich | Cat# DUO92008 | |
| Commercial assay or kit | Duolink In Situ Wash Buffers, Fluorescence | Sigma-Aldrich | Cat# DUO82049 | |
| Commercial assay or kit | RNeasy Mini Kit (250) | QIAGEN | Cat# 74106 | |
| Commercial assay or kit | RNase-free DNase kit | QIAGEN | Cat# 79254 | |
| Commercial assay or kit | NEBNext Ultra II Directional RNA Second Strand Module | NEB | Cat# E7550 L | |
| Commercial assay or kit | NEBNext Poly(A) mRNA Magnetic Isolation Module | NEB | Cat# E7490 L | |
| Commercial assay or kit | NEBNext ChIP-Seq Library Prep Master Mix Set for Illumina | NEB | Cat# E6240 L | |
| Commercial assay or kit | NEBNext Ultra II DNA Library Prep Kit for Illumina | NEB | Cat# E7645 L | |
| Commercial assay or kit | NEBNext Multiplex Oligos for Illumina (Dual Index Primers Set 1) | NEB | Cat# E7600 S | |
| Commercial assay or kit | NextSeq 500/550 High Output Kit v2 (75 cycles) | Illumina | Cat# FC-404-2005 | |
| Commercial assay or kit | NextSeq 1000/2000 P2 Reagents (100 Cycles) v3 | Illumina | Cat# 20046811 | |
| Commercial assay or kit | Quant-iT Pico Green | Thermo Fisher Scientific Inc | Cat# P7589 | |
| Commercial assay or kit | NGS Fragment High Sensitivity Analysis Kit (1–6000 bp) | Agilent | Cat# DNF-474-0500 | |
| Commercial assay or kit | NGS Fragment High Sensitivity Small DNA Fragment Analysis Kit, 50–1500 bp | Agilent | Cat# DNF-477-0500 | |
| Commercial assay or kit | Standard Sensitivity RNA Analysis Kit (15 nt), 500 samples | Agilent | Cat# DNF-471-0500 | |
| Commercial assay or kit | ChIP DNA Clean & Concentrator | Zymo Research Europe GmbH | Cat# D5205 | |
| Chemical compound, drug | DRB | Sigma-Aldrich | Cat# D1916-50MG | |
| Chemical compound, drug | Doxycycline | Sigma-Aldrich | Cat # D9891-1G | |
| Chemical compound, drug | Polybrene | Sigma-Aldrich | Cat# 107689-100G | |
| Chemical compound, drug | 4-Hydroxytamoxifen | Sigma-Aldrich | Cat# H7904-5MG | |
| Chemical compound, drug | X-tremeGENE HP Transfection Reagent | Roche | Cat# 06 366 244 001 | |
| Chemical compound, drug | Hoechst 33342 | Sigma-Aldrich | Cat# B2261 | |
| Chemical compound, drug | Dynabeads Protein A | Life Technologies GmbH | Cat# 10002D | |
| Chemical compound, drug | Dynabeads Protein G | Life Technologies GmbH | Cat# 10004D | |
| Chemical compound, drug | Formaldehyde (37%) | Roth | Cat# 4979.1 | |
| Chemical compound, drug | ConA-coated magnetic beads | Polysciences Europe | Cat# 86057-10 | |
| Chemical compound, drug | AmpureXP beads (SPRI select reagent) | Beckman Coulter | Cat# B23318 | |
| Chemical compound, drug | MyOne Streptavidin C1 beads | Thermo Fisher Scientific | Cat# 65601 | |
| Chemical compound, drug | Accutase | Sigma-Aldrich | Cat# A6964-500ML | |
| Chemical compound, drug | Digitonin | Merck | Cat# 300410-1GM | |
| Chemical compound, drug | DpnII | NEB | Cat# R0543M | |
| Chemical compound, drug | rSAP | NEB | Cat# M0371L | |
| Chemical compound, drug | T4 DNA Ligase | NEB | Cat# M0202M | |
| Software, algorithm | Bcl2fastq Conversion Software v1.1.0 | Illumina | ||
| Software, algorithm | FastQC v0.11.5 | Wingett and Andrews, 2018 | ||
| Software, algorithm | Bowtie2 v2.3.5.1 | Langmead and Salzberg, 2012 | ||
| Software, algorithm | Bedtools v2.26 | Quinlan and Hall, 2010 | ||
| Software, algorithm | plotgardener v1.012 | Kramer et al., 2022 | ||
| Software, algorithm | Integrated Genome Browser v9.1.6 | Nicol et al., 2009 | ||
| Software, algorithm | R v4.1.1 and v.3.6.3 | R Development Core Team, 2022 | ||
| Software, algorithm | MACS v2.1.2 | Zhang et al., 2008 | ||
| Software, algorithm | SICER v1.1 | Xu et al., 2014 | ||
| Software, algorithm | STARaligner v2.7.9a | Dobin et al., 2013 | ||
| Software, algorithm | DESeq2 v1.34 | Love et al., 2014 | ||
| Software, algorithm | HiC-Pro v2.11.4 | Servant et al., 2015 | ||
| Software, algorithm | hichipper v0.7.7 | Lareau and Aryee, 2018 | ||
| Software, algorithm | GenomicInteractions v1.28 | Harmston et al., 2015 | ||
| Software, algorithm | ggplot2 v3.3.5 | Wickham, 2009 | ||
| Software, algorithm | MEME Suite software toolkit v5.3.3 | Bailey et al., 2015 | ||
| Software, algorithm | clusterProfiler v4.2.2 | Wu et al., 2021 | ||
| Software, algorithm | AnnotationDbi v1.56.2 | Pagès et al., 2024 | ||
| Software, algorithm | igraph v1.2.11 | Csardi and Nepusz, 2006 | ||
| Software, algorithm | Cytoscape v3.9 | Shannon et al., 2003 | ||
| Software, algorithm | GSEA v4.0.2 | Subramanian et al., 2005 | ||
| Software, algorithm | ngs.plot v2.41.3 | Shen et al., 2014b | ||
| Software, algorithm | biomaRt v 2.40.5 | Durinck et al., 2005 | ||
| Software, algorithm | Prism 5.0 Software | GraphPad | ||
| Software, algorithm | Operetta CLS High Content Imaging System | PerkinElmer | ||
| Software, algorithm | Harmony High Content Imaging and Analysis Software | PerkinElmer |
Additional files
-
MDAR checklist
- https://cdn.elifesciences.org/articles/94407/elife-94407-mdarchecklist1-v1.pdf
-
Source code 1
Analysis of ChIP sequencing data.
- https://cdn.elifesciences.org/articles/94407/elife-94407-code1-v1.zip
-
Source code 2
Analysis of HiC and HiChIP data.
- https://cdn.elifesciences.org/articles/94407/elife-94407-code2-v1.zip
Download links
A two-part list of links to download the article, or parts of the article, in various formats.
Downloads (link to download the article as PDF)
Open citations (links to open the citations from this article in various online reference manager services)
Cite this article (links to download the citations from this article in formats compatible with various reference manager tools)
Association with TFIIIC limits MYCN localisation in hubs of active promoters and chromatin accumulation of non-phosphorylated RNA polymerase II
eLife 13:RP94407.
https://doi.org/10.7554/eLife.94407.3


