The transcriptional landscape underlying larval development and metamorphosis in the Malabar grouper (Epinephelus malabaricus)
- Marine Climate Change Unit, Okinawa Institute of Science and Technology Graduate University, Japan
- Centre for Sustainable Tropical Fisheries and Aquaculture, College of Science and Engineering, James Cook University, Australia
- Computational Neuroethology Unit, Okinawa Institute of Science and Technology Graduate University, Japan
- Marine Eco-Evo-Devo Unit, Okinawa Institute of Science and Technology Graduate University, Japan
- Marine Research Station, Institute of Cellular and Organismic Biology, Academia Sinica, Taiwan
- Australian Research Council Centre of Excellence for Coral Reef Studies, James Cook University, Australia
Figures
Figure 1
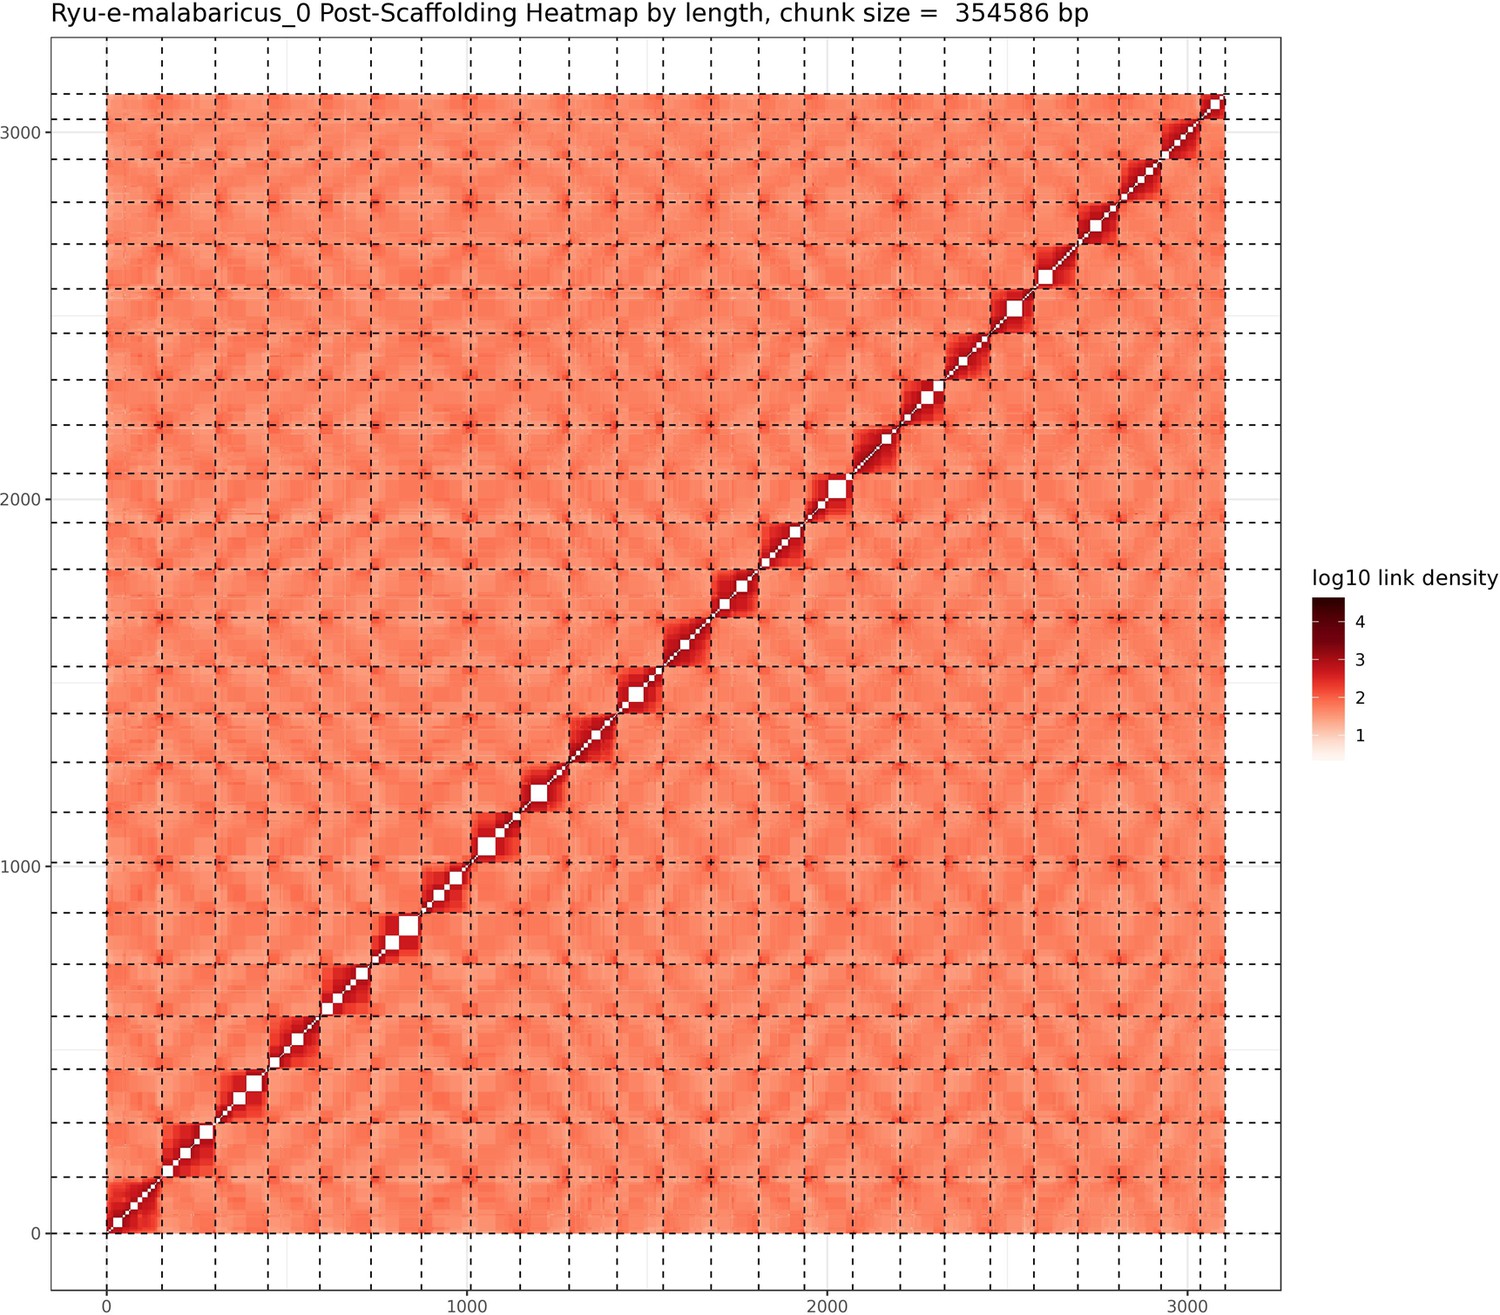
Hi-C contact map after scaffolding.
E. malabaricus genome contig contact matrix using Hi-C data. The color bar indicates contact density from dark red (high) to white (low).
Figure 2 with 1 supplement
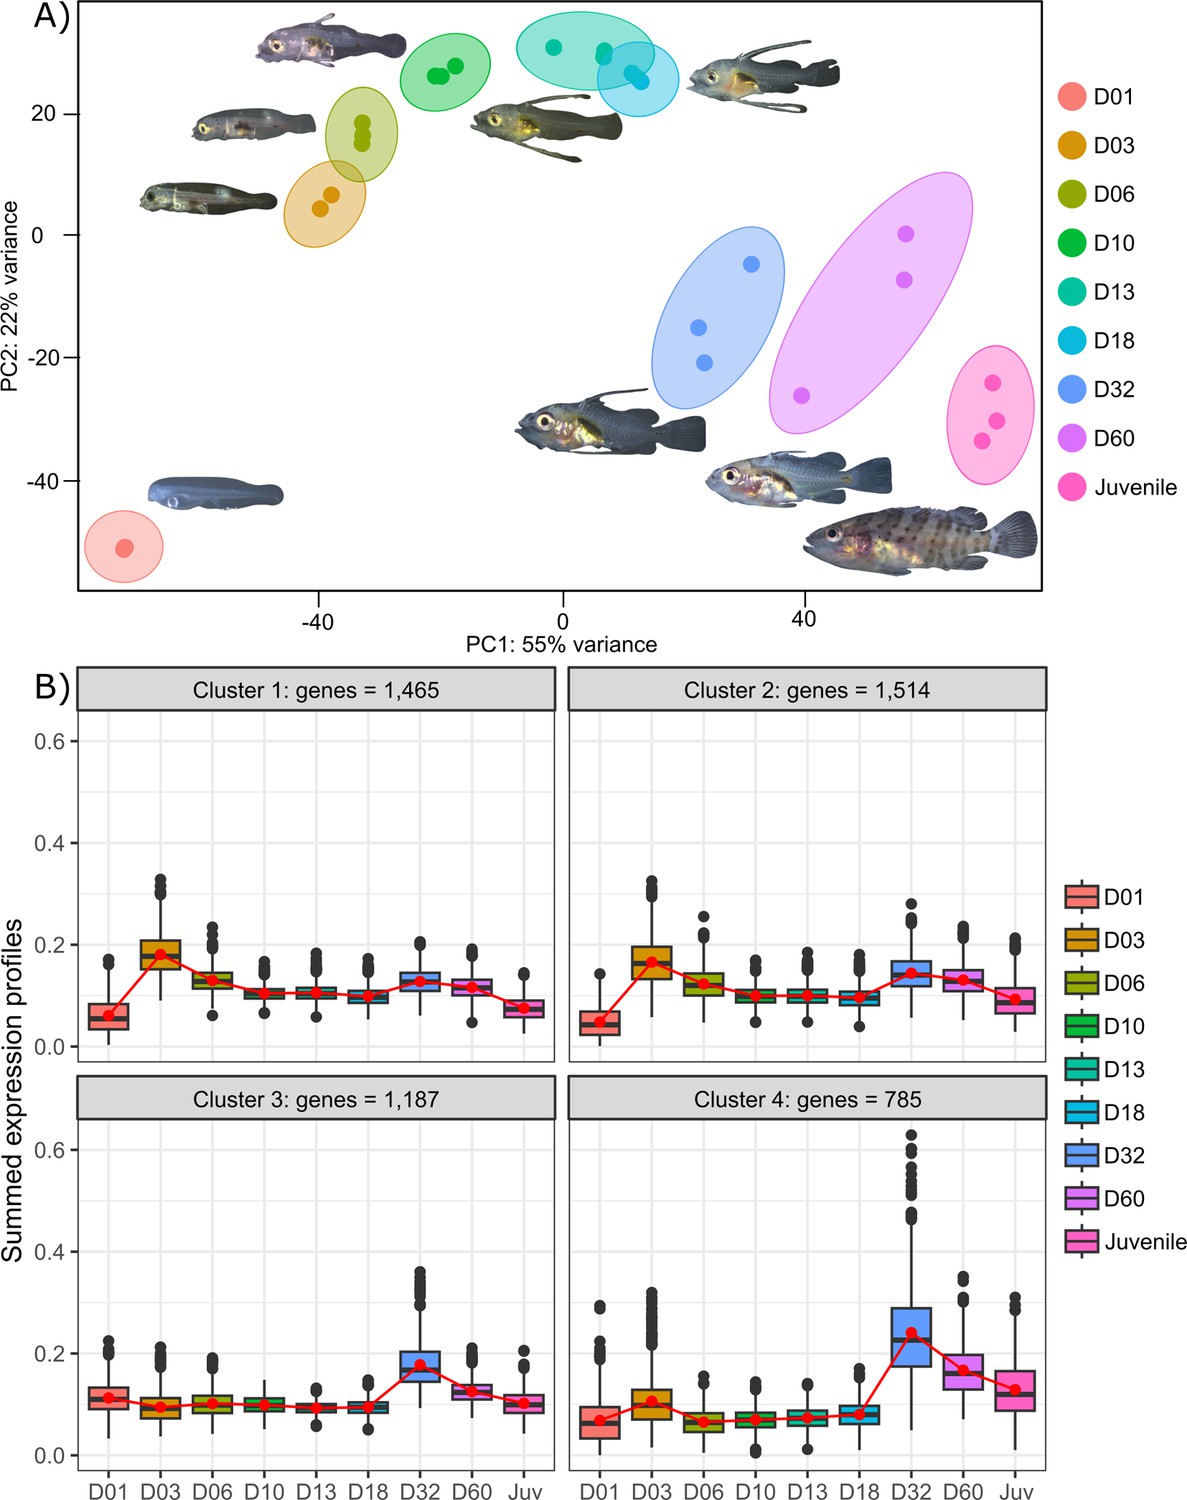
Transcriptomic results of E. malabaricus larval development.
(A) Principal component analysis of different larval stages using variance stabilizing transformed complete transcriptome. (B) Cluster analysis using the coseq R package, focusing on genes that are upregulated on days 3 and/or 32. The number of genes in each cluster are shown above each graph. Adjusted p-values and functional annotations for the four gene clusters in this figure can be found in ource data 2. Gene expression data was generated from whole larvae.
Figure 2—figure supplement 1
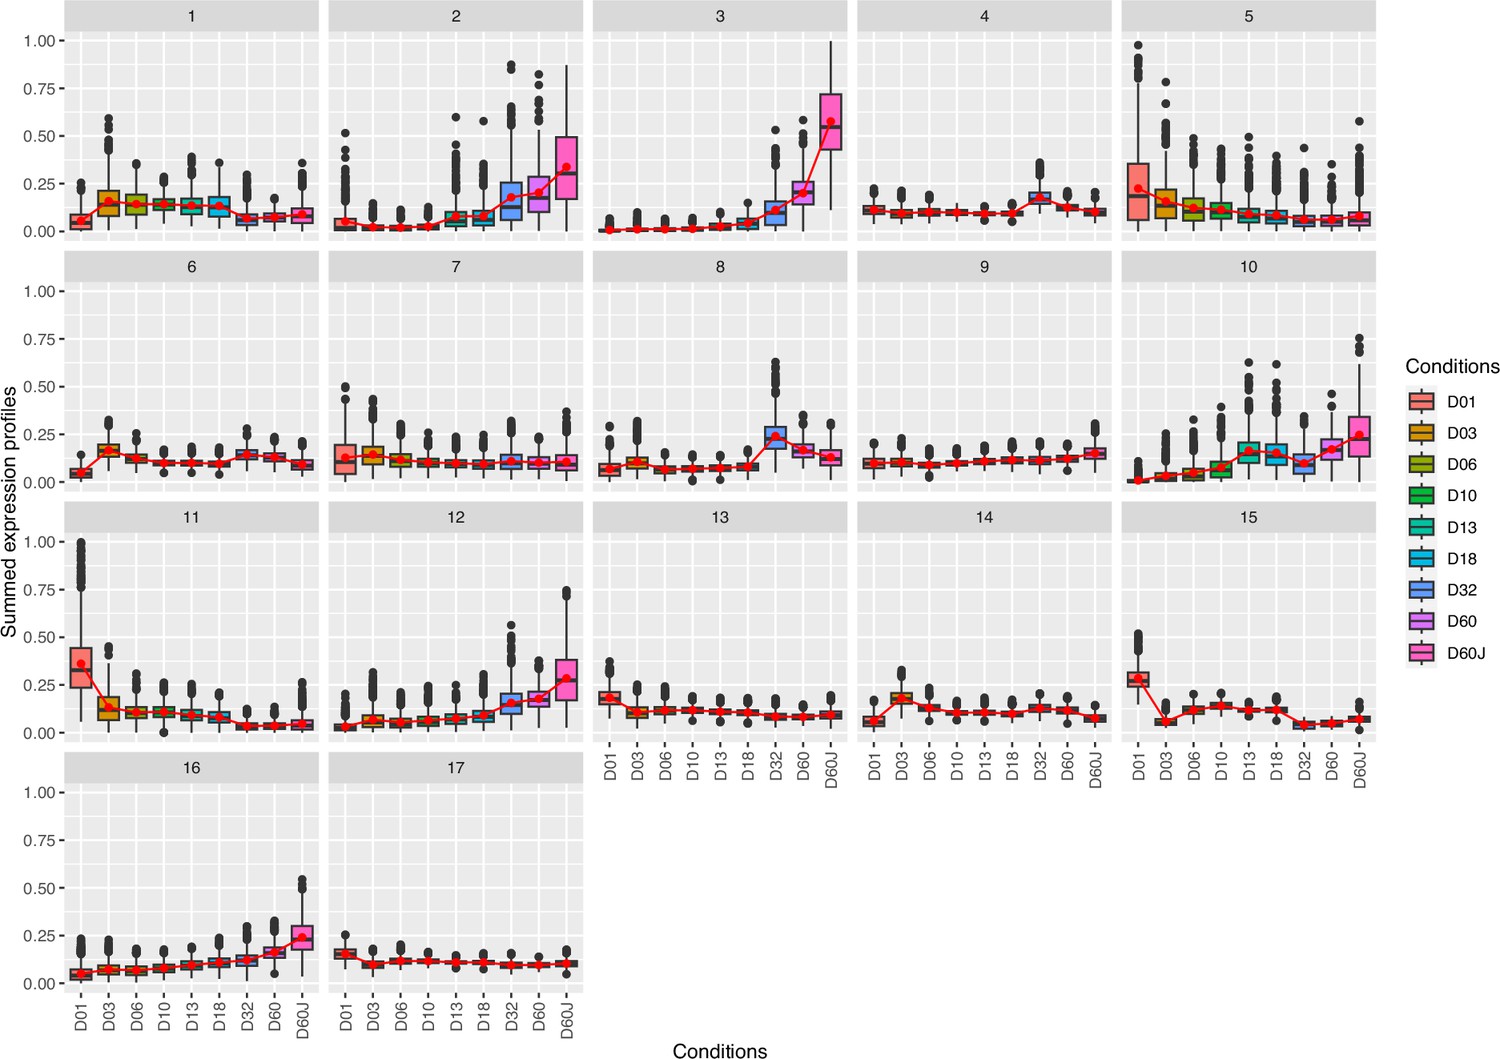
Complete cluster analysis of differentially expressed genes.
Cluster analysis of differentially expressed genes n=22,135, likelihood ratio test (LRT) analysis (full model: design = ~dph, reduced model: reduced = ~1, adjusted p-value threshold: 0.001). Genes contained in clusters: (1) 925, (2) 382, (3) 548, (4) 1193, (5) 804, (6) 1503, (7) 2025, (8) 786, (9) 2399, (10) 570, (11) 801, (12) 1141, (13) 2439, (14) 1471, (15) 681, (16) 1702, (17) 2765.
Figure 3
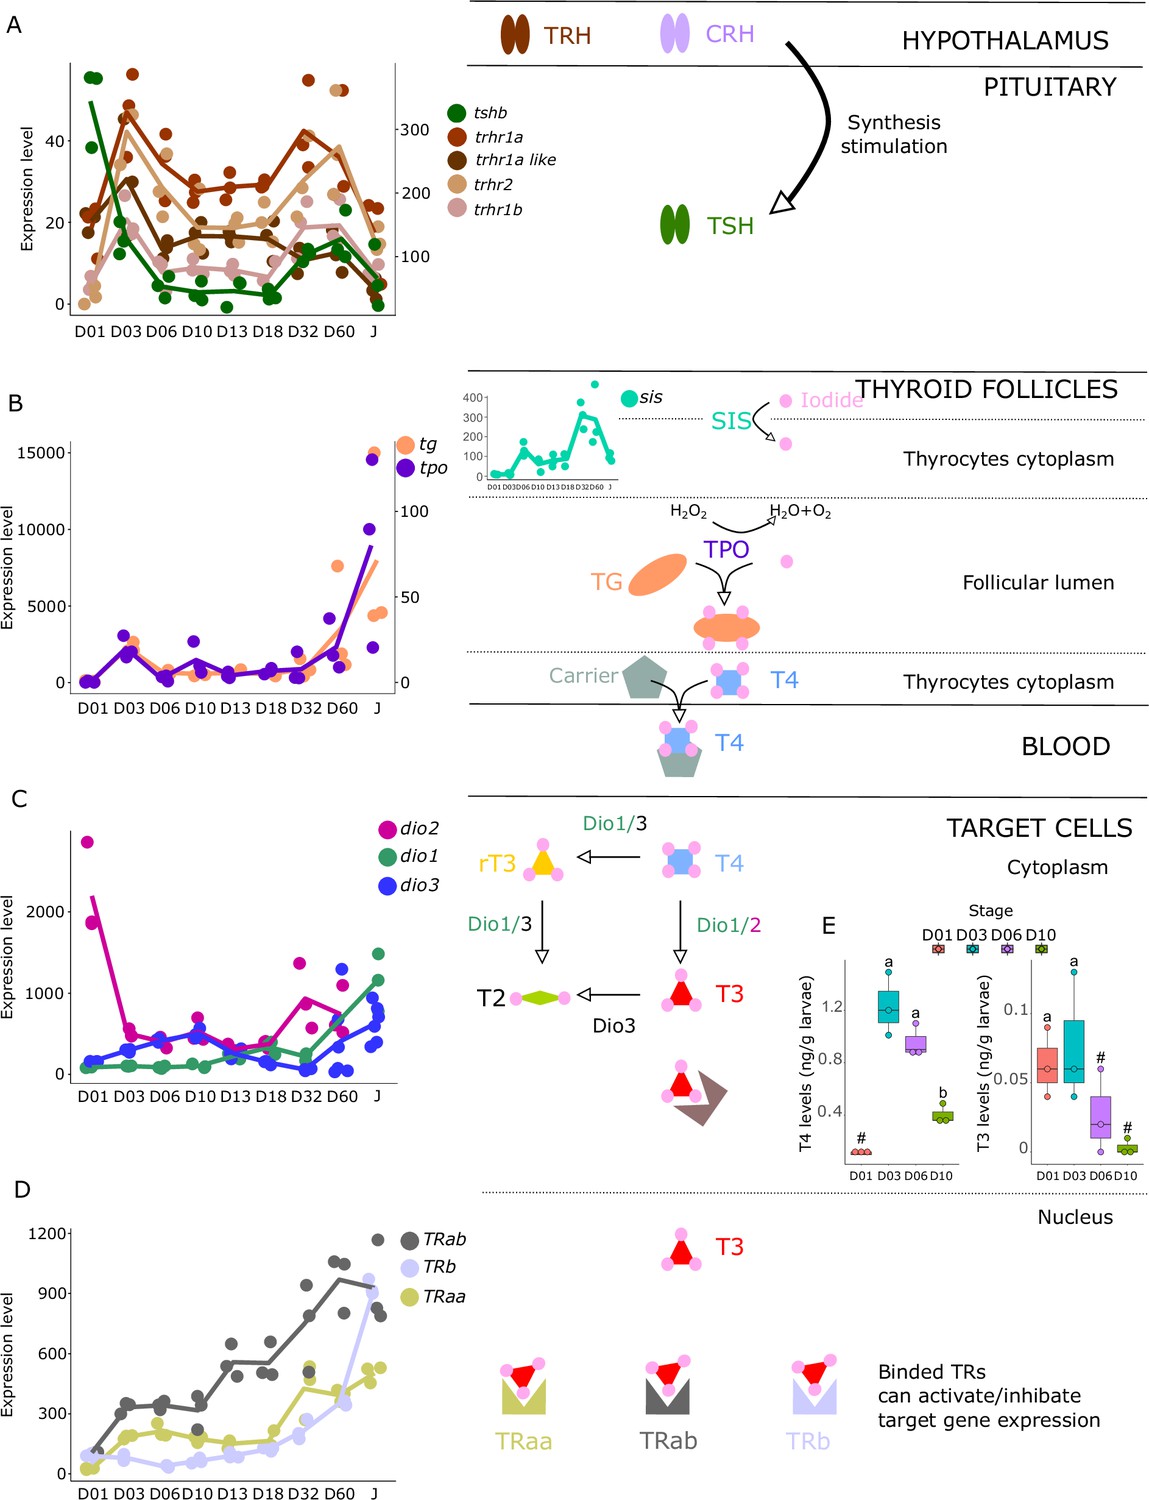
Expression levels of thyroid hormones (TH) signaling pathway genes in E. malabaricus.
(A) TRH: thyroid releasing hormone, TSH: thyroid stimulating hormone. (B), DUOX: dual oxidase, TG: thyroglobulin, TPO: thyroperoxidase, SIS: sodium iodine symporter. (C) DIO: deiodinase. (D) TR: thyroid hormone receptor. Colored lines join the average values of each stage. Biochemical pathways adapted from Roux et al., 2023. (E) T4 and T3 levels (in ng/g of larvae) during early larval development. Three biological replicates consisting of pooled larvae were analysed at each stage (D01 n = 120 larvae per replicate, D03 n = 120 larvae per replicate, D06 n = 60 larvae per replicate, D10 n = 40 larvae per replicate). # indicates that the value is below the quantification limit, and different letters indicate significant differences <0.05 (one-way ANOVA followed by a Tukey HSD test for T4 levels only as no significant differences were observed after ANOVA for T3 levels). Gene expression data was generated from whole fish. Expression levels were derived from DESeq2 normalized gene counts.
-
Figure 3—source data 1
Raw thyroid hormone and cortisol measurements.
- https://cdn.elifesciences.org/articles/94573/elife-94573-fig3-data1-v2.xlsx
Figure 4
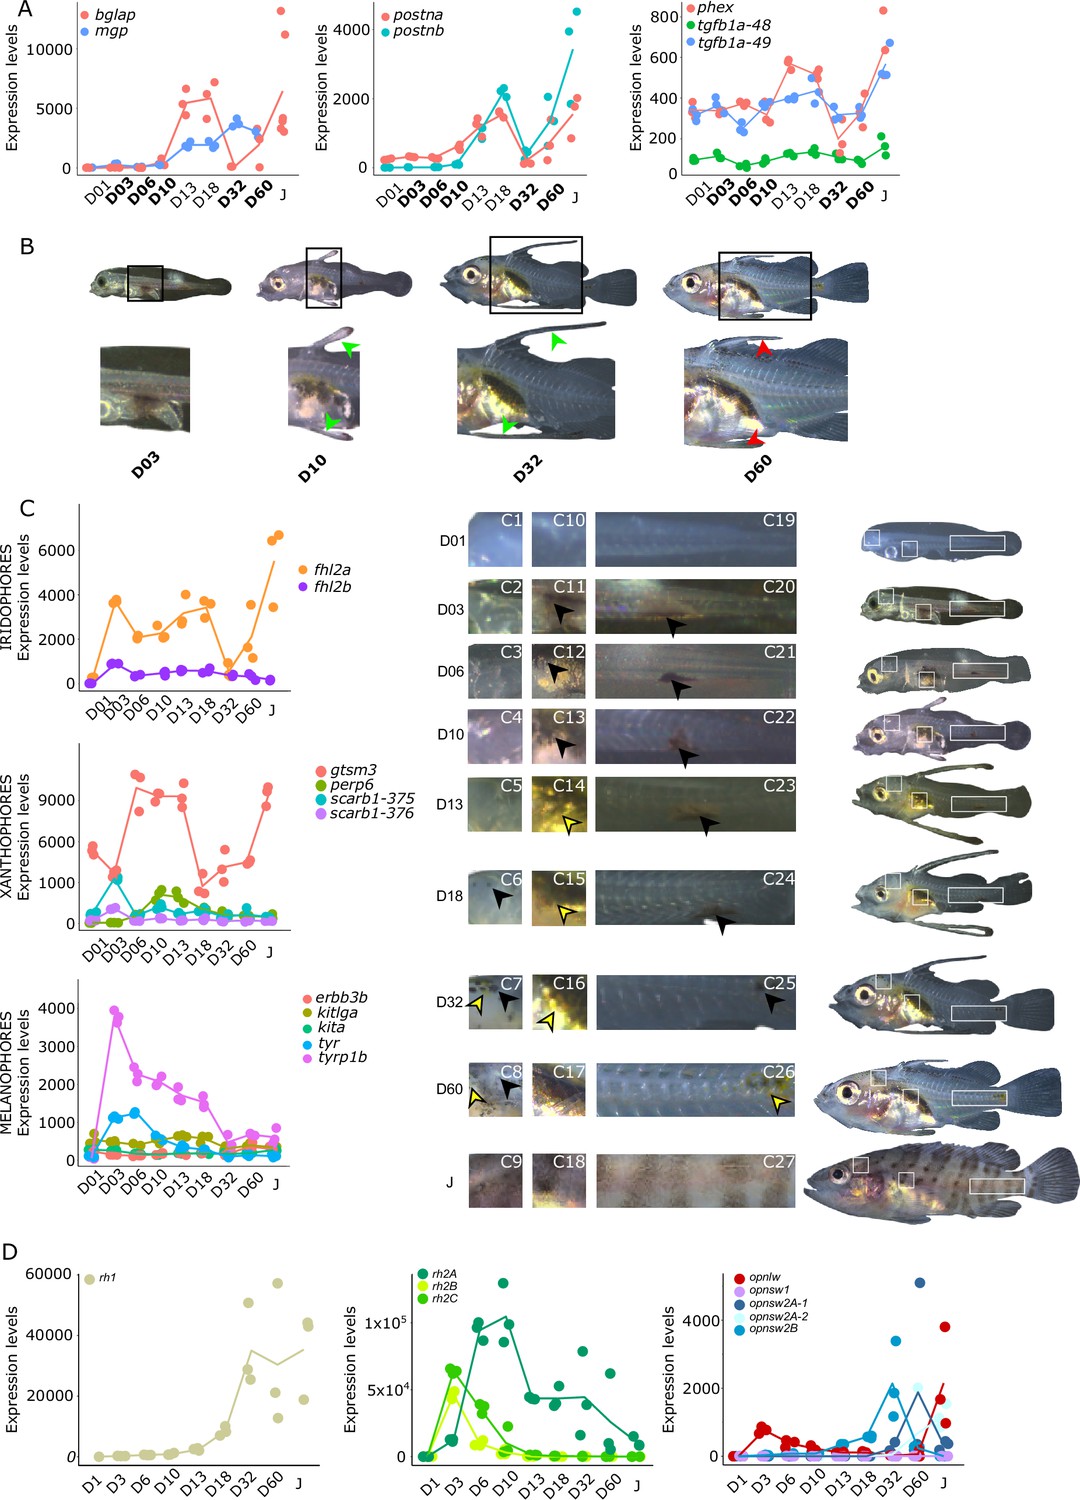
Biological processes likely to be under thyroid hormones (TH) control during E. malabaricus metamorphosis.
(A) Expression patterns of key genes involved in the ossification process and known to be regulated by TH in teleosts. Bglap: bone gamma carboxyglutamate protein, mgp: matrix gla protein, postna: periostin a, postnb: periostine b, phex: phosphate regulating endopeptidase homolog X linked. (B) Pictures of E. malabaricus at D03, D10, D32, and D60 illustrate the elongation of the dorsal and pelvic floating spines (green arrow heads at D10 and D32) and their regression (red arrow heads at D60). (C) Expression patterns of genes involved in pigmentation. Three areas of interest were chosen to illustrate the appearance of melanophores (C6 to C8: at the top of the head, C11 to C13: above internal organs, and, C20 to C25: close to the caudal peduncle,) and xanthophores (C7 to C8 at the top of the head, C14 to C16 above internal organs and C26: close to the caudal peduncle). (D) Expression patterns of genes encoding for the rhodopsins (rh1) and the visual cone opsins (rh2A, rh2B, rh2C, opnlw, opnsw1, opnsw2A-1, opnsw2A-2, opnsw2B). Gene expression data was generated from whole fish. Expression levels were derived from DESeq2 normalized gene counts.
Figure 5 with 1 supplement
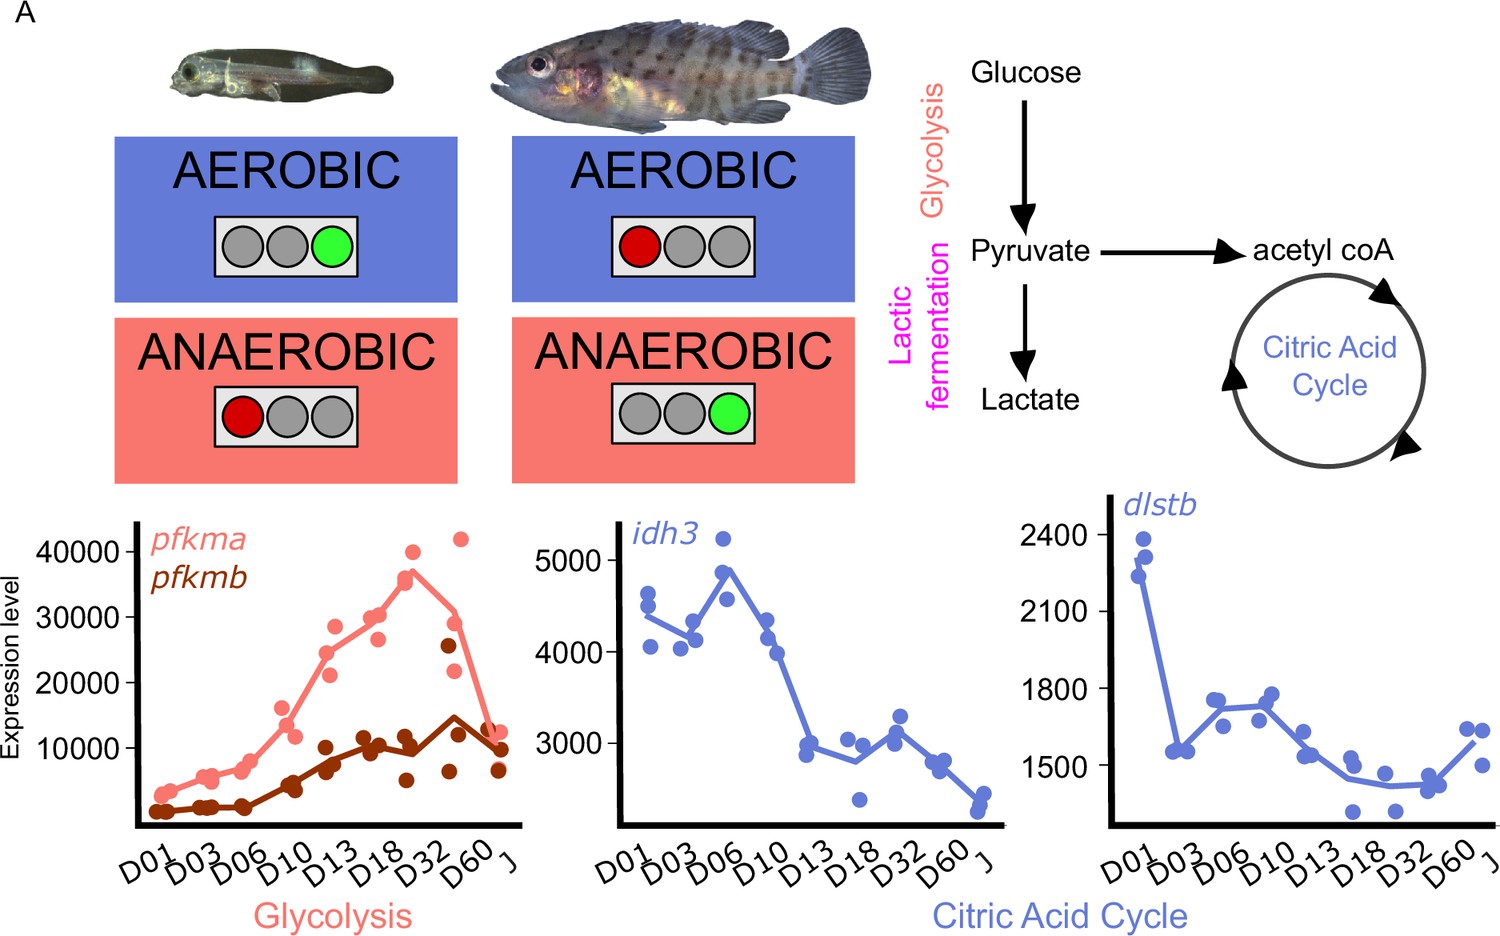
Metabolic transition and corticoid expression levels of E. malabaricus.
(A) Schematization of the metabolic transition occuring during E. malabaricus larval development showing that young larvae rely on aerobic metabolism whereas older larvae rely on anaerobic metabolism. Expression levels of genes involved in glycolysis (pfkma, pfkmb), krebs cycle (idh3, dlstb). Gene expression data was generated from whole fish. Expression levels were derived from DESeq2 normalized gene counts.
Figure 5—figure supplement 1
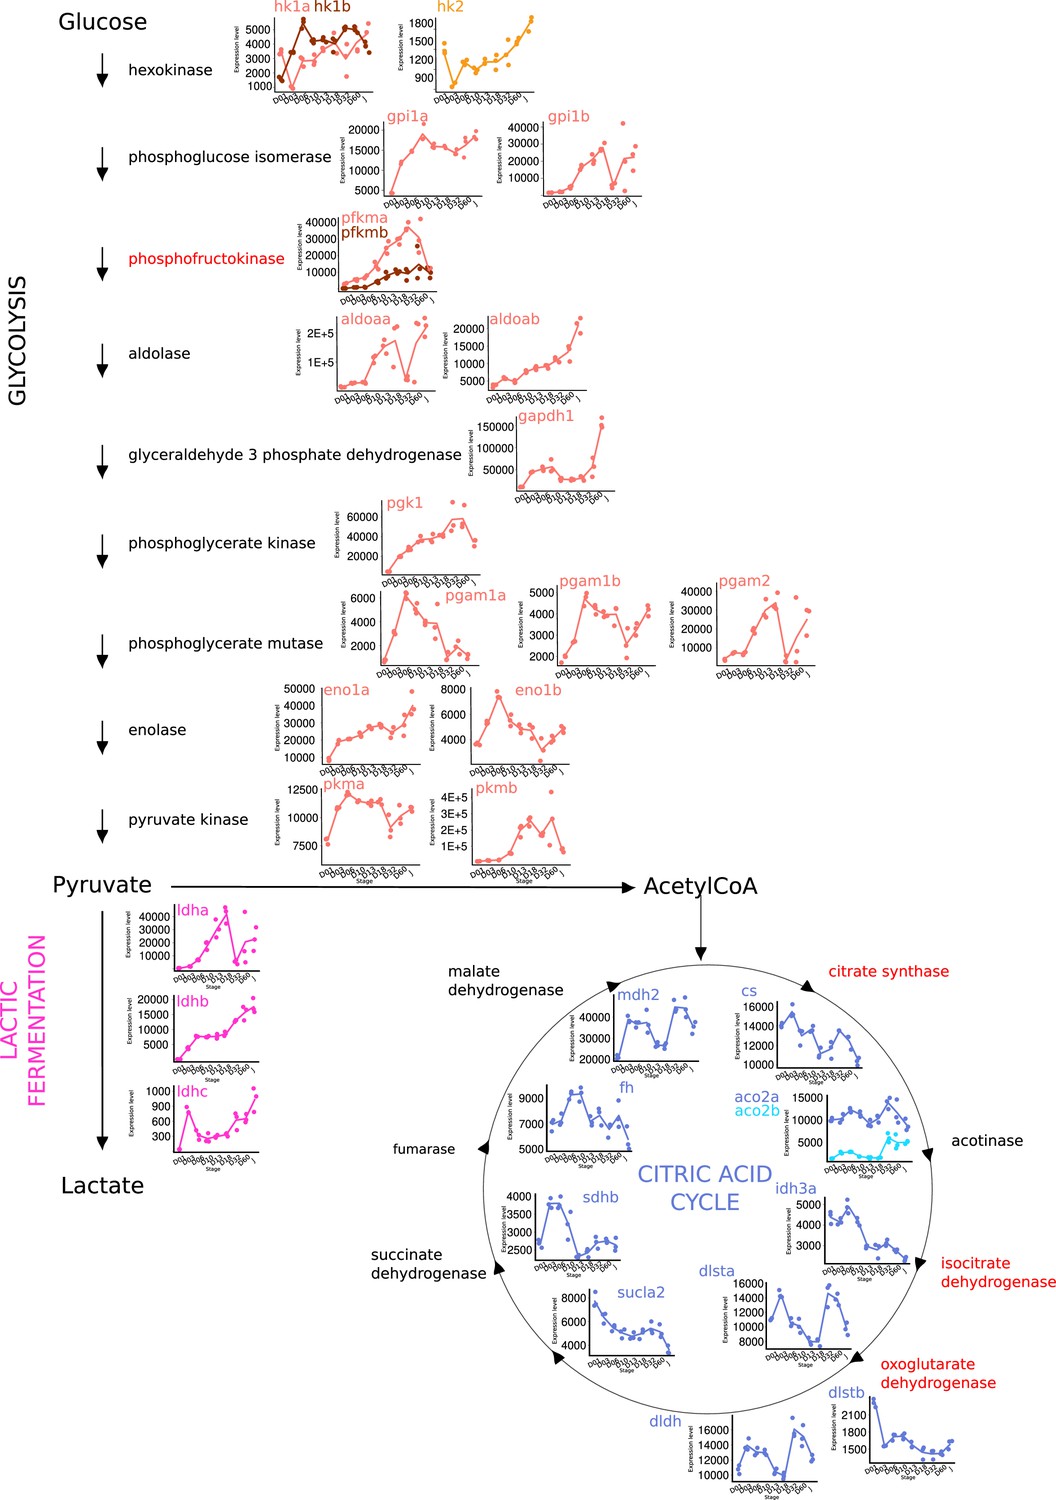
Metabolic shift during grouper metamorphosis.
Expression levels of genes involved in glycolysis, lactic fermentation, and citric acid cycle at each developmental stage (D01, D03, D06, D10, D13, D18, D60, J) extracted from transcriptomic data. Enzyme highlighted in red represents rate-limiting steps for each metabolic pathway.
Figure 6
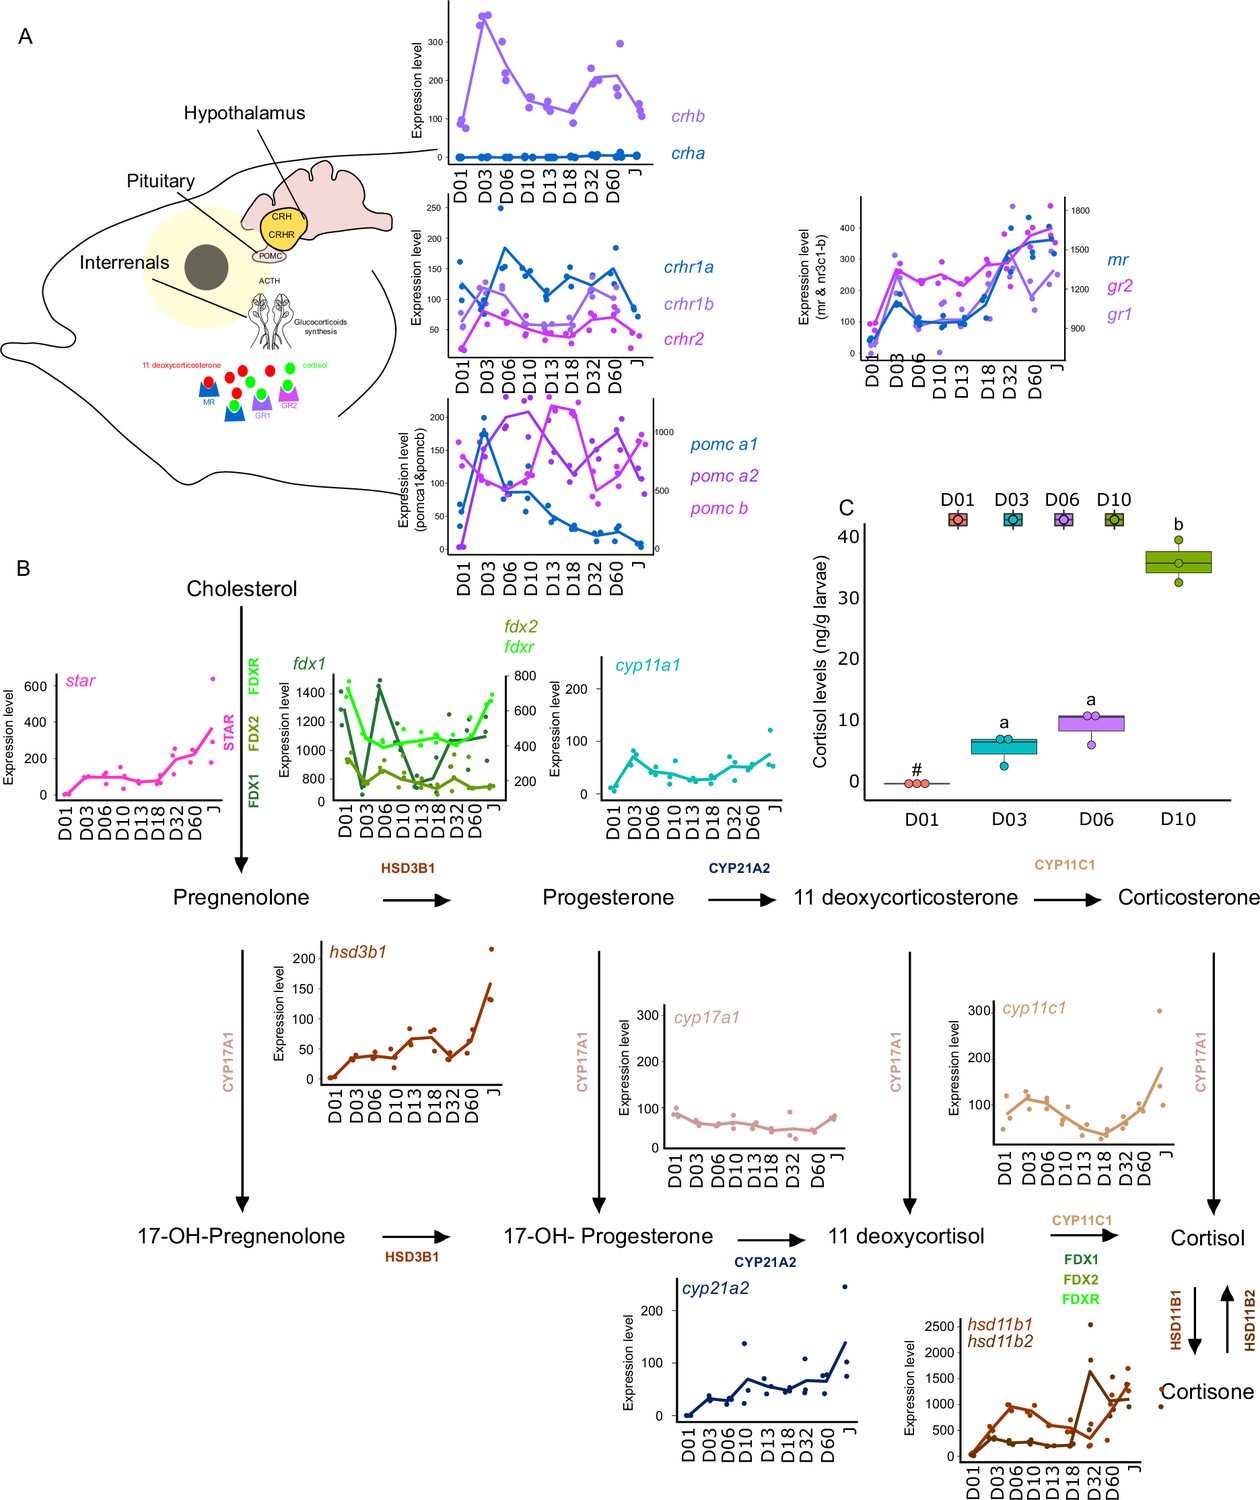
Expression levels of genes involved in the hypothalamo-pituitary-interrenal axis (HPI) and corticoid synthesis.
(A) Expression levels of genes involved in HPI: crha (corticotropin releasing hormone a), crhb (corticotropin releasing hormone b), crhr1a (corticotropin releasing hormone receptor 1 a), crhr1b (corticotropin release hormone receptor 1b), crhr2 (cortico release hormone receptor 2), pomc-a1 (propiomelanocortin a1), pomc-a2 (propiomelanocortin a2), pomc-b (propiomelanocortin b), mr (mineralocorticoid receptor), gr1 (glucocorticoid receptor 1), gr2 (glucocorticoid receptor 2). (B) Expression levels of genes involved in corticoids synthesis: star (steroidogenic acute regulatory protein), fdx1 (ferredoxine 1), fdx2 (ferredoxine 2), fdxr (ferredoxine reductase), cyp11a1 (Cytochrome P450 Family 11 Subfamily A Member 1), hsd3b1 (Hydroxysteroid dehydrogenases 3β1), cyp17a1 (Cytochrome P450 Family 17 Subfamily A Member 1), cyp21a2 (Cytochrome P450 Family 21 Subfamily A Member 2), cyp11c1 (Cytochrome P450 Family 11 Subfamily C Member 1), hsd11b1, hsd11b2 (Hydroxysteroid dehydrogenase 11 3β1&2). (C) Cortisol levels (in ng/g of larvae) during early larval development. Three biological replicates consisting of pooled larvae were analysed at each stage (D01 n = 120 larvae per replicate, D03 n = 120 larvae per replicate, D06 n = 60 larvae per replicate, D10 n = 40 larvae per replicate). # indicates that the value is below the quantification limit, and different letters indicate significant differences <0.05 (one-way ANOVA followed by a Tukey HSD test). Gene expression data was generated from whole fish. Expression levels were derived from DESeq2 normalized gene counts.
Tables
Table 1
PacBio HiFi data generated for E. malabaricus genome assembly based on three SMRT cells.
| SMRT cell 1 | SMRT cell 2 | SMRT cell 3 | Total | |
|---|---|---|---|---|
| ≥Q20 Reads | 322,103 | 442,205 | 1,373,662 | 2,137,970 |
| ≥Q20 Yield (bp) | 8,468,697,810 | 11,690,872,687 | 26,355,056,210 | 46,514,626,707 |
| ≥Q20 Read Length (mean, bp) | 26,291 | 26,437 | 19,185 | - |
Table 2
Statistics of the Epinephelus malabaricus chromosome-scale genome assembly, scaffolding and gene annotation.
| Contig assembly size | 1,092,599,927 bp |
|---|---|
| Number of contigs | 298 |
| Contig N50 | 7,396,124 bp |
| Largest contig | 26,202,351 bp |
| Mean base-level coverage PacBio HiFi | 43 X |
| Contig length contained in scaffolds | 92.8% |
| Contigs contained in scaffolds | 90.5% |
| Scaffolded assembly size | 1,027,628,325 bp |
| Number of scaffolds | 24 |
| Scaffold N50 | 43,313,630 bp |
| Largest Scaffold | 50,623,973 bp |
| Smallest Scaffold | 22,540,365 bp |
| Non-ATGC characters | 36,700 bp (0.003%) |
| GC contents | 41.3% |
| Genome: BUSCO completeness | 3,406 (93.6%) |
| Genome: Complete and single copy | 3,359 (92.3%) |
| Genome: Complete and duplicated | 47 (1.3%) |
| Genome: Fragmented | 48 (1.3%) |
| Genome: Missing | 186 (5.1%) |
| Number of protein-coding genes | 26,140 |
| Average gene length | 20,718 bp |
| Average CDS length | 1,750 bp |
| Average exons per gene | 11.2 |
| Repeat contents (DFAM) | 56.4 % |
| Number of protein-coding genes | 26,140 |
| Gene annotation: BUSCO completeness | 3476 (95.5%) |
| Gene annotation: Complete and single copy | 3,429 (94.2%) |
| Gene annotation: Complete and duplicated | 47 (1.3%) |
| Gene annotation: Fragmented | 31 (0.9%) |
| Gene annotation: Missing | 133 (3.6%) |
Table 3
Detailed repeat annotation results using the DFAM repeat database.
| Total Genome length | 1,027,628,325 bp | ||
|---|---|---|---|
| Bases masked | 579,515,295 bp (56.4 %) | ||
| number of elements | length occupied | percentage of sequence | |
| Retroelements | 660,880 | 123,046,856 | 11.97% |
| SINEs: | 74,049 | 7,798,000 | 0.76% |
| Penelope | 25,476 | 3,705,071 | 0.36% |
| LINEs: | 422,597 | 86,199,668 | 8.39% |
| CRE/SLACS | 1 | 100 | 0.00% |
| L2/CR1/Rex | 266,320 | 53,565,106 | 5.21% |
| R1/LOA/Jockey | 10,918 | 2,170,694 | 0.21% |
| R2/R4/NeSL | 11,286 | 3,660,204 | 0.36% |
| RTE/Bov-B | 47,451 | 10,563,888 | 1.03% |
| L1/CIN4 | 35,250 | 8,411,019 | 0.82% |
| LTR elements: | 164,234 | 29,049,188 | 2.83% |
| BEL/Pao | 10,186 | 2,183,697 | 0.21% |
| Ty1/Copia | 4,658 | 823,228 | 0.08% |
| Gypsy/DIRS1 | 76,319 | 13,796,105 | 1.34% |
| Retroviral | 32,317 | 5,441,530 | 0.53% |
| DNA transposons | 1,604,009 | 296,558,272 | 28.86% |
| hobo-Activator | 799,713 | 138,795,609 | 13.51% |
| Tc1-IS630-Pogo | 138,975 | 24,805,298 | 2.41% |
| PiggyBac | 22,605 | 3,909,912 | 0.38% |
| Tourist/Harbinger | 161,216 | 38,134,353 | 3.71% |
| Other (Mirage, P-element, Transib) | 52,802 | 10,665,183 | 1.04% |
| Rolling-circles | 101,574 | 30,491,612 | 2.97% |
| Unclassified: | 669,818 | 111,877,701 | 10.89% |
| Total interspersed repeats: | 531,482,829 | 51.72% | |
| Small RNA: | 26,405 | 2,780,064 | 0.27% |
| Satellites: | 11,580 | 2,523,082 | 0.25% |
| Simple repeats: | 277,904 | 12,099,447 | 1.18% |
| Low complexity: | 29,110 | 1,563,810 | 0.15% |
Table 4
Morphological description of the larval and juvenile stages sampled for the transcriptomic analysis.
D01: 1 day post hatching (dph), D03: 3 dph, D10: 10 dph, D:13 13–15 dph, D18: 18–20 dph, D32: 32–34 dph, D60: ca. 60 dph, J: ca. 60 dph with juvenile phenotype. NL is “notochord length” for preflexion and flexion larvae, SL is “standard length” for postflexion and older stages, and TL is “total length” for all stages.
| Age (dph) | Timpoint/Stage | Morphological description | |
|---|---|---|---|
| 1 | 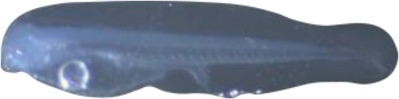 2.5 mm NL/2.7 mm TL 2.5 mm NL/2.7 mm TL | D01 | Newly hatched larva with a yolk sac; mouth unopened; eyes not pigmented; no pectoral fin |
| 3 | 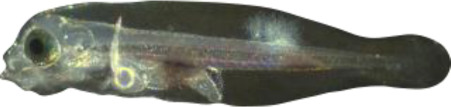 2.7 mm NL/2.9 mm TL 2.7 mm NL/2.9 mm TL | D03 | Yolk sac remains; the mouth is opened; eyes are pigmented; pectoral fins are formed; large melanophores appear on the ventral cavity and on the second half of the body |
| 6 | 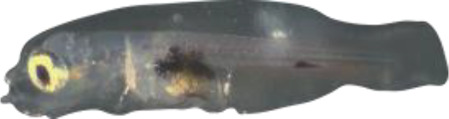 2.9 mm NL/3.1 mm TL 2.9 mm NL/3.1 mm TL | D06 | Yolk sac has been resorbed; dorsal-fin spine starts to form within the fin fold |
| 10 | 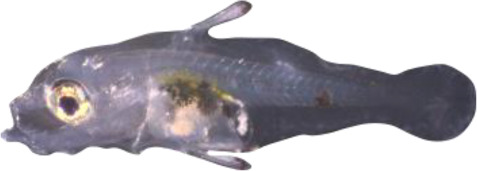 3.8 mm NL/4.0 mm TL 3.8 mm NL/4.0 mm TL | D10 | Embryonic fin fold start differentiating in anal and dorsal fin while second spine of dorsal fin and spines of pelvic fins begin to extend with some melanophores colonizing the tips and xanthophores start covering the ventral cavity |
| 13–15 | 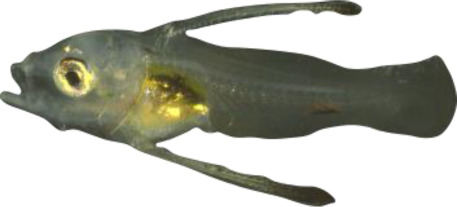 6.0 mm NL/6.4 mm TL 6.0 mm NL/6.4 mm TL | D13 | Spines of dorsal and pelvic fins grow. First spine of dorsal fin appears, second spine of dorsal fin and spines of pelvic fins become serrated; head spines appear, caudal-fin rays start to form, tip of the notochord begins to flex; xanthophores continue their expansion |
| 18–20 | 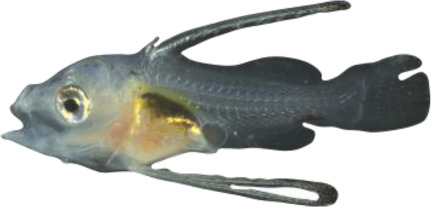 6.8 mm SL/8.3 mm TL 6.8 mm SL/8.3 mm TL | D18 | Notochord post-flexed; hypural bones are formed and in perpendicular position; caudal-fin rays are segmented; soft rays of dorsal and anal fins start to form and both fins start to form their final shape; fin rays are forming on upper part of the pectoral fin; soft rays of pelvic fins began to form; melanophores appeared on the top of the head and on the caudal peduncle |
| 30–32 | 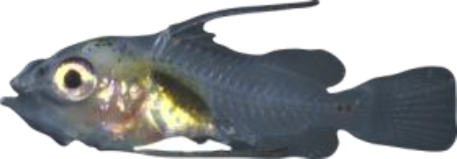 10.0 mm SL/12.8 mm TL 10.0 mm SL/12.8 mm TL | D32 | Second spine of dorsal fin and spines of pelvic fins start to regress; soft rays in dorsal, anal, and pectoral fins are weakly segmented, caudal fin becomes truncated shape; melanophores are appearing at the basis of dorsal spines and along the notochord, melanophores ventrally on the caudal peduncle disappears; xanthophores start colonizing the caudal peduncle |
| 60 | 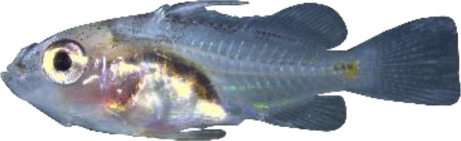 14.7 mm SL/19.1 mm TL 14.7 mm SL/19.1 mm TL | D60 | Second spine of dorsal fin and spines of pelvic fins continue their regression. Soft rays in pectoral and pelvic fins segmented; caudal-fin rays branched; anterior two bands of melanophores start appearing in some individuals: xanthophores are disappearing from the ventral cavity |
| 60 | 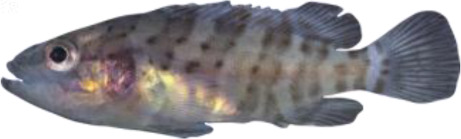 27.6 mm SL/34.6 mm TL 27.6 mm SL/34.6 mm TL | J | Juvenile stage; scales cover the body surface; second spine of dorsal fin and spines of pelvic fins fully regressed and became plain without hooks; caudal fin reached its final round shape; adult pigmentation pattern is more visible with alternate light and brownish vertical bands making lateral line system fully visible |
Table 5
Origin of protein sequences used for genome annotation in braker2.
| Species | Common name | Number of proteins | Source |
|---|---|---|---|
| Amphiprion ocellaris | Ocellaris clownfish | 48,668 | https://www.ncbi.nlm.nih.gov/protein |
| Danio rerio | zebrafish | 88,631 | https://www.ncbi.nlm.nih.gov/protein |
| Acanthochromis polyacanthus | spiny chromis damselfish | 36,648 | https://www.ncbi.nlm.nih.gov/protein |
| Oreochromis niloticus | Nile tilapia | 36,648 | https://www.ncbi.nlm.nih.gov/protein |
| Oryzias latipes | Japanese medaka | 47,623 | https://www.ncbi.nlm.nih.gov/protein |
| Poecilia reticulata | guppy | 45,692 | https://www.ncbi.nlm.nih.gov/protein |
| Salmo salar | Atlantic salmon | 112,302 | https://www.ncbi.nlm.nih.gov/protein |
| Stegastes partitus | bicolor damselfish | 31,760 | https://www.ncbi.nlm.nih.gov/protein |
| Takifugu rubripes | Japanese puffer | 49,529 | https://www.ncbi.nlm.nih.gov/protein |
| Epinephelus lanceolatus | Giant grouper | 42,970 | GCA_005281545.1, RefSeq |
| Epinephelus akaara | Red-spotted grouper | 23,923 | 4398b9f, Dryad |
| Total aa sequences | 1,155,478 |
Additional files
-
Supplementary file 1
Differentially expressed, upregulated, and downregulated genes between consecutive time points.
- https://cdn.elifesciences.org/articles/94573/elife-94573-supp1-v2.xlsx
-
MDAR checklist
- https://cdn.elifesciences.org/articles/94573/elife-94573-mdarchecklist1-v2.pdf
-
Source data 1
Raw gene count matrix of larval stages mapped against the malabar grouper genome.
- https://cdn.elifesciences.org/articles/94573/elife-94573-data1-v2.xlsx
-
Source data 2
Annotation of significantly differentially expressed genes which are upregulated at both D03 an D32.
- https://cdn.elifesciences.org/articles/94573/elife-94573-data2-v2.xlsx
Download links
A two-part list of links to download the article, or parts of the article, in various formats.
Downloads (link to download the article as PDF)
Open citations (links to open the citations from this article in various online reference manager services)
Cite this article (links to download the citations from this article in formats compatible with various reference manager tools)
The transcriptional landscape underlying larval development and metamorphosis in the Malabar grouper (Epinephelus malabaricus)
eLife 13:RP94573.
https://doi.org/10.7554/eLife.94573.3


