Overflow metabolism originates from growth optimization and cell heterogeneity
- School of Physics, Sun Yat-sen University, China
Figures
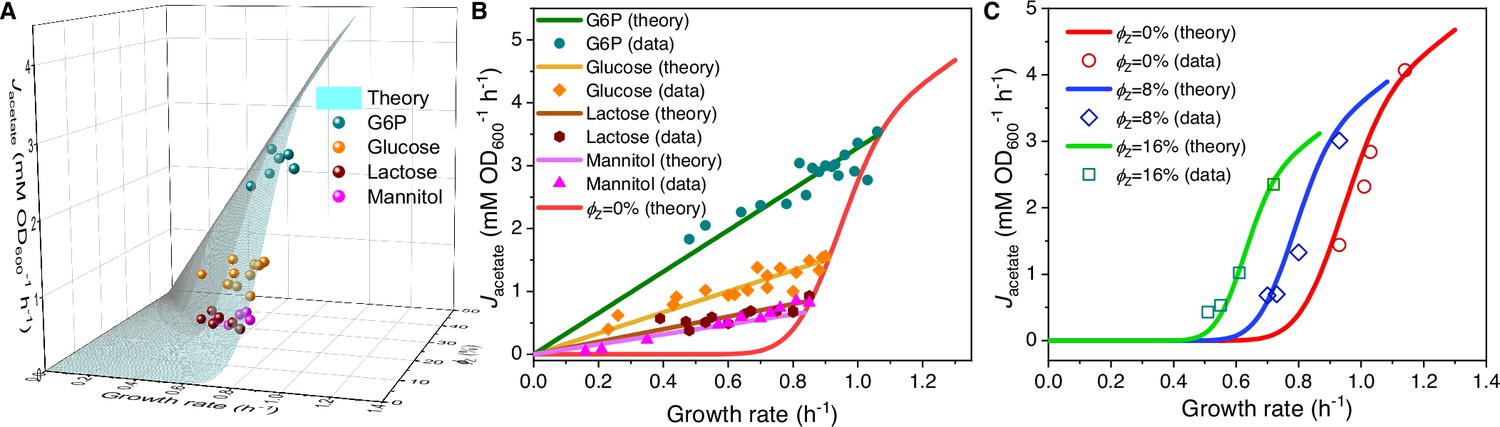
Figure 1

Model and results of overflow metabolism in E. coli.
(A) The central metabolic network of carbon source utilization. The Group A carbon sources (Wang et al., 2019) are labeled with green squares. (B) Coarse-grained model for Group A carbon source utilization. (C) Model predictions (see Equations S47 and S160) and experimental results (Basan et al., 2015; Holms, 1996) of overflow metabolism, covering the data for all the Group A carbon sources shown in (A). (D) Growth rate dependence of respiration and fermentation fluxes (see Equations S47 and S160). (E) The proteome efficiencies for energy biogenesis in the respiration and fermentation pathways vary with growth rate as functions of the nutrient quality of a Group A carbon source (see Equations S31 and S36). See Appendices 9 and 11 for model parameter settings and experimental data sources (Basan et al., 2015; Holms, 1996; Hui et al., 2015) for Figures 1—4 of E. coli.
Figure 2
Influence of protein overexpression on overflow metabolism in E. coli.
(A) A 3D plot of the relations among fermentation flux, growth rate, and the expression level of useless proteins. In this plot, both the acetate excretion rate and growth rate vary as bivariate functions of the nutrient quality of a Group A carbon source (denoted as ) and the useless protein expression encoded by lacZ gene (denoted as perturbation; see Equations S57 and S160). (B) Growth rate dependence of the acetate excretion rate upon perturbation for each fixed nutrient condition (see Equations S58 and S160). (C) Growth rate dependence of the acetate excretion rate as varies (see Equations S58 and S160), with each fixed expression level of LacZ.
Figure 3
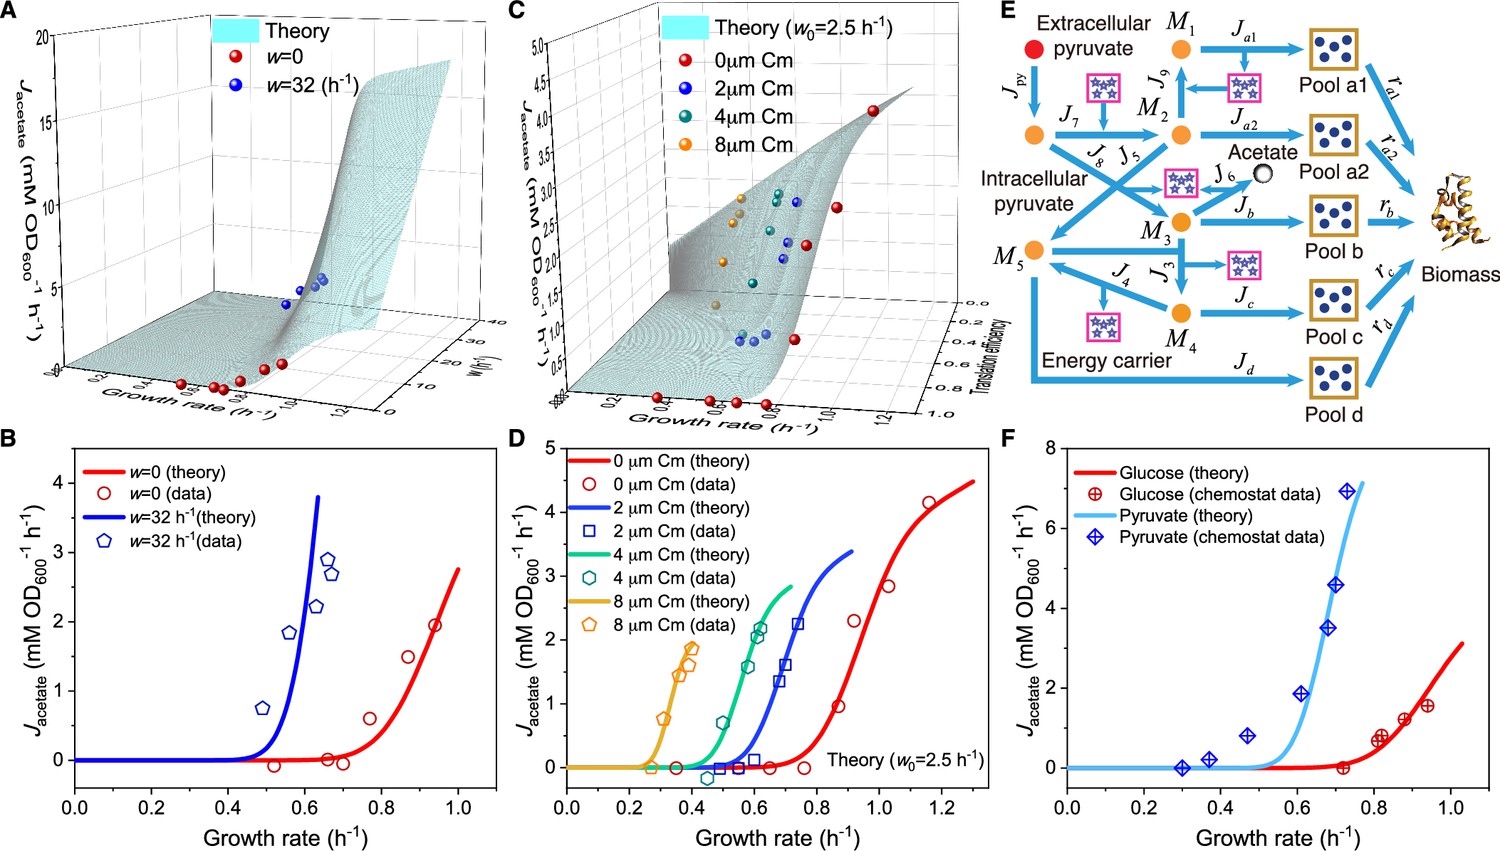
Influence of energy dissipation, translation inhibition, and carbon source category alteration on overflow metabolism in E. coli.
(A) A 3D plot of the relations among fermentation flux, growth rate, and the energy dissipation coefficient (see Equations S70 and S160). (B) Growth rate dependence of the acetate excretion rate as the nutrient quality varies, with each fixed energy dissipation coefficient determined by or fitted from experimental data. (C) A 3D plot of the relations among fermentation flux, growth rate, and the translation efficiency (see Equations 85 and S160). Here, the translation efficiency is adjusted by the dose of chloramphenicol (Cm). (D) Growth rate dependence of the acetate excretion rate as varies, with each fixed dose of Cm. (E) Coarse-grained model for pyruvate utilization. (F) The growth rate dependence of fermentation flux in pyruvate (see Equations 105 and S160) significantly differs from that of the Group A carbon sources (see Equations 47 and S160).
Figure 4

Relative protein expression of central metabolic enzymes in E. coli under carbon limitation and proteomic perturbation.
(A, C) Relative protein expression of representative genes from glycolysis. (B, D) Relative protein expression of representative genes from the TCA cycle. (A, B) Results of the perturbation through changes in nutrient quality (see Equation S119). (C, D) Results of proteomic perturbation via varied levels of expression of the useless protein LacZ (i.e. perturbation; see Equation S121).
Figure 5

Model comparison with data on the Crabtree effect in yeast and the Warburg effect in tumors.
(A) A linear scale representation on the -axis. (B) A log scale representation on the -axis. In (A–B), and represent the population averages of and , while and are the coefficients of variation (CVs) of and represents the ratio of proteome efficiency between respiration and fermentation at the population-averaged level, while stands for the fraction of energy flux generated by the fermentation pathway (see Equation 6). The data for yeast in batch culture and chemostat were calculated from experimental data of S. cerevisiae and I. orientalis (Shen et al., 2024). The data for mouse tumors were calculated from in vivo experimental data of pancreatic ductal adenocarcinoma (PDAC) and leukemic spleen of mice (Bartman et al., 2023; Shen et al., 2024). See Appendix 11 for detailed information on the experimental data sources (Bartman et al., 2023; Shen et al., 2024).
Appendix 1—figure 1
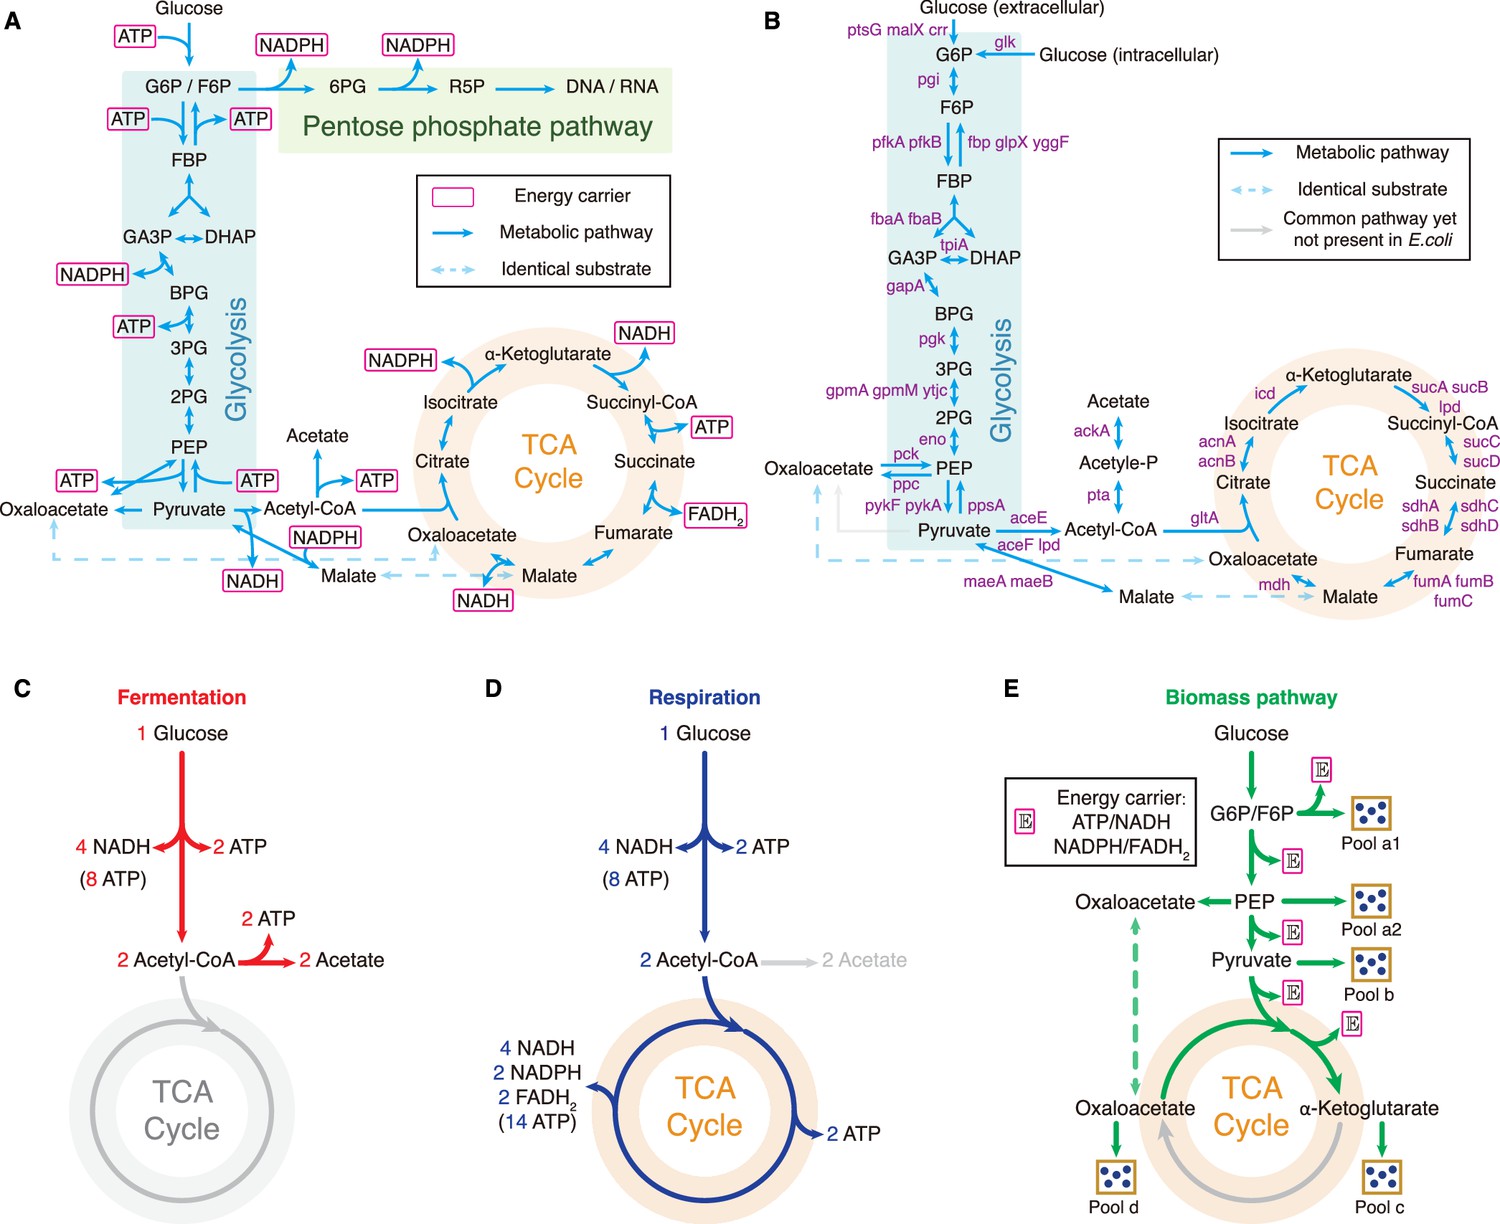
Central metabolic network and carbon utilization pathways of E. coli.
(A) Energy biogenesis details in the central metabolic network. In E. coli, NADPH and NADH are interconvertible (Sauer et al., 2004), and all energy carriers can be converted to ATP through ADP phosphorylation. The conversion factors are: NADH = 2 ATP, NADPH = 2 ATP, FADH2=1 ATP (Neidhardt et al., 1990). (B) Relevant genes encoding enzymes in the central metabolic network of E. coli. (C–E) Three independent fates of glucose metabolism in E. coli. (C) For energy biogenesis through fermentation, a molecule of glucose generates 12 ATPs. (D) For energy biogenesis via respiration, a molecule of glucose generates 26 ATPs. (E) For biomass synthesis, glucose is converted into precursors of biomass. Note that biomass synthesis is accompanied by ATP production (see Appendix 3.1).
Appendix 1—figure 2
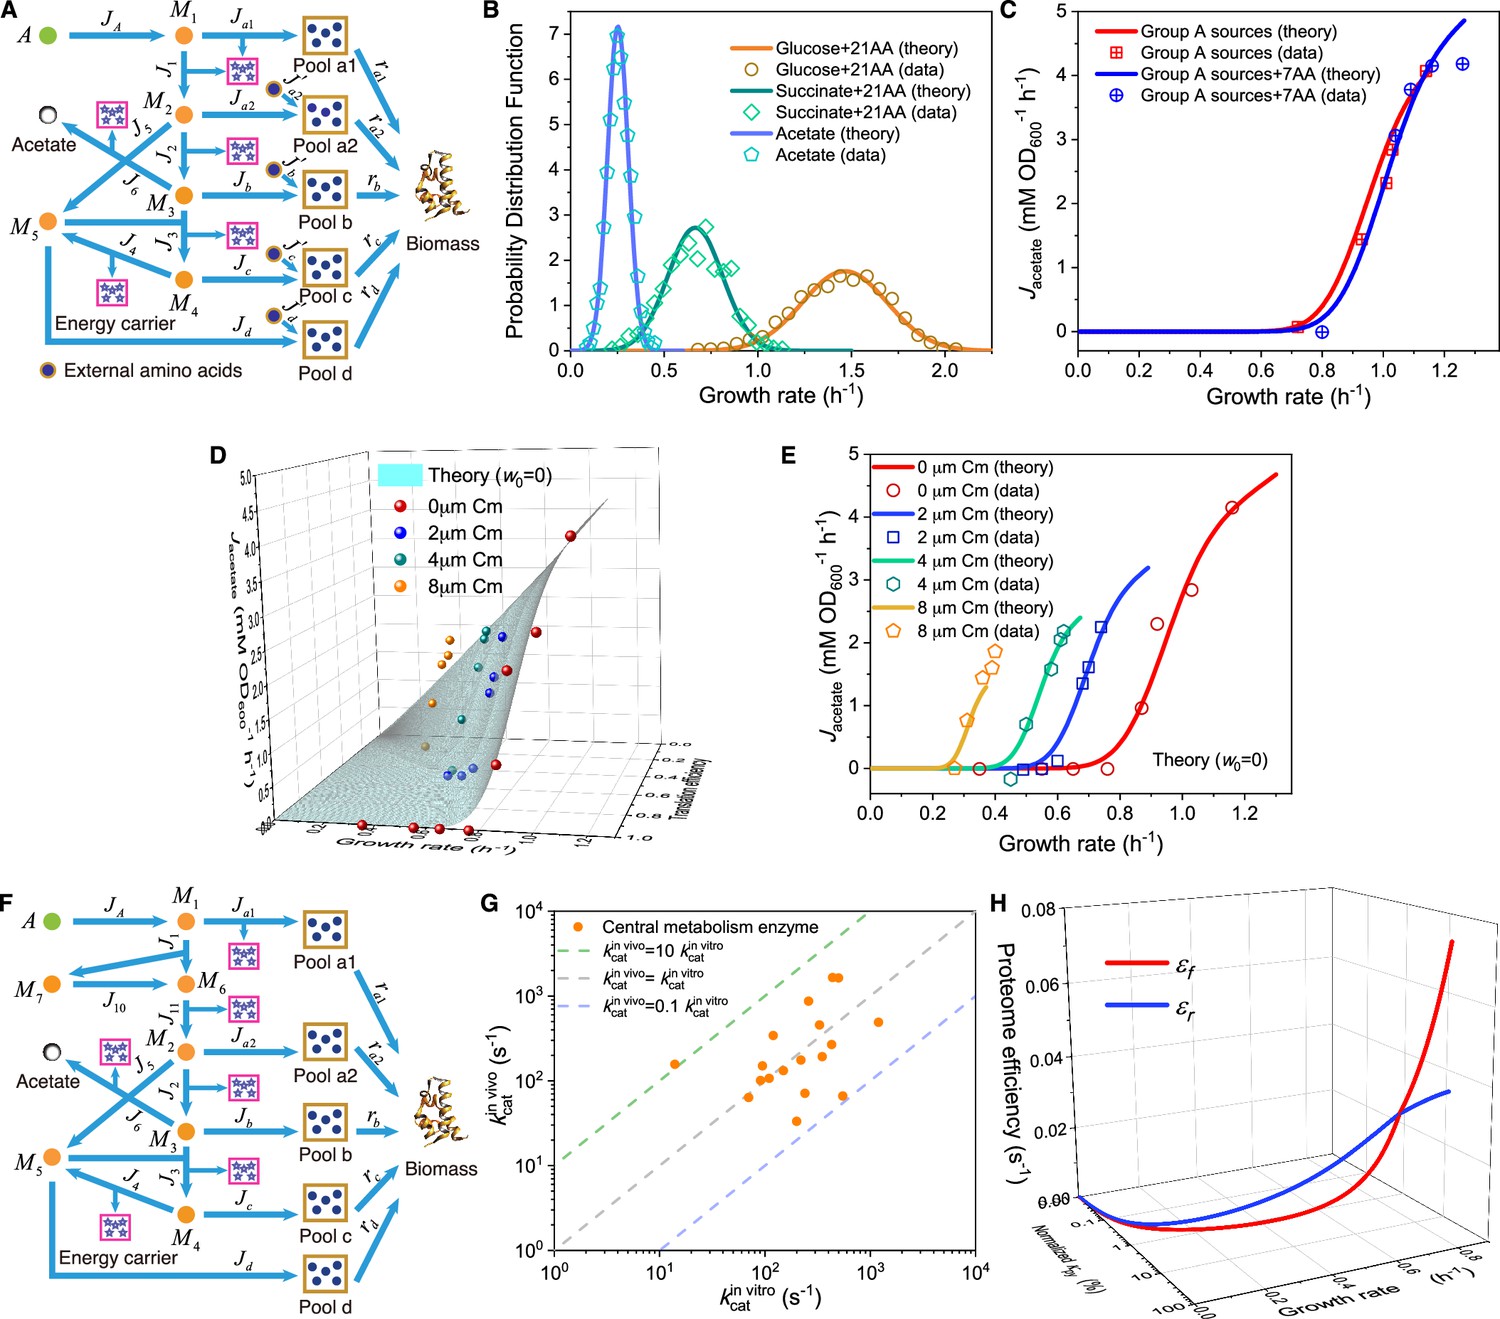
Model and results for experimental comparison of E. coli.
(A–C) Model analysis for carbon utilization in mixtures with amino acids. (A) Coarse-grained model for the case of a Group A carbon source mixed with extracellular amino acids. (B) Model predictions (Equations S157, S164-S165) and single-cell reference experimental results (Wallden et al., 2016) showing growth rate distributions for E. coli in three culturing conditions. (C) Comparison of the growth rate-fermentation flux relation for E. coli in Group A carbon sources between minimal media and enriched media (those with 7AA). (D–E) Influence of translation inhibition on overflow metabolism in E. coli. (D) A 3D plot illustrating the relations among fermentation flux, growth rate, and translation efficiency (Equations S79 and S160). (E) Growth rate dependence of acetate excretion rate as varies, with each fixed dose of Cm. Translation efficiency is tuned by the dose of Cm, and the maintenance energy coefficient is set to 0 (i.e. ). (F) Coarse-grained model for Group A carbon source utilization, which includes more details to compare with experiments. (G) Comparison of in vivo and in vitro catalytic rates for enzymes of E. coli within glycolysis and the TCA cycle (see Appendix 1—table 1 for details). (H) The proteome efficiencies for energy biogenesis in the respiration and fermentation pathways vary with growth rate as functions of the substrate quality of pyruvate (Equations S93 and S96)
Appendix 1—figure 3
Relative protein expression of central metabolic enzymes in E. coli under various types of perturbations.
(A–D) Relative protein expression under perturbation. (A) Experimental data (Hui et al., 2015) for the catalytic enzymes at each step of glycolysis. (B) Experimental data (Hui et al., 2015) for the catalytic enzymes at each step of the TCA cycle. (C) Model predictions (Equation S118, with ) and experimental data (Hui et al., 2015) for representative glycolytic genes. (D) Model predictions (Equation S118, with ) and experimental data (Hui et al., 2015) for representative genes from the TCA cycle. (E–J) Relative protein expression under perturbation. (E, F, I) Model predictions and experimental data (Basan et al., 2015) for representative glycolytic genes. (G, H, J) Model predictions and experimental data (Basan et al., 2015) for representative genes from the TCA cycle. (E–H) Results of perturbation with (Equation S120). (I–J) Results of perturbation with (Equation S121). (K–N) Relative protein expression upon energy dissipation. (K–L) Model fits (Equations S127 and S123) and experimental data (Basan et al., 2015) for representative glycolytic genes. (M–N) Model fits (Equations S127 and S123) and experimental data (Basan et al., 2015) for representative genes from the TCA cycle.
Appendix 1—figure 4

Asymptotic distributions of inverse Gaussian distribution and the inverse of Gaussian distribution.
(A) Comparison between the inverse of Gaussian distribution and the corresponding Gaussian distribution for various values of the coefficient of variation (CV) (Equations S140 and S145). (B) Comparison between the inverse Gaussian distribution and the corresponding Gaussian distribution for various values of CV (Equations S142 and S146). Both the inverse Gaussian distribution and the inverse of Gaussian distribution converge to Gaussian distributions when CV is small.
Appendix 1—figure 5
Carbon utilization in yeast and mammalian cells.
(A–D) Three independent fates of glucose metabolism in yeast and mammalian cells. (A–B) For energy biogenesis through fermentation, one molecule of glucose generates 2 ATPs. (C) For energy biogenesis through respiration, one molecule of glucose generates 32 ATPs. (D) For biomass synthesis, glucose is converted into biomass precursors, with ATP produced as a byproduct. In yeast and mammalian cells, the energy stored in NADH and FADH2 converts ADP into ATP in the mitochondria, with higher conversion factors than in E. coli: NADH = 2.5 ATP, FADH2=1.5 ATP (Nelson and Cox, 2008). (E) Coarse-grained model for Group A carbon source utilization in yeast. (F) Coarse-grained model for Group A carbon source utilization in mammalian cells.
Tables
Appendix 1—table 1
Molecular weight (MW) and in vivo/in vitro kcat data for E. coli.
| No.* | Reaction | Enzyme | Gene name | EC | MW (kDa) | In vitro kcat (s-1) | References | In vivo†kcat (s-1) | Selected kcat (s-1) |
|---|---|---|---|---|---|---|---|---|---|
| J1 | Glucose-6P ↔ Fructose-6P | Glucose-6-phosphate isomerase | pgi | EC:5.3.1.9 | 1.2×10² | 2.6×10² | PMID:7004378; DOI:https://doi.org/10.1016/j.ijms.2004.09.017 | 8.7×10² | 8.7×10² |
| Fructose-6P → Fructose-1,6P | Phosphofructokin-ase | pfkA‡ | EC:2.7.1.11 | 1.4×10² | 4.4×10² | PMID:6218375; 70226 | 1.7×10³ | 1.7×10³ | |
| Fructose-1,6P ↔ Glyceraldehyde 3-phosphate+Dihydroxyacetone phosphate | Fructose-bisphosphate aldolase | fbaA† | EC:4.1.2.13 | 7.8×10 | 1.4×10 | PMID:8939754; 15531627 | 1.6×10² | 1.6×10² | |
| Dihydroxyacetone phosphate ↔ Glyceraldehyde 3-phosphate | Triosephosphate Isomerase | tpiA | EC:5.3.1.1 | 5.4×10 | 4.3×10² | PMID:3887397; 6092857 | 2.7×10² | 2.7×10² | |
| Glyceraldehyde 3-phosphate ↔ 1,3-Bisphosphoglycerate | Glyceraldehyde-3-phosphate dehydrogenase | gapA | EC:1.2.1.12 | 1.4×10² | 9.5×10 | PMID:4932978; 2200929 | 1.5×10² | 1.5×10² | |
| 1,3-Bisphosphoglycerate ↔ 3-Phosphoglycerate | Phosphoglycerate kinase | pgk | EC:2.7.2.3 | 4.4×10 | 3.5×10² | PMID:367367; 166274 | 1.9×10² | 1.9×10² | |
| 3-Phosphoglycerate ↔ 2-Phosphoglycerate | Phosphoglycerate mutase | gpmA‡ | EC:5.4.2.11 | 4.9×10 | 3.3×10² | PMID:10437801 | 4.5×10² | 4.5×10² | |
| 2-Phosphoglycerate ↔ Phosphoenolpyruvate | Enolase | eno | EC:4.2.1.11 | 9.0×10 | 2.2×10² | PMID:1094232; 4942326 | 1.7×10² | 1.7×10² | |
| J2 | Phosphoenolpyruvate → Pyruvate | Pyruvate kinase | pykF‡ | EC:2.7.1.40 | 2.4×10² | 5.0×10² | PMID:6759852 | 1.6×10³ | 1.6×10³ |
| Pyruvate → Acetyl-CoA | Pyruvate dehydrogenase | aceE‡ | EC:1.2.4.1 | 1.0×10² | 1.2×10² | PMID:23088422 | 3.4×10² | 3.4×10² | |
| J3 | Oxaloacetate +Acetyl CoA → Citrate | Citrate synthase | gltA | EC:2.3.3.1 | 9.7×10 | 2.4×10² | PMID:4900996; 23954305 | 7.1×10 | 7.1×10 |
| Citrate ↔ Isocitrate | Aconitate hydratase | acnB‡ | EC:4.2.1.3 | 9.4×10 | 7.0×10 | PMID:15963579; 15963579 | 6.3×10 | 6.3×10 | |
| Isocitrate→ α-Ketoglutarate | Isocitrate dehydrogenase | icd | EC:1.1.1.42 | 9.5×10 | 2.0×10² | PMID:8141; 36923; 2200929 | 3.3×10 | 3.3×10 | |
| J4 | α-Ketoglutarate → Succinyl-CoA | α-Ketoglutarate dehydrogenase complex E1 component | suc A suc B‡ | EC:1.2.4.2, EC:2.3.1.61 | 1.9×10² | 1.5×10² | PMID:6380583; 4588679 | 1.3×10² | 1.3×10² |
| Succinyl-CoA ↔ Succinate | Succinyl-CoA synthetase | suc C suc D | EC:6.2.1.5 | 1.6×10² | 9.1×10 | PMID:5338130 | 1.0×10² | 1.0×10² | |
| Succinate → Fumarate | Succinate dehydrogenase | sdh A sdh B‡ | EC:1.3.5.1 | 1.0×10² | 1.1×10² | PMID:4334990; 16484232 | 1.1×10² | 1.1×10² | |
| Fumarate ↔ Malate | Fumarase | fumA‡ | EC:4.2.1.2 | 2.0×10² | 1.2×10³ | PMID:3282546; 12021453 | 4.9×10² | 4.9×10² | |
| Malate ↔ Oxaloacetate | Malate dehydrogenase | mdh | EC:1.1.1.37 | 6.1×10 | 5.5×10² | doi:https://doi.org/10.1016/0076-6879(69)13029-3 | 6.6×10 | 6.6×10 | |
| J5 | Phosphoenolpyruvate →Oxaloacetate | Phosphoenolpyru-vate carboxylase | ppc | EC:4.1.1.31 | 4.0×10² | 1.5×10² | PMID:9927652; 4932977 | / | 1.5×10² |
| J6 | Acetyl-CoA ↔ Acetyl phosphate | Phosphate acetyltransferase | pta | EC:2.3.1.8 | 7.7×10 | 3.0×10 | PMID:20236319 | 3.7×10² | 3.7×10² |
| Acetyl phosphate↔ Acetate | Acetate kinase | ackA | EC:2.7.2.1 | 4.3×10 | 3.6×10³ | EcoCyc: EG10027; PMID:24801996 | 3.3×10² | 3.3×10² | |
| Acetate (intracellular) ↔ Acetate (extracellular) | Acetate transporter | actP | / | 2×10 | 4.7×10² | PMID:31405984 (Estimated) | / | 4.7×10² | |
| J7 | Pyruvate → Phosphoenolpyruvate | Pyruvate, water dikinase | ppsA | EC:2.7.9.2 | 2.5×10² | 3.5×10 | PMID:4319237 | / | 3.5×10 |
| JA | Glucose-6P (extracellular) → Glucose-6P (intracellular) | Glucose-6-phosphate transporter | UhpT | / | 5×10 | 2×10² | PMID:3283129; 2197272; 20018695 (Estimated) | / | 2×10² |
| Glucose (extracellular) → Glucose-6P | Glucose-specific PTS enzyme | ptsG | EC: 2.7.1.199 | 5×10 | 1×10² | PMID:9575173; 20018695; 12146972 | / | 1×10² | |
| Lactose (extracellular) → Lactose (intracellular) | Lactose transporter | lacY | / | 4.6×10 | 6×10 | PMID:6444453; 20018695 | / | 6×10 | |
| Lactose →Glucose +Galactose | β-galactosidase | lacZ | EC:3.2.1.23 | 4.6×10² | 6.4×10² | PMID:8008071; 23011886 (Estimated) | / | 6.4×10² | |
| Jpy | Pyruvate (extracellular) → Pyruvate (intracellular) | Pyruvate transporter | btsT CstA | / | 8×10 | 6×10 | PMID:20018695; 33260635; EcoCyc: G7942; EG10167 (Estimated) | / | 6×10 |
-
*
The classification of Ji follows the coarse-grained models shown in Figures 1B and 3E.
-
†
In vivo kcat values were obtained using the experimental data shown in Appendix 1—table 2, combined with Equations S134-S135.
-
‡
See Appendix 1—figure 1B for additional genes that may play a secondary role.
Appendix 1—table 2
Proteome and flux data (Basan et al., 2015) used to calculate the in vivo kcat of E. coli.
| Culture 1 | Culture 2 | Culture 3 | Culture 4 | |
|---|---|---|---|---|
| Growth rate λ (h–1)* | 0.82 | 0.87 | 0.97 | 1.03 |
| Jacetate (mM OD600–1 h–1)† | 0.39 | 1.18 | 2.68 | 2.84 |
| JCO2, r (mM OD600–1 h–1) † | 7.44 | 6.05 | 4.30 | 3.04 |
| Gene name | Proteomic mass fractions obtained using absolute abundance (ϕi) | |||
| pgi | 0.09% | 0.09% | 0.10% | 0.11% |
| pfkA | 0.06% | 0.06% | 0.06% | 0.06% |
| fbaA | 0.32% | 0.35% | 0.35% | 0.39% |
| tpiA | 0.12% | 0.15% | 0.13% | 0.18% |
| gapA | 1.19% | 1.29% | 1.33% | 1.47% |
| pgk | 0.30% | 0.31% | 0.32% | 0.36% |
| gpmA | 0.15% | 0.15% | 0.15% | 0.16% |
| eno | 0.63% | 0.70% | 0.75% | 0.83% |
| pykF | 0.15% | 0.15% | 0.18% | 0.21% |
| aceE | 0.30% | 0.32% | 0.34% | 0.41% |
| gltA | 0.88% | 0.80% | 0.61% | 0.48% |
| acnB | 0.92% | 0.84% | 0.66% | 0.57% |
| icd | 1.55% | 1.55% | 1.31% | 1.39% |
| suc A suc B | 0.71% | 0.75% | 0.64% | 0.55% |
| suc C suc D | 0.88% | 0.84% | 0.66% | 0.52% |
| sdh A sdh B | 0.49% | 0.45% | 0.42% | 0.35% |
| fumA | 0.24% | 0.21% | 0.17% | 0.13% |
| mdh | 0.45% | 0.45% | 0.41% | 0.39% |
| pta | 0.10% | 0.10% | 0.10% | 0.10% |
| ackA | 0.06% | 0.07% | 0.06% | 0.06% |
-
*
For calibration purposes, a factor of 1.03/0.97 was multiplied by the reference data (Basan et al., 2015)‡.
-
†
For calibration purposes, a factor of 2.84/3.24 was multiplied by the reference data (Basan et al., 2015)‡.
-
‡
Here, (1.03, 2.84) and (0.97, 3.24) are both the data points for (λ h-1, Jacetate mM OD600-1 h-1) for E. coli strain NCM3722 cultured with lactose in the same reference (Basan et al., 2015). The former is specified in the source data of the reference’s figure 1 (Basan et al., 2015), while the latter is recorded in the reference’s extended data figure 3a (Basan et al., 2015). With the calibrations above, the data for the relation shown here align with the curve depicted in Figure 1C.
Appendix 1—table 3
Illustrations of symbols in this manuscript.
| Symbols | Illustrations/Definitions | Model variable/parameter settings for E. coli* |
|---|---|---|
| A (in the figures) | A Group A carbon source joining the metabolic network from the upper part of glycolysis. | NA † |
| Mi (in the figures) | A metabolite in the metabolic network that serve as intermediate node. | NA |
| Ji (in the figures) | The stoichiometric flux delivering carbon flux, an extensive variable‡; see Equation S7. | see Equations S7-S8. |
| ri (in the figures) | The mass fraction of carbon flux drawn from a precursor pool. | ra1=24%; ra2=24%; rb = 28%; rc = 12%; rd = 12% (Nelson and Cox, 2008). |
| λ | Growth rate of the cell population; see Equation S36 for the optimal model solution. | see Equations S4 and S36. |
| Jr, Jf | Jr and Jf are stoichiometric fluxes of respiration and fermentation, extensive variables. | Jr = J4; Jf = J6 (see Equation S22) |
| The weighted average carbon mass of metabolite molecules at the entrance of precursor pools. | See Equation S17. | |
| Mcarbon | The carbon mass of the cell population, an extensive variable. | NA |
| Mprotein | The protein mass of the cell population; an extensive variable. | NA |
| , , | The mass of Q-class, R-class, or C-class proteome. | See Equation S2. |
| , , | The ribosome allocation fraction for protein synthesis of Q-class, R-class, or C-class. | =. |
| The average molecular weight of amino acids. | A reducible parameter for the results. | |
| Translation speed of ribosomes. | =20.1 aa/s (Scott et al., 2010). | |
| , , | The mass fraction of Q-class, R-class, or C-class proteome; see Appendix 2.1. | =52% (Scott et al., 2010). |
| The maximum proteomic mass fraction of proteome allocation for fermentation, respiration, and biomass generation, with . | =48% (Scott et al., 2010). | |
| The protein mass of a single ribosome. | (Neidhardt et al., 1990). | |
| Vcell | The cell volume of the cell population (the ‘big cell’); an extensive variable. | NA |
| , | The number or the total protein mass of ribosomes in the big cell; extensive variables. | NA |
| The ratio of the mass of R-class proteome to the protein mass of ribosomes: . | =1.67 (Scott et al., 2010). | |
| [Ei], [Si] | The concentration of enzyme Ei or substrate Si; intensive variables. | NA |
| ai, di, bi, ci | ai and di are reaction parameters; bi and ci are stoichiometric coefficients. See Appendix 2.3. | NA |
| Ki | The Michaelis constant, defined as Ki≡(di+)/ ai. | Obtainable from Bennett et al., 2009, yet unused in practice since [Si]>Ki (see Appendix 2.5). |
| vi | The reaction rate per volume of a biochemical reaction catalyzed by Ei; an intensive variable. | See Equation S6. |
| , | The copy number or the total weight enzyme Ei in the cell population; extensive variables. | ; |
| mcarbon | The mass of a carbon atom. | , where g represents gram and is the Avogadro constant. |
| The enzyme cost of all Ei molecules in the cell population; an extensive variable. | . | |
| is defined such that . | . | |
| The normalized flux, i.e., flux per unit of biomass; an intensive variable§ | see Equations S15-S16. | |
| , | and are the normalized fluxes of respiration and fermentation, intensive variables. | =; =. |
| The number of carbon atoms in the entry point metabolite molecule of Precursor Pool i. | ; ; ; ; (Nelson and Cox, 2008). | |
| kcat, | The turnover number of a catalytic enzyme. | See Appendix 1—table 1. |
| , | and are the molecular weight and the enzyme cost of an Ei molecule, respectively. | See Appendix 1—table 1. |
| , | and are the mass fractions of all carbon and protein within a cell, respectively. | ; (Neidhardt et al., 1990). |
| Substrate quality of a metabolite in a biochemical reaction; see Equation S12 and S20. | Calculated from the values of , , , , . | |
| Substrate quality of a Group A carbon source; see Equation S27. | Calculated from the values of , , , , , and the concentration of the Group A carbon source [A]. | |
| The proteomic mass fraction of enzyme Ei: ; an intensive variable. | See Equation S9. | |
| The fraction of stoichiometric flux drawn from a precursor pool; see Equations S13, S14 and S18. | ηa1=15%; ηa2=30%; ηb=35%; ηc=9%; ηd=11% (calculated from the values of ri and ). | |
| , , | , , are the proteomic mass fraction of enzymes dedicated to fermentation, respiration, and biomass generation, respectively. | NA |
| A parameter determined by the translation rate, defined as . | (s–1) (calculated from the values of , and ). | |
| JBM | The carbon flux of biomass production; an extensive variable. | See Equation S10. |
| JE | The energy demand for cell growth, expressed as the stoichiometric energy flux in ATP; an extensive variable. | See Equation S25. |
| The normalized flux of energy demand in ATP; an intensive variable. | ||
| rE, | rE and are energy coefficients. rE is the slope of JE versus JBM; . | See Appendix 9.2. |
| The stoichiometric coefficient of ATPs in biochemical reactions shown in Figures 1B and 3E (for E. coli) or Appendix 1—figure 5E and F (for yeast and mammalian cells). | , , , , , , , , (E. coli); , , , , , (eukaryotic cells) (Neidhardt et al., 1990; Sauer et al., 2004). | |
| , | and are the stoichiometric coefficients of ATP production per glucose in respiration and fermentation, respectively. | , (E. coli); , (eukaryotic cells) (Neidhardt et al., 1990). |
| , | and are normalized energy fluxes of respiration and fermentation, intensive variables. | ; |
| , , | (or ) and (or ) are the proteome efficiencies for energy biogenesis in the respiration and fermentation pathways: and . | Calculated from the values of , , and with Equations S132 and S161. |
| is an energy demand coefficient, defined in Equation S33 and mainly determined by . | Calculated from the values of , , with Equation S33. See Appendix 9.2. | |
| , | (or ) is the proteome efficiency for biomass generation in the biomass pathway, with . | Calculated from the values of , , , , with Equations S133 and S162. |
| , | and are parameters defined as and | Calculated from the values of . |
| is a composite parameter defined as | See Appendix 9.2. | |
| , | The substrate quality of glucose or lactose at saturated concentration. | Calculated using Equation S27 and the approximation used in Equation S20. |
| Δ is a function of defined as . | . | |
| The critical value of which satisfy and thus ; See Equation S42 (for E. coli) and S176 (for yeast and mammalian cells). | Calculated from the values of and with Equation S42. | |
| The critical growth rate at the transition point: ; See Equations S43 and S177. | Calculated from the values of , , , , , , with Equations S43, S32 and S162. | |
| The Heaviside step function. | NA | |
| , | and are the stoichiometric fluxes of acetate from the fermentation pathway and CO2 from the respiration pathway; extensive variables. | ; . See Appendix 9.1 and Equations S158. |
| , | and are the fluxes of and (per biomass) in the unit of mM/OD600/h, which are measurable in experiment. Intensive variables. | ; . See Appendix 9.1 and Equation S160. |
| The maximum value of available across different Group A carbon sources. | Approximated by the max across Group A carbon sources, calculated with Equation S27 and the approximation used in Equation S20. | |
| The population cell growth rate for the maximum value of : . | Calculated from the maximum of Equation S36 with the values of , , , , , , and Equations S32, S132, Equation S161 and S162. | |
| A Gaussian distribution with a mean of μ and a standard deviation of . | The probability density function is . | |
| , | and are the mean and standard deviation of , respectively. | is approximated by the deterministic value of ; see Appendix 3.3 for settings. See Appendix 9.2 for the values. |
| erf | The error function in mathematics. | |
| The proteomic mass fraction of useless proteins encoded by the LacZ gene. | See Appendix 4.1. | |
| An energy dissipation coefficient. | See Appendix 4.2. | |
| The maintenance energy coefficient. | =0 or 2.5 (h–1) as specified in Figures 3–4, Appendix 1—figures 2 and 3. See Appendices 4.3 and 9.2. | |
| is the inhibition coefficient such that represents the translation efficiency. | See Appendices 4.3 and 9.2 | |
| , , , , , | The values for in the cases with 2 μm , 4 μm, or 8 μm of chloramphenicol and the maintenance energy coefficient chosen as 0 or 2.5 (h–1). | ;; ; ; ; . See Appendix 9.2. |
| The substrate quality of pyruvate; see Equation S89. | Calculated from the values of , , , , , and the external concentration of pyruvate [py]. | |
| , | and are the stoichiometric coefficients of ATP production per pyruvate in respiration and fermentation, respectively. | ; . (Neidhardt et al., 1990). |
| , | and are the normalized energy fluxes of respiration and fermentation for pyruvate utilization; intensive variables. | The corresponding variables of and in the case of pyruvate utilization. |
| , | and are the proteome efficiencies for energy biogenesis using pyruvate in the respiration and fermentation pathways. | The corresponding variables of and in the case of pyruvate utilization. |
| is a composite parameter defined as . | See Appendix 9.2. | |
| , , , | , , , and are the corresponding variables/parameters of , , , and in the case of pyruvate utilization. | See Appendices 5.1 and 9.2. |
| , , | , and are the corresponding variables/parameters of , and in the case of pyruvate utilization. | See Appendices 5.1 and 9.2. |
| The number of carbon atoms in a molecule of Pool i. | The value of is approximated by (Equation S107). | |
| The substrate quality of the external supplied amino acids identical to those in Pool i. | See Appendices 5.2 and 9.2. | |
| is a composite parameter defined as . | See Appendices 5.2 and 9.2. | |
| , , , , , | , , , , and are the corresponding variables/parameters of , , , , and in the case of a Group A carbon source is mixed with 21 types of amino acids at saturated concentrations. | See Appendices 5.2 and 9.2. |
| , , , | , , and are the corresponding parameters of , , and in the case of a Group A carbon source is mixed with 7 types of amino acids. | See Appendices 5.2 and 9.2. |
| , | is the normalized stoichiometric influx of a Group A carbon source (Equation S136). is a parameter defined as for the model shown in Figure 1B. | See Appendix 7.3 |
| , , | , and are the level of extrinsic noise, intrinsic noise and total noise in a system. | See Appendix 8.1 |
| , , , , , | and are the mean and standard deviation of . (or ) and (or ) are the mean and standard deviation of . See Appendix 8.1. | is approximated by the deterministic value of . The CV of is set to 25%. ≈1/; /≈/. |
| The inverse Gaussian (IG) distribution: variable x>0 with parameters and . See Equation S142. | The probability density function is . | |
| The positive inverse of Gaussian (IOG) distribution: variable x>0 with parameters and . See Equation S140 and Appendix 8.1. | The probability density function is . | |
| , | Distributional parameters of corresponding to in an IG or IOG distribution. | See Appendix 8.1 |
| The characteristic function of IG distribution. See Equation S147. | ||
| , , , , | , , and are variables and parameters used to calculate the first passage time of a stochastic process that mimics the duration of an enzyme to finishing a catalytic job. | See Appendix 8.1. |
| , , , | is a real number; is a variable defined as ; and are the mean and standard deviation of . | See Equation S153 and Appendix 8.1. |
| , , , | and are the mean and standard deviation of ; and are the mean and standard deviation of . | See Equation S154 and Appendices 8.1 and 9.2. |
| , , , , , , | and are the growth rates when cells choose respiration or fermentation; , and , are the means and standard deviations of and ; is the correlation of and . | See Equation S36 and Appendices 8.1 and 9.2. |
| , ,, ,, | and are the growth rates for succinate mixed with 21AA or acetate as the sole carbon source; , and , are the means and standard deviations of and . | See Appendix 9.2. |
| , | and are the proteomic mass fraction of the enzymes and the effective substrate quality of related metabolites in the mitochondria for yeast and mammalian cells, respectively. | NA |
| The proportion of ATP generated from fermentation: . | See Equations S180, S189 and Appendix 10. | |
| The proteome efficiency difference between respiration and fermentation: | See Equations S181, S187 and Appendix 10. | |
| , , , | , , and are the mean values of , , and , respectively. | See Equations S182-S184 and Appendix 10. |
| , , , | , , , and are the standard deviations of , , and , respectively. | See Equations S182, S185 and Appendix 10. |
| , , , | , , , and are the coefficients of variation of , , and , respectively. | See Equations S185-S186 and Appendix 10. |
| , | and are the mean and standard deviation of , respectively. | See Equations S187-S188 and Appendix 10. |
| , | and are the population-averaged values of and , respectively. | Measurable from experiments. See Equations S183-S184 and Appendix 10. |
-
*
Parameter settings for yeast and mammalian cells are specifically labeled as ‘eukaryotic cells.’
-
†
‘NA’ represents ‘Not applicable.’
-
‡
Extensive variables scale with the size of the cell population.
-
§
Intensive variables are scale-invariant with respect to the cell population.
Additional files
-
Source data 1
Source data for the theoretical results generated in this study and the experimental data from prior studies, as shown in Figures 1—5.
- https://cdn.elifesciences.org/articles/94586/elife-94586-data1-v2.xlsx
-
Source data 2
Source data for the theoretical results generated in this study and the experimental data from prior studies, as shown in Appendix 1—figures 2–4.
- https://cdn.elifesciences.org/articles/94586/elife-94586-data2-v2.xlsx
-
MDAR checklist
- https://cdn.elifesciences.org/articles/94586/elife-94586-mdarchecklist1-v2.pdf
Download links
A two-part list of links to download the article, or parts of the article, in various formats.
Downloads (link to download the article as PDF)
Open citations (links to open the citations from this article in various online reference manager services)
Cite this article (links to download the citations from this article in formats compatible with various reference manager tools)
Overflow metabolism originates from growth optimization and cell heterogeneity
eLife 13:RP94586.
https://doi.org/10.7554/eLife.94586.4


