RAS–p110α signalling in macrophages is required for effective inflammatory response and resolution of inflammation
- Tumour-Stroma Signalling Lab., Centro de Investigación del Cáncer, Instituto de Biología Molecular y Celular del Cáncer, Consejo Superior de Investigaciones Científicas (CSIC)-Universidad de Salamanca, Campus Miguel de Unamuno, Spain
- Centre for Cancer and Inflammation, Barts Cancer Institute, Queen Mary University of London, United Kingdom
- Centre for Microvascular Research, William Harvey Research Institute, Queen Mary University of London, United Kingdom
- Unit of Biophysics and Bioengineering, Department of Biomedicine, School of Medicine and Health Sciences, Universitat de Barcelona, Spain
- Centre for Cancer Genomics and Computational Biology, Cell Signalling and Proteomics Laboratory, Barts Cancer Institute, Queen Mary University of London, United Kingdom
- Bioinformatics and Functional Genomics, Centro de Investigación del Cáncer, Instituto de Biología Molecular y Celular del Cáncer, Consejo Superior de Investigaciones Científicas (CSIC)-Universidad de Salamanca, Spain
- Inflammation and Macrophage Plasticity Lab, CIC bioGUNE, Spain
- Oncogene Biology Laboratory, Francis Crick Institute, United Kingdom
- Institute for Bioengineering of Catalonia (IBEC), The Barcelona Institute for Science and Technology (BIST), Spain
- Ikerbasque, Basque Foundation for Science, Spain
- Pathology Unit, Centro de Investigación del Cáncer, Instituto de Biología Molecular y Celular del Cáncer, Universidad de Salamanca, Spain
Figures
Figure 1 with 1 supplement
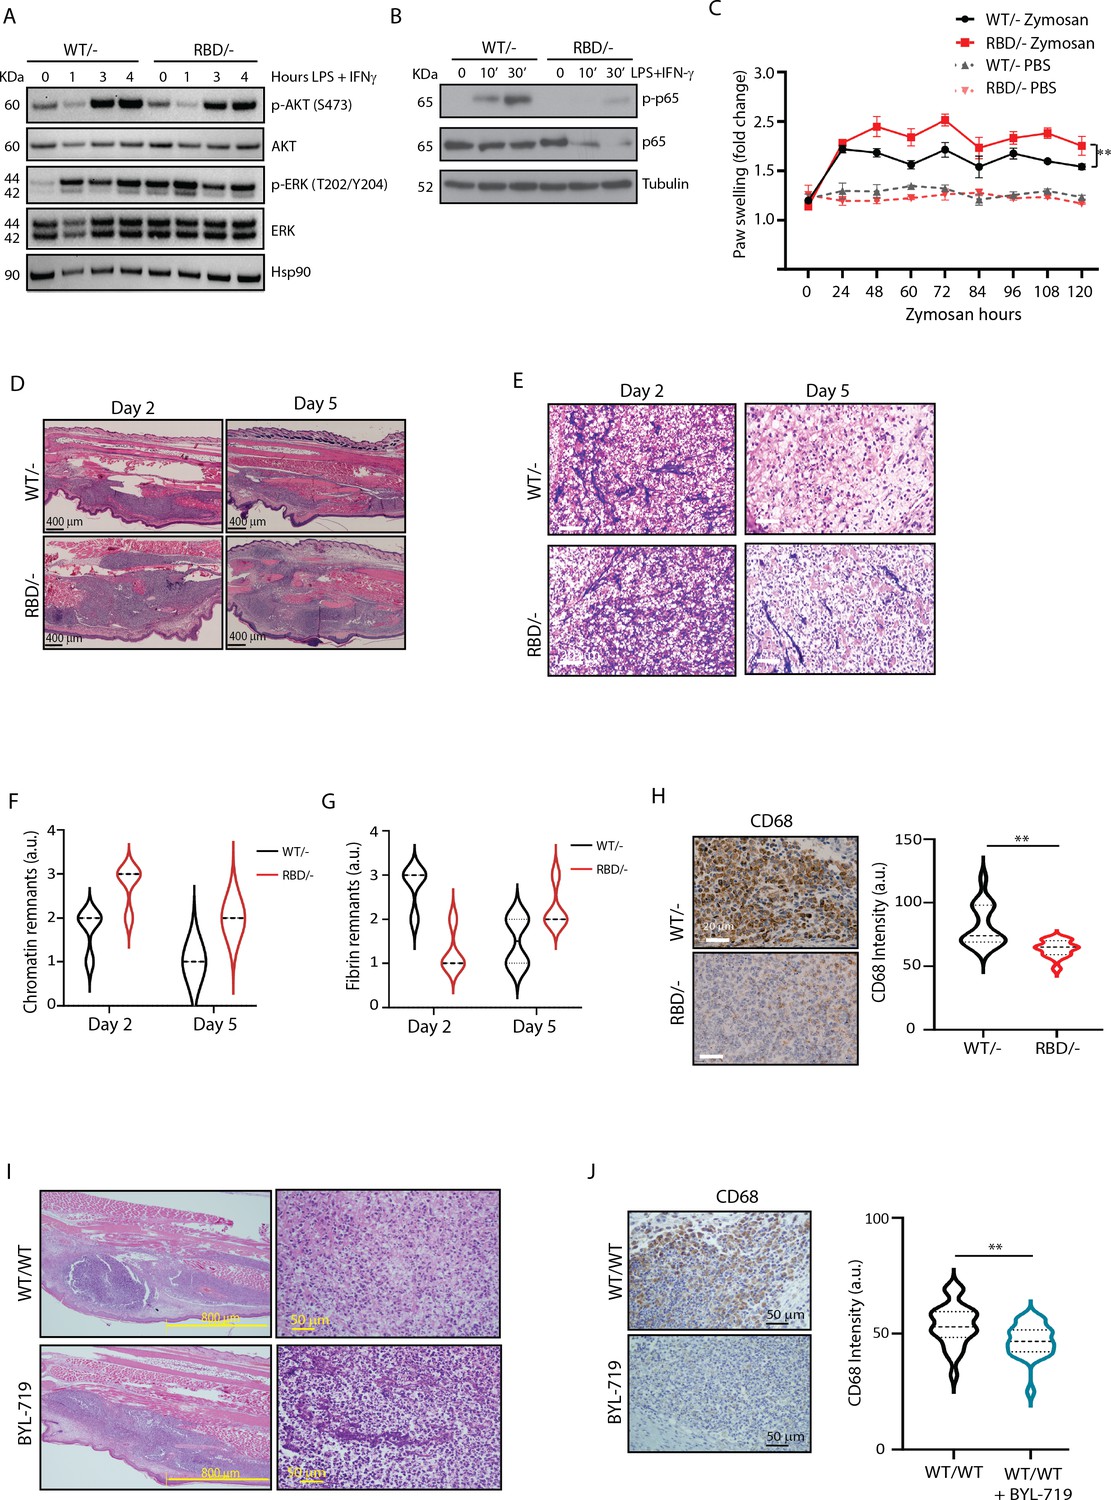
Pik3caRBD/− mice have impaired responses to inflammatory insults.
(A) Western blotting showing activation of Akt and ERK in Pik3caWT/− and Pik3caRBD/− bone marrow-derived macrophages (BMDMs) activated towards a pro-inflammatory state with lipopolysaccharide (LPS) and interferon gamma (IFN-γ) at the indicated time points. (B) Western blotting showing activation of NF-κB (p65) in Pik3caWT/− and Pik3caRBD/− BMDMs activated towards a pro-inflammatory state with LPS and IFN-γ at the indicated time points. (C) Pik3caWT/− and Pik3caRBD/− mice were injected with zymosan or PBS in the back-hind paws and inflammation was measured and plotted over time, Pik3caWT/− PBS n = 6; Pik3caRBD/– PBS n = 5; Pik3caWT/− Zymosan n = 4; Pik3caRBD/– Zymosan n = 4. Error bars indicate mean ± SEM. Significance using two-way ANOVA test: **p < 0.01. (D) Representative haematoxylin and eosin (H&E) images of the inflamed area of Pik3caWT/– and Pik3caRBD/– paws injected with zymosan at the indicated times. (E) Representative images of cellularity present in the inflamed abscess of Pik3caWT/– and Pik3caRBD/– paws injected with zymosan at the indicated times. (F) Graph showing quantification of loose chromatin present in the inflamed abscess. (G) Graph showing quantification of fibrin present in the inflamed abscess. (H) Representative images of macrophages (CD68-positive cells) present in the inflamed abscess of Pik3caWT/− and Pik3caRBD/− paws injected with zymosan and quantification of macrophages (CD68-positive cells) present. (I) Representative H&E images of the inflamed area and cellularity of Pik3caWT/WT paws and Pik3caWT/WT paws treated with BYL-719 injected with zymosan. (J) Representative images and quantification of macrophages (CD68-positive cells) present in the inflamed abscess of Pik3caWT/WT paws and Pik3caWT/WT paws treated with BYL-719 injected with zymosan and quantification of macrophages (CD68-positive cells). Error bars indicate mean ± SEM. Significance using Student’s t test: **p < 0.01.
-
Figure 1—source data 1
Original membranes corresponding to Figure 1A, labelled.
- https://cdn.elifesciences.org/articles/94590/elife-94590-fig1-data1-v1.zip
-
Figure 1—source data 2
Original membranes corresponding to Figure 1A.
- https://cdn.elifesciences.org/articles/94590/elife-94590-fig1-data2-v1.zip
-
Figure 1—source data 3
Original membranes corresponding to Figure 1A, labelled.
- https://cdn.elifesciences.org/articles/94590/elife-94590-fig1-data3-v1.zip
-
Figure 1—source data 4
Original membranes corresponding to Figure 1B.
- https://cdn.elifesciences.org/articles/94590/elife-94590-fig1-data4-v1.zip
Figure 1—figure supplement 1
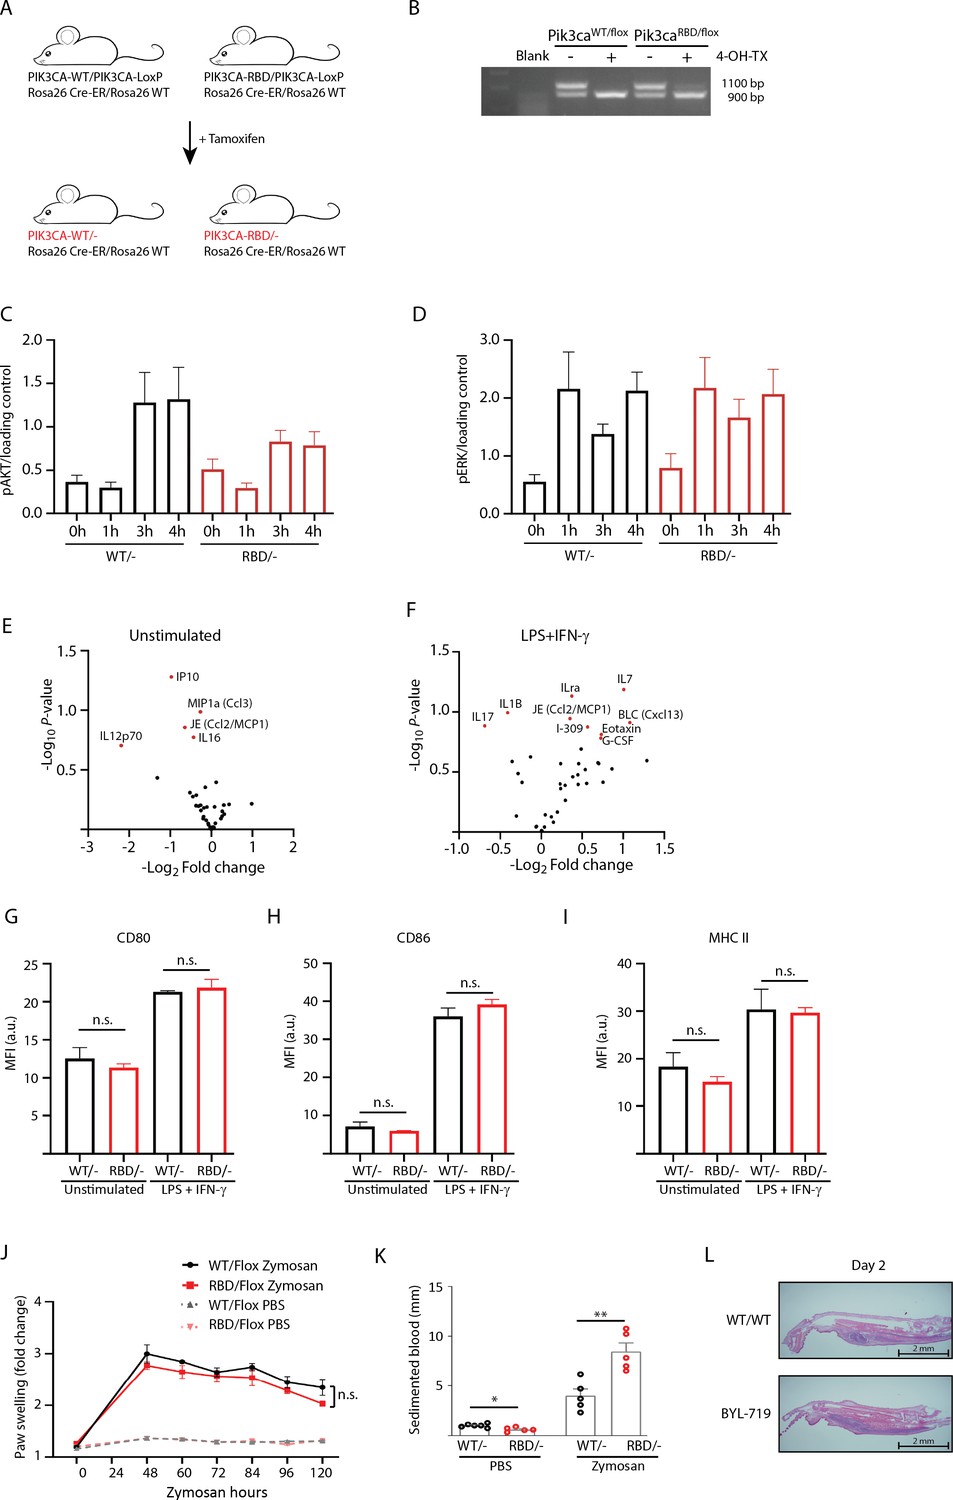
Pik3caRBD/– mice have more extended inflamed tissue after zymosan injection.
(A) Schematic representation of the mouse model used in which the interaction of p110α with RAS was disrupted by the introduction of two-point mutations, T208D and K227A, into the endogenous Pik3ca gene (Pik3caRBD). Wild-type (Pik3caWT) and Pik3caRBD mice were bred with mice containing a floxed Pik3ca allele and a mouse carrying a conditional Cre recombinase (Cre-ERT2) allele targeted to the ubiquitously expressed Rosa26 locus. (B) Representative PCR showing efficiency of floxed allele removal after treatment with 4-hydroxytamoxifen for 48 hr. (C) Graph quantifying p-AKT signal from three independent WB and normalized against its loading control. (D) Graph quantifying p-ERK signal from three independent WB and normalized against its loading control. (E) Volcano plots corresponding to identified cytokines differentially expressed in unstimulated BMDMs. (F) Volcano plots corresponding to identified cytokines differentially expressed in lipopolysaccharide (LPS) + interferon gamma (IFN-γ) BMDMs; Pik3caRBD/– and Pik3caWT/– BMDMs were stimulated with LPS + IFN-γ and expression of (G) CD80, (H) CD86, and (I) MHCII were analysed by flow cytometry (Pik3caRBD/– n = 5; Pik3caWT/– n = 3). Error bars indicate mean ± SEM. Significance using Mann–Whitney test: n.s., non-significant. (J) Pik3caWT/Flox and Pik3caRBD/Flox mice were injected with zymosan or PBS in the back-hind paws and inflammation was measured and plotted over time, Pik3caWT/Flox n = 5; Pik3caRBD/Flox PBS n = 5; Pik3caWT/Flox Zymosan n = 5; Pik3caRBD/Flox Zymosan n = 5. Error bars indicate mean ± SEM. Significance using two-way ANOVA test: n.s., non-significant. (K) Blood from the same mice was obtained by cardiac puncture prior culling and blood sedimentation was measured. The clear layer formed at the top was used for data quantification. Black dots represent data from Pik3caWT/– mice and red dots represent data from Pik3caRBD/– mice. Each dot represents an individual mouse. Error bars indicate mean ± SEM. Significance using Student’s t test: *p < 0.05; **p < 0.01. Pik3caWT/− PBS n = 6; Pik3caRBD/– PBS n = 5; Pik3caWT/− Zymosan n = 4; Pik3caRBD/– Zymosan n = 4. (L) Representative images showing zymosan-induced inflammatory area in Pik3caWT/WT mice and Pik3caWT/WT mice treated with BYL-719.
-
Figure 1—figure supplement 1—source data 1
DNA gel showing a representative gel of sample genotyping.
- https://cdn.elifesciences.org/articles/94590/elife-94590-fig1-figsupp1-data1-v1.zip
-
Figure 1—figure supplement 1—source data 2
Original gel image with no edits.
- https://cdn.elifesciences.org/articles/94590/elife-94590-fig1-figsupp1-data2-v1.zip
Figure 2 with 2 supplements
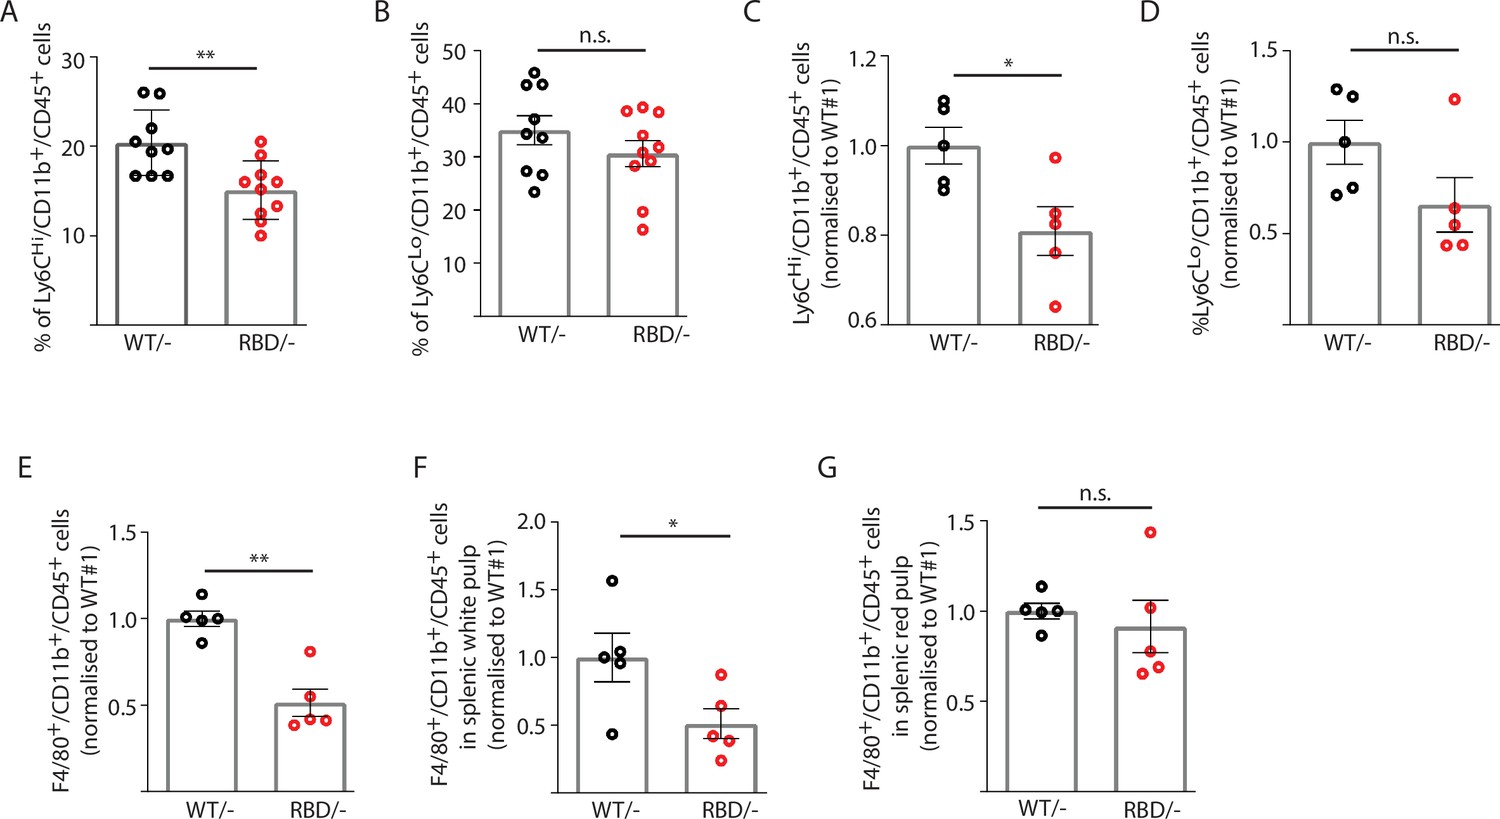
Disruption of RAS–p110α interaction decreases the number of inflammatory monocytes in blood and spleen.
Twelve-week-old mice were treated with tamoxifen and after 4 weeks, flow cytometry analysis was performed to determine (A) inflammatory monocytes in circulating blood; (B) alternatively activated monocytes in circulating blood; (C) inflammatory monocytes in spleen; (D) classically activated monocytes in spleen; (E) macrophages in spleen; (F) macrophages in spleen’s white pulp; (G) macrophages in spleen’s red pulp. Data are presented as percentage of positive cells for the indicated markers. Black dots represent data from Pik3caWT/− mice and red dots represent data from Pik3caRBD/– mice. Each dot represents an individual mouse. Error bars indicate mean ± SEM. Significance using Student’s t test: *p < 0.05; **p < 0.01.
Figure 2—figure supplement 1

Gating strategy for immune population analysis in blood and spleen.
(A) Graphs showing gating strategy used to analyse immune populations in peripheral blood from Pik3caWT/– and Pik3caRBD/– mice. (B) Graphs showing gating strategy used to analyse immune populations in spleens from Pik3caWT/– and Pik3caRBD/– mice.
Figure 2—figure supplement 2
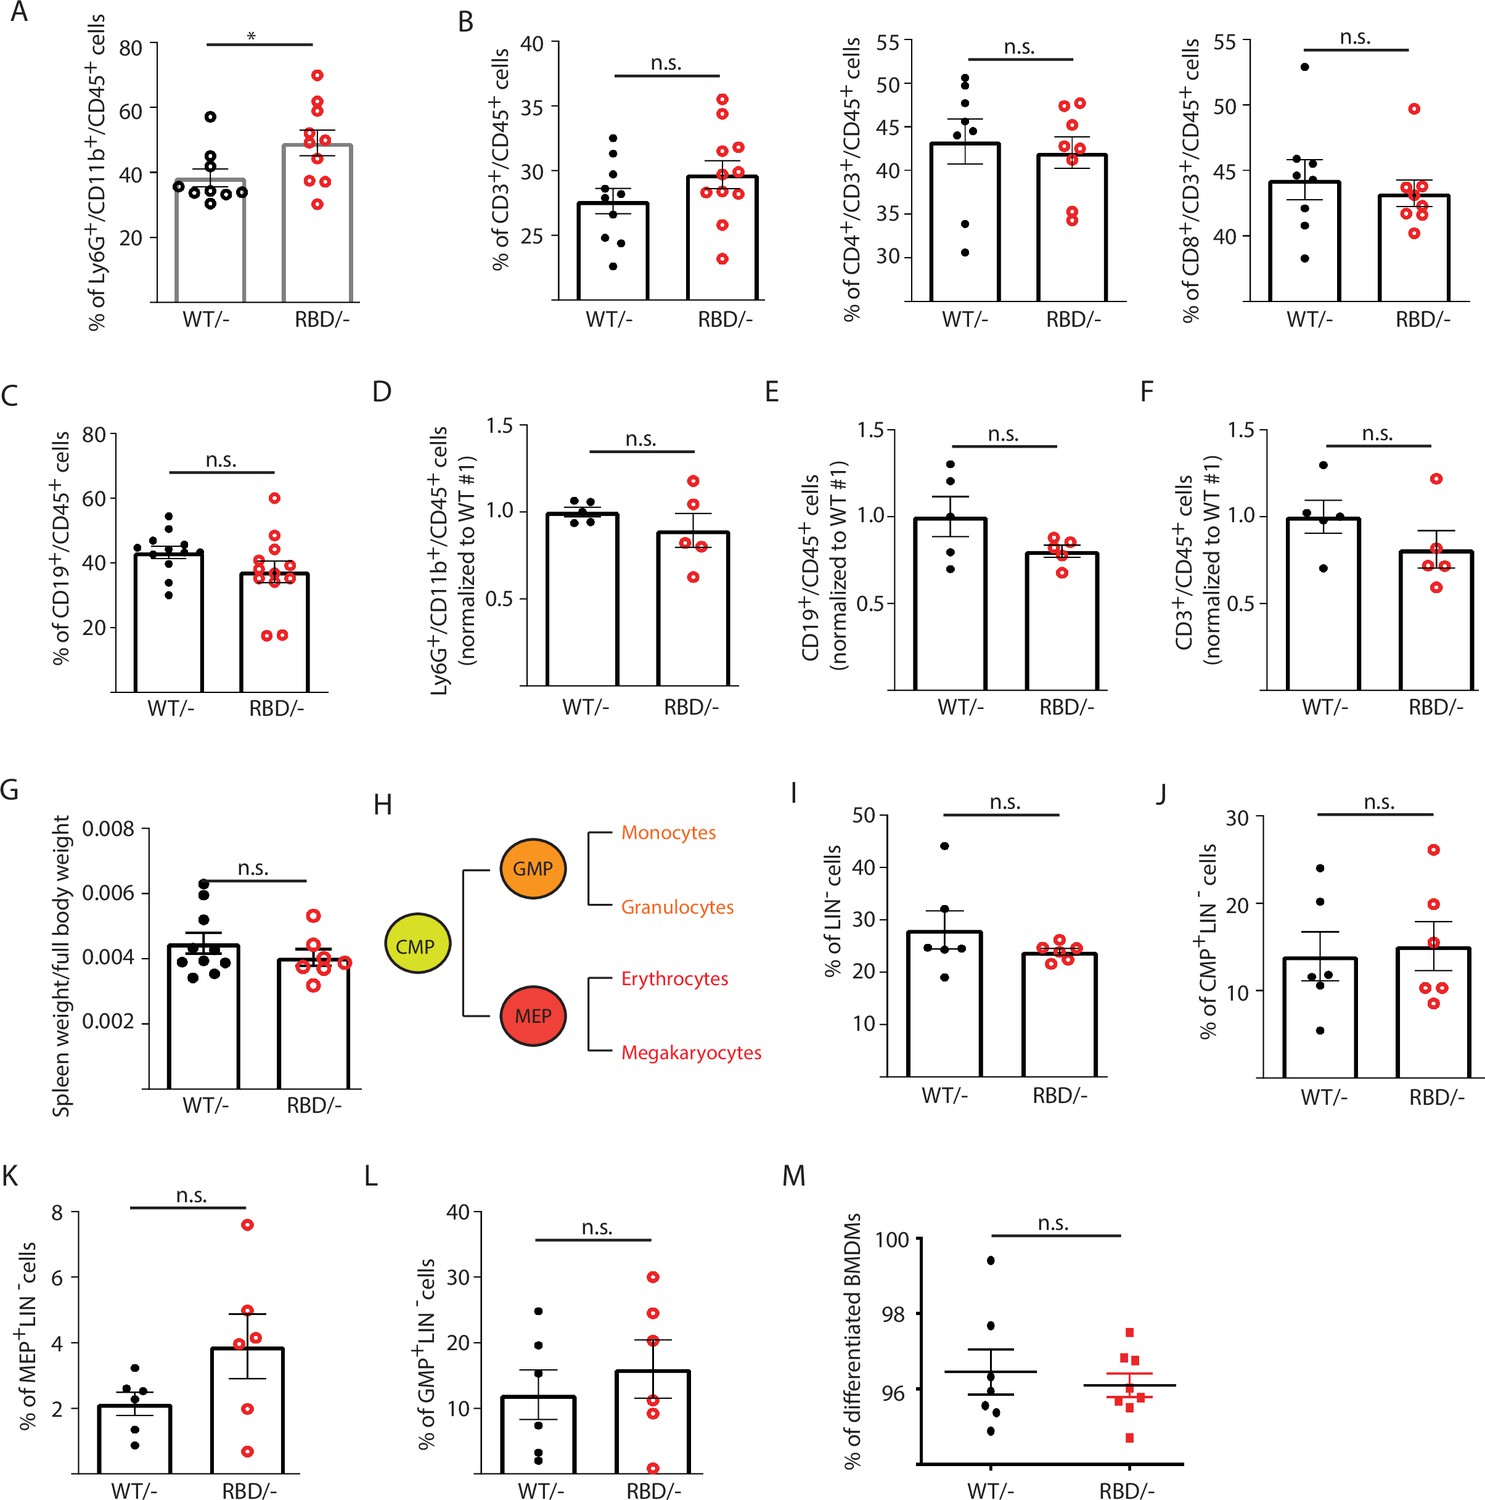
Disruption of RAS–p110α interaction does not affect the number of B or T cells in blood or spleen.
Twelve-week-old mice were treated with tamoxifen and after 4 weeks, flow cytometry analysis was performed to determine abundancy of different immune populations. (A) Granulocytes in circulating blood. (B) CD3, CD4+, and CD8+ T cells in circulating blood. (C) B cells in circulating blood. (D) Granulocytes in spleen. (E) B cells in spleen. (F) T cells in spleen. (G) Spleen weight compared to full body. (H) Schematic representation of myeloid precursors differentiation (CMP – common myeloid progenitor; GMP – granulocyte–monocyte progenitor; MEP – megakaryocyte–erythroid progenitor). (I) Graph showing percentage of bone marrow cells progenitor cells (have not acquire any lineage marker, Lin−). (J) Graph showing percentage of CMP cells within progenitor cells. (K) Graph showing percentage of MEP cells within progenitor cells. (L) Graph showing percentage of GMP cells within progenitor cells. (M) Graph depicting % of differentiated macrophages obtained in culture from bone marrow precursors in the presence of m-CSF. Black dots represent data from Pik3caWT/− mice and red dots represent data from Pik3caRBD/– mice. Each dot represents an individual mouse. Error bars indicate mean ± SEM. Significance using Student’s t test: n.s., non-significant. *p < 0.05.
Figure 3 with 1 supplement
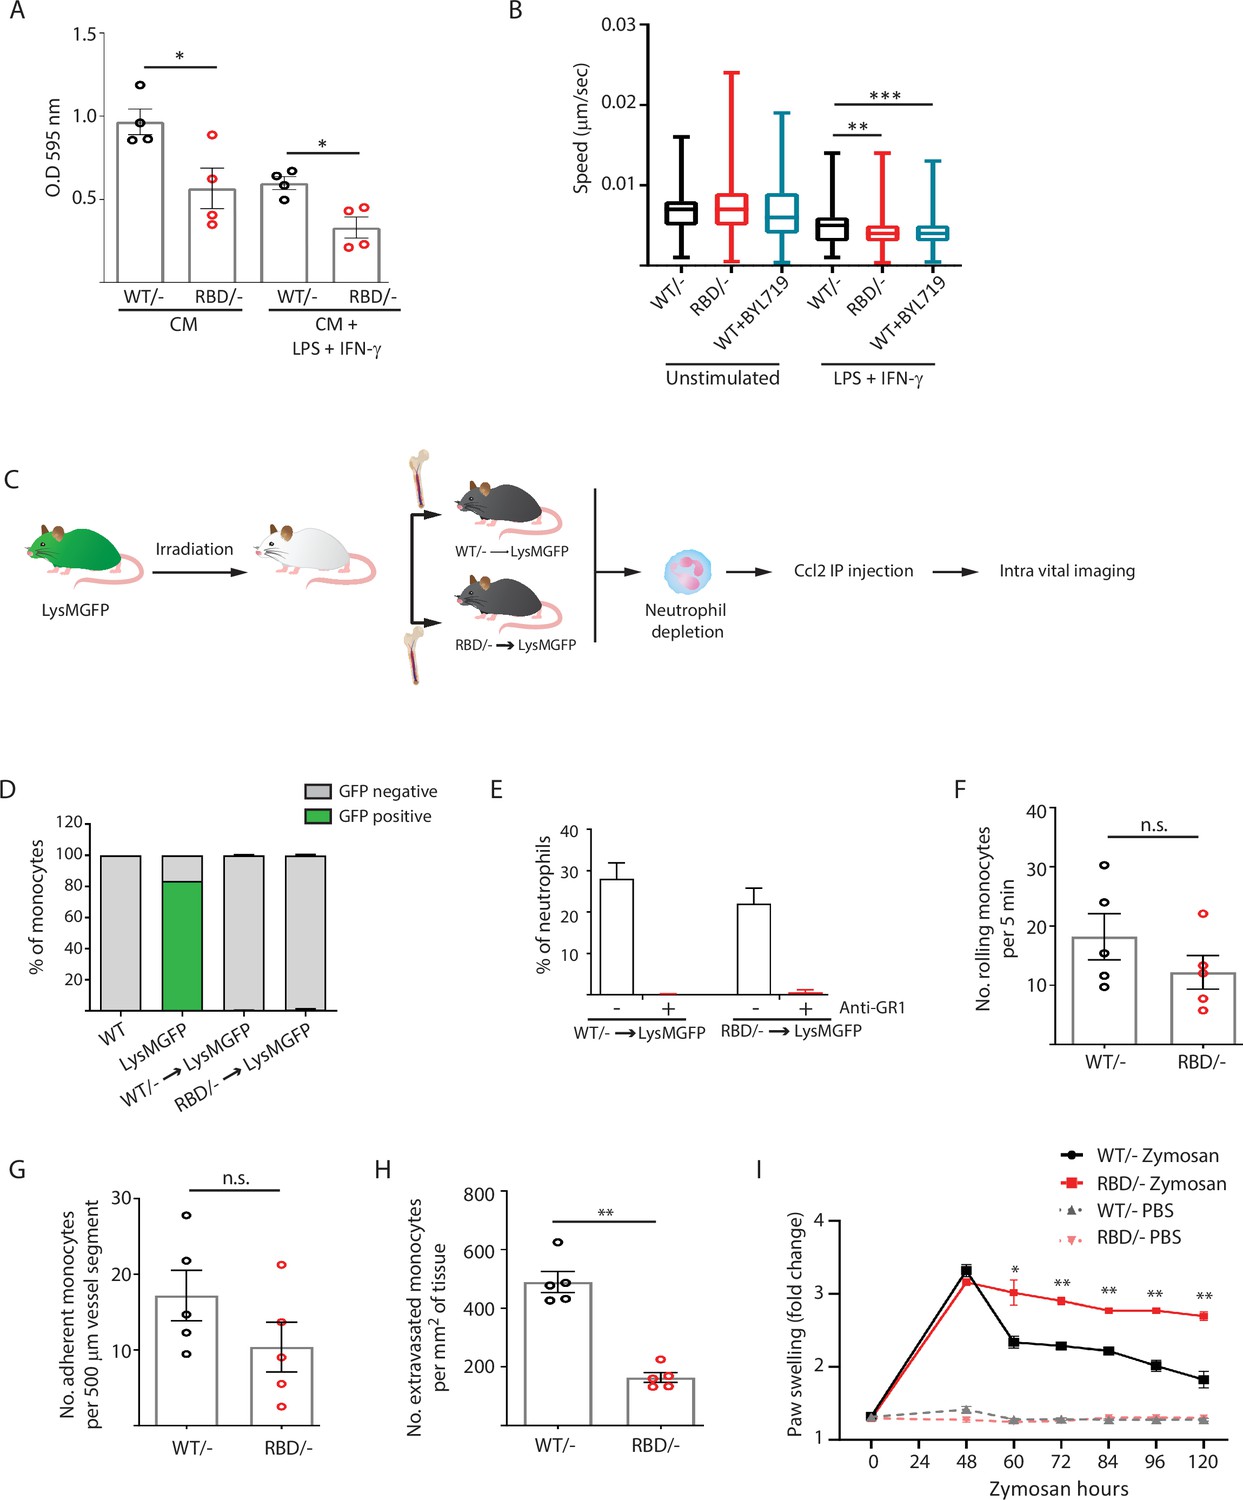
Disruption of RAS–p110α interaction impairs transendothelial extravasation to sites of inflammation.
(A) Graph indicating the quantification of Pik3caRBD/– and Pik3caRBD/– bone marrow-derived macrophages (BMDMs) passing through 8 µm membrane pore transwells for 24 hr. Membrane attached macrophages on the lower part of the transwell were stained with crystal violet and quantified. Each dot represents an independent experiment. Error bars indicate mean ± SEM. (B) Random migration of Pik3caWT/–, Pik3caRBD/–, and Pik3caWT/WT BMDMs treated with BYL719 (500 ng/ml) was analysed by time-lapse video microscopy and cell tracing in the presence or absence of lipopolysaccharide (LPS) (100 ng/ml) and interferon gamma (IFN-γ) (20 ng/ml). (C) Schematic representation of myeloid chimera generation strategy. (D) Graph showing level of bone marrow reconstitution with Pik3caRBD/– and Pik3caWT/– myeloid lineage. (E) Graph quantifying the number of neutrophils in the blood of chimera mice treated with anti-GR1 (25 μg/mouse/day). Intravital imaging quantification of the number of (F) rolling monocytes per 5 min; (G) adherent monocytes per 500 µm of vessel segment; (H) extravasated monocytes per mm2 of tissue. Each dot represents an individual mouse. (I) Chimera Pik3caWT/− and Pik3caRBD/− mice were injected with zymosan or PBS in the back-hind paws and inflammation was measured and plotted over time, Pik3caWT/− PBS n = 5; Pik3caRBD/– PBS n = 5; Pik3caWT/− Zymosan n = 5; Pik3caRBD/– Zymosan n = 5. Statistical significance was obtained using Mann–Whitney test (A–H) or two-way ANOVA test (I): n.s., non-significant; *p < 0.05; **p < 0.01; ***p < 0.001.
Figure 3—figure supplement 1
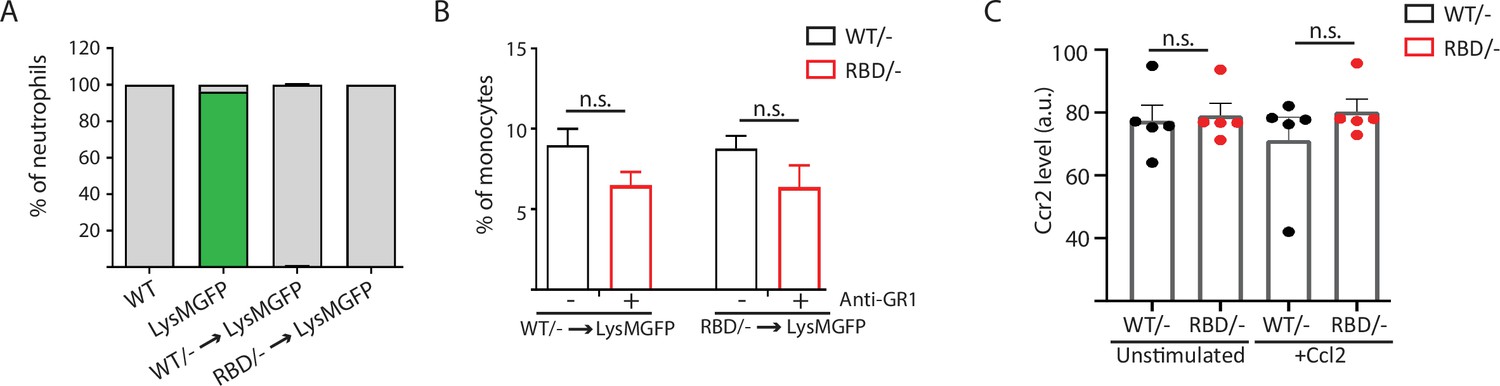
Pik3caRBD/– monocytes do not extravasate through the endothelium.
(A) Graph showing levels of neutrophil reconstitution in chimera’s bone marrow. Blood from chimera mice was collected and GFP in granulocytes was analysed by flow cytometry to determine engraftment percentage. (B) Graph quantifying the number of monocytes in the blood of chimera mice treated with anti-GR1 (25 μg/mouse/day) for 3 days. (C) Graph showing levels of expression of CCR2 in Pik3caWT/– and Pik3caRBD/– bone marrow-derived macrophages (BMDMs) detected by flow cytometry. Each dot represents an individual mouse. Error bars indicate mean ± SEM. Significance using Mann–Whitney test: n.s., non-significant.
Figure 4 with 1 supplement
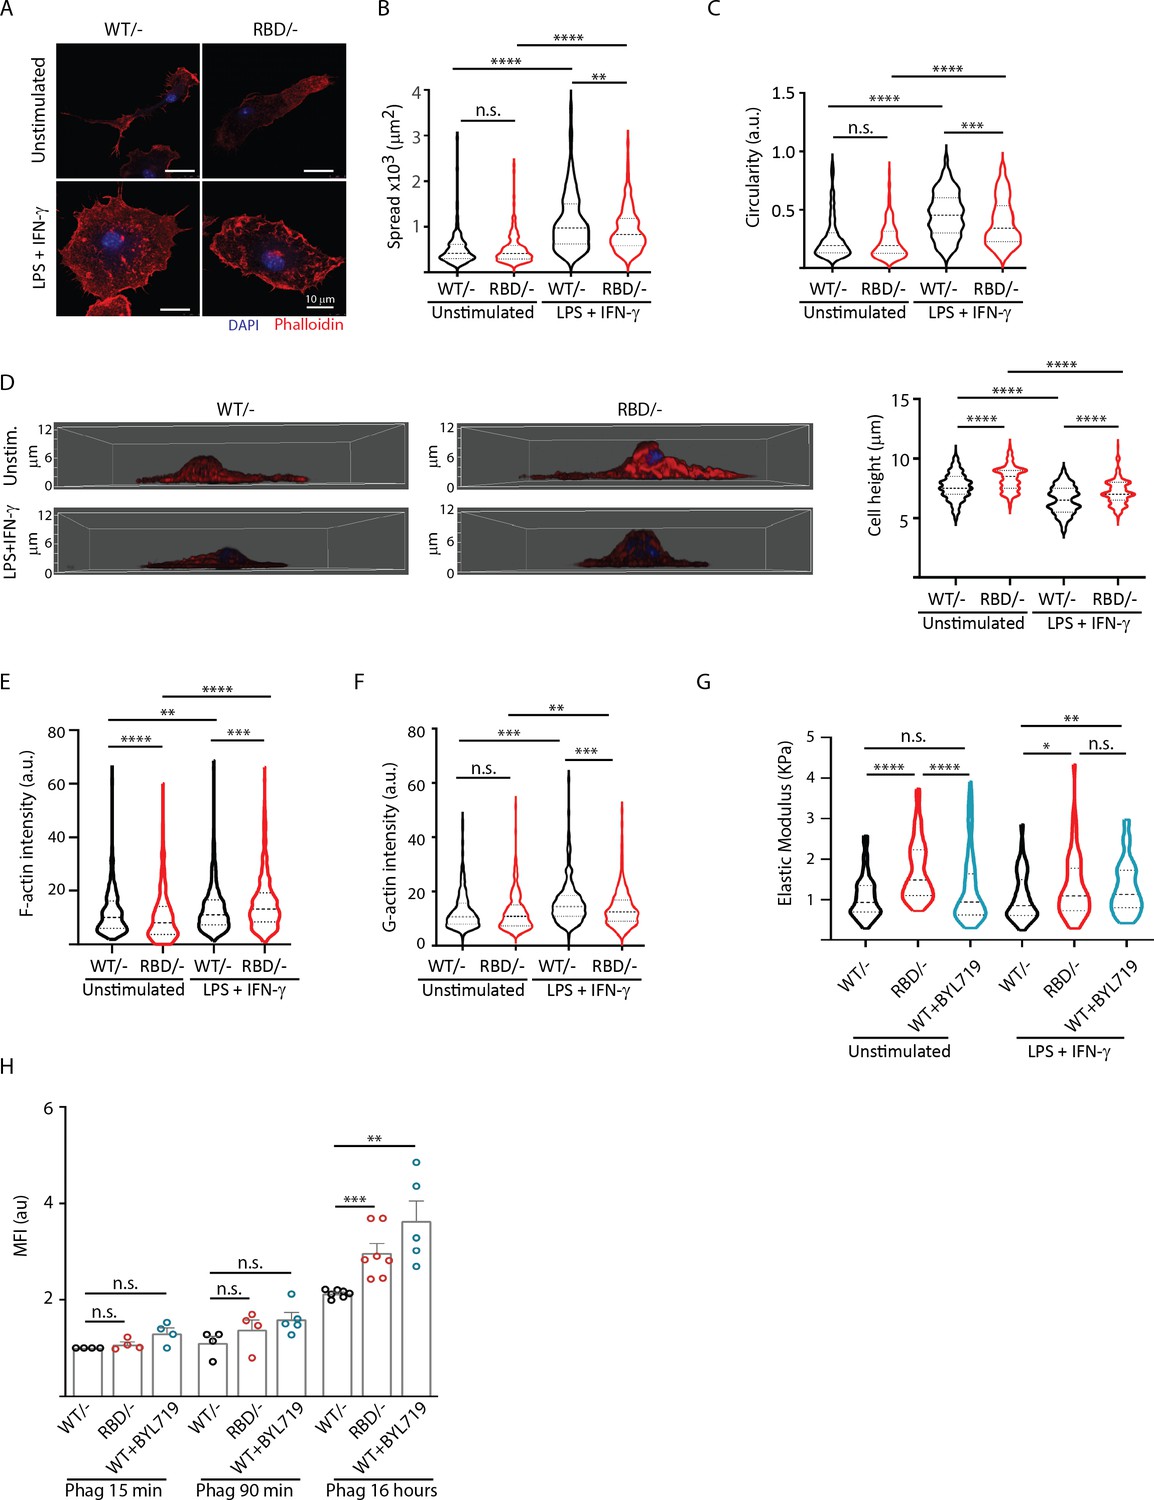
Disruption of RAS–p110a signalling impairs bone marrow-derived macrophage (BMDM) ability to remodel their cytoskeleton in response to inflammatory cues.
(A) Representative images of Pik3caWT/− and Pik3caRBD/− BMDMs unstimulated or activated with lipopolysaccharide (LPS) + interferon gamma (IFN-γ). (B) Violin plot quantifying spread area. IF images of Pik3caWT/− and Pik3caRBD/− BMDMs co-stained with phalloidin and DAPI were used to analyse spread area. Results are represented as a violin plot. Three independent biological replicates were analysed (n ≥ 250 total cells). (C) Quantification of cell circularity of Pik3caWT/− and Pik3caRBD/− BMDMs unstimulated or activated with LPS + IFN-γ. Quantification was performed using the same images from panel (A). (D) Representative 3D projections of Pik3caWT/− and Pik3caRBD/− BMDMs unstimulated or activated with LPS + IFN-γ and violin plot showing quantification of the corresponding cell height. 3D projections and cell height were analysed using same images used in panel (A). (E) Violin plot representing F-actin pool in Pik3caWT/− and Pik3caRBD/− BMDMs unstimulated or activated with LPS + IFN-γ. Three independent biological replicates were analysed (n ≥ 250 total cells). (F) Violin plot representing G-actin pool (measured by DNAse staining) in Pik3caWT/− and Pik3caRBD/− BMDMs unstimulated or activated with LPS + IFN-γ. Three independent biological replicates were analysed (n ≥ 250 total cells). (G) Graph showing stiffness (elastic modulus) of Pik3caWT/− and Pik3caRBD/− BMDMs. (H) Graph showing phagocytosis of apoptotic cells (efferocytosis) over time in Pik3caWT/−, Pik3caRBD/–, and Pik3caWT/WT BMDMs treated with BYL719 BMDMs. Statistical significance was obtained using Mann–Whitney test: n.s., non-significant; *p < 0.05; **p < 0.01; ***p < 0.001; ****p < 0.0001.
Figure 4—figure supplement 1
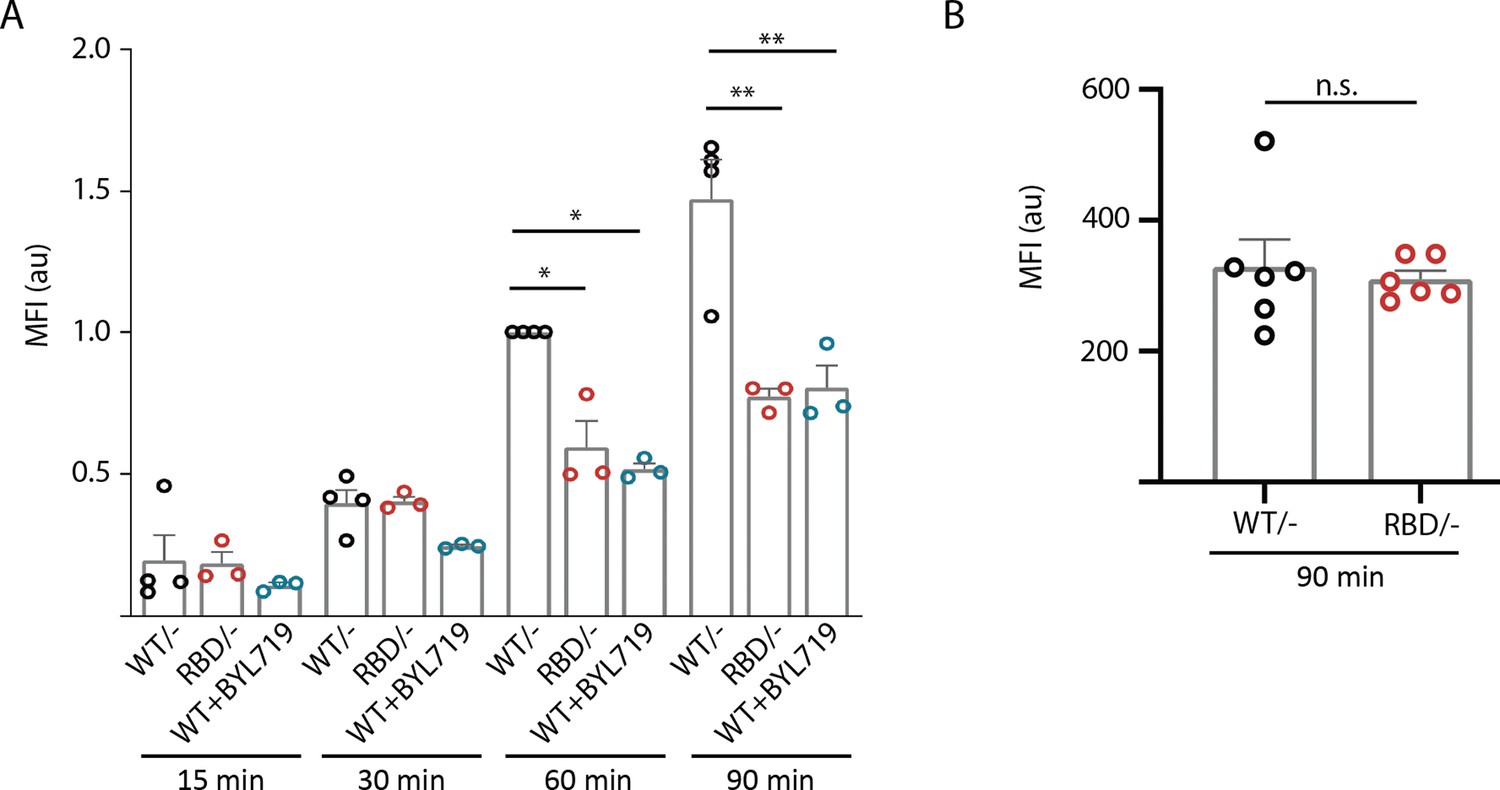
Disruption of RAS–p110α interaction has a differential role in phagocytosis.
(A) Graph representing the ability of Pik3caRBD/– and Pik3caRBD/– bone marrow-derived macrophages (BMDMs) to phagocyte sepharose beads. Data from three independent experiments are presented. (B) Graph representing the ability of Pik3caRBD/– and Pik3caWT/– BMDMs to phagocyte Borrelia burgdorferi. Data from six independent mice are presented. Error bars indicate mean ± SEM. Significance using Mann–Whitney test: *p < 0.05; **p < 0.01; n.s., non-significant.
Figure 5 with 1 supplement
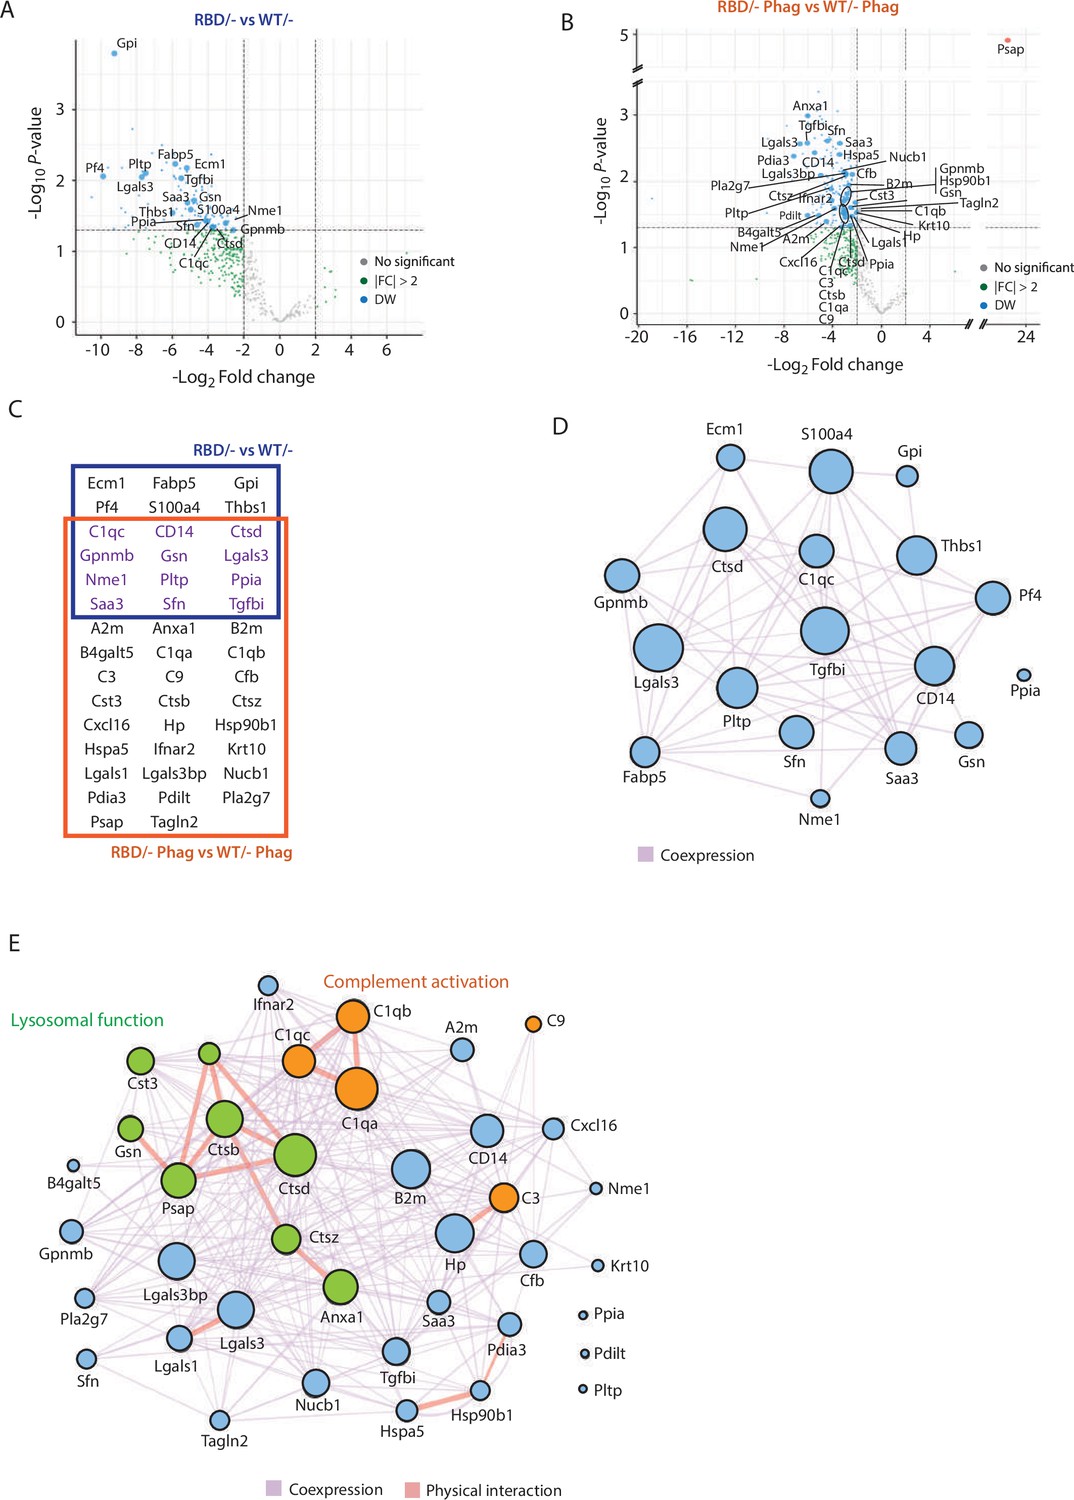
Secretome analysis of Pik3caRBD/− bone marrow-derived macrophages (BMDMs) suggested a defect in complement activation and lysosomal function.
Volcano plots of secretome analysis from Pik3caWT/− and Pik3caRBD/− BMDMs in non-stimulated conditions (A) or phagocytosing apoptotic cells (B). The x-axis shows the log2 FC of each identified protein and the y-axis the corresponding −log10 p value. Statistically significant peptides with FC ≥2 and p-value <0.05 are in blue; peptides that do not pass this threshold are in grey; peptides with FC ≥2 but p-value ≥0.05 are in green. (C) Venn diagram showing the overlap of Pik3caRBD/− versus Pik3caWT/− BMDMs differentially expressed proteins at rest and during phagocytosis of apoptotic cells. Proteins displayed in the blue square represents peptides differentially expressed in resting BMDMs, the brown square represents peptides differentially expressed during phagocytosis, and the peptides differentially expressed in both conditions are displayed in purple. Network analysis of significantly expressed proteins identified in the secretome analysis of Pik3caRBD/− versus Pik3caWT/− BMDMs in steady-state conditions (D) or during phagocytosis of apoptotic cells (E). The nodes represent individual proteins, and the edges represent known interactions between proteins, either co-expression (purple) or physical interaction (thick pink). The size of each node reflects the significance of differential expression. Proteins in green have been implicated in lysosomal function, while proteins in orange are members of the complement cascade.
Figure 5—figure supplement 1

Disruption of RAS–p110α interaction alters the secretome of bone marrow-derived macrophages (BMDMs).
(A) Representative graph showing cell viability of LKR10 cells treated with increasing doses of cisplatin for 24 hr. (B) Dendrogram showing hierarchical clustering of peptides found in the secretome analysis of Pik3caRBD/– and Pik3caWT/– BMDMs in steady-state conditions. (C) Dendrogram showing hierarchical clustering of peptides found in the secretome analysis of Pik3caRBD/– and Pik3caWT/– BMDMs phagocytosing apoptotic cells.
Figure 6 with 1 supplement
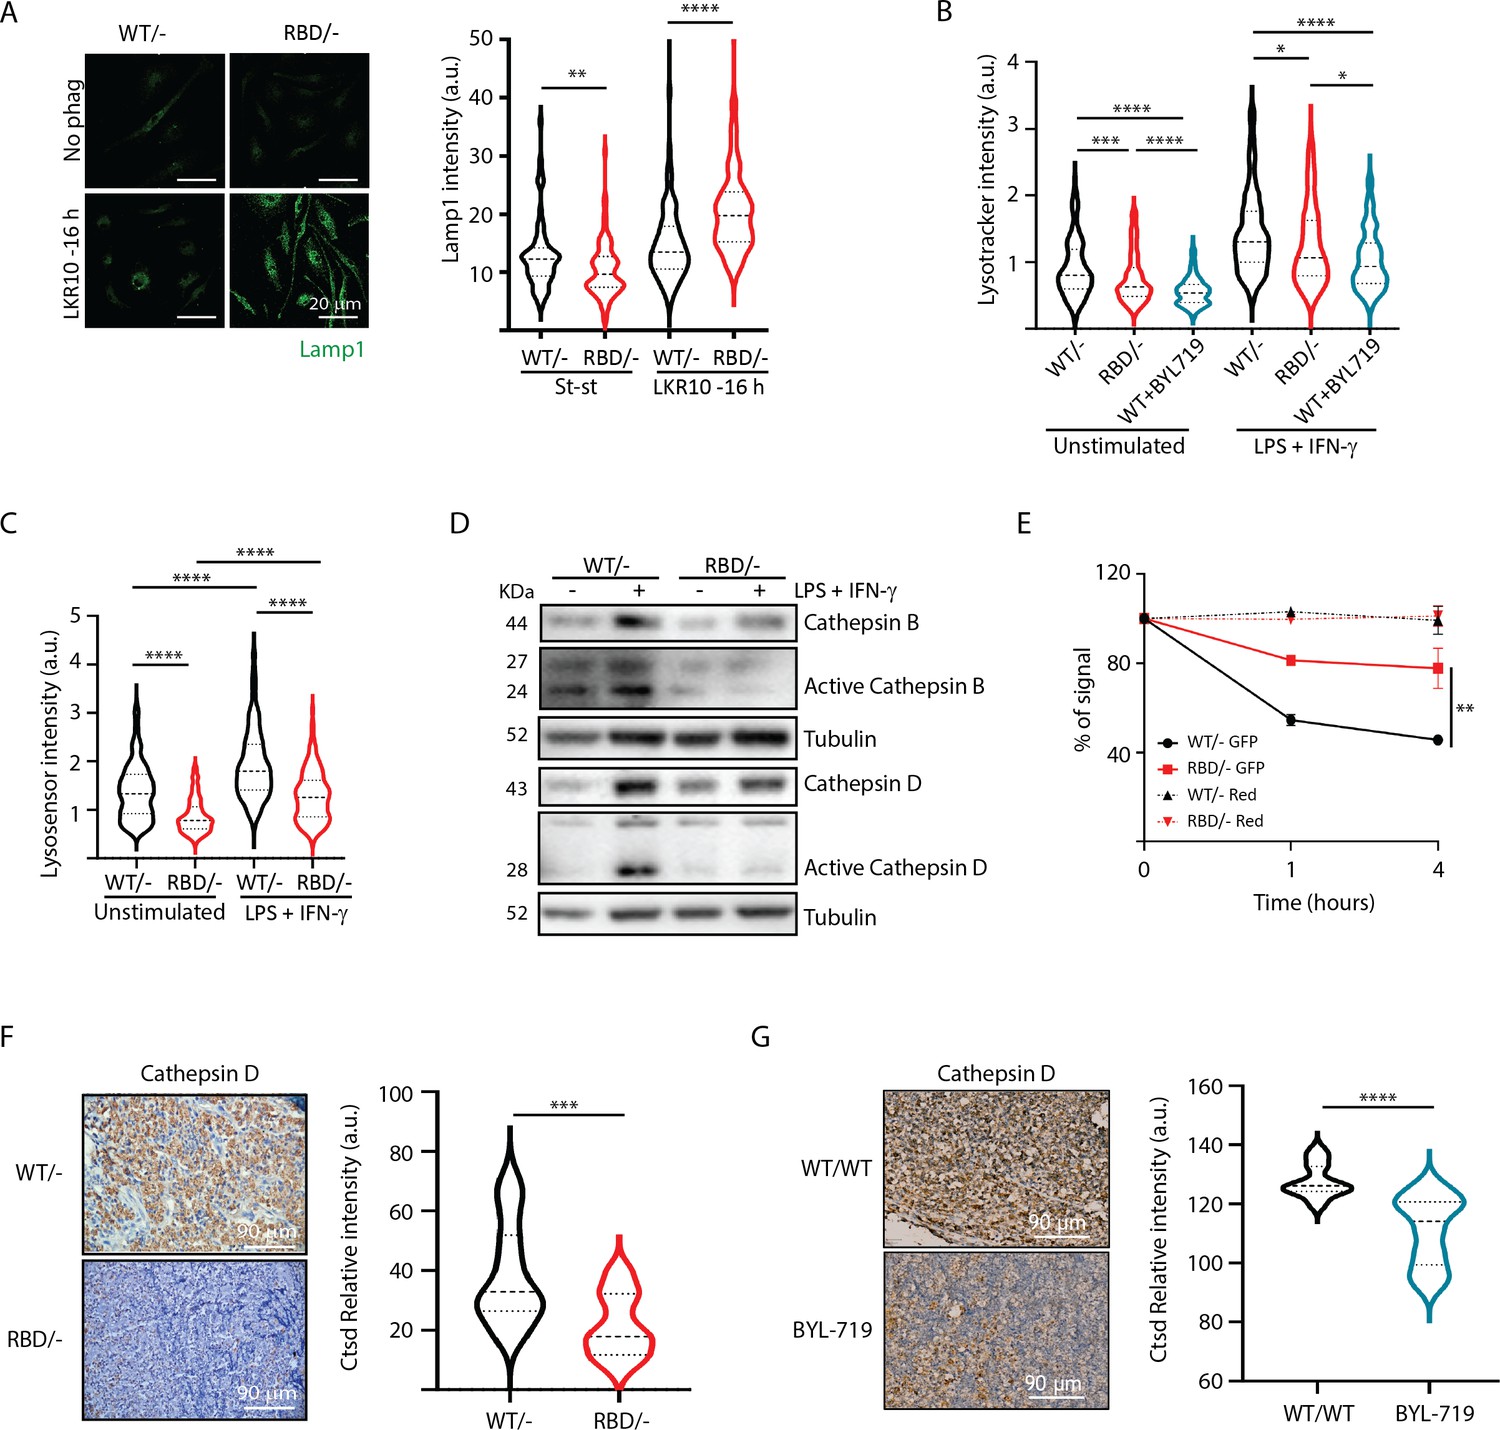
Disruption of RAS–p110a activation in bone marrow-derived macrophages (BMDMs) leads to abnormal lysosomal function.
(A) Representative IF images and quantification analysis of lamp intensity in Pik3caWT/− and Pik3caRBD/− BMDMs in steady-state conditions and during phagocytosis of apoptotic LKR10 cells. Three independent biological replicates were analysed (n ≥ 250 total cells). Error bars indicate mean ± SEM. (B) Quantification analysis of lysosomal function in Pik3caWT/−, Pik3caRBD/– and Pik3caWT/WT BMDMs treated with BYL719 BMDMs unstimulated or activated with lipopolysaccharide (LPS) + interferon gamma (IFN-γ) using Lysotracker staining. Three independent biological replicates were analysed (n ≥ 250 total cells). (C) Violin plot displaying lysosome pH acidity in unstimulated and LPS + IFN-γ-stimulated Pik3caWT/− (black), Pik3caRBD/– (red), and Pik3caWT/WT BMDMs treated with BYL719 (blue) BMDMs, as determined by Lysosensor staining. Three independent biological replicates were analysed (n ≥ 250 total cells). (D) Pik3caWT/− and Pik3caRBD/− BMDMs were activated with LPS and IFN-γ and expression and activation of Cathepsins B and D were blotted. (E) Quantification of phagocytosed apoptotic cells in Pik3caWT/−, Pik3caRBD/–, and Pik3caWT/WT BMDMs treated with BYL719 BMDMs. Apoptotic cells were labelled with a red tracker and allowed to be phagocytosed by control, Pik3caRBD/– and Pik3caWT/WT BMDMs treated with BYL719 for 16 hr, measuring the amount of cell tracker that was internalized at different time points. Each dot of the graph indicates a different independent experiment. Error bars indicate mean ± SEM. (F) Representative image and quantification of Cathepsin D expression in the inflammatory a bscess of Pik3caWT/− and Pik3caRBD/− paws injected with zymosan. (G) Representative image and quantification of Cathepsin D expression in the inflammatory abscess of paws from control and Pik3caWT/WT mice treated with BYL719 injected with zymosan. Statistical significance was obtained using Mann–Whitney test: *p < 0.05; **p < 0.01; ***p < 0.001; ****p < 0.0001.
-
Figure 6—source data 1
Membranes corresponding to Cathepsin B, activated Cathepsin B, Cathepsin D, activated Cathepsin D and Tubulin (as loading control) western blots presented in Figure 6D, labelled.
- https://cdn.elifesciences.org/articles/94590/elife-94590-fig6-data1-v1.zip
-
Figure 6—source data 2
Membranes corresponding to Cathepsin B, activated Cathepsin B, Cathepsin D, activated Cathepsin D and Tubulin (as loading control) western blots presented in Figure 6D.
- https://cdn.elifesciences.org/articles/94590/elife-94590-fig6-data2-v1.zip
Figure 6—figure supplement 1
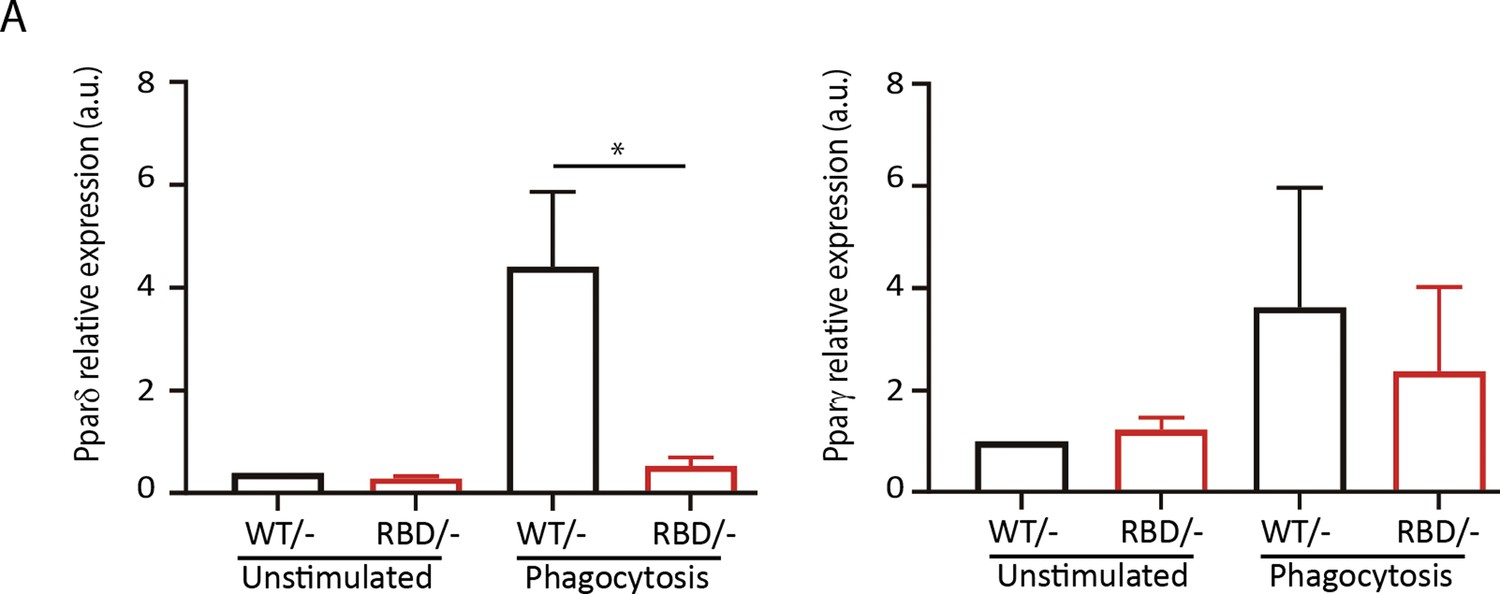
Disruption of RAS–p110α interaction impacts expression of inflammation resolution mediators.
Pik3caRBD/– and Pik3caRBD/– bone marrow-derived macrophages (BMDMs) were set up to phagocyte apoptotic cells and expression of (A) Pparδ and (B) Pparγ was measured by qPCR.Data were obtained from at least three independent replicates. Error bars indicate mean ± SEM. Significance using Mann–Whitney test: *p < 0.05.
Figure 7
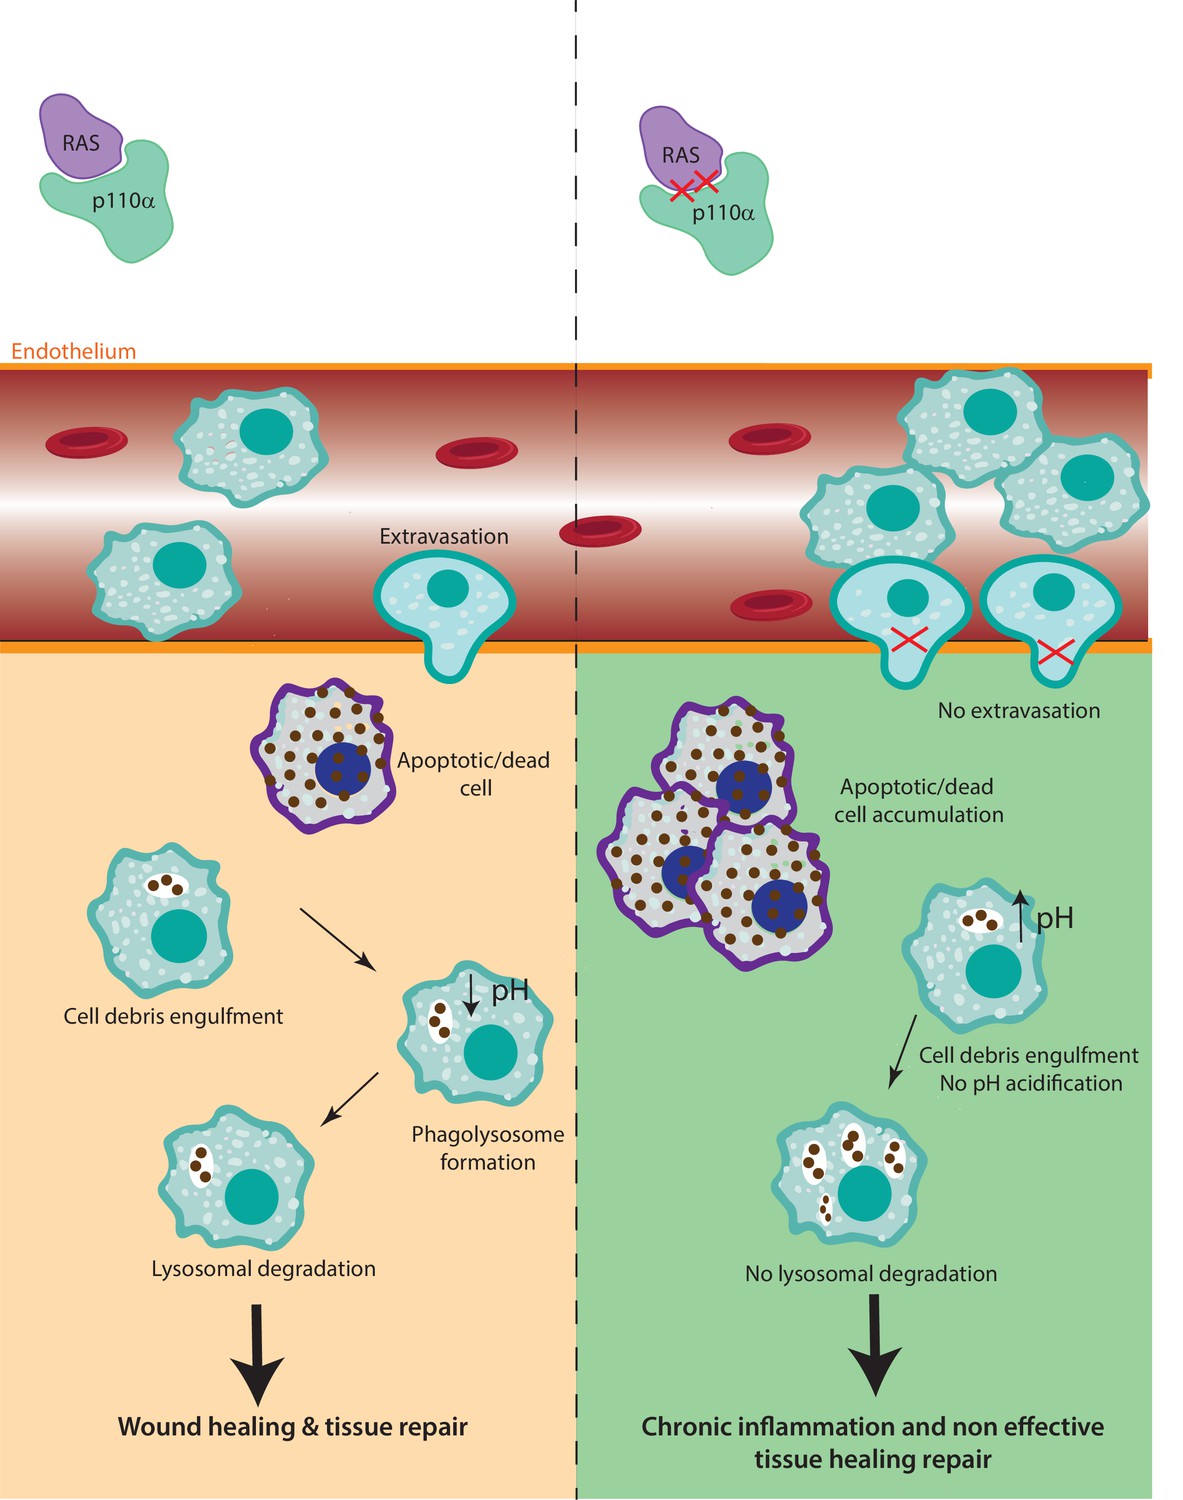
The role of RAS–p110α in macrophage-mediated inflammatory responses.
In the presence of functional RAS–p110α, monocytes efficiently migrate through the endothelium in response to inflammatory signals. Following extravasation, monocyte-derived and resident macrophages clear apoptotic cells via phagocytosis and lysosomal degradation, facilitating resolution of inflammation. In contrast, loss of RAS–p110α leads to cytoskeletal changes that hinder monocyte transendothelial migration. Additionally, resident macrophages exhibit impaired degradation of phagocytosed particles, resulting in unresolved inflammation and more severe acute inflammatory responses.
Author response image 1

Additional files
-
Supplementary file 1
List of proteins differentially expressed in the secretome of unstimulated Pik3caRBD/- versus Pik3caWT/- bone marrow-derived macrophages (BMDMs).
- https://cdn.elifesciences.org/articles/94590/elife-94590-supp1-v1.xlsx
-
Supplementary file 2
List of proteins differentially expressed in the secretome of Pik3caRBD/- versus Pik3caWT/- bone marrow-derived macrophages (BMDMs) during apoptotic cell phagocytosis.
- https://cdn.elifesciences.org/articles/94590/elife-94590-supp2-v1.xlsx
-
MDAR checklist
- https://cdn.elifesciences.org/articles/94590/elife-94590-mdarchecklist1-v1.pdf
Download links
A two-part list of links to download the article, or parts of the article, in various formats.
Downloads (link to download the article as PDF)
Open citations (links to open the citations from this article in various online reference manager services)
Cite this article (links to download the citations from this article in formats compatible with various reference manager tools)
RAS–p110α signalling in macrophages is required for effective inflammatory response and resolution of inflammation
eLife 13:RP94590.
https://doi.org/10.7554/eLife.94590.4


