OVO positively regulates essential maternal pathways by binding near the transcriptional start sites in the Drosophila female germline
- Section of Developmental Genomics, Laboratory of Biochemistry and Genetics, National Institute of Diabetes and Digestive and Kidney Diseases, National Institutes of Health, United States
- Department of Biology, Johns Hopkins University, United States
Figures
Figure 1 with 1 supplement
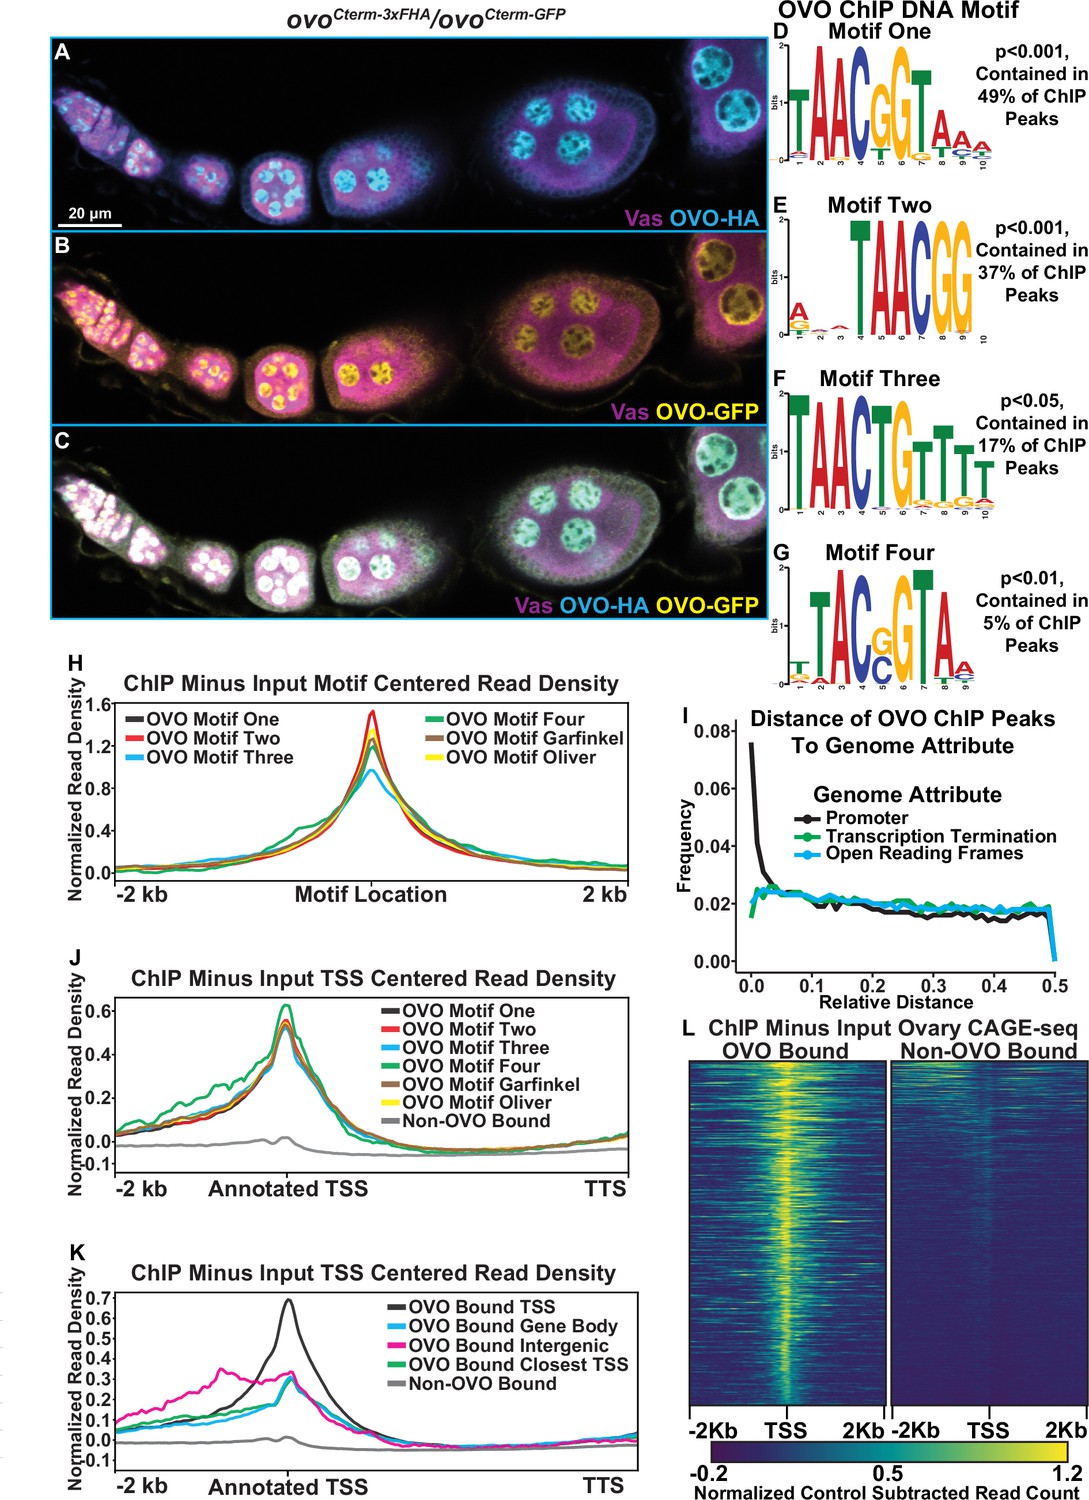
Significantly enriched OVO DNA binding motifs and OVO ChIP attributes genome-wide.
(A–C) Immunofluorescent staining of adult ovarioles of ovoCterm-3xFHA/ovoCterm-GFP females (20 x, scale bar = 20 μm). Ovarioles were stained for Vas (purple) to label the germline, HA (cyan) to label OVO-HA, and GFP (yellow) to label OVO-GFP. The homozygous version of these alleles were used to ChIP OVO. (D–G) Significantly enriched motifs found within overlapping OVO ChIP peaks. The percentage of OVO ChIP peaks containing each motif and their corresponding p-value are indicated to the right. (H) OVO ChIP minus input control ChIP-seq read coverage density centered on the location of the four de novo OVO DNA binding motifs and previously defined in vitro OVO DNA binding motifs (Lü et al., 1998; Bielinska et al., 2005; Lee and Garfinkel, 2000). (I) Relative distance of OVO ChIP peaks to gene level promoters, terminations sequences, and open reading frames genome-wide. (J) OVO ChIP minus input control ChIP-seq read coverage density for genes containing significant OVO ChIP peaks and the corresponding OVO DNA binding motif. Genes are centered on the transcriptional start site. (K) OVO ChIP minus input control ChIP-seq read coverage density for genes bound by OVO over the TSS, gene body, closest TSS in intergenic space, closest TSS for all, or not bound. Genes are centered on the transcriptional start site. (L) OVO ChIP minus input control ChIP-seq heatmaps centered on the dominant significant ovary CAGE-seq TSSs overlapping or not overlapping OVO ChIP peaks.
Figure 1—figure supplement 1
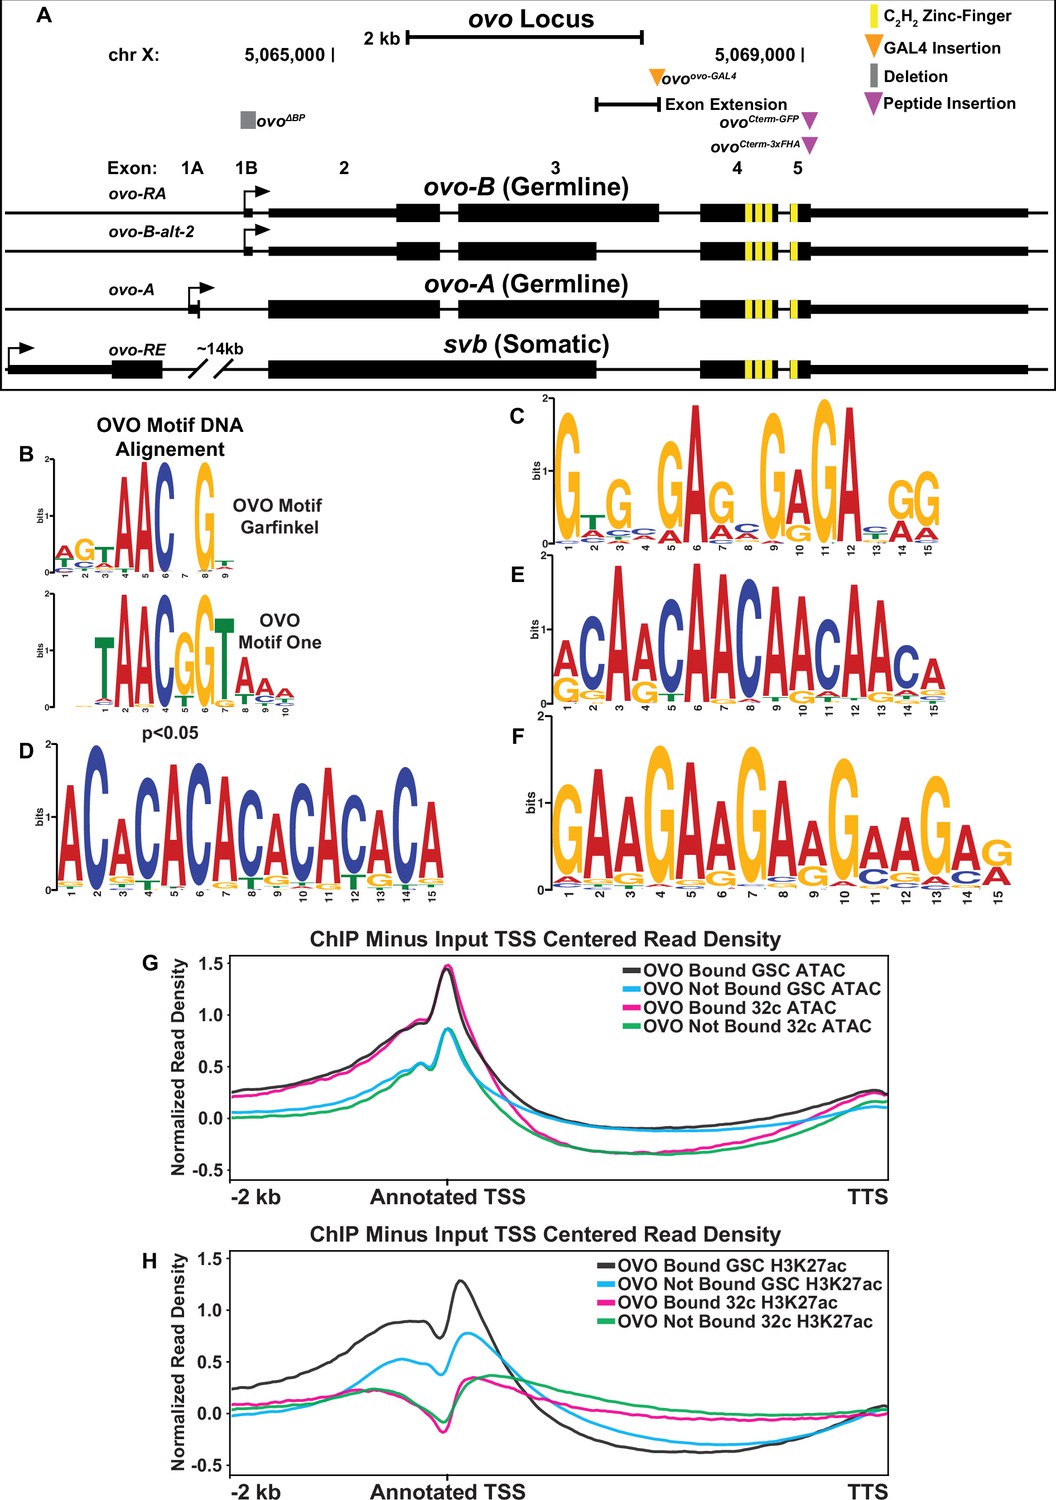
Significant OVO DNA binding motif, enriched motifs in OVO ChIP peaks, and ATAC and H3K27ac ChIP-seq read density for OVO bound and not bound genes.
(A) Cartoon of the transcripts expressed from the ovo locus based on Benner et al., 2023. Gray box represents endogenously generated deletions, orange triangle represents the location of the T2A-GAL4-3xSTOP insertion, purple triangles represent the location of small peptide insertions and yellow boxes represent the location of the shared C2H2 zinc-fingers. Small rectangles represent untranslated regions, large rectangles represent translated regions and arrows indicate TSSs. (B) Significant alignment of the in vivo OVO DNA binding ‘motif one’ and in vitro OVO DNA binding motif (Lee and Garfinkel, 2000). (C–F) Significantly enriched DNA motifs within OVO ChIP peaks. (C) Is a signficiant match for the DNA binding motif of GAF and CLAMP (Omelina et al., 2011; Soruco et al., 2013). (G, H). GSC and 32 c ATAC-seq and H3K27ac ChIP-seq minus input control read coverage density for genes bound by OVO over the TSS, gene body, closest TSS in intergenic space, closest TSS for all, or not bound. Plots are centered on the TSS.
Figure 2 with 1 supplement
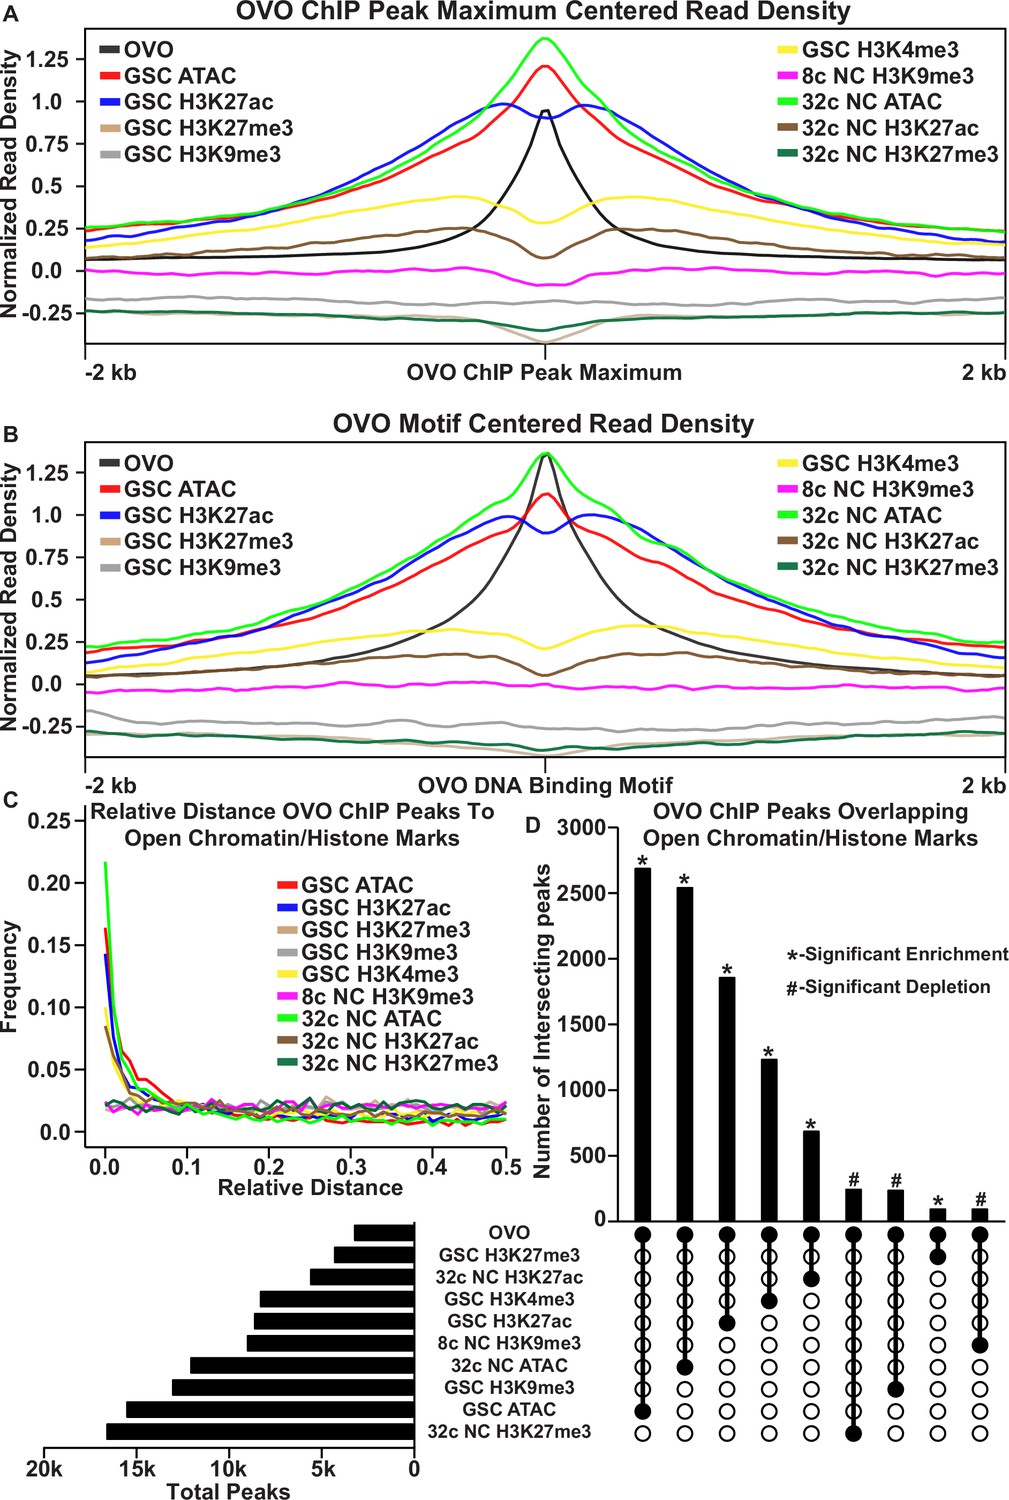
OVO DNA binding is associated with open chromatin and transcriptionally active histone marks.
(A, B) OVO ChIP minus input control, GSC and 32 c ATAC-seq, GSC H3K27ac, H3K4me3, H3K27me3, H3K9me3, 8 c NC H3K9me3, 32 c NC H3K27ac, and H3K27me3 ChIP-seq read coverage density centered on each OVO peak maximum or OVO DNA binding motif located within a significant OVO ChIP peak. (C) Relative distance of OVO ChIP peaks to significantly called peaks for GSC and 32 c ATAC-seq, GSC H3K27ac, H3K4me3, H3K27me3, H3K9me3, 8 c NC H3K9me3, 32 c NC H3K27ac, and H3K27me3 ChIP-seq genome-wide. (D) Total number of significant peaks (left) and the total number of overlapping peaks (top) between OVO ChIP and GSC and 32 c ATAC-seq, GSC H3K27ac, H3K4me3, H3K27me3, H3K9me3, 8 c NC H3K9me3, 32 c NC H3K27ac, and H3K27me3 ChIP-seq. Lines connecting solid dots indicates the amount of overlapping peaks between those two corresponding datasets. Asterisk indicates significantly enriched overlap while hashtag indicates significantly depleted overlap between datasets.
Figure 2—figure supplement 1
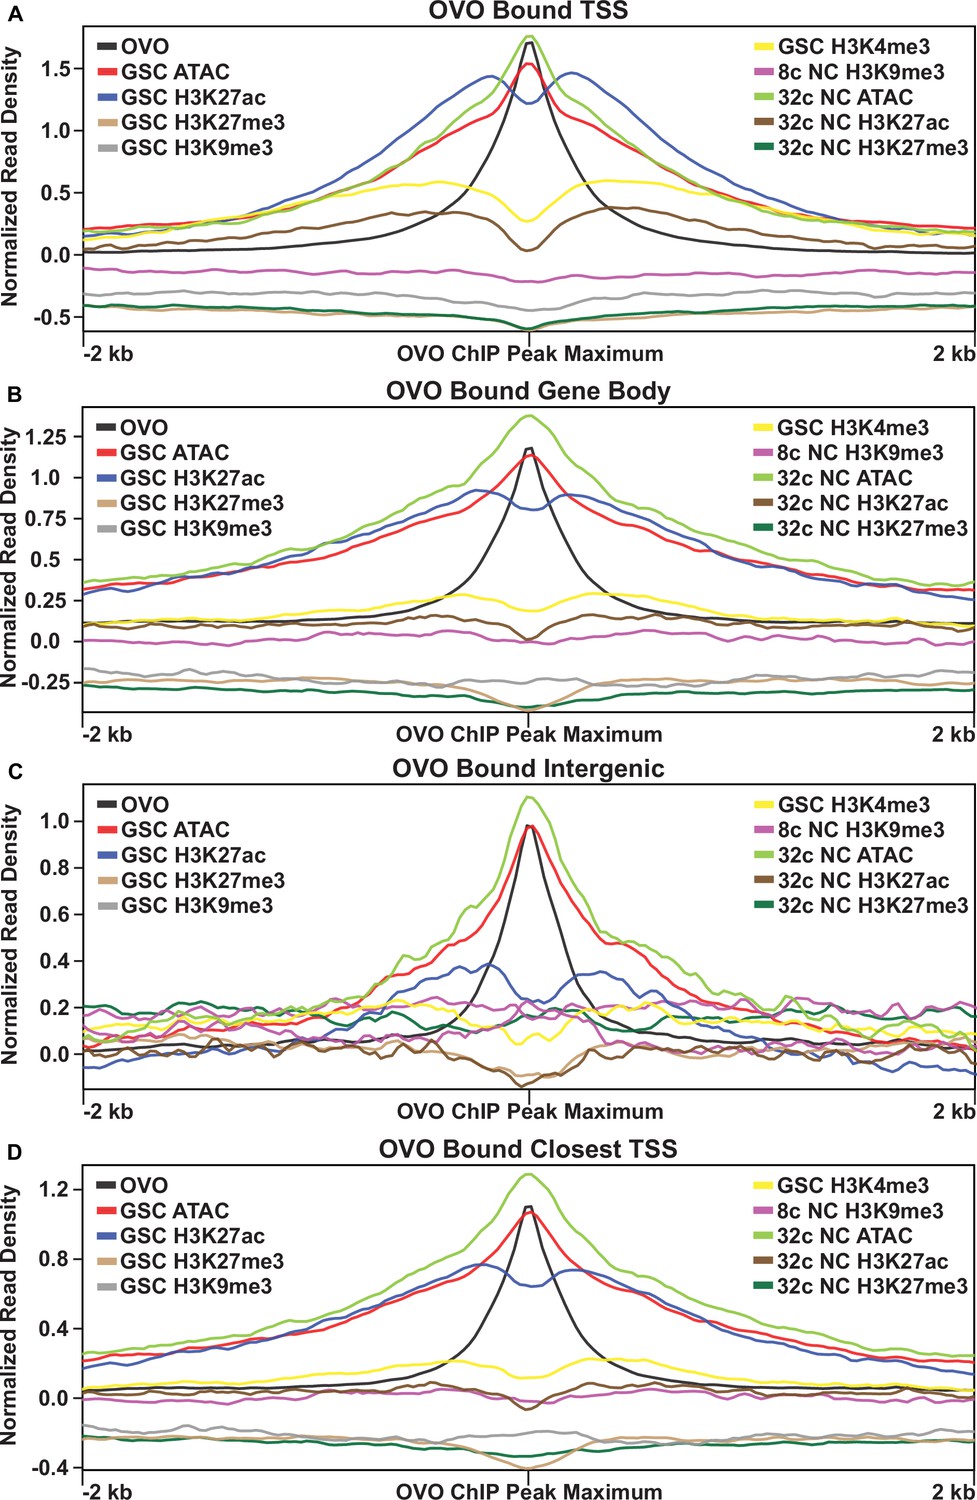
OVO DNA binding is associated with open chromatin and transcriptionally active histone marks across variations of gene binding patterns.
(A–D) OVO ChIP minus input control, GSC and 32 c ATAC-seq, GSC H3K27ac, H3K4me3, H3K27me3, H3K9me3, 8 c NC H3K9me3, 32 c NC H3K27ac, and H3K27me3 ChIP-seq read coverage density centered on OVO peak maximums located within a significant OVO ChIP peak for genes bound by OVO over the TSS, gene body, closest TSS in intergenic space, or closest TSS for all.
Figure 3
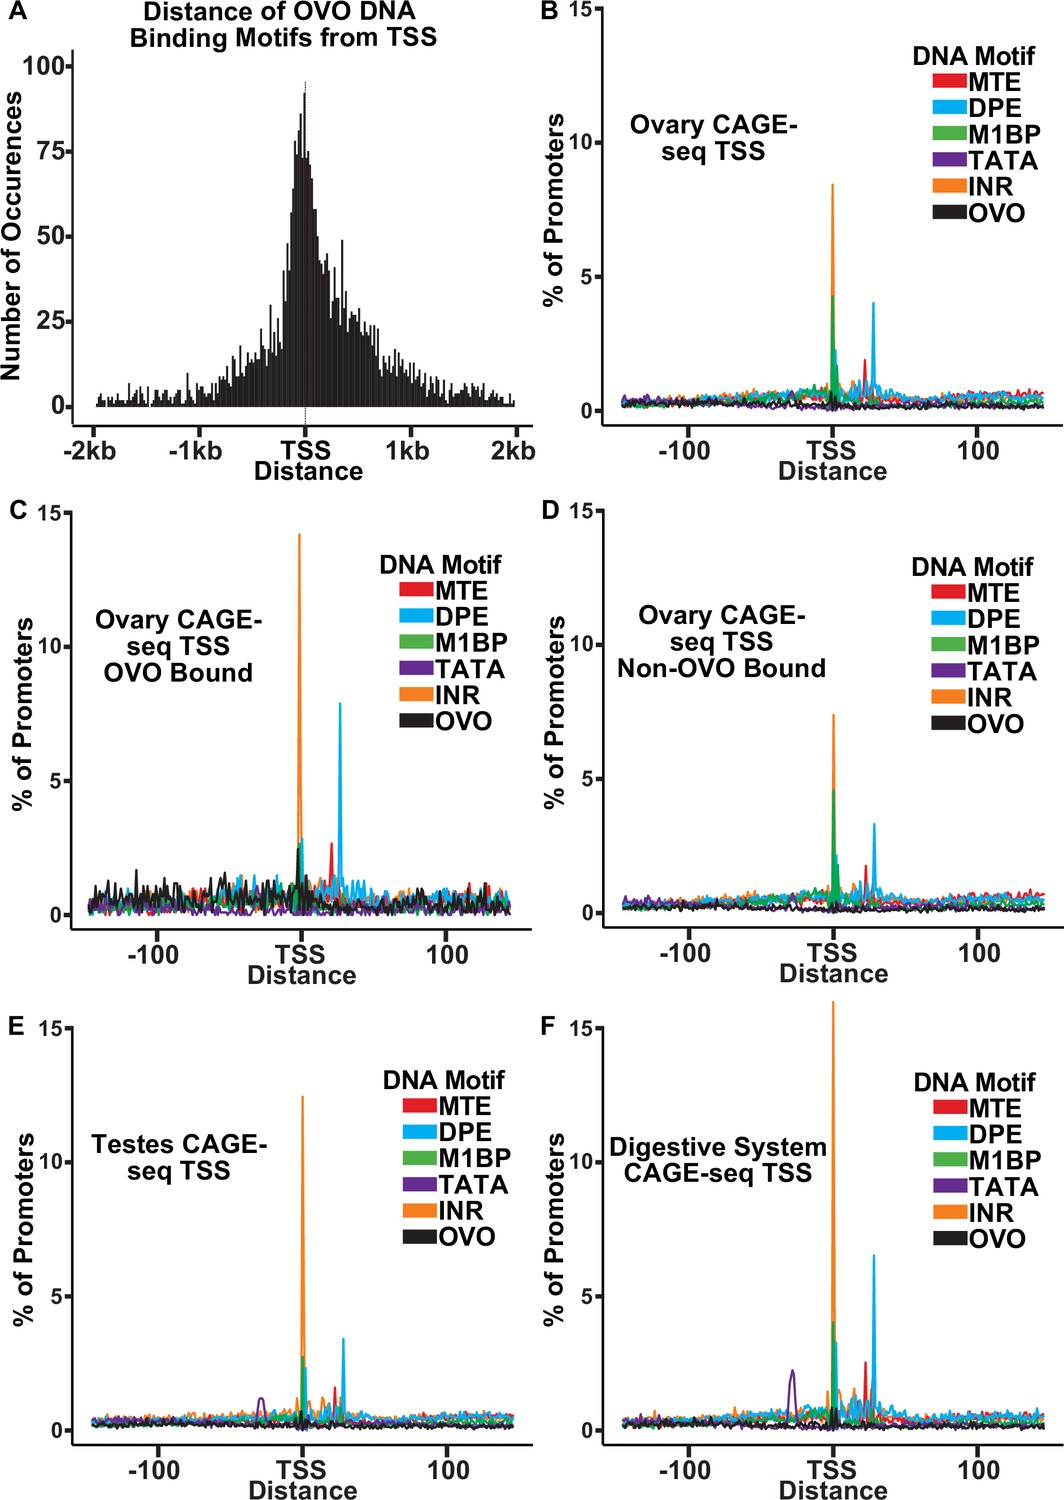
OVO bound promoters are enriched for INR, DPE, and MTE elements.
(A) Histogram of the distance of in vivo and in vitro OVO DNA binding motifs within significant overlapping OVO ChIP peaks from the closest genes TSS. (B–F) Histogram of the percent of promoters from tissue-specific CAGE-seq analysis of common promoter motif elements centered on the dominant significant TSS.
Figure 4
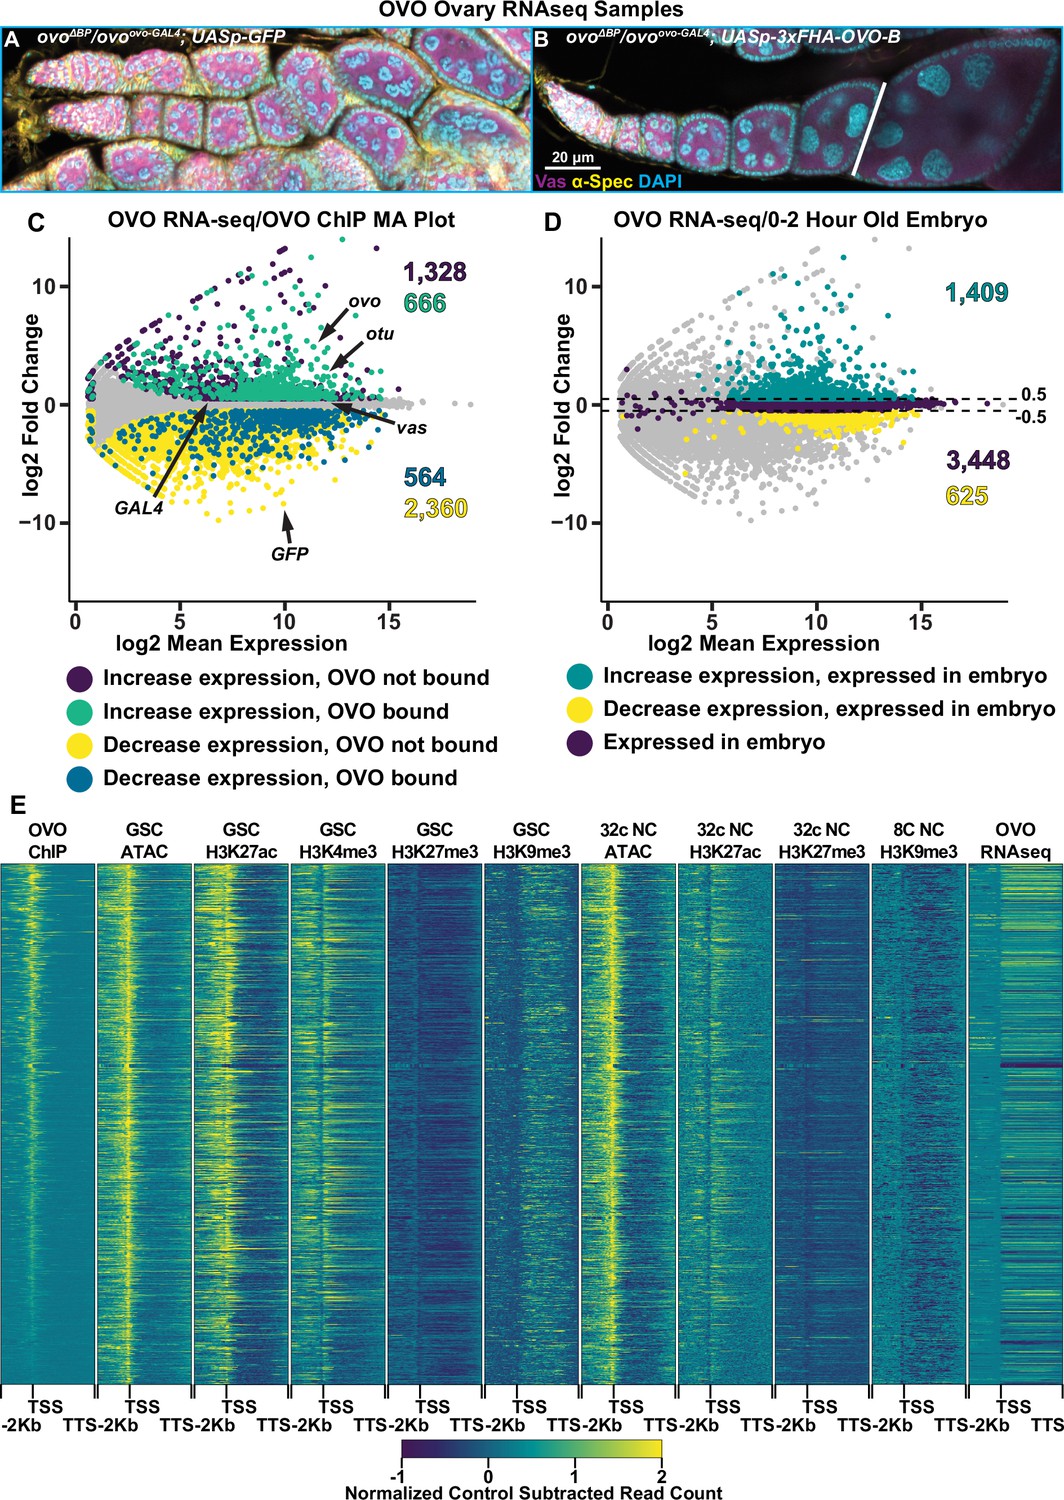
Genes bound by OVO increase in expression in the presence of OVO genome-wide.
(A, B) Immunofluorescent staining of adult ovarioles of the indicated genotypes (20 x, scale bar = 20 μm). Ovarioles were stained for Vas (purple) to label the germline, α-Spectrin (yellow) to label dot spectrosome and fusomes, and DAPI (cyan) to label nuclei. Line indicates the dissection point for germarium through previtellogenic RNA-seq samples. (C) MA plot of ovoΔBP/ovoovo-GAL4; UASp-3xFHA-OVO-B versus ovoΔBP/ovoovo-GAL4; UASp-GFP RNA-seq differential expression results. Purple dots indicate genes that significantly increased in expression and were not bound by OVO, cyan dots indicate genes that significantly increased in expression and were bound by OVO, yellow dots indicate genes that significantly decreased in gene expression and were not bound by OVO, blue dots indicate genes that significantly decreased in gene expression and were bound by OVO, and gray dots indicate genes that were not differentially expressed from our analysis. (D) MA plot of ovoΔBP/ovoovo-GAL4; UASp-3xFHA-OVO-B versus ovoΔBP/ovoovo-GAL4; UASp-GFP RNA-seq differential expression results. Cyan dots indicate genes that significantly increased in expression and were found to be moderately expressed in 0–2 hr old embryos, yellow dots indicate genes that significantly decreased in gene expression and were found to be moderately expressed in 0–2 hr old embryos, purple dots indicate genes that were not differentially expressed and were found to be moderately expressed in 0–2 hr old embryos, and gray dots indicate genes that were not differentially expressed and were not found to be moderately expressed in 0–2 hr old embryos. (E) Gene level read coverage heatmaps of OVO ChIP minus input, GSC and 32 c ATAC-seq, GSC H3K27ac, H3K4me3, H3K27me3, H3K9me3, 8 c NC H3K9me3, 32 c NC H3K27ac, and H3K27me3 ChIP-seq, and ovoΔBP/ovoovo-GAL4; UASp-3xFHA-OVO-B minus ovoΔBP/ovoovo-GAL4; UASp-GFP RNA-seq for genes bound by OVO. The order of the heatmap is genes with the highest to lowest amount of OVO ChIP read density.
Figure 5 with 1 supplement
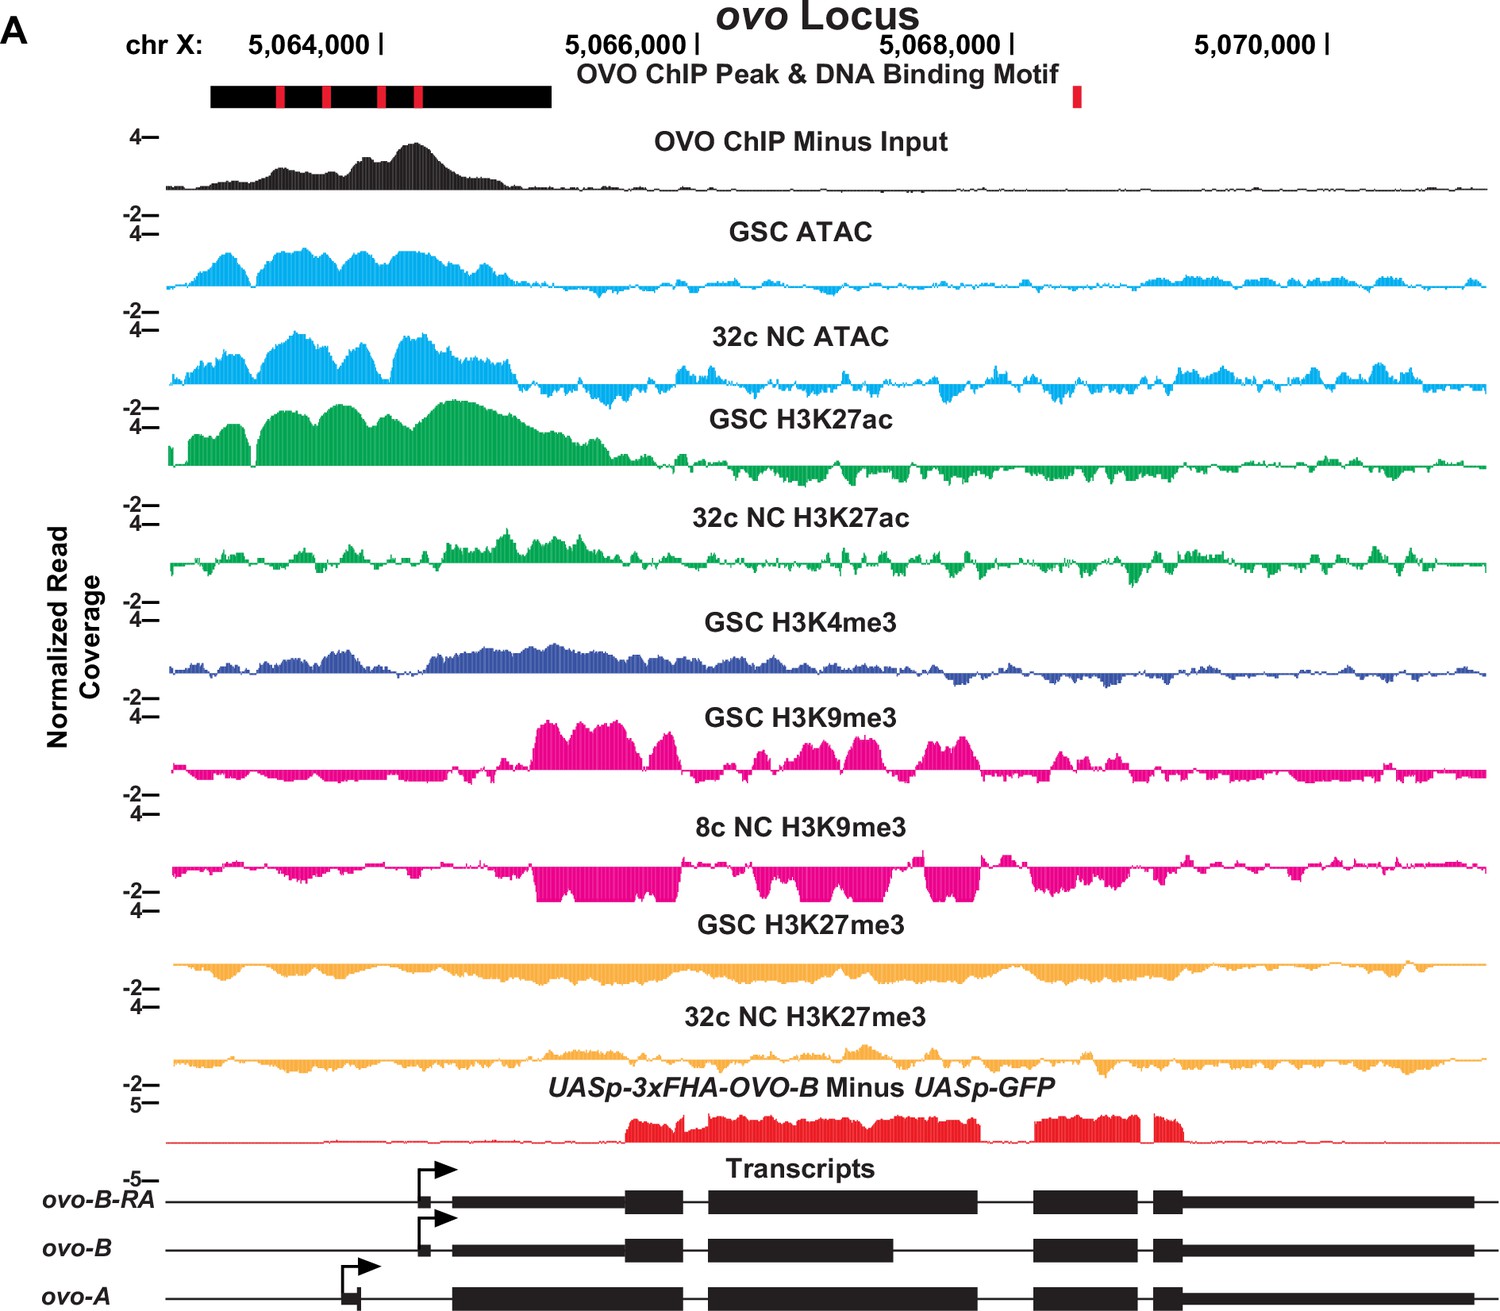
OVO ChIP-seq, ATAC/histone ChIP-seq, RNA-seq, and DNA binding motifs at the ovo locus.
(A) ovo gene level read coverage tracks for OVO ChIP minus input (black), GSC and 32 c ATAC-seq (light blue), GSC and 32 C H3K27ac (green), H3K4me3 (dark blue), GSC and 32 c H3K27me3 (orange), and GSC and 8 c H3K9me3 (pink) ChIP-seq, and ovoΔBP/ovoovo-GAL4; UASp-3xFHA-OVO-B minus ovoΔBP/ovoovo-GAL4; UASp-GFP RNA-seq (red). Red rectangles and black rectangles represent significant OVO DNA binding motifs and OVO ChIP peaks, respectively. Gene models are represented at bottom. Small rectangles represent untranslated regions, large rectangles represent translated regions. Arrows indicate transcriptional start sites.
Figure 5—figure supplement 1
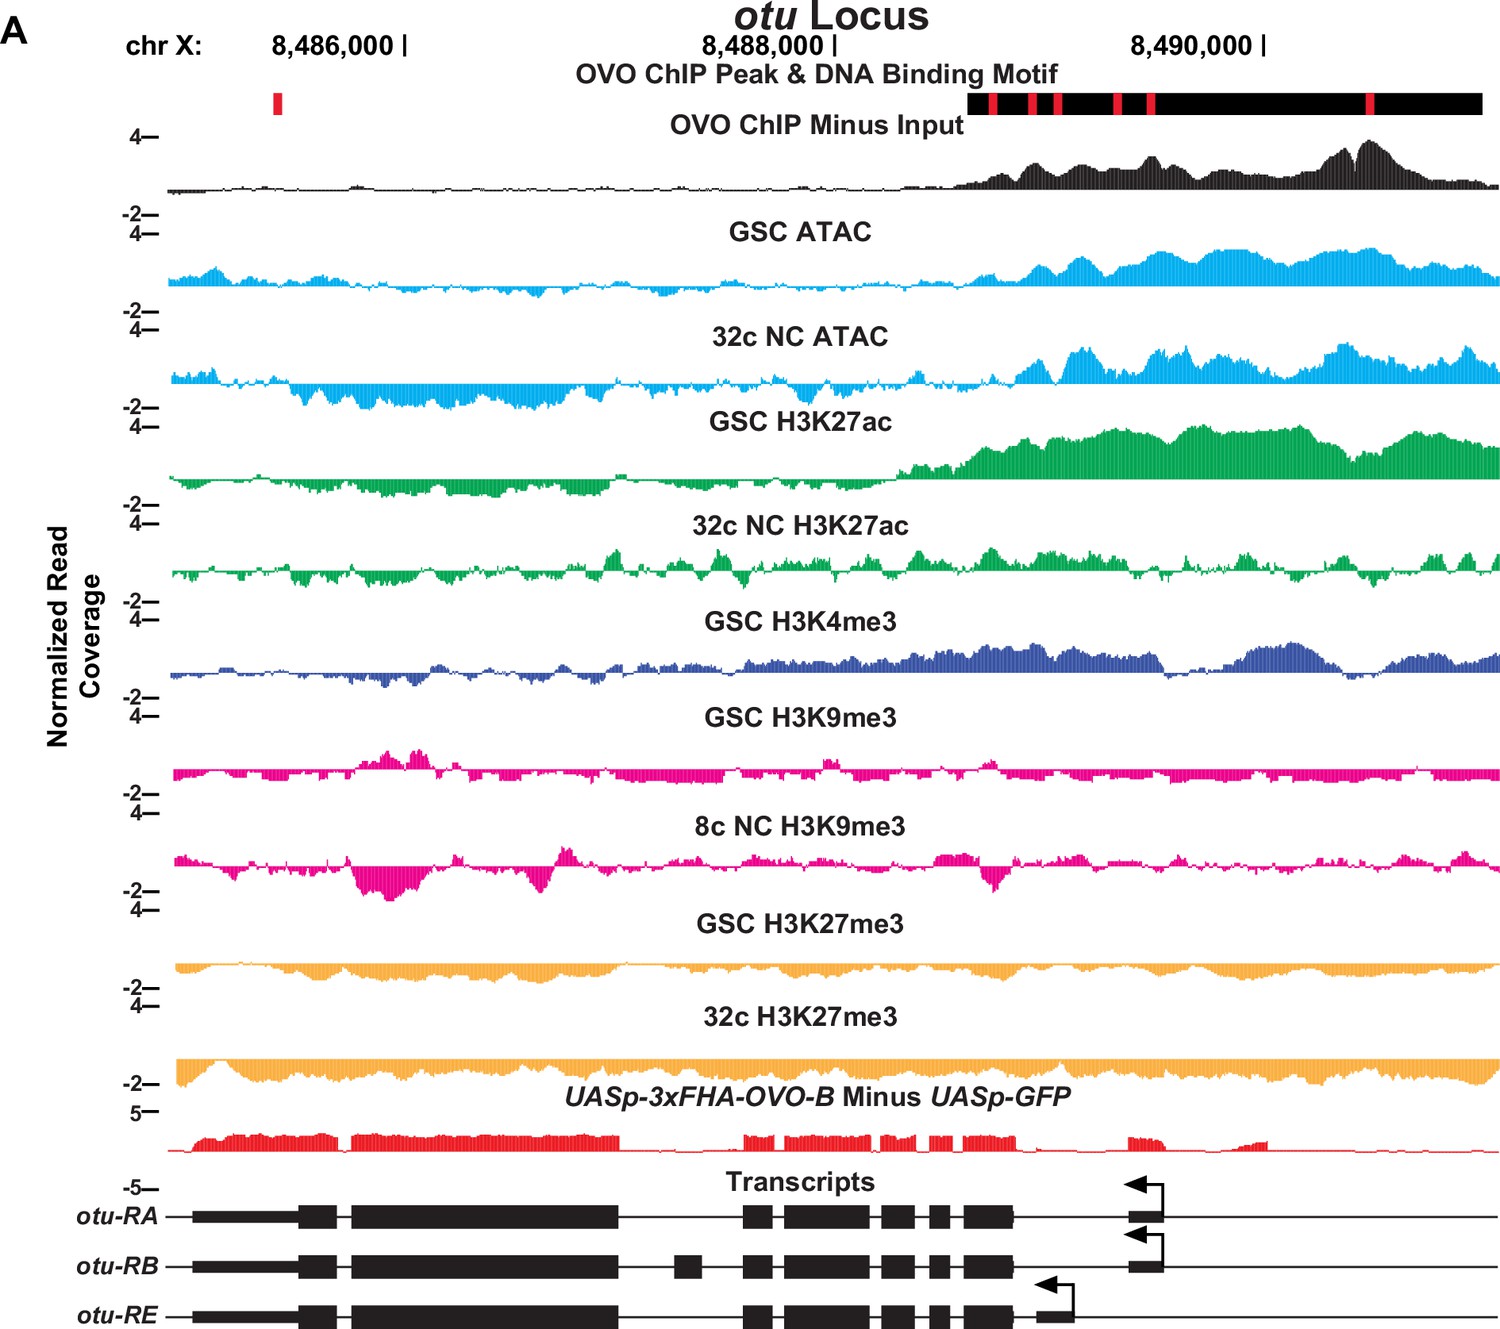
OVO ChIP-seq, ATAC/histone ChIP-seq, RNA-seq, and DNA binding motifs at the otu locus.
(A) otu gene level read coverage tracks for OVO ChIP minus input (black), GSC and 32 c ATAC-seq (light blue), GSC and 32 C H3K27ac (green), H3K4me3 (dark blue), GSC and 32 c H3K27me3 (orange), and GSC and 8 c H3K9me3 (pink) ChIP-seq, and ovoΔBP/ovoovo-GAL4; UASp-3xFHA-OVO-B minus ovoΔBP/ovoovo-GAL4; UASp-GFP RNA-seq (red). Red rectangles and black rectangles represent significant OVO DNA binding motifs and OVO ChIP peaks, respectively. Gene models are represented at bottom. Small rectangles represent untranslated regions, large rectangles represent translated regions. Arrows indicate transcriptional start sites.
Figure 6
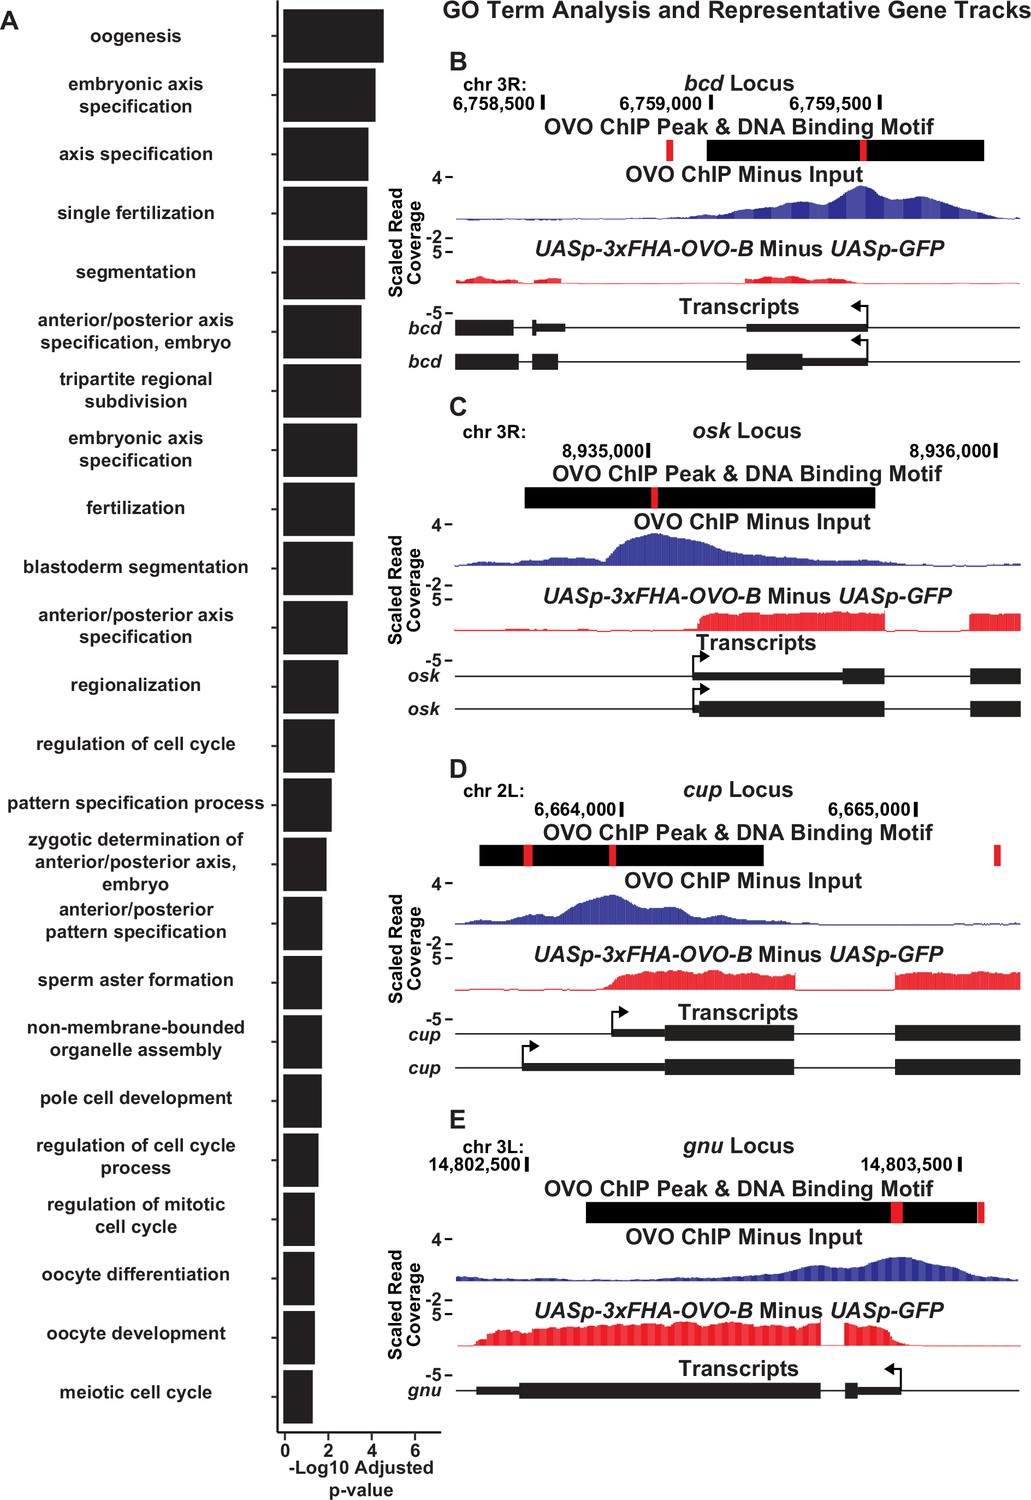
OVO binds and significantly increases the expression of a number of genes involved in essential maternal processes.
(A) Significantly enriched GO biological process terms for genes bound by OVO and significantly increase in expression in the presence of ectopic rescue OVO. GO terms are restricted to the 24 smallest term sizes. (B–E) Example GO term gene level read coverage tracks for OVO ChIP minus input and ovoΔBP/ovoovo-GAL4; UASp-3xFHA-OVO-B minus ovoΔBP/ovoovo-GAL4; UASp-GFP. Red rectangles and black rectangles represent significant OVO DNA binding motifs and OVO ChIP peaks, respectively. Gene models are represented at bottom. Small rectangles represent untranslated regions, large rectangles represent translated regions. Arrows indicate transcriptional start sites.
Additional files
-
Supplementary file 1
OVO ChIP-seq results by chromosome.
- https://cdn.elifesciences.org/articles/94631/elife-94631-supp1-v1.xlsx
-
Supplementary file 2
Genomic locations of significant overlapping OVO ChIP peaks.
- https://cdn.elifesciences.org/articles/94631/elife-94631-supp2-v1.xlsx
-
Supplementary file 3
Significant OVO DNA binding motifs in MEME format.
- https://cdn.elifesciences.org/articles/94631/elife-94631-supp3-v1.xlsx
-
Supplementary file 4
Differential expression analysis results for all genes.
- https://cdn.elifesciences.org/articles/94631/elife-94631-supp4-v1.xlsx
-
Supplementary file 5
Significantly enriched GO biological process terms.
- https://cdn.elifesciences.org/articles/94631/elife-94631-supp5-v1.xlsx
-
Supplementary file 6
Flybase ART table.
- https://cdn.elifesciences.org/articles/94631/elife-94631-supp6-v1.xlsx
-
MDAR checklist
- https://cdn.elifesciences.org/articles/94631/elife-94631-mdarchecklist1-v1.docx
Download links
A two-part list of links to download the article, or parts of the article, in various formats.
Downloads (link to download the article as PDF)
Open citations (links to open the citations from this article in various online reference manager services)
Cite this article (links to download the citations from this article in formats compatible with various reference manager tools)
OVO positively regulates essential maternal pathways by binding near the transcriptional start sites in the Drosophila female germline
eLife 13:RP94631.
https://doi.org/10.7554/eLife.94631.3


