The E3 ubiquitin ligase RNF220 maintains hindbrain Hox expression patterns through regulation of WDR5 stability
- Key Laboratory of Genetic Evolution and Animal Models, Kunming Institute of Zoology, Chinese Academy of Sciences, China
- Academy of Mathematics and Systems Science, Chinese Academy of Science, China
- School of Mathematical Sciences, University of Chinese Academy of Sciences, China
- Kunming College of Life Science, University of Chinese Academy of Sciences, China
- National Resource Center for Non-Human Primates, Kunming Primate Research Center and National Research Facility for Phenotypic & Genetic Analysis of Model Animals (Primate Facility), Kunming Institute of Zoology, Chinese Academy of Sciences, China
- Center for Excellence in Animal Evolution and Genetics, Chinese Academy of Sciences, China
- Key Laboratory of Animal Models and Human Disease Mechanisms of Yunnan Province, Kunming Institute of Zoology, Chinese Academy of Sciences, China
- Key Laboratory of Systems Biology, Hangzhou Institute for Advanced Study, University of Chinese Academy of Sciences, Chinese Academy of Sciences, China
Figures
Figure 1 with 3 supplements
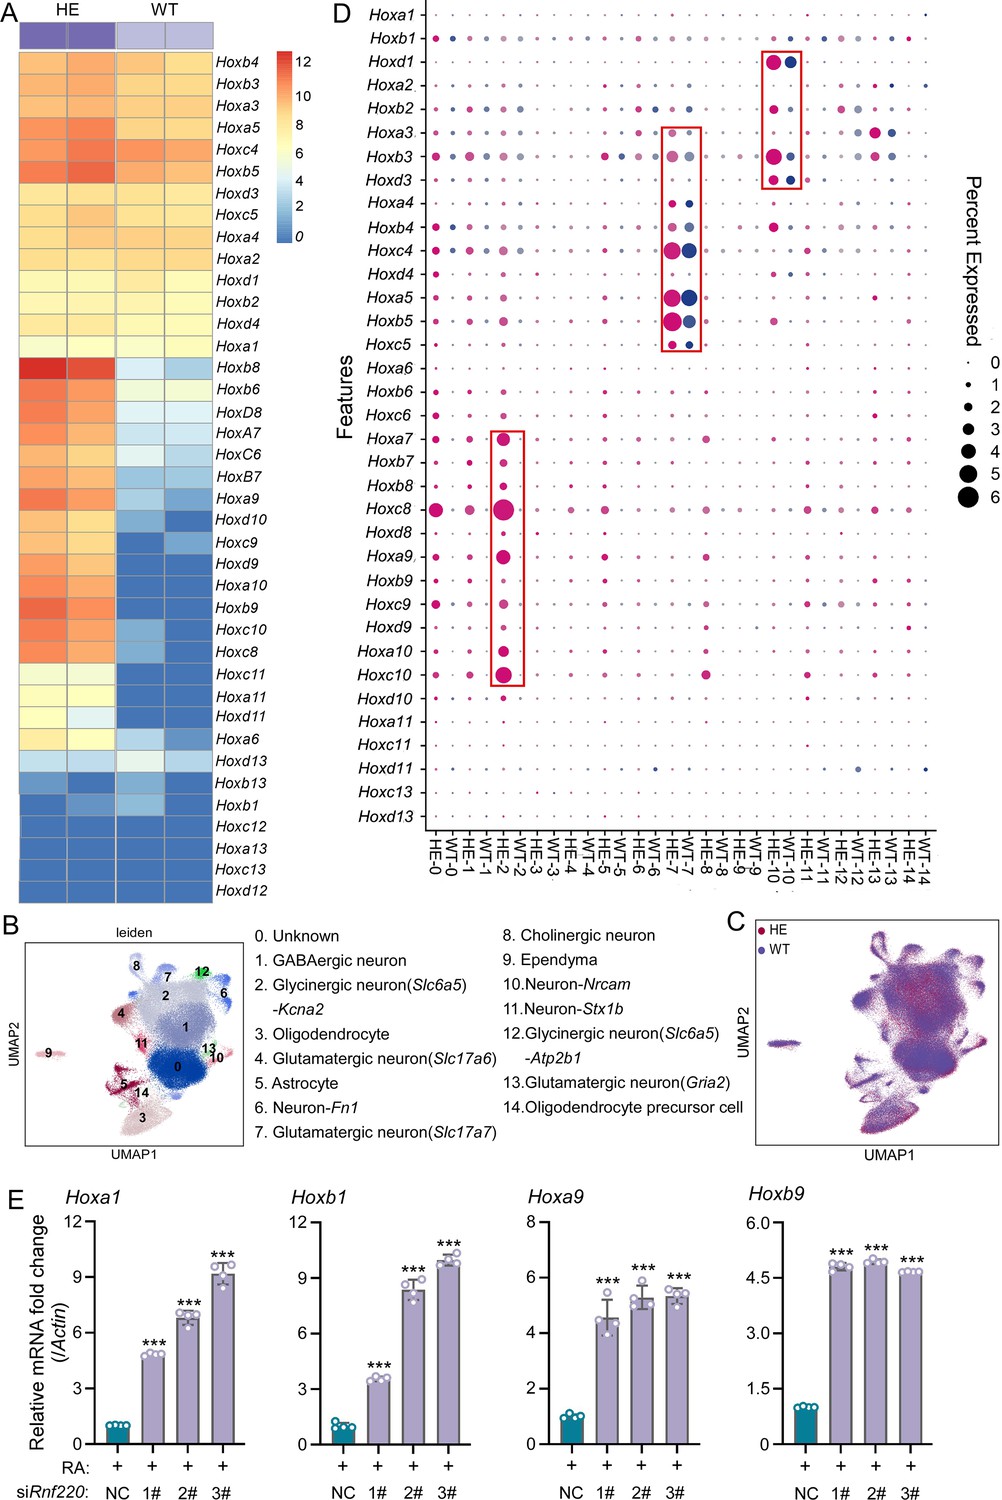
Hox genes up-regulated in pons of Rnf220+/- mice.
(A) The heatmap of RNA sequencing (RNA-seq) data showing Hox genes expression in pons of WT or Rnf220+/- mice (n=2 mice per group). (B–C) Uniform manifold approximation and projection (UMAP) diagram showing 15 identified cell clusters annotated by single-nucleus RNA-seq (snRNA-seq) analysis of pons. Each dot represents a single cell, and cells are laid out to show similarities (n=3 mice per group). Genes in parentheses represent the marker genes of the cell group, while the genes following ‘-’ represent the specific genes of this cell group. (D) Heatmap of snRNA-seq data showing Hox expression changes in each cell cluster. (E) Quantitative real-time polymerase chain reaction (qRT-PCR) analysis showing mRNA levels of indicated Hox genes in P19 cells when endogenous Rnf220 was knocked down by small interfering RNAs (siRNAs) in the presence of RA. WT, wild-type; HE, heterozygote; RA, retinoic acid. **p<0.01, ***p<0.001.
Figure 1—figure supplement 1
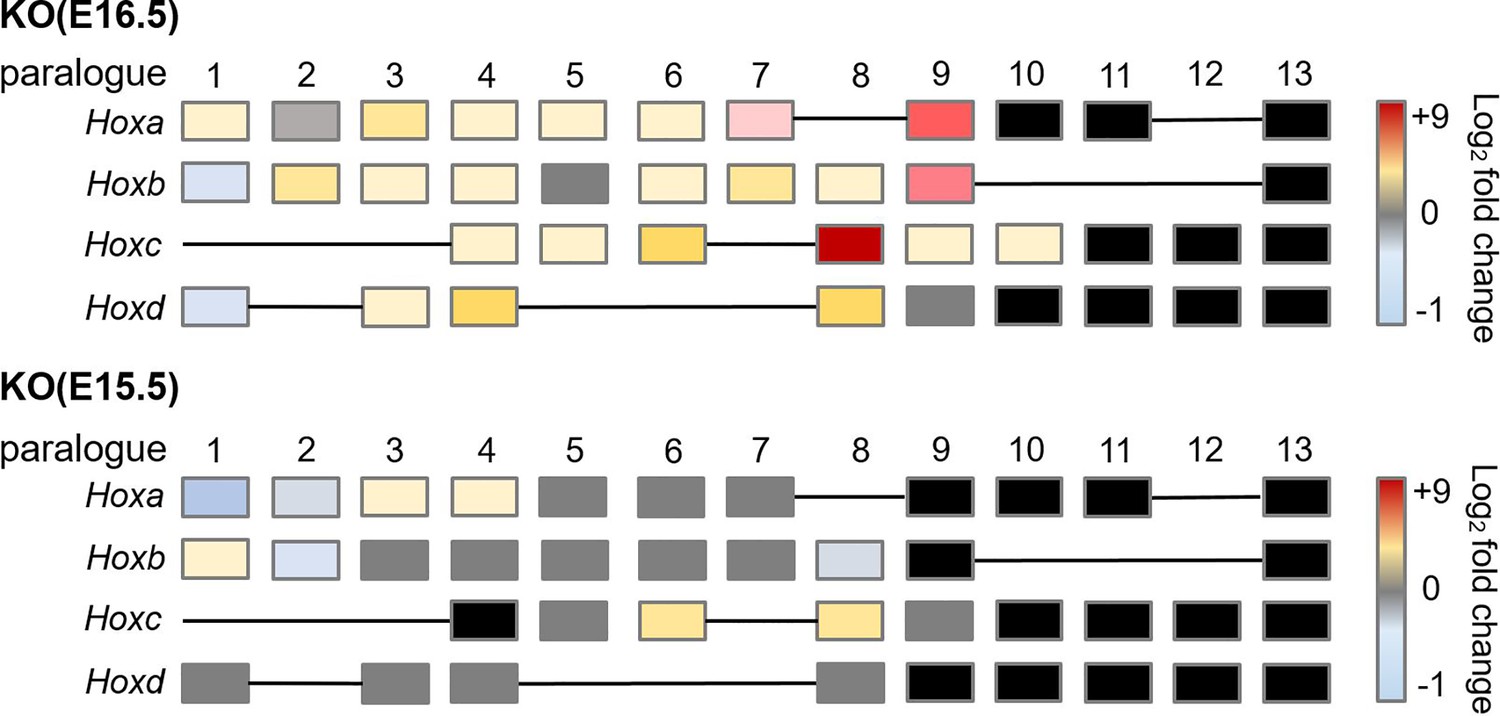
Hox genes exhibited de-repression in hindbrain of Rnf220-/- embryos at late developmental stages.
Heatmap of Hox expression in hindbrain of Rnf220-/- mouse embryos at E16.5 and E15.5. Expression of each Hox gene was analyzed by quantitative real-time polymerase chain reaction (qRT-PCR) against Gapdh. Each Hox gene in wild-type controls was set to 1 (n=2 mice per group). Blank color represents the expression of that Hox is low and exceed detection range. KO, knockout.
Figure 1—figure supplement 2
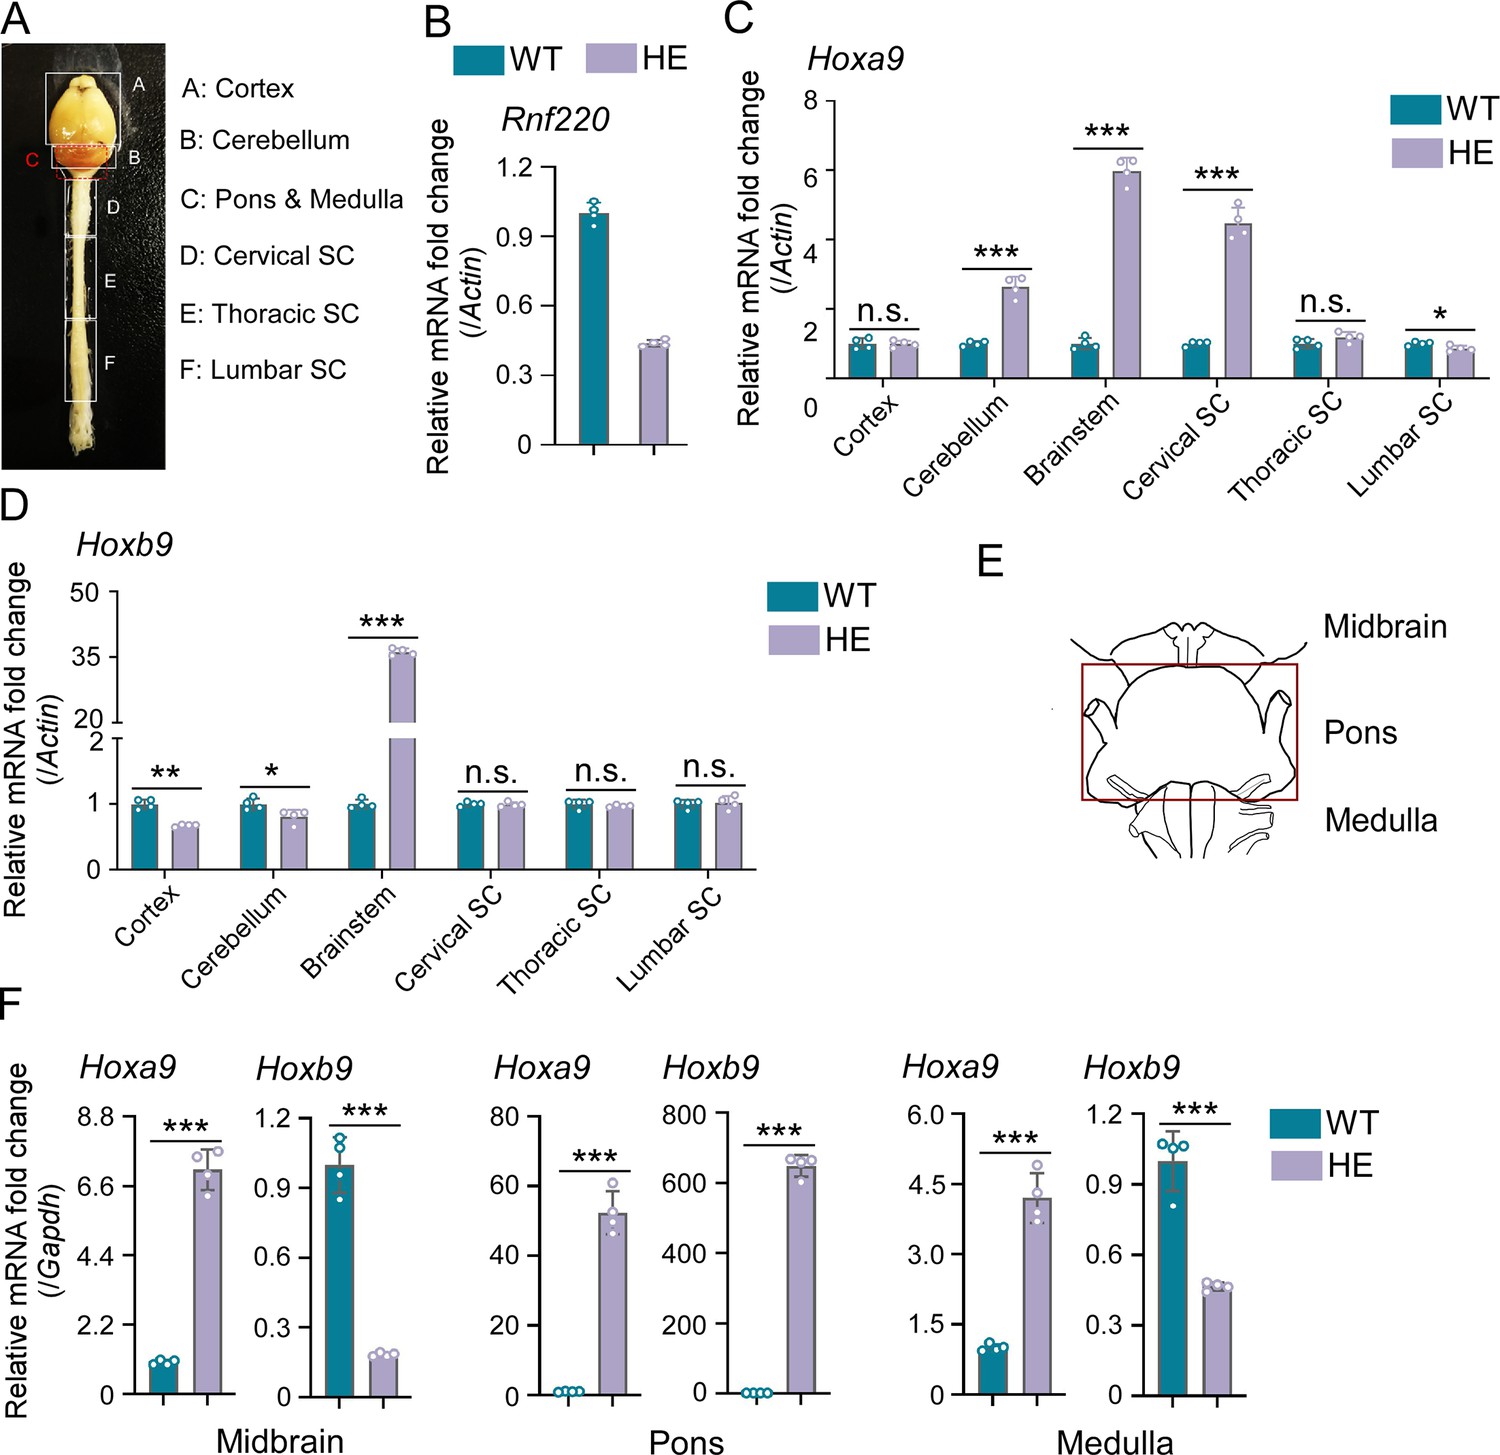
Hox genes were up-regulated in brainstem of Rnf220+/- mice.
(A) Diagram of central nervous system (CNS) in mice. (B) Quantitative real-time polymerase chain reaction (qRT-PCR) analysis of Rnf220 expression in CNS of Rnf220+/- and control mice. (C–D) qRT-PCR analysis of Hoxa9 (C) and Hoxb9 (D) expression in each CNS section of Rnf220+/- and control mouse (n=2 mice per group). (E) Diagram of mouse brainstem. (F) qRT-PCR analysis of mRNA levels of Hoxa9 and Hoxb9 in indicated sections of WT and Rnf220+/- mouse brainstems (n=2 mice per group). WT, wild-type; HE, heterozygote; SC, spinal cord. n.s., not significant; *p<0.05, **p<0.01, ***p<0.001.
Figure 1—figure supplement 3
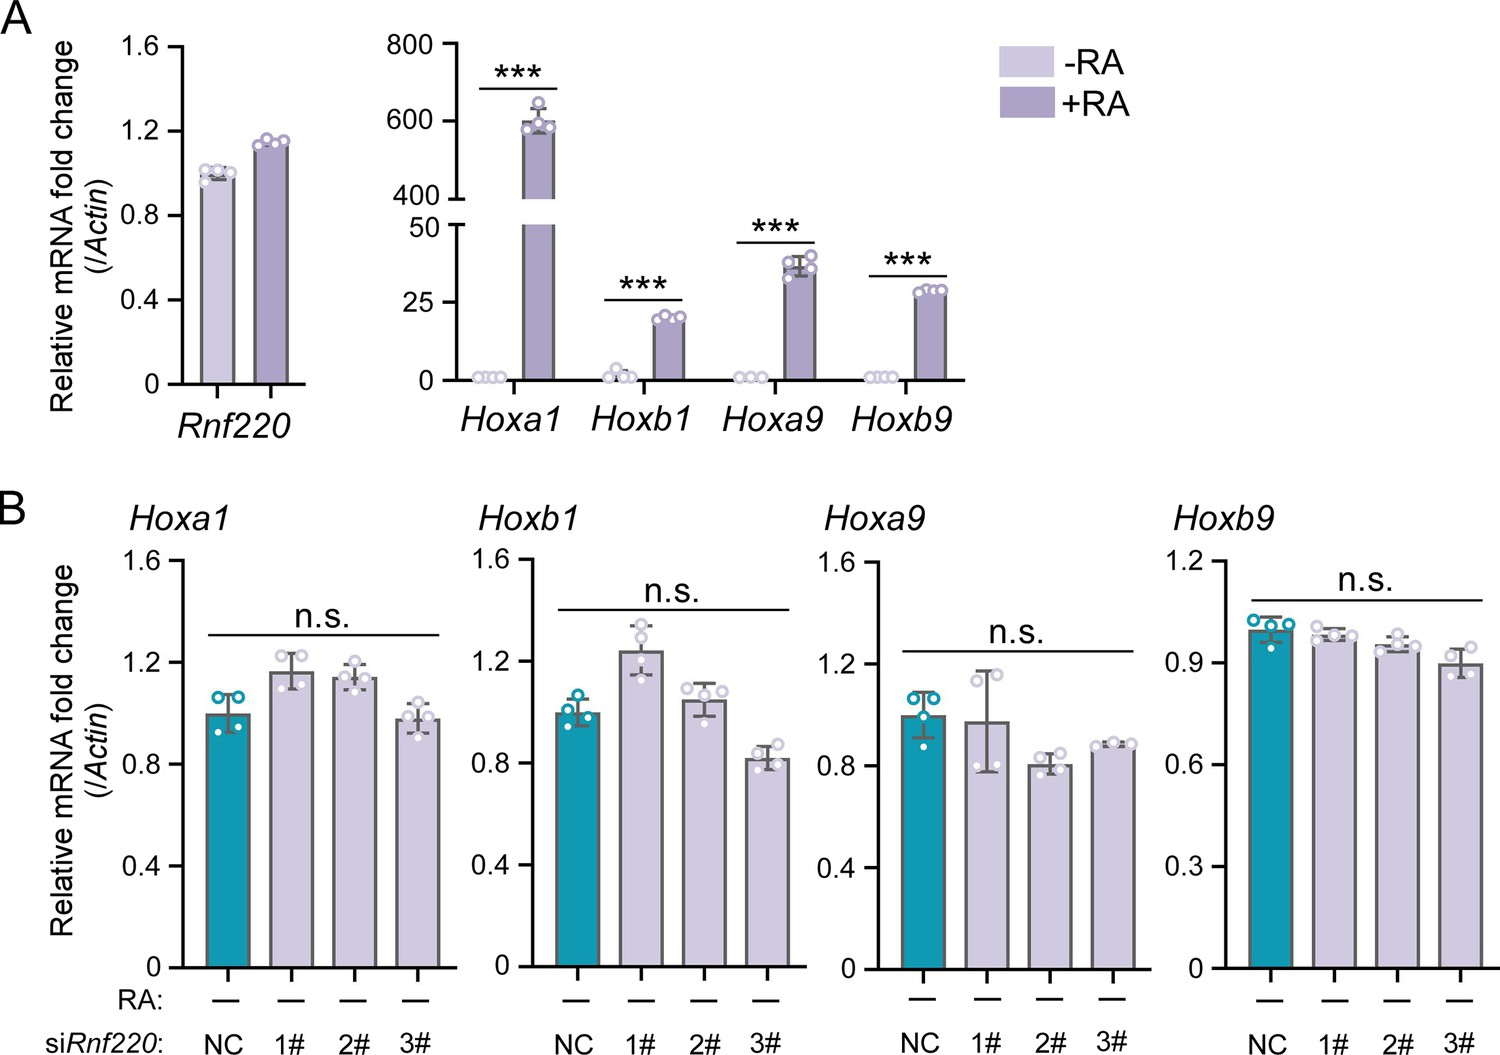
Expression levels of Hox genes were not affected by Rnf220 knockdown in P19 cell line without RA induction.
(A) Quantitative real-time polymerase chain reaction (qRT-PCR) analysis of Rnf220 and indicated Hox genes expression after RA treatment in P19 cells. (B) qRT-PCR analysis of the expression levels of Hoxa1, Hoxb1, Hoxa9, and Hoxb9 in Rnf220 knockdown P19 cells without RA induction. RA, retinoic acid. n.s., not significant; ***p<0.001.
Figure 2 with 2 supplements
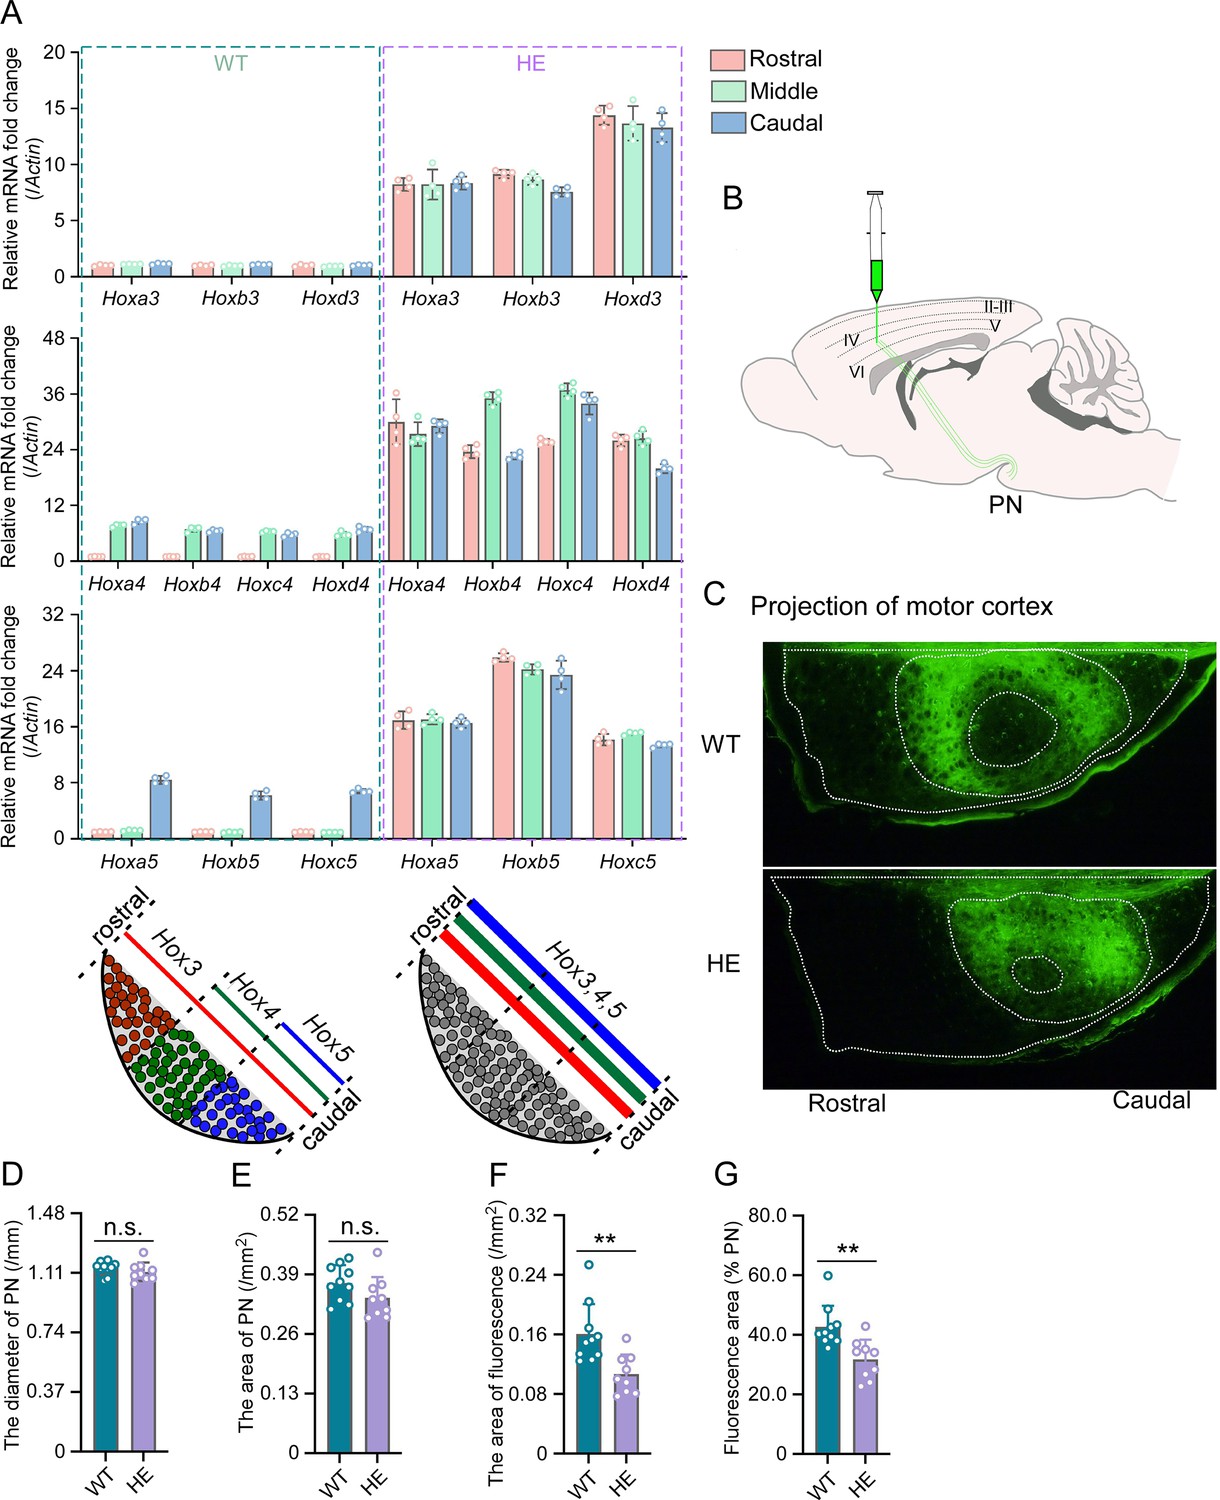
Hox gene expression was dysregulated and motor cortex projections were disorganized in pontine nuclei (PN) of Rnf220+/- mice.
(A) Quantitative real-time polymerase chain reaction (qRT-PCR) analysis of relative expression levels of Hox3, Hox4, and Hox5 in rostral, middle, and caudal sections of PN in WT and Rnf220+/- mice. Expression level of each gene in rostral section of WT PN was set to 1 (n=5 mice per group). Bar graphs show the relative levels normalized against rostral group in the respective wild-type mice. (B) Diagram of experimental stereotactic injections. (C) Green fluoresce showed the projection from motor cortex to PNs in adult (2 months) WT and Rnf220+/- mice (n=10 in WT group and n=9 in Rnf220+/- group). (D–E) The diameter (D) and area (E) sizes of PN in WT and Rnf220+/- mice. Each data presents the average diameter and area sizes of PN from four consecutive slices for completely presenting circular fluorescence projections. (F) The area of fluorescence projection from motor cortex to PN in WT and Rnf220+/- mice. The sample used for statistics is consistent with the one selected in D–E. Each data represents the average fluorescence area of four consecutive slices. (G) The proportion of projected fluorescence area from motor cortex to PN area. The sample used for statistics is consistent with the one selected in D–E. WT, wild-type; HE, heterozygote. n.s., not significant. **p<0.01.
Figure 2—figure supplement 1
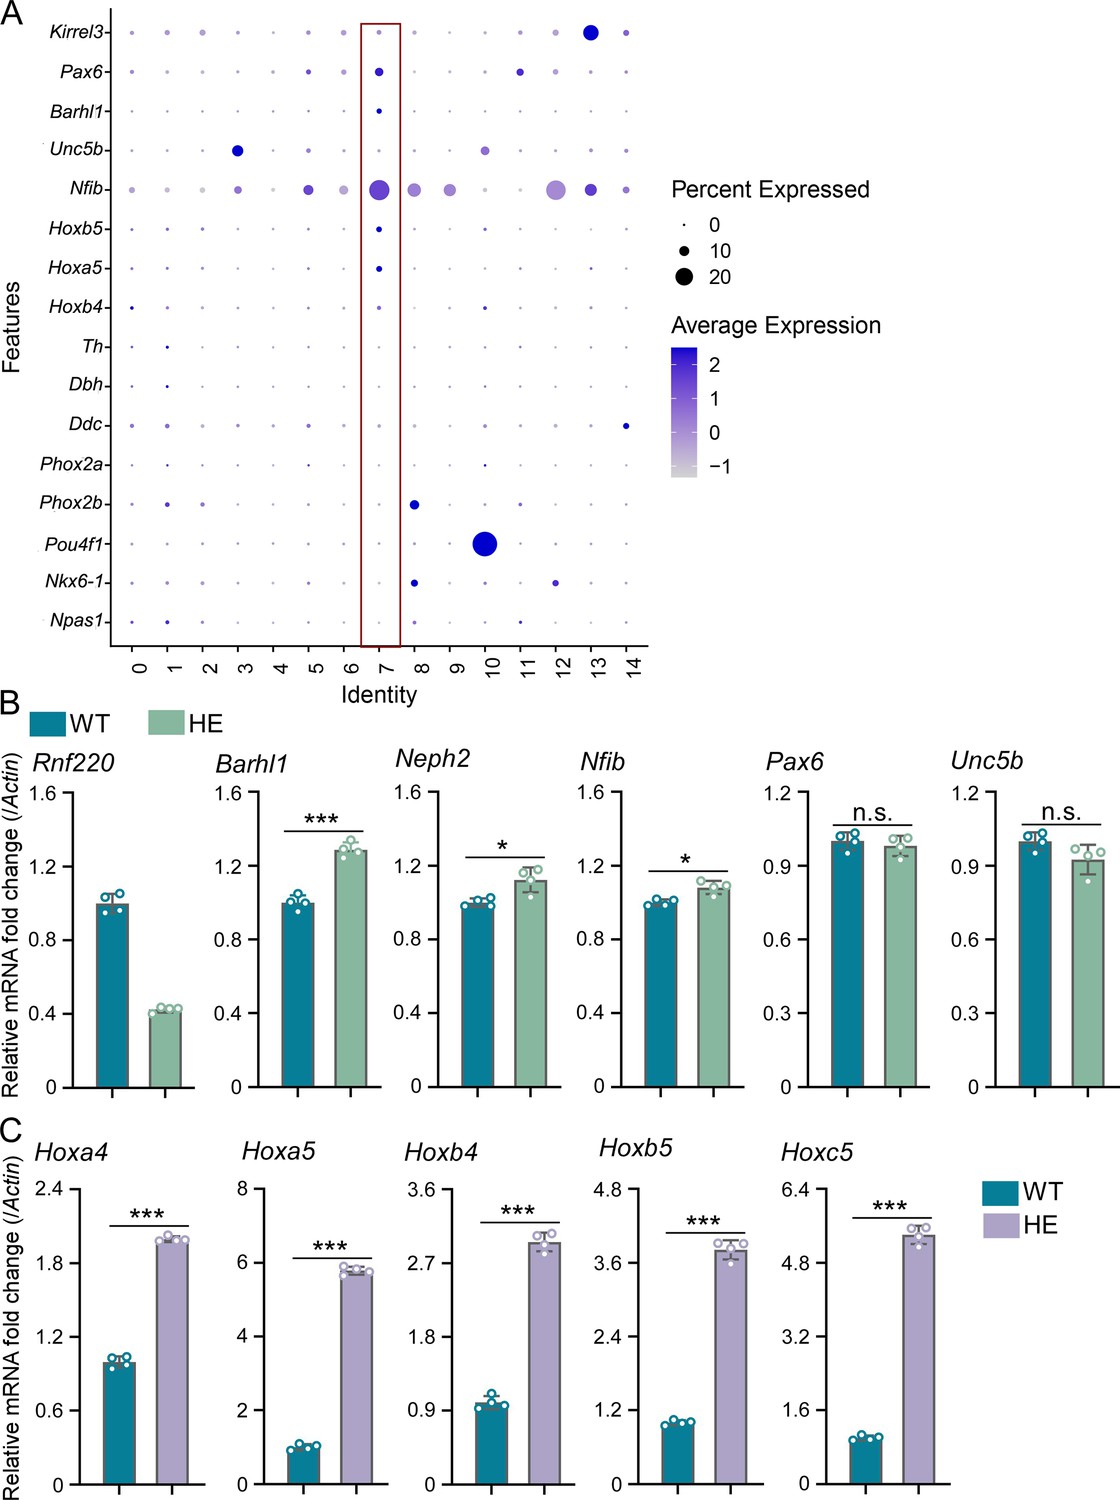
Hox genes were up-regulated in pontine nuclei (PN) of Rnf220+/- mice.
(A) Heatmap of single-nucleus RNA sequencing (snRNA-seq) data showing expression levels of PN markers (Pax6, Barhl1, Unc5b, and Nfib) among 15 identified cell clusters (n=3 mice per group). (B– C) Quantitative real-time polymerase chain reaction (qRT-PCR) analysis of expression levels of indicated PN markers (B) and Hox genes (C) in pons of Rnf220+/- and WT mice (n=3 mice per group). WT, wild-type; HE, heterozygote. n.s., not significant; *p<0.05, ***p<0.001.
Figure 2—figure supplement 2
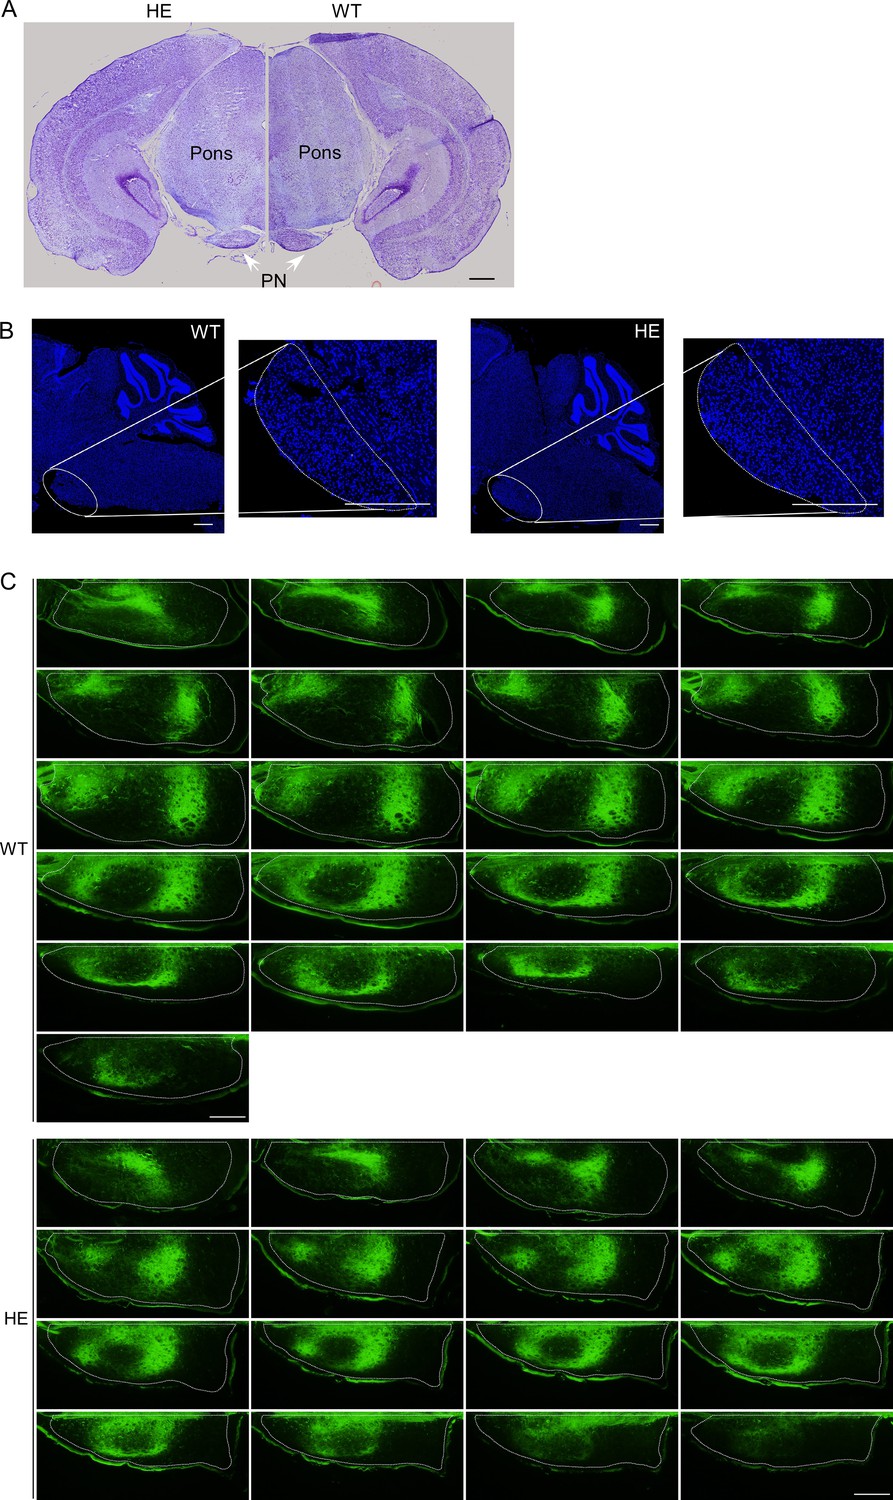
PN showed no structure difference but disorganized projection pattern from motor cortex between WT and Rnf220+/- mice.
(A) Nissl staining showed the pons structure in adult (2 months) WT and Rnf220+/- mice. Scale bars, 500 μm. (B) DAPI labeling PN structure in adult (2 months) WT and Rnf220+/- mice. Scale bars, 500 μm. (C) Continuous slice of projection from motor cortex to PN in adult (2 months) WT and Rnf220+/- mice. Scale bars, 200 μm. WT, wild-type; HE, heterozygote; PN, pontine nuclei.
Figure 3 with 2 supplements
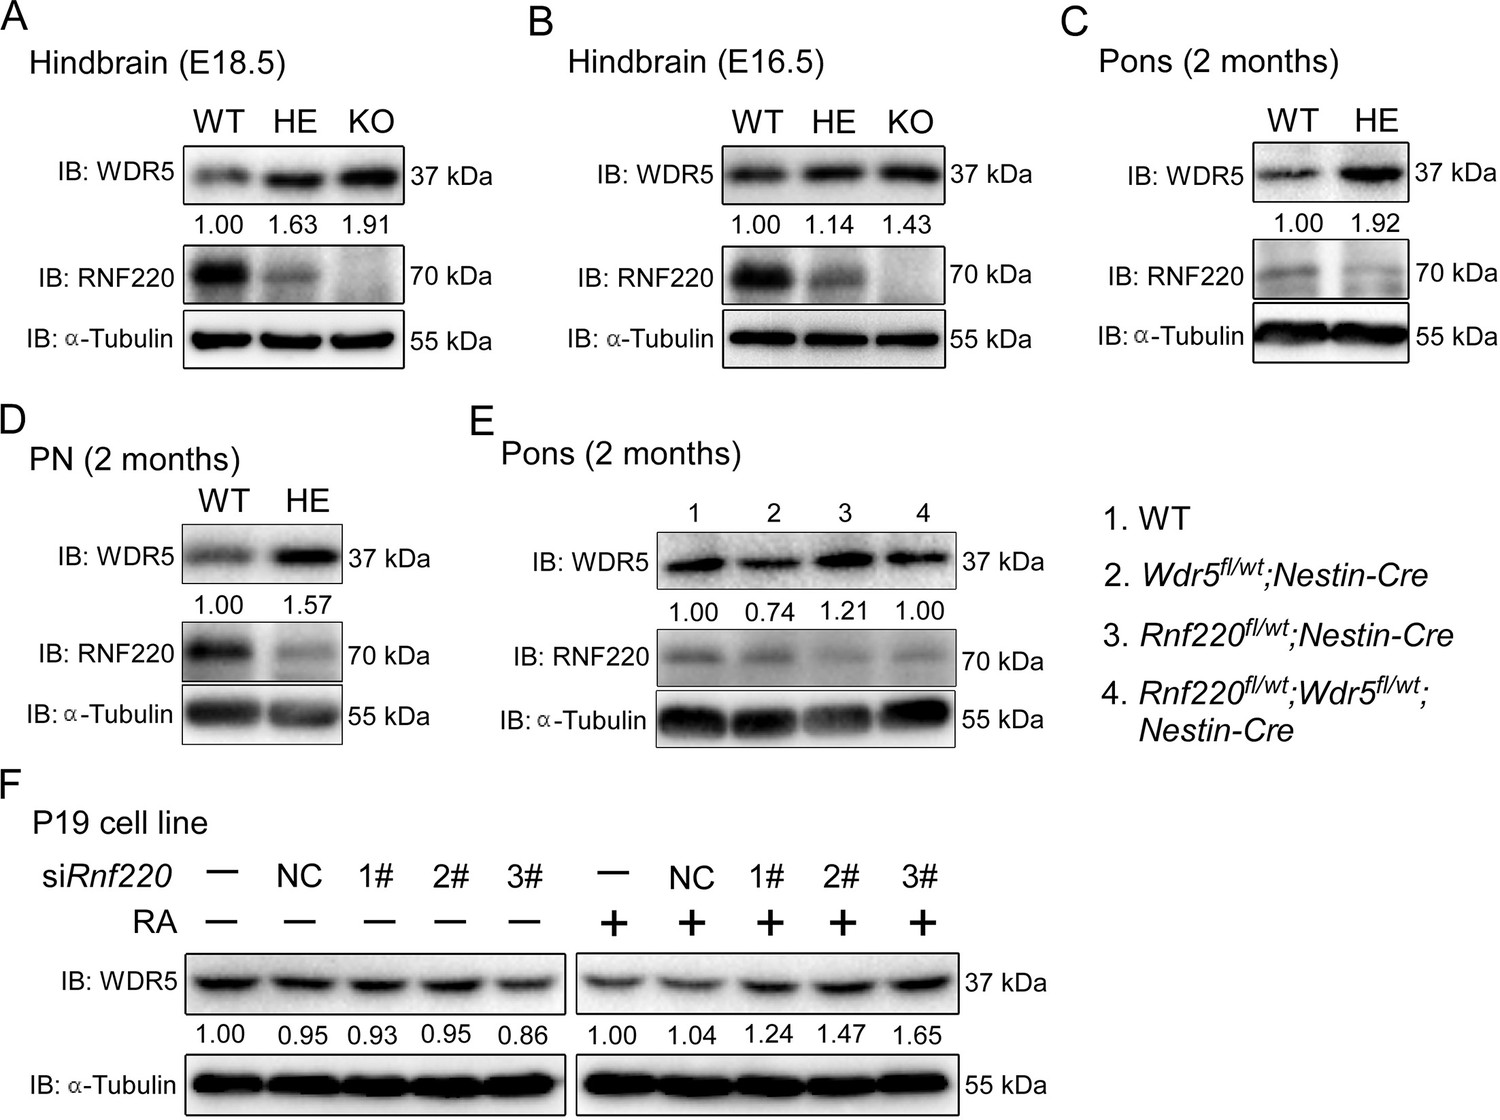
RNF220 mediates WDR5 degradation.
(A–D) Western blots analysis showing the protein level of WDR5 in the indicated brain tissues of mice with different genotypes at different ages. (E) Western blot analysis showing WDR5 levels in the pons of adult mice with indicated genotypes. (F) Western blot analysis of protein levels of WDR5 in P19 cells with Rnf220 knockdown or not in the presence or absence of RA. IB, immunoblot; WT, wild-type; HE, heterozygote; KO, knockout; PN, pontine nuclei; NC, negative control; RA, retinoic acid.
Figure 3—figure supplement 1
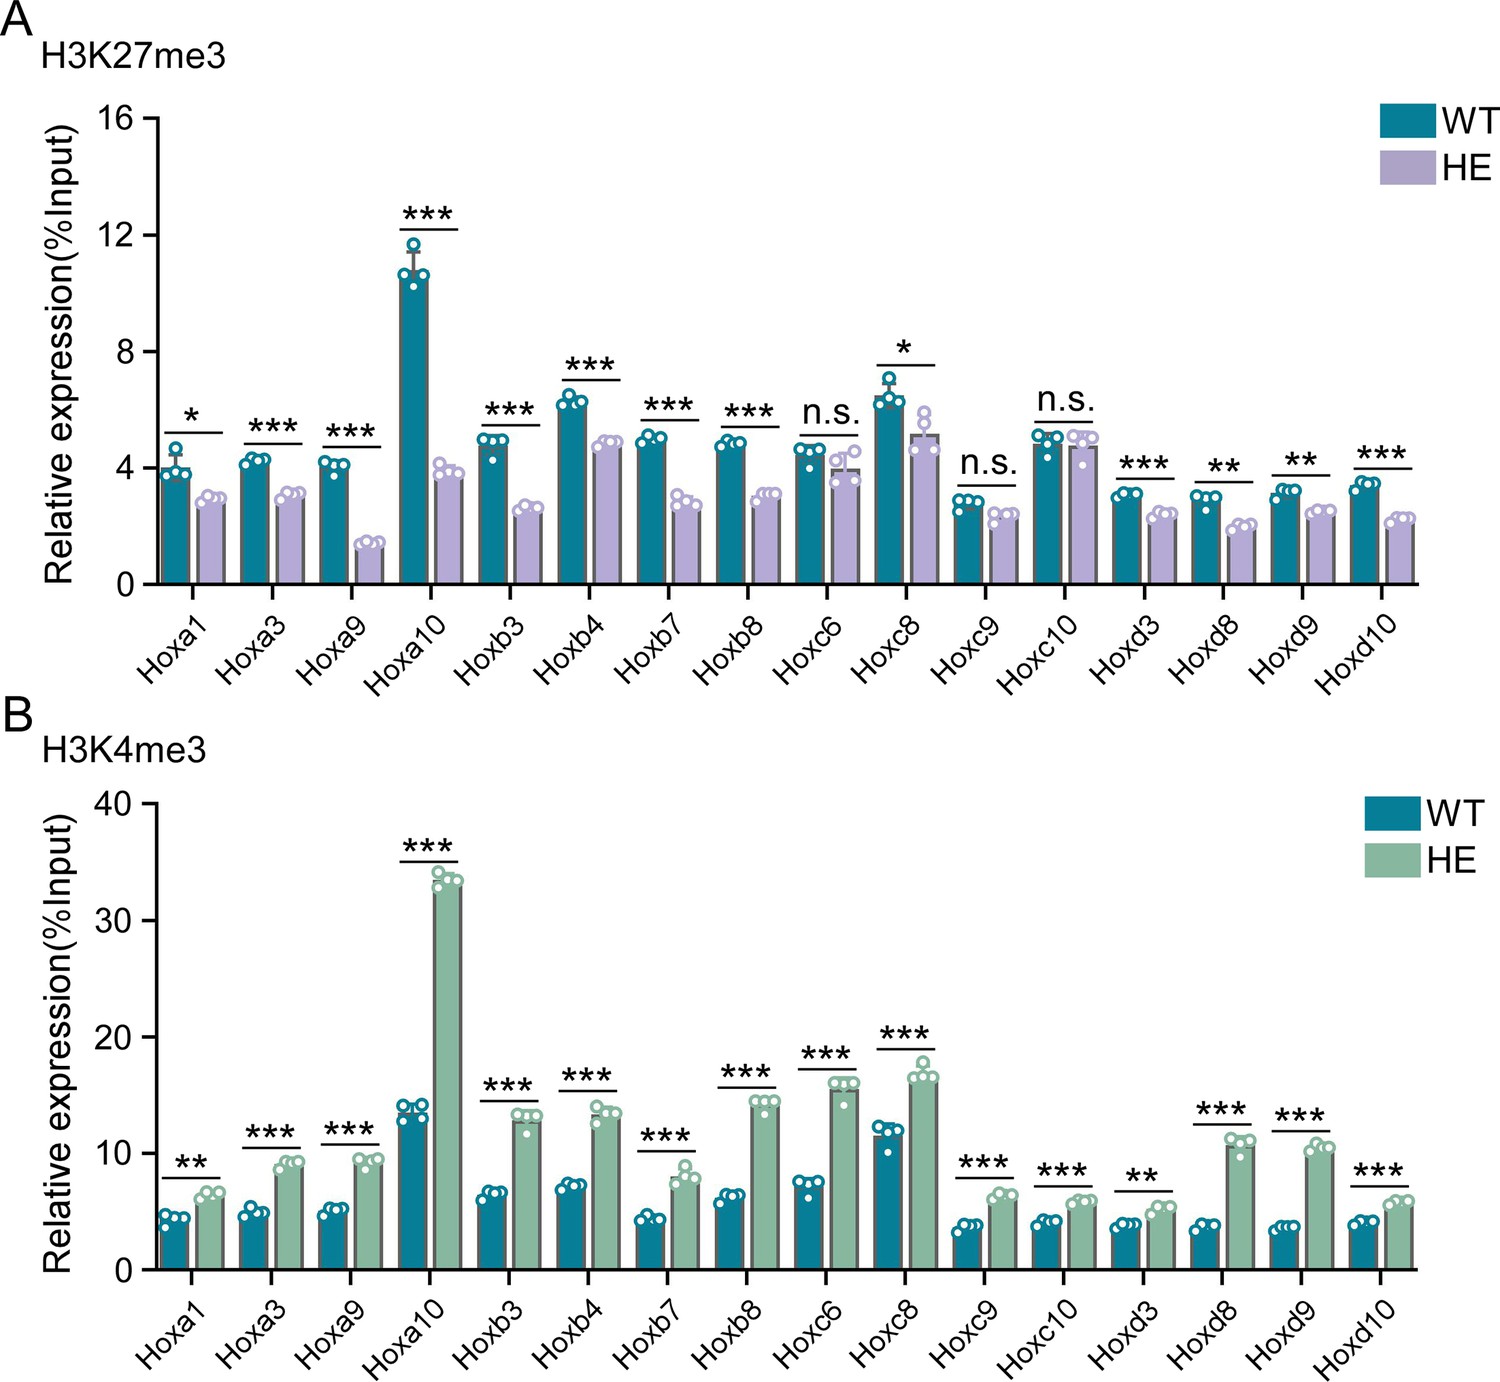
Repressive epigenetic modification was down-regulated while activated epigenetic modification was up-regulated in promoter regions of indicated Hox genes in hindbrains of Rnf220+/- mice.
(A–B) ChIP-qRT-PCR analysis of repressive epigenetic modification (H3K27me3) (A) and activated epigenetic modification (H3K4me3) (B) levels in promoter regions of indicated Hox genes in hindbrains of Rnf220+/- and WT mice (n=2 mice per group). WT, wild-type; HE, heterozygote. n.s., not significant; *p<0.05, **p<0.01, ***p<0.001.
Figure 3—figure supplement 2
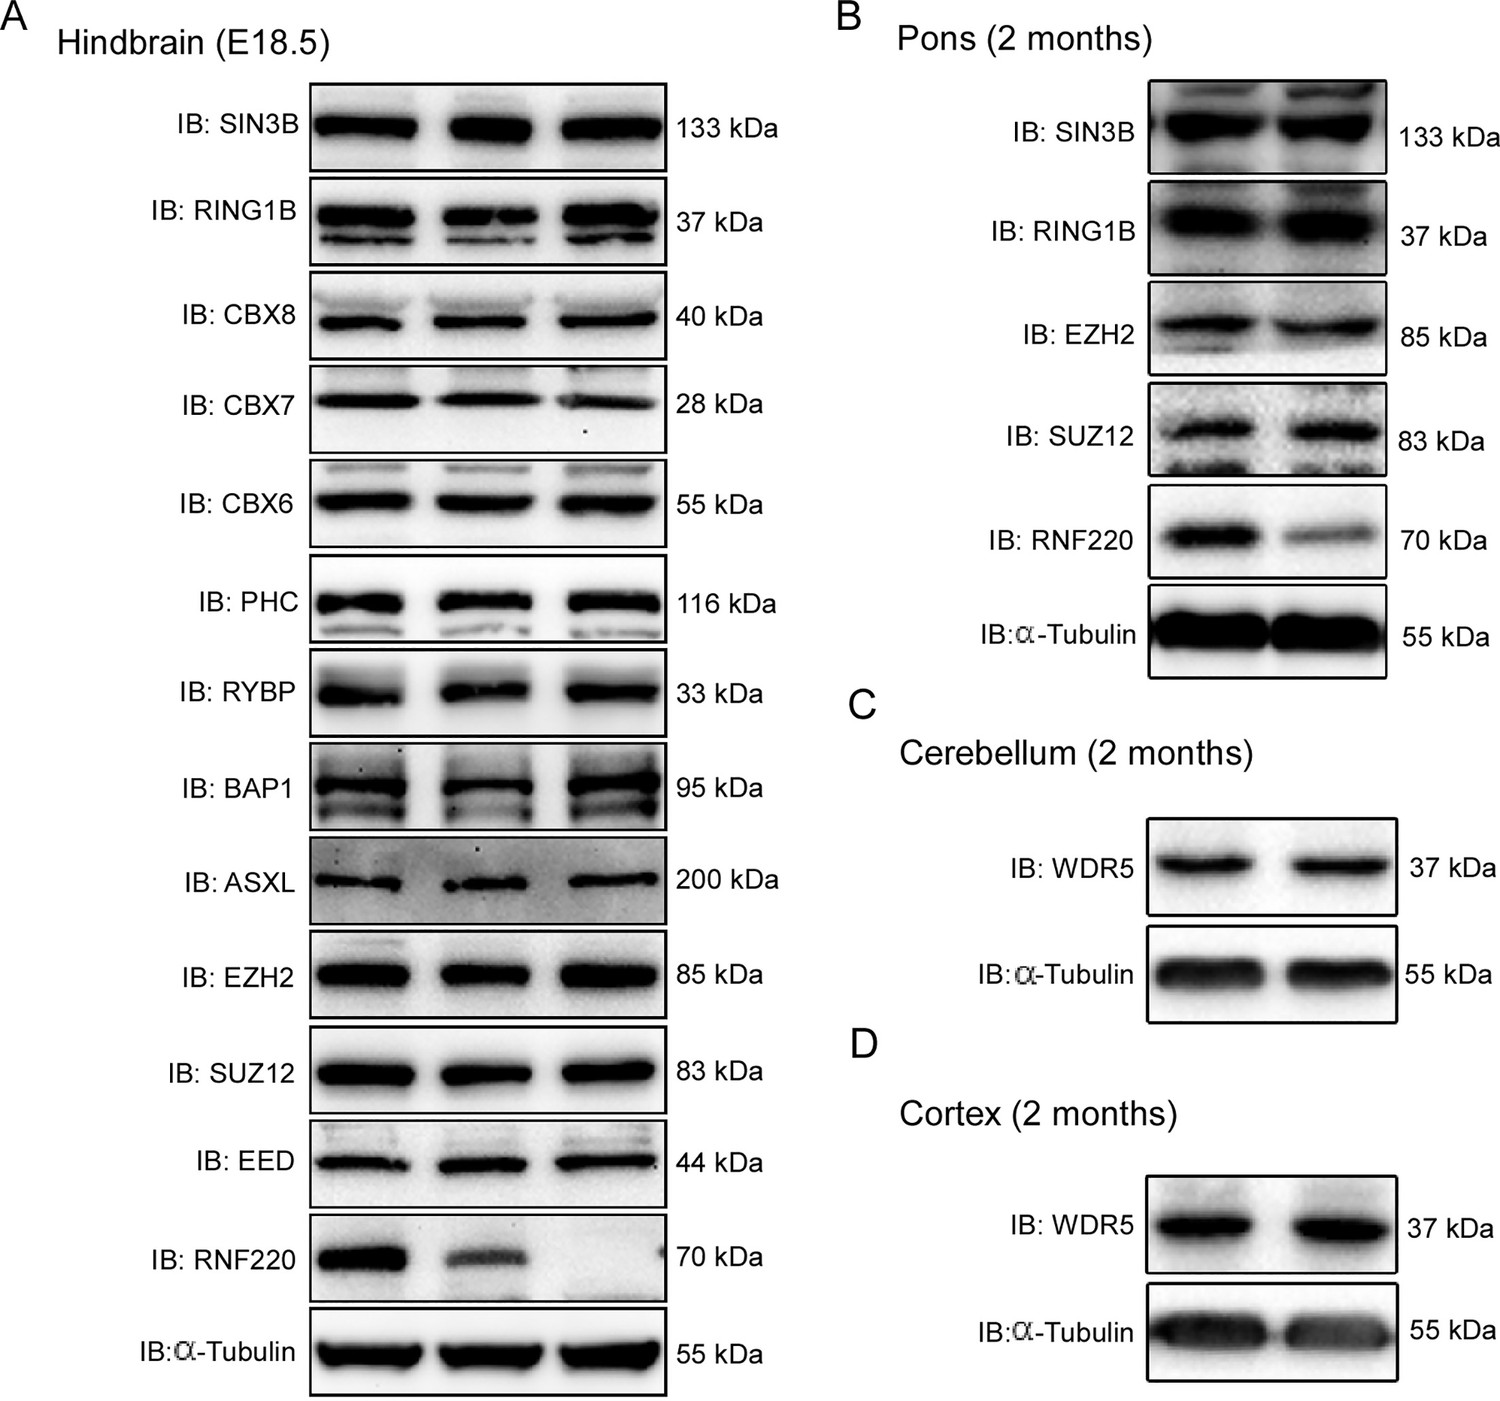
Protein levels of the indicated core components of PRC1 and PRC2 complex in indicated mouse brain tissues of different genotypes.
(A) Western blot analysis of protein levels of core components of PRC1 and PRC2 complexes in hindbrain of WT, Rnf220+/-, and Rnf220-/- mouse embryos at E18.5. (B) Western blot analysis of protein levels of core components of PRC1 and PRC2 complexes in pons of adult Rnf220+/- and WT mice. (C, D) Western blot analysis of protein levels of WDR5 in cerebellum and cortex of adult Rnf220+/- and WT mice. WT, wild-type; HE, heterozygote; KO, knockout; IB, immunoblot.
Figure 4 with 1 supplement
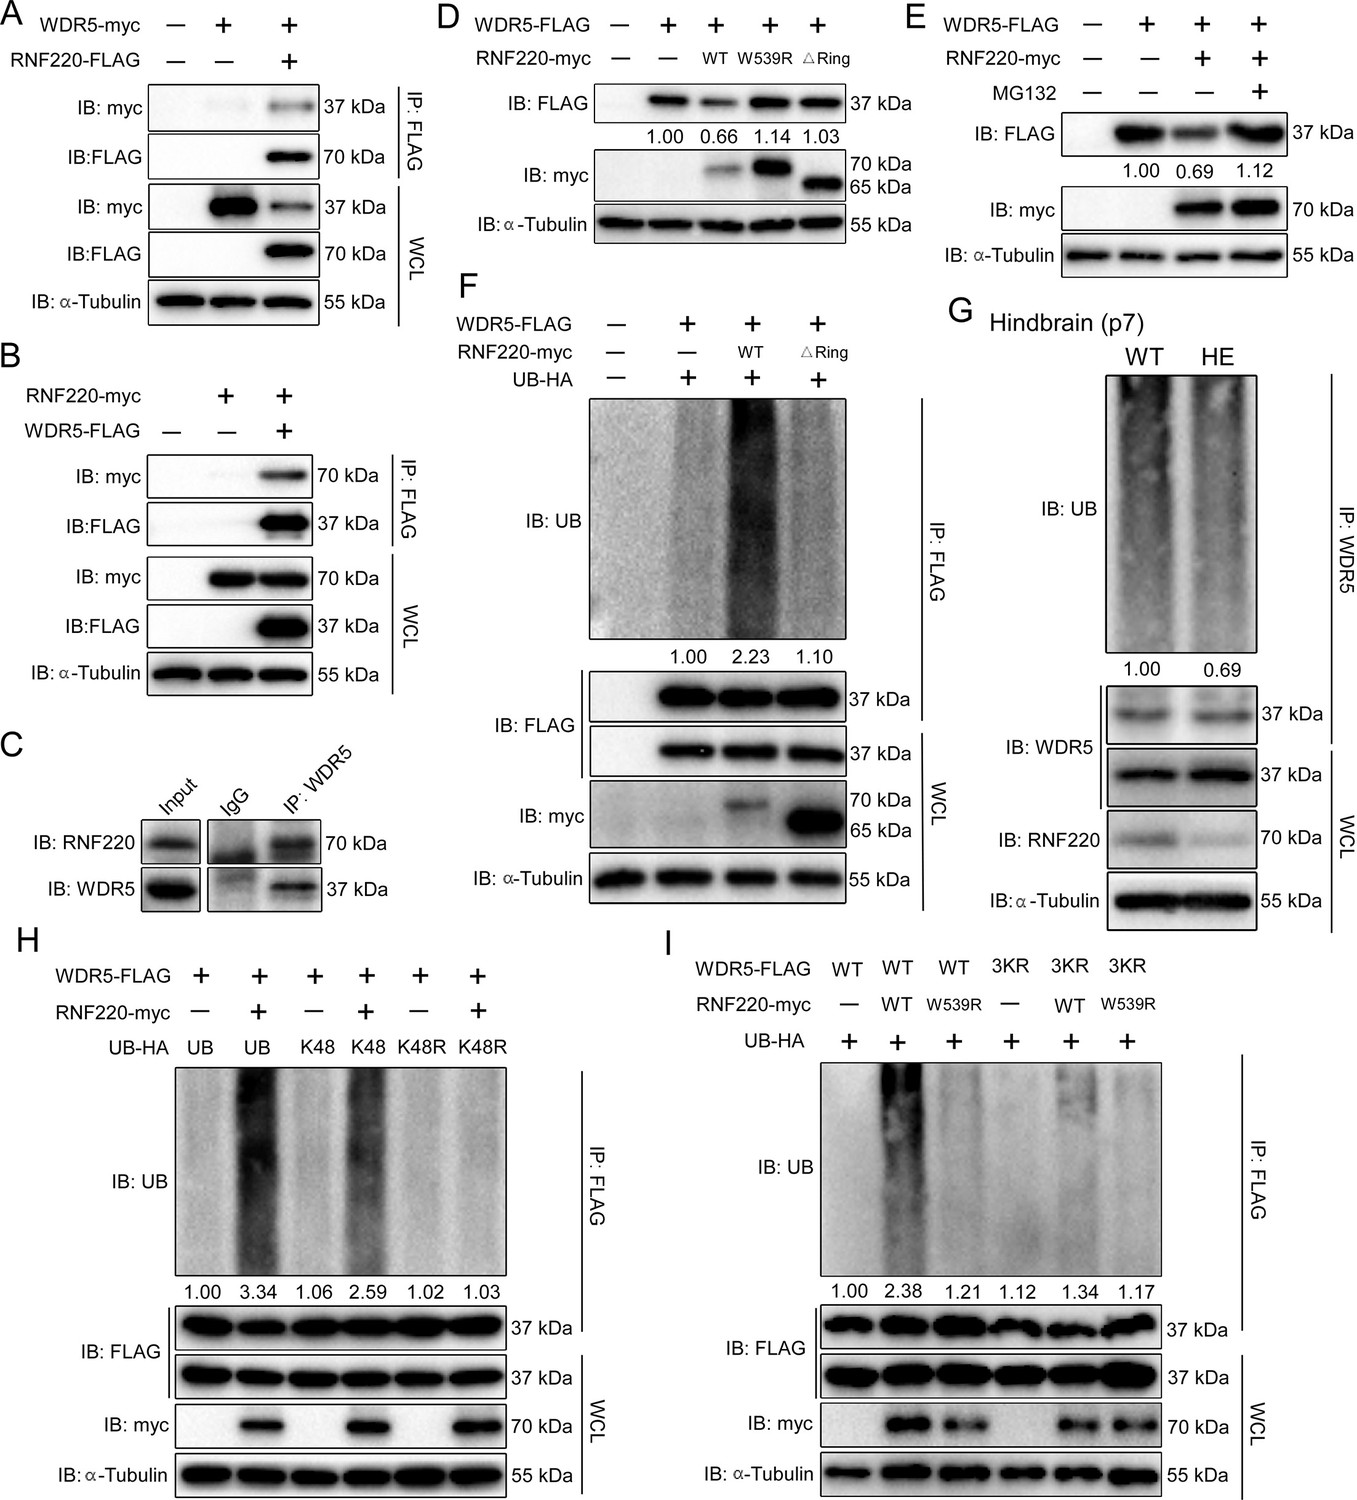
RNF220 interacts with and targets WDR5 for K48-linked polyubiquitination.
(A–B) Co-immunoprecipitation (co-IP) analysis of interactions between RNF220 and WDR5 in HEK293 cells. HEK293 cells were transfected with indicated plasmids and harvested after 48 hr. Cell lysates were immunoprecipitated with anti-FLAG beads. Whole-cell lysate and immunoprecipitates were subjected to western blot analysis using indicated antibodies. (C) Endogenous co-immunoprecipitation analysis showing the interaction between RNF220 and WDR5 in hindbrains of WT mice. (D) Western blots analysis shows the protein level of WDR5 when co-expressed with wild-type or mutated RNF220 in HEK293 cells. (E) Western blots analysis shows the protein level of WDR5 when co-expressed with RNF220 in HEK293 cells in the presence of MG132 (10 mM) or not. (F) In vivo ubiquitination assays showing the ubiquitination status of WDR5 when co-expressed with WT or mutated RNF220 in HEK293 cells. (G) In vivo ubiquitination assays showing the ubiquitination status of WDR5 in hindbrains of WT and Rnf220+/- mice. (H) In vivo ubiquitination assays showing RNF220-induced polyubiquitination of WDR5 when the indicated ubiquitin mutations were used in HEK293 cells. (I) In vivo ubiquitination assays showing the ubiquitination status of the indicated WDR5 mutants when co-expressed with WT or ligase-dead RNF220 in HEK293 cells. WT, wild-type; HE, heterozygote; KO, knockout; IB, immunoblot; IP, immunoprecipitation; UB, ubiquitin; WCL, whole-cell lysate; △Ring, RNF220 Ring domain deletion; W539R, RNF220 ligase dead mutation; K48, ubiquitin with all lysines except the K48 mutated to arginine; K48R, ubiquitin with the K48 was substituted by an arginine; 3KR, substitution of lysines at the positions of 109, 112, and 120 in WDR5 with arginines simultaneously.
Figure 4—figure supplement 1
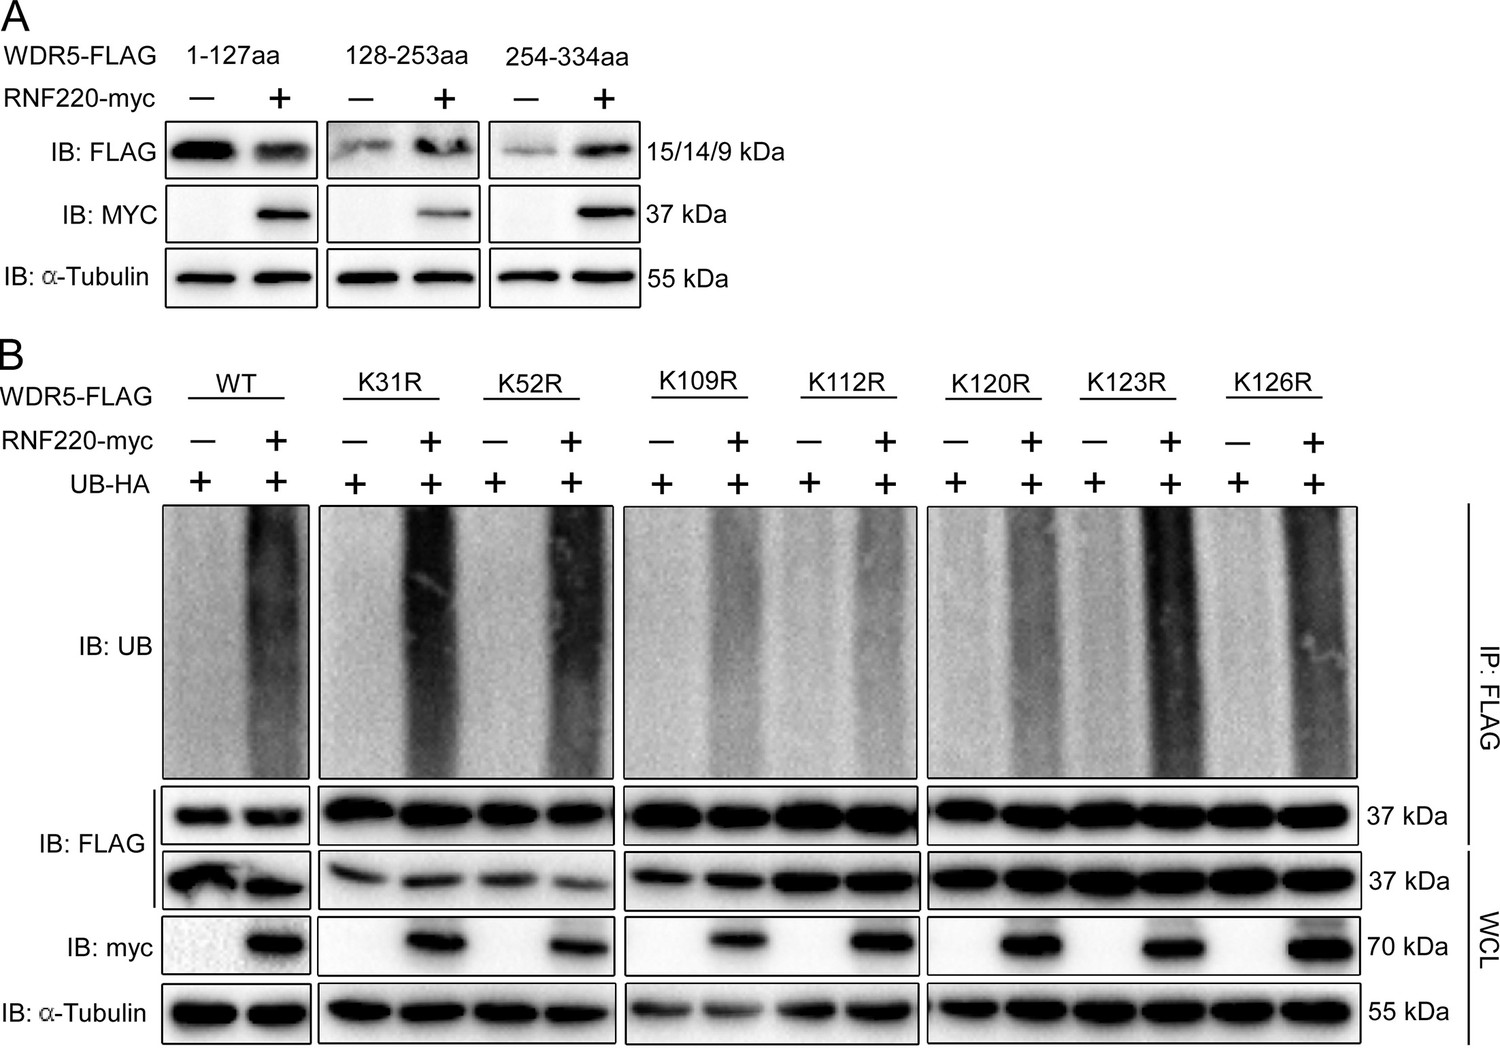
RNF220 interacted with and targeted WDR5 for polyubiquitination at multiple lysine sites.
(A) Western blot analysis of the levels of three WDR5 truncated proteins in HEK293 cells when co-transfected with RNF220 or not. (B) In vivo ubiquitination analysis of ubiquitination status of indicated WDR5 KR mutants when co-expressed with RNF220 or not in HEK293 cells. IB, immunoblot; IP, immunoprecipitation; WCL, whole-cell lysate; K31R, K52R, K109R, K112R, K120R, K123R, or K126R, substitution of lysine with arginine in WDR5 at indicated positions.
Figure 5 with 1 supplement
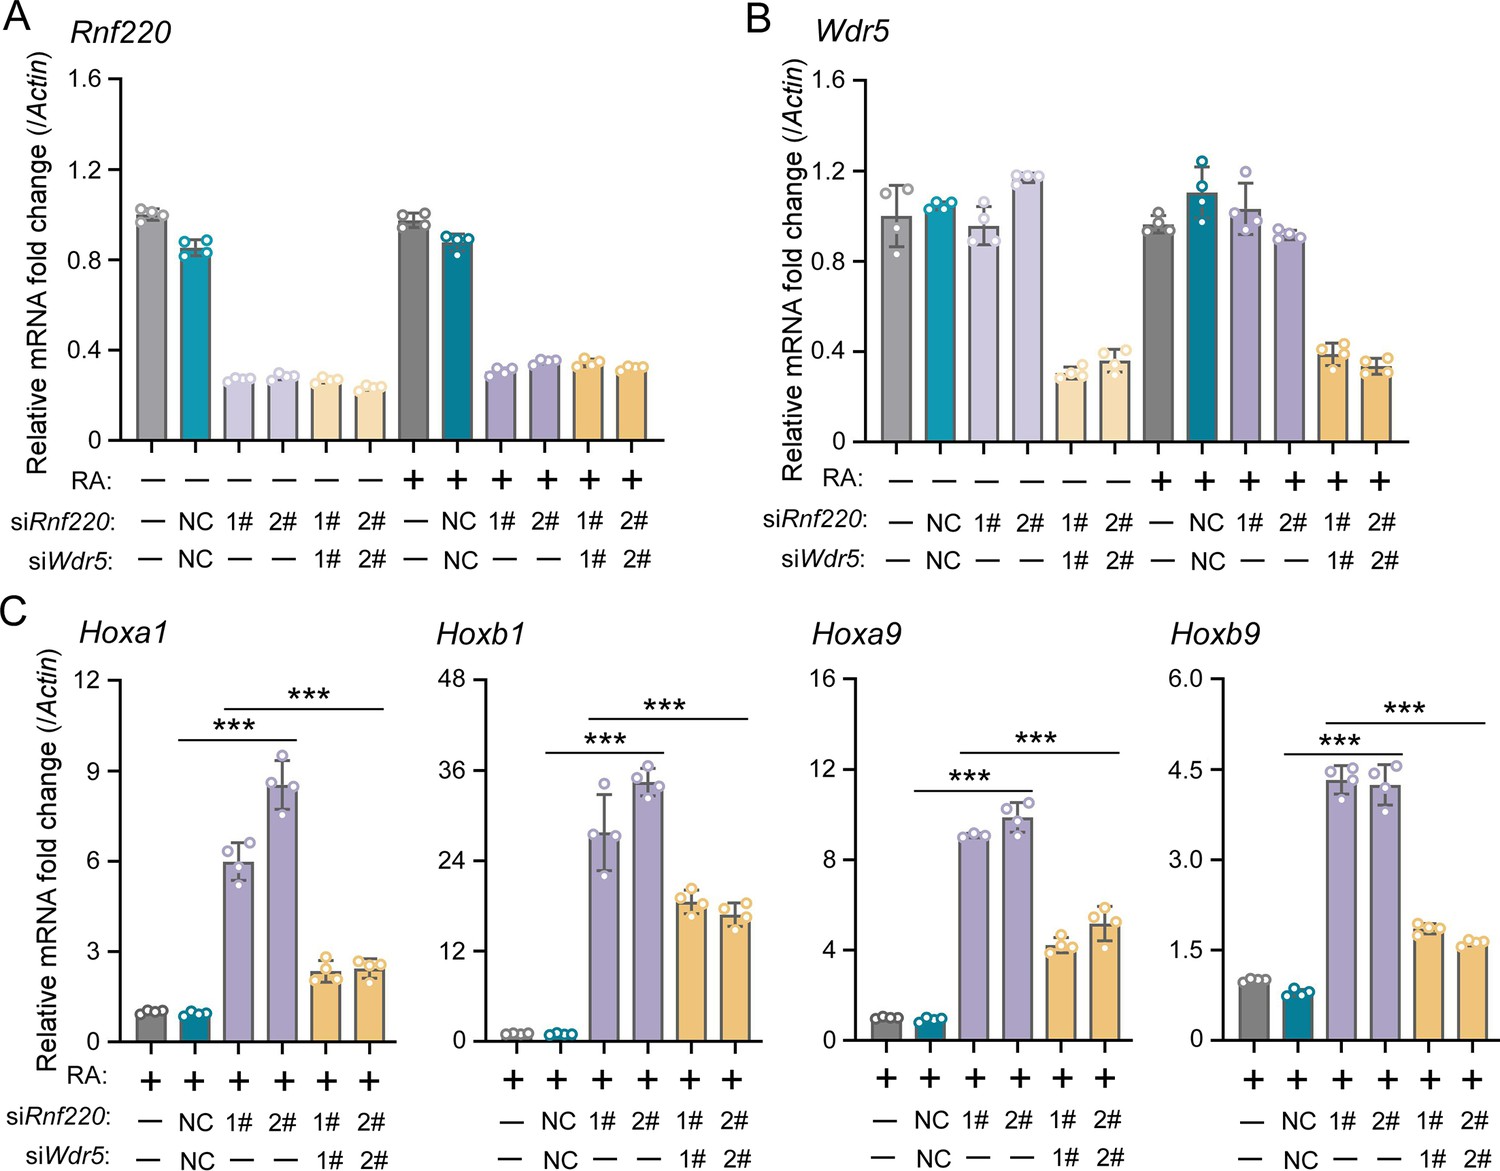
WDR5 recovered Rnf220 deficiency-induced up-regulation of Hox genes in P19 cell line.
(A–B) Quantitative real-time polymerase chain reaction (qRT-PCR) analysis showing the expression levels of Rnf220 (A) and Wdr5 (B) when transfected the indicated combinations of small interfering RNAs (siRNAs) against Rnf220 or Wdr5 in the presence or absence of RA. Bar graphs show the relative levels normalized against control group without siRNA or RA treatment. (C) qRT-PCR analysis showing the expression levels of Hoxa1, Hoxb1, Hoxa9, Hoxb9 when siRnf220, together with siWDR5 or not, were transfected in P19 cells treated with RA. RA, retinoic acid. n.s., not significant; ***p<0.001.
Figure 5—figure supplement 1
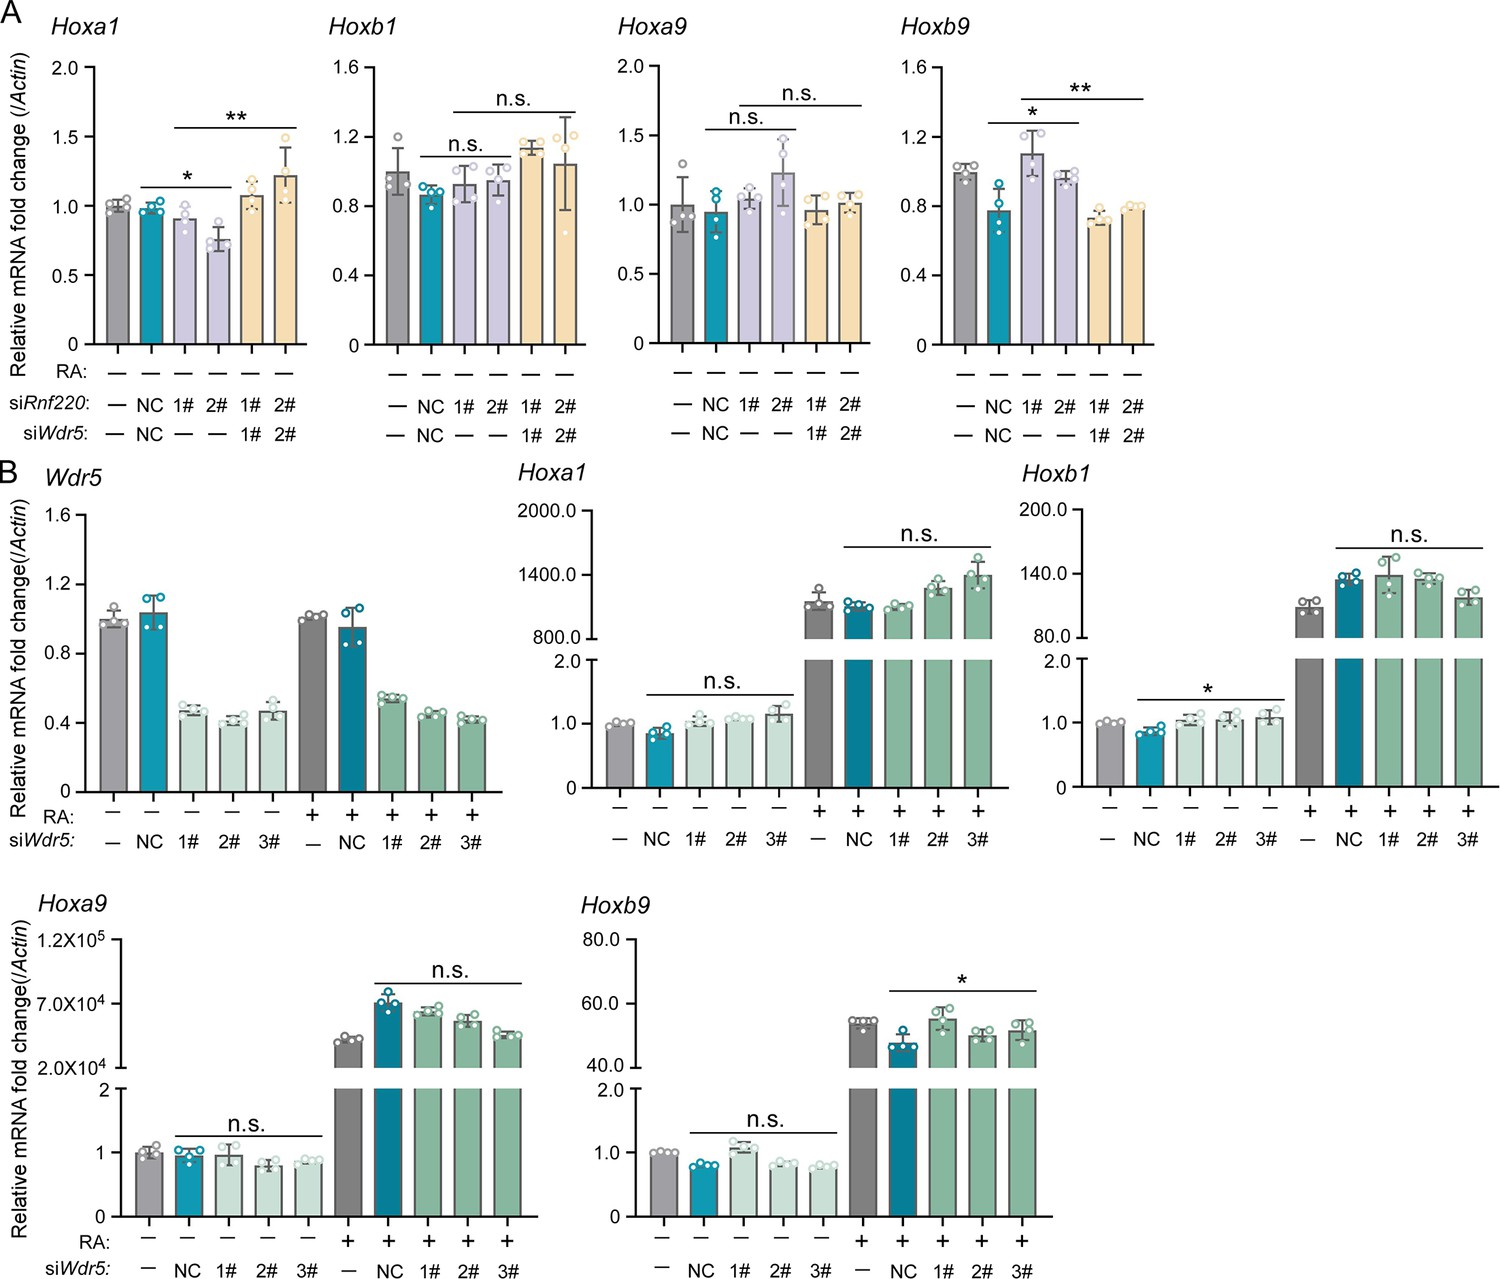
Wdr5 knockdown had no effect on Hox genes expression in P19 cells in the presence of RA or not.
(A) Quantitative real-time polymerase chain reaction (qRT-PCR) analysis showing the expression levels of Hoxa1, Hoxb1, Hoxa9, Hoxb9 when transfected siRnf220 or both siRnf220 and siWdr5 without RA treatment. (B) qRT-PCR analysis of mRNA levels of Wdr5, Hoxa1, Hoxb1, Hoxa9, and Hoxb9 when Wdr5 was knocked down by small interfering RNA (siRNA) transfection in P19 cells with or without RA treatment. Bar graphs show the relative levels normalized against control group without siRNA or RA treatment. RA, retinoic acid. n.s., not significant; *p<0.05.
Figure 6 with 1 supplement
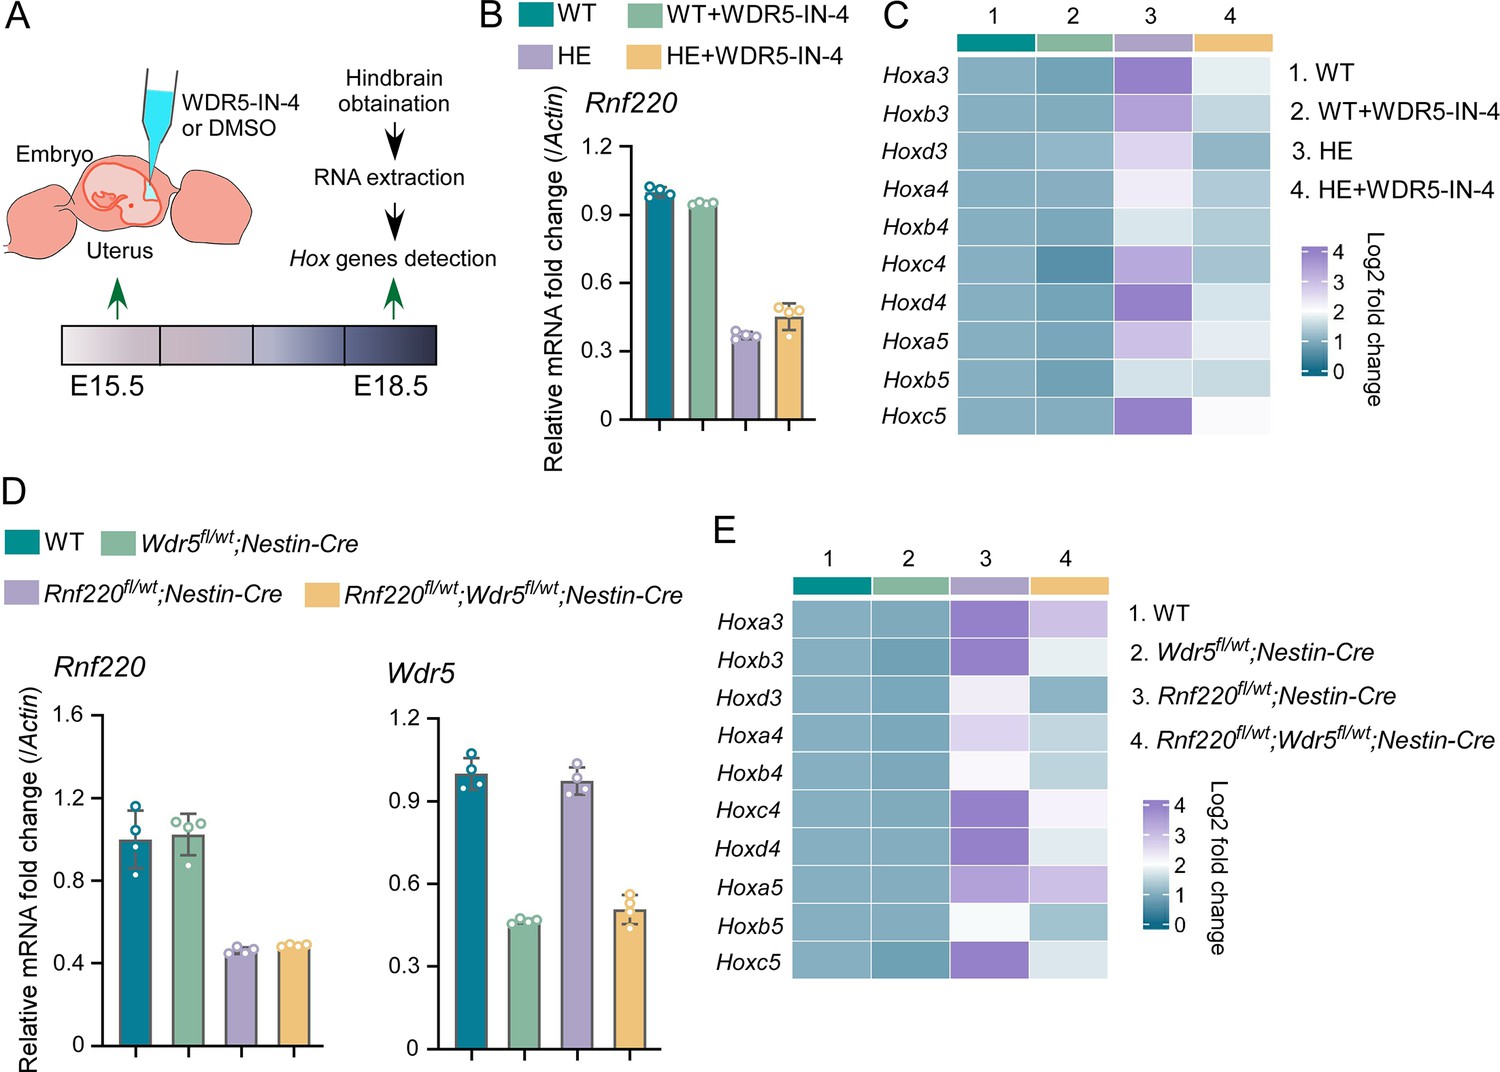
Genetic and pharmacological ablation of WDR5 recovered Rnf220 deficiency-induced up-regulation of Hox genes.
(A) Diagram of experimental strategy for in utero local injection of WDR5 inhibitors. (B–C) Quantitative real-time polymerase chain reaction (qRT-PCR) analysis of expression levels of Rnf220 (B), Hox3-Hox5 (C) in hindbrains of WT and Rnf220+/- mouse embryos treated with WDR5 inhibitors or not at E18.5 (n=3 mice per group). Actin was used as the internal controls (C). Heatmap of Hox expression showed the relative levels normalized against WT group. (D–E) qRT-PCR analysis of expression levels of Rnf220 (D), Wdr5 (D), Hox3-Hox5 (E) in pons of P15 mice with indicated genotypes (n=2 mice per group). Gapdh was used as the internal controls (E). Heatmap of Hox expression showed the relative levels normalized against WT group. WT, wild-type; HE, heterozygote.
Figure 6—figure supplement 1
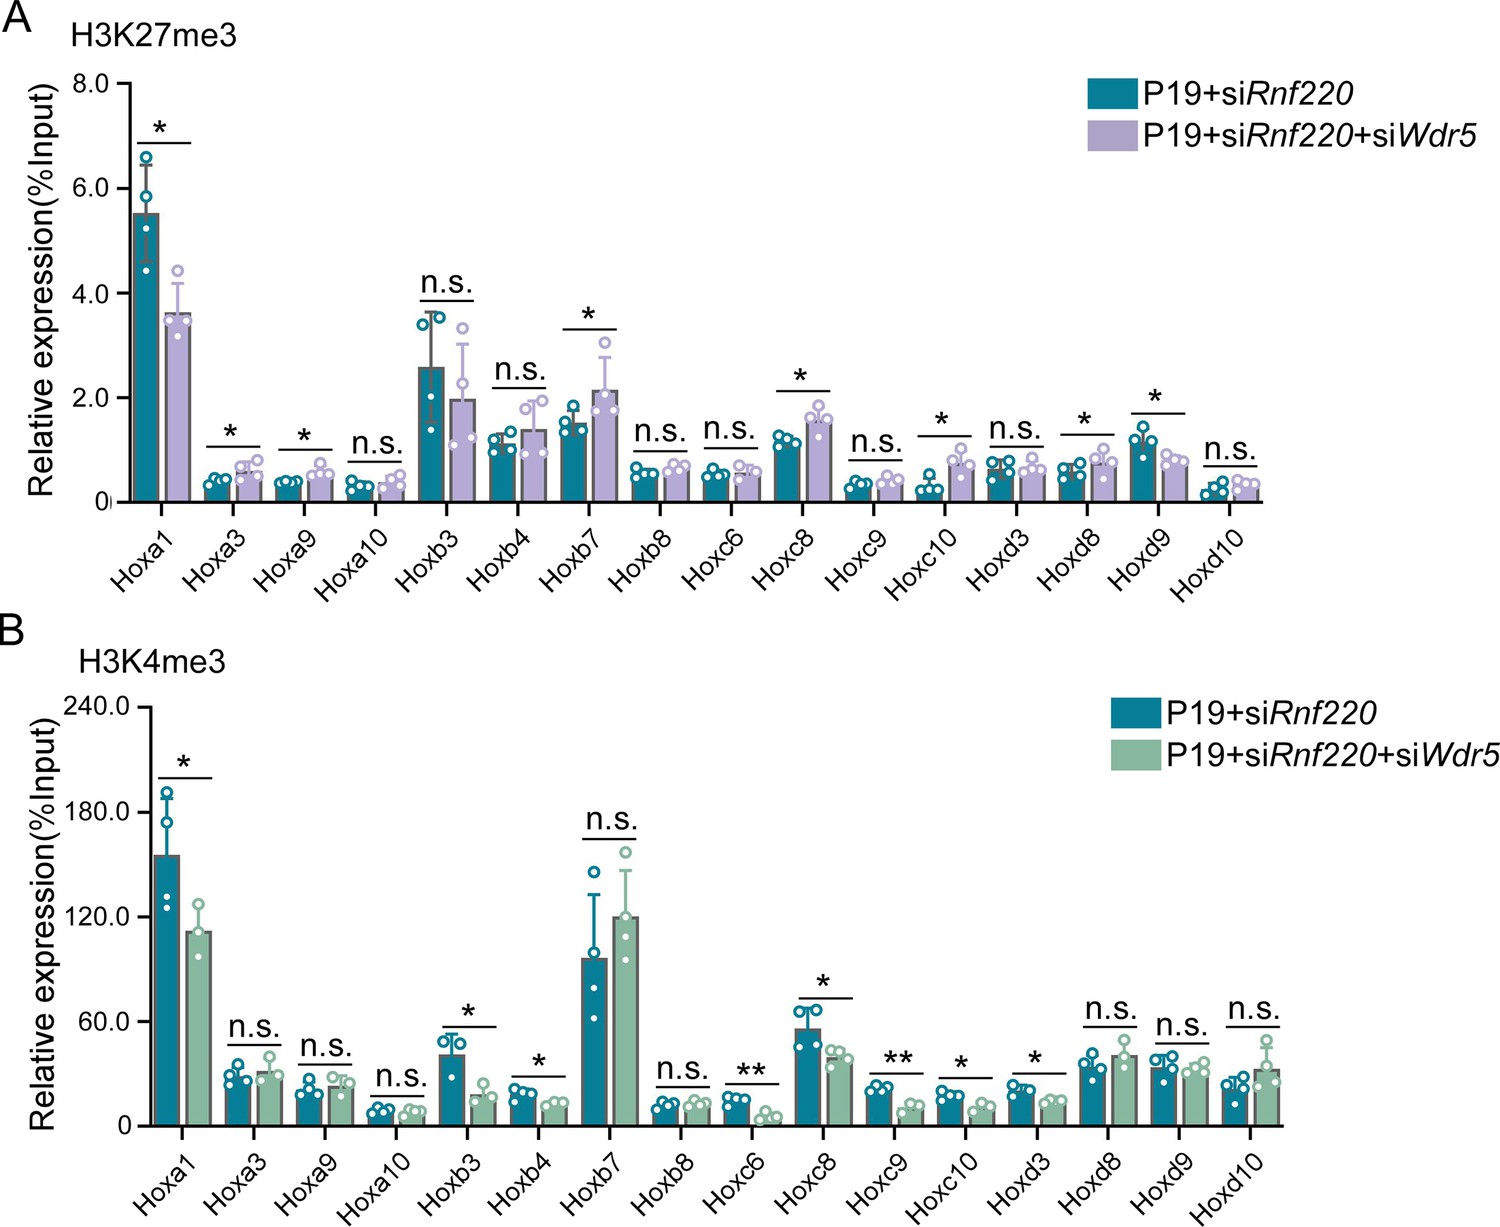
Rnf220 and Wdr5 co-suppression recovered Hox epigenetic modification to a certain degree.
(A–B) ChIP-qRT-PCR analysis of repressive epigenetic modification (H3K27me3) (A) and activated epigenetic modification (H3K4me3) (B) levels in promoter regions of indicated Hox genes in P19 cell line transfected with siRnf220 or both siRnf220 and siWdr5. n.s., not significant; *p<0.05, **p<0.01.
Author response image 1
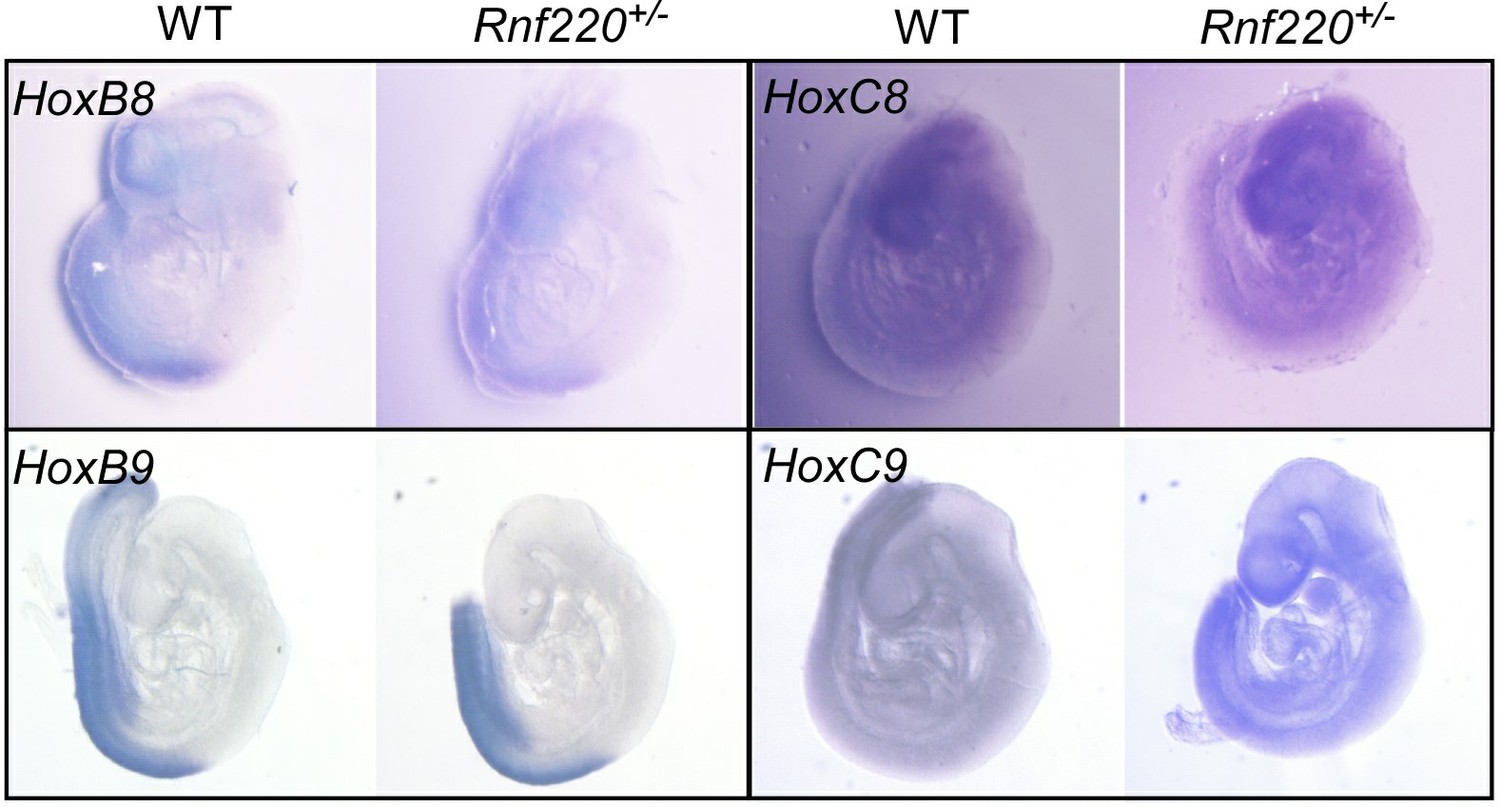
Some Hox8 and Hox9 expression pattern in E9.
5 embryos.
Author response image 2
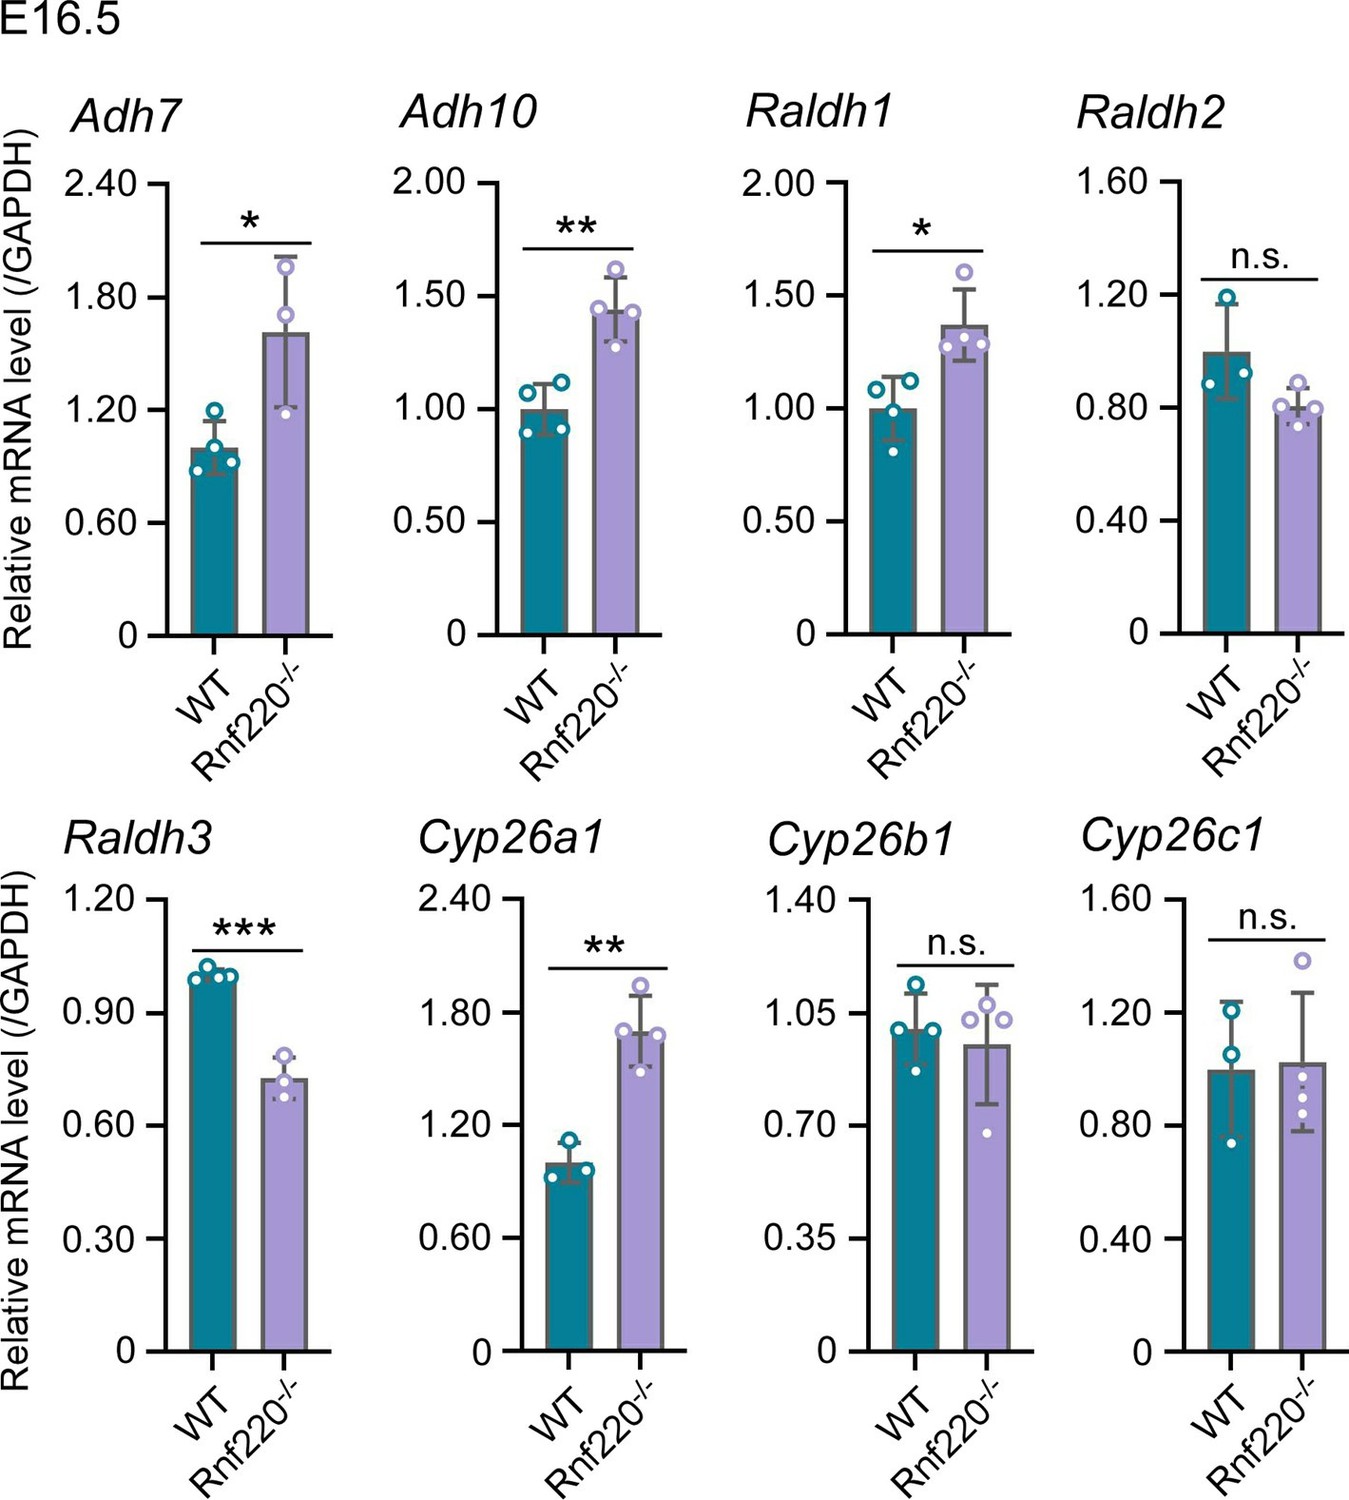
The effect of Rnf220 on RA synthesis and degradation pathways.
Tables
Table 1
Primers used for quantitative real-time polymerase chain reaction (qRT-PCR).
| Genes | Forward primers | Reverse primers |
|---|---|---|
| Actin | GCCAACCGTGAAAAGATGAC | GAGGCATACAGGGACAGCAC |
| Gapdh | AGGTCGGTGTGAACGGATTTG | TGTAGACCATGTAGTTGAGGTCA |
| Rnf220 | GTCTCAGTAGACAAGGACGTTCACA | GGGGTGGAGGTGTAGTAAGGAAG |
| Wdr5 | CGTGACAGGCGGGAAGTGGA | CGGGTGACAAGCCGTGGAAAT |
| Hoxa1 | AGCTCTGTGAGCTGCTTGGT | AAAAGAAACCCTCCCAAAACA |
| Hoxa2 | TGCCATCAGCTATTTCCAGG | GATGAAGGAGAAGAAGGCGG |
| Hoxa3 | TCTTAACATGGAGGGAGCCA | TCTGAAGGCTACGTGTGCTG |
| Hoxa4 | ACGCTGTGCCCCAGTATAAG | ACCTTGATGGTAGGTGTGGC |
| Hoxa5 | CAGGGTCTGGTAGCGAGTGT | CTCAGCCCCAGATCTACCC |
| Hoxa6 | GTCTGGTAGCGCGTGTAGGT | CCCTGTTTACCCCTGGATG |
| Hoxa7 | CTTCTCCAGTTCCAGCGTCT | AAGCCAGTTTCCGCATCTAC |
| Hoxa9 | GTAAGGGCATCGCTTCTTCC | ACAATGCCGAGAATGAGAGC |
| Hoxa10 | TCTTTGCTGTGAGCCAGTTG | CTCCAGCCCCTTCAGAAAAC |
| Hoxa11 | CCTTTTCCAAGTCGCAATGT | AGGCTCCAGCCTACTGGAAT |
| Hoxa13 | CGGTGTCCATGTACTTGTCG | AGCGGCTACTACCCGTGC |
| Hoxb1 | GGTGAAGTTTGTGCGGAGAC | TTCGACTGGATGAAGGTCAA |
| Hoxb2 | GAACCAGACTTTGACCTGCC | GAGCTGGAGAAGGAGTTCCA |
| Hoxb3 | ATCTGTTTGGTGAGGGTGGA | CCGCACCTACCAGTACCACT |
| Hoxb4 | GACCTGCTGGCGAGTGTAG | CTGGATGCGCAAAGTTCAC |
| Hoxb5 | CTGGTAGCGAGTATAGGCGG | AGGGGCAGACTCCACAGATA |
| Hoxb6 | TAGCGTGTGTAGGTCTGGCG | AGCAGAAGTGCTCCACGC |
| Hoxb7 | CTTTCTCCAGCTCCAGGGTC | AACTTCCGGATCTACCCCTG |
| Hoxb8 | GAACTCCTTCTCCAGCTCCA | CACAGCTCTTTCCCTGGATG |
| Hoxb9 | TCCAGCGTCTGGTATTTGGT | GAAGCGAGGACAAAGAGAGG |
| Hoxb13 | TGCCCCTTGCTATAGGGAAT | ATTCTGGAAAGCAGCGTTTG |
| Hoxc4 | CTAATTCCAGGACCTGCTGC | AAAAATTCACGTTAGCACGGT |
| Hoxc5 | TTCTCGAGTTCCAGGGTCTG | ATTTACCCGTGGATGACCAA |
| Hoxc6 | CAGGGTCTGGTACCGAGAGTA | TCCAGATTTACCCCTGGATG |
| Hoxc8 | CAAGGTCTGATACCGGCTGT | ATCAGAACTCGTCTCCCAGC |
| Hoxc9 | AATCTGTCTCTGTCGGCTCC | AGTCTGGGCTCCAAAGTCAC |
| Hoxc10 | ACCTCTTCTTCCTTCCGCTC | ACTCCAGTCCAGACACCTCG |
| Hoxc11 | AAATGAAGGCTCCTACGGCG | TGTCGAAGAAGCGGTCGAAA |
| Hoxc12 | AATACGGCTTGCGCTTCTT | GACCCTGGCTCTCTGGTTTC |
| Hoxc13 | CTCACTTCGGGCTGTAGAGG | TCAGGTGTACTGCTCCAAGG |
| Hoxd1 | TCTGTCAGTTGCTTGGTGCT | TGAAAGTGAAGAGGAACGCC |
| Hoxd3 | ACCAGCTGAGCACTCGTGTA | AGAACAGCTGTGCCACTTCA |
| Hoxd4 | CTCCCTGGGCTGAGACTGT | CCCTGGGAACCACTGTTCT |
| Hoxd8 | GCCCGCGAAGTTTTACGGAT | TAAGTGGTCTGGGTCCTCGC |
| Hoxd9 | TTGTTTGGGTCAAGTTGCTG | CTCAGCTTGCAGCGATCA |
| Hoxd10 | TCTCCTGCACTTCGGGAC | GGAGCCCACTAAAGTCTCCC |
| Hoxd11 | AGTGAGGTTGAGCATCCGAG | ACACCAAGTACCAGATCCGC |
| Hoxd12 | TGCTTTGTGTAGGGTTTCCTCT | CTTCACTGCCCGACGGTA |
| Hoxd13 | TGGTGTAAGGCACCCTTTTC | CCCATTTTTGGAAATCATCC |
| Unc5b | CGTGACAGGCGGGAAGTGGA | CGGGTGACAAGCCGTGGAAAT |
| Pax6 | AGACAACAACAAAGCGGACT | CTTCGCAAATGACAACTGAC |
| Barhl1 | TACCAGAACCGCAGGACTAAAT | AGAAATAAGGCGACGGGAACAT |
| Nfib | AGAAGCCCGAAATCAAGCAG | CCAGTCACGGTAAGCACAAA |
| Neph2 | ACAAGGTTCGGAAATGAAGTCG | GTTGCCATTAGGACGAGGAA |
Table 2
Primers used for ChIP-qPCR.
| Genes | Forward primers | Reverse primers |
|---|---|---|
| Hoxa1 | GCAGGACAAGGTTGATGGG | GCAGGTGGGAGGGACAGAT |
| Hoxa3 | GGACAGACTCGGTGGTAAGA | AGTTCATGTTCACGGTTCCTAT |
| Hoxa9 | GCAGGAAACACTTTGCCAGA | GCCCGAGTTAGGACCCGTA |
| Hoxa10 | CTCCTTGCCTCCTTCTTCC | CCTGGGTATCTGAGCATCTAA |
| Hoxb3 | CCGAGGACGGACCGAAGAT | CCCTGAACTGGACCACCAT |
| Hoxb4 | GAAGAACGCACGGAAAGTAAG | GGGAAAGAATATGAGCGGAGT |
| Hoxb7 | CCTTAGGGACGCCTTGGTC | ACGCAGGGATTGAATGTTCG |
| Hoxb8 | GCCATTGAATTTCTATCCCAC | GGTGAGGCAAGCTAAAGCAG |
| Hoxc6 | CTTCTCCTCTGCCCTCTTC | GTTAGTTAATACATGGACCTCT |
| Hoxc8 | GTCGTGGATTGATGAACGCG | TCTGCTCACTGTCGGTAGG |
| Hoxc9 | TGTGCCTTGAGTCACTTTGC | CTTGCTCCACTTCTCCAGAT |
| Hoxc10 | TTTTCTTTGGGTCCTCGTAAA | AGTCTAGGGAGCCATTTGTC |
| Hoxd3 | TTTTCCGAGTCCTATTGCTTG | CTGTATCATCTGCCCTCTATC |
| Hoxd8 | AGGACTTTGATTCGCTTTGATA | CGAGGTTGACGGATTGATTG |
| Hoxd9 | AACCTACCCTCGGAGATGC | GCACTGGAGTCCCAAGGAG |
| Hoxd10 | GGAGGGATGTTTCCGAACT | CACATACCCAGGCAGAACG |
Additional files
-
Supplementary file 1
Differently expressed genes identified using microarray between wild-type (WT) and Rnf220+/- mice.
Whole-mount brain from E18.5 mice were used (n=2 in WT group and n=3 in Rnf220+/- group).
- https://cdn.elifesciences.org/articles/94657/elife-94657-supp1-v1.docx
-
Supplementary file 2
Differently expressed genes identified using microarray between wild-type (WT) and Rnf220-/- mice.
Whole-mount brain from E18.5 mice were used (n=2 in WT group and n=3 in Rnf220-/- group).
- https://cdn.elifesciences.org/articles/94657/elife-94657-supp2-v1.docx
-
Supplementary file 3
Uniquely and highly expressed genes of each cluster in single-nucleus RNA sequencing (snRNA-seq).
The pons from 2 months’ mice were used (n=3 mice per group).
- https://cdn.elifesciences.org/articles/94657/elife-94657-supp3-v1.docx
-
MDAR checklist
- https://cdn.elifesciences.org/articles/94657/elife-94657-mdarchecklist1-v1.docx
Download links
A two-part list of links to download the article, or parts of the article, in various formats.
Downloads (link to download the article as PDF)
Open citations (links to open the citations from this article in various online reference manager services)
Cite this article (links to download the citations from this article in formats compatible with various reference manager tools)
The E3 ubiquitin ligase RNF220 maintains hindbrain Hox expression patterns through regulation of WDR5 stability
eLife 13:RP94657.
https://doi.org/10.7554/eLife.94657.3


