Defining cell type-specific immune responses in a mouse model of allergic contact dermatitis by single-cell transcriptomics
- State Key Laboratory of Cellular Stress Biology, School of Pharmaceutical Sciences, Xiamen University, China
- Zhejiang Yangshengtang Institute of Natural Medication Co Ltd, China
- State Key Laboratory of Cellular Stress Biology, School of Life Sciences, Xiamen University, China
- Yang Sheng Tang (Anji) Cosmetics Co Ltd, China
- Department of Dermatology, The First Affiliated Hospital of Fujian Medical University, China
- Department of Dermatology, Shanghai Tenth People’s Hospital, Tongji University School of Medicine, China
Figures
Figure 1 with 1 supplement

Characterization of mouse allergic skin immune response by single cell RNA transcriptomic analysis.
(A) Overview of the experimental setting. Allergic contact dermatitis (ACD)-like skin inflammation was triggered by sequential sensitization and elicitation of ACD by topical application of 1% or 0.2% DNFB on dorsal or ear skin as indicated. Ear skin was collected at 60 hr post-elicitation for analyses. (B) tSNE plots showing the distribution of various cell clusters marked by a color code. (C) Bubble plots showing the expression of marker genes for each cell cluster. Abbreviations: dFB, dermal fibroblast; MC, mast cell; MAC, macrophage; BF, basophil; NEU, neutrophil; Mon, monocytes; VSMC, vascular smooth muscle cell; PC, pericytes; KC, keratinocyte; EC, endothelial cell; SC, Schwann cell. (D) tSNE plots showing how cells were differentially distributed in control and ACD skin samples. Red lines circle key immune cell populations. (E) Stacked bar graph showing the percentage of each cell cluster in the control and ACD samples. (F) qRT-PCR analysis showing the expression of indicated genes (n=4–6/group). (G) Violin plots showing the expression of indicated genes in the control and ACD samples.
Figure 1—figure supplement 1
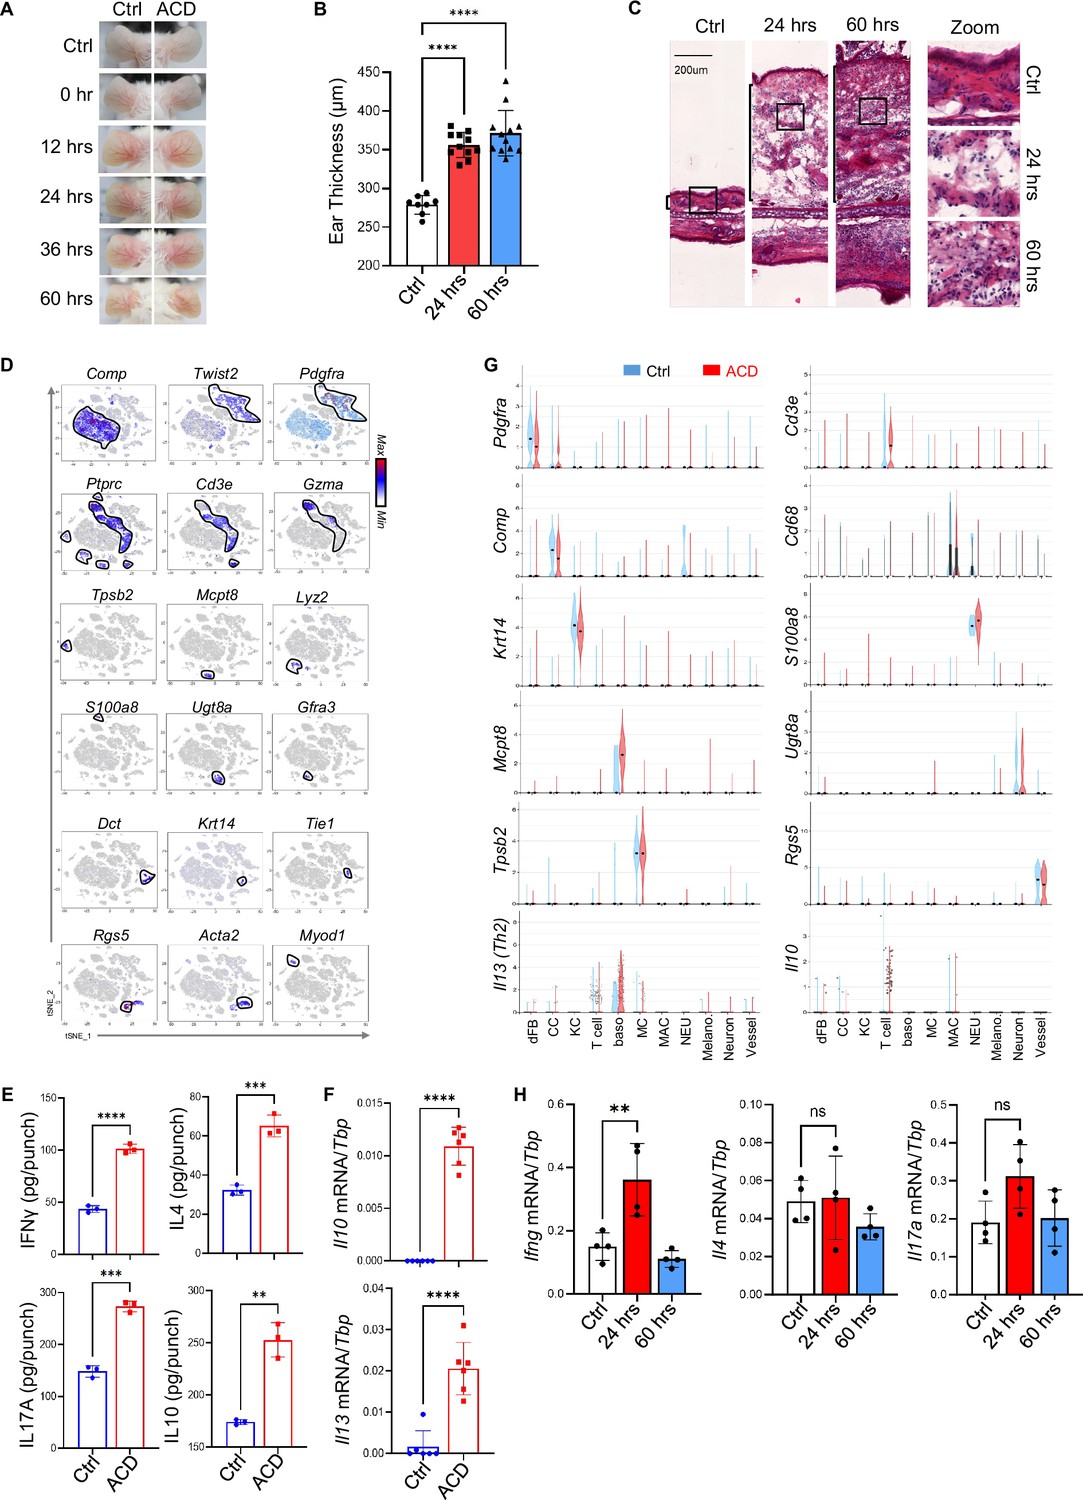
Establishment of the DNFB-elicited ACD mouse model.
(A) Phenotypical presentation of mouse back skin after 0 hr, 12 hr, 24 hr, 36 hr and 60 hr of treatment. (B–C) Ear skin samples from control, ACD (24 hr) and ACD (60 hr) groups were subjected for measurement of ear thickness (B) (n=8~12/group) and histological HE analysis (C). (D) tSNE plots showing the expression of indicated marker genes. Cell clusters expressing indicated markers were circled by black lines. (E) Cell extracts isolated from control and ACD (60 hr) ear skin samples were subjected to ELISA analysis of IFNγ, IL4, IL17A and IL10 protein expression as indicated (n=3/group). (F) Ear skin samples from control and ACD (60 hr) treatments were subjected to qRT-PCR analysis of IL13, and Il10 mRNA expression as indicated (n=4–6/group). (G). Violin plots showing the expression of indicated marker genes across various cell types, including Pdgfra +Comp- dermal fibroblasts (+), Comp+ + (CC), Krt14+ + (KC), Cd3+ or Gzma+ T cells, Mcpt8+ + (baso), Tpsb2+ + cells (MC), Cd68+Lyz2+macrophages (MAC), Ly6g+neutrophils (NEU), Dct+ + (Melano.), neuron-related cells (Ug8a+schwann cell and Gfra3+ neuron), vessel-related cells (Rgs5+ pericytes, Acta2+ Rgs5 VSMC, and Pecam1+ Tie1+endothelial cells) in ctrl and ACD samples. (H). Skin draining lymph node samples from control and ACD (24 and 60 hr) –treated mice were subjected to qRT-PCR analysis of Ifng, IL4, and Il17a mRNA expression as indicated (n=4/group). All error bars indicate mean ± SEM. **p<0.01, ***p<0.001, ****p<0.0001, ns, non-significant.
Figure 2 with 1 supplement

T cells are primarily polarized to the IFNγ-producing type-1 inflammatory phenotype in ACD.
(A) tSNE plots showing cell distribution of the CD45+CD3+ or THY1+ T cell population after re-clustering. (B) Bar graphs showing the percentage of each T cell sub-cluster in the control and the ACD samples. (C) tSNE plots showing cell distribution or the expression of Ifng in the control and the ACD samples. (D) By sample violin plots showing the expression of indicated genes across various T cell sub-clusters. (E) WIKI pathway analysis showing the top upregulated (red) or downregulated (blue) pathways in CD4+ and CD8+ T cells in ACD compared to control skin. (F) Volcano plot showing differentially expressed genes in control and ACD samples within the CD4+ and CD8+ T cells. (G–J) FACS plots and/or quantified bar graphs showing the percentage of CD4+ or CD8+ T cells (upper panel in G), or the percentage of IFNγ+IL4/13-, IFNγ-IL4/13+, or IFNγ-IL17A+ cells in CD8+ (middle panel in G) and CD4+ (lower panel in G) T cells in control, ACD (24 hr) and ACD (60 hr) ear skin samples (n=3/group). All error bars indicate mean ± SEM. *p<0.05, **p<0.01, ***p<0.001, ****p<0.0001, ns, non-significant.
Figure 2—figure supplement 1
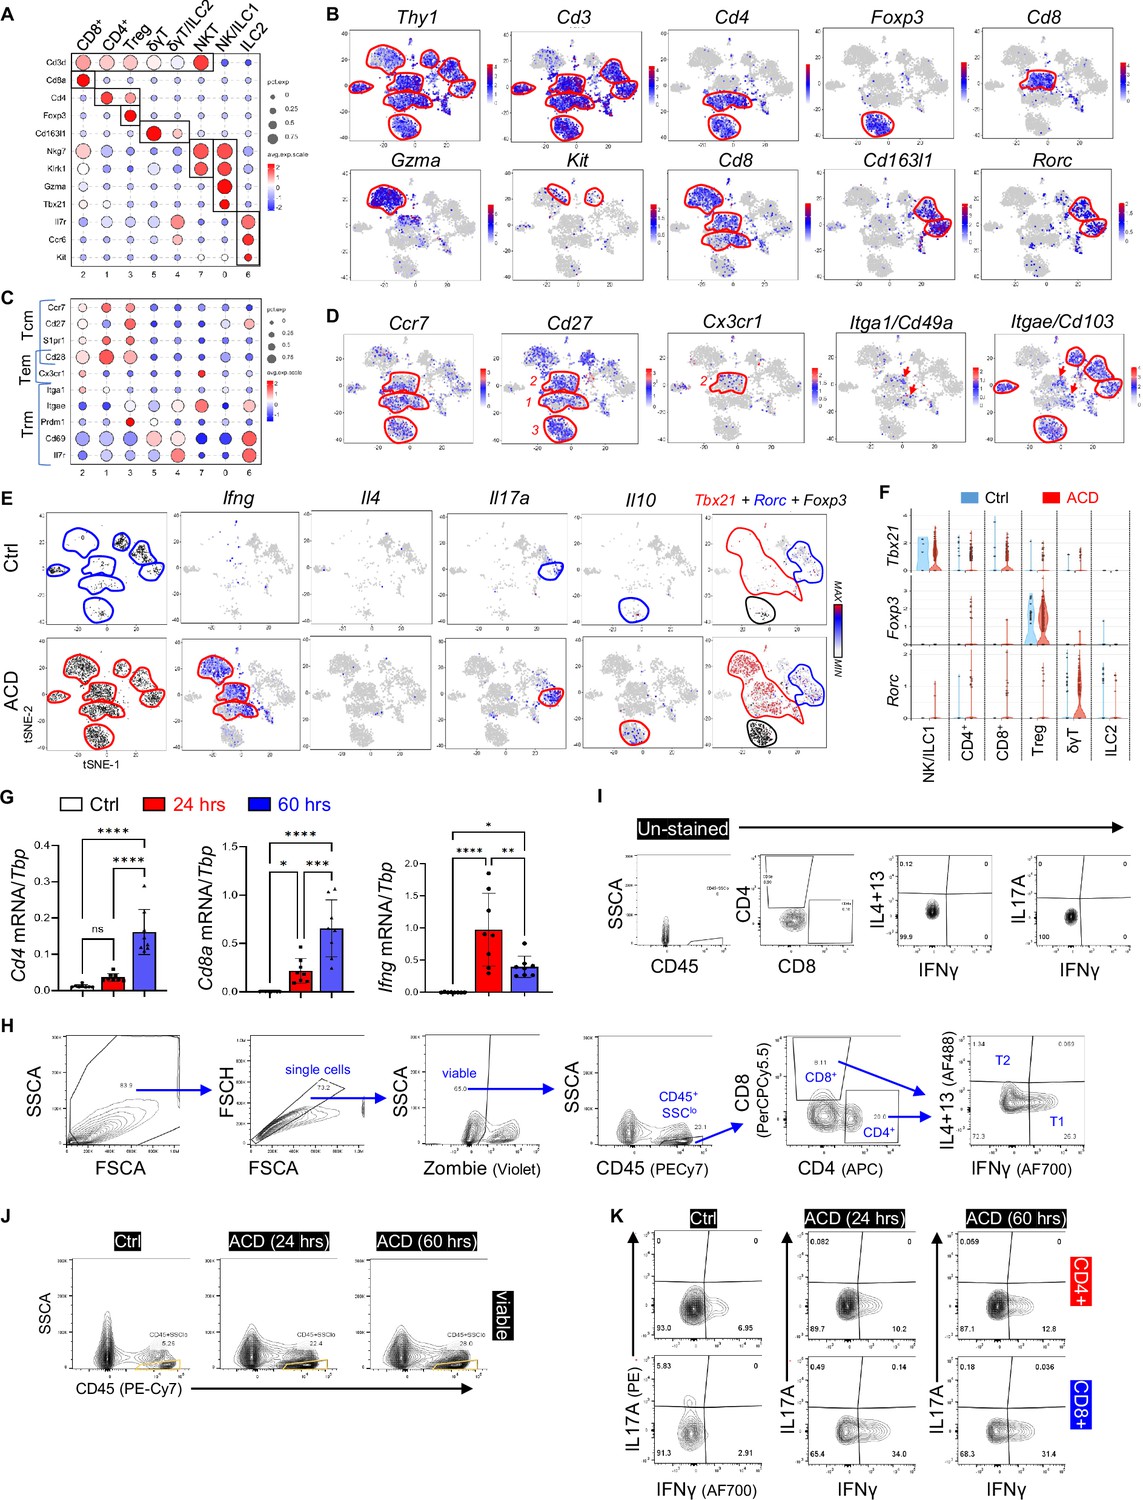
Characterization of T cell activation in ACD.
(A) Bubble plots showing the expression of marker genes for each cell cluster. Abbreviations: Treg, regulatory T cell; δγT, delta gamma T cell; ILC, innate lymphoid cell; NK, natural killer cell; NKT, natural killer T cell. (B) tSNE plots showing the expression of marker genes for each T cell cluster. (C–D) Bubble plots (C) or tSNE plots (D) showing the expression of indicated marker genes associated with central memory (Tcm), effector memory (Tem) or tissue-resident memory (Trm) T cells for each cell cluster. (E) tSNE plots showing cell distribution or the expression of Ifng, Il4, Il17a, and Il10 in the control and the ACD samples. Far right is the overlaid tSNE plots showing the expression of Tbx21 (red), Rorc (blue),and Foxp3 (black) in T cell clusters in the control and the ACD samples. (F) By sample violin plots showing the expression of indicated genes across various T cell sub-clusters. (G) qRT-PCR analysis of the expression of Cd4, Cd8a, and Ifng in control, 24 hr, or 60 hrs after elicitation of ACD (n=7–8/group). All error bars indicate mean ± SEM. *p<0.05, **p<0.01, ***p<0.001, ****p<0.0001, ns, non-significant. (H) Gating strategies to analyze type 1 (T1) or type 2 (T2) CD4+ or CD8+ T cells in the skin. (I) Unstained FACS plots for Figure 2g. (J) FACS plots showing the percentage of CD4+ or CD8+ T cells in CD45+SSCAlo immune cells. (K) FACS plots of IFNγ and IL17A in CD4+ or CD8+ T cells in control, ACD (24 hr) and ACD (60 hrs) ear skin samples (n=3/group).
Figure 3 with 1 supplement

Characterization of myeloid cell activation in ACD.
(A) Stacked bar graphs showing the percentage of indicated myeloid cell populations in the control and the ACD samples. (B) Violin plots showing the expression of indicated genes across major skin resident and immune cells as indicated. (C) Gene expression plot showing differentially expressed genes in basophils (BF, blue dots) and mast cells (MC, red dots) within the ACD sample. (D) qRT-PCR analysis of indicated genes in ear skin samples (n=6~8/group). (E–F) FACS plots (E) and quantified bar graphs (F) showing the percentage of IL4/13+ mast cells or basophils within all viable cells in ear skin samples (n=3/group). (G) qRT-PCR analysis of indicated genes in ear skin samples (n=6~8/group). (H) Gene expression plot showing differentially expressed genes in control and ACD samples within the macrophage cell cluster. (I) GO pathway analysis of the upregulated genes (red) or downregulated genes (blue) in macrophage population after ACD elicitation. (J–M) FACS plots (J) and quantified bar graphs (K–M) (n=3/group) showing the percentage of CD11B+Ly6G+ neutrophils (NEU) in all cells (K), the percentage of Ly6C+ or Ly6C- cells within CD11B+F4/80+ macrophages (L), or the percentage of inflammatory monocytes (M) (see FACS plots in Figure 3—figure supplement 1G), near skin samples. Unstained (UN) plot was shown as negative gating control. All error bars indicate mean ± SEM. *p<0.05, **p<0.01, ***p<0.001, ****p<0.0001, ns, non-significant.
Figure 3—figure supplement 1
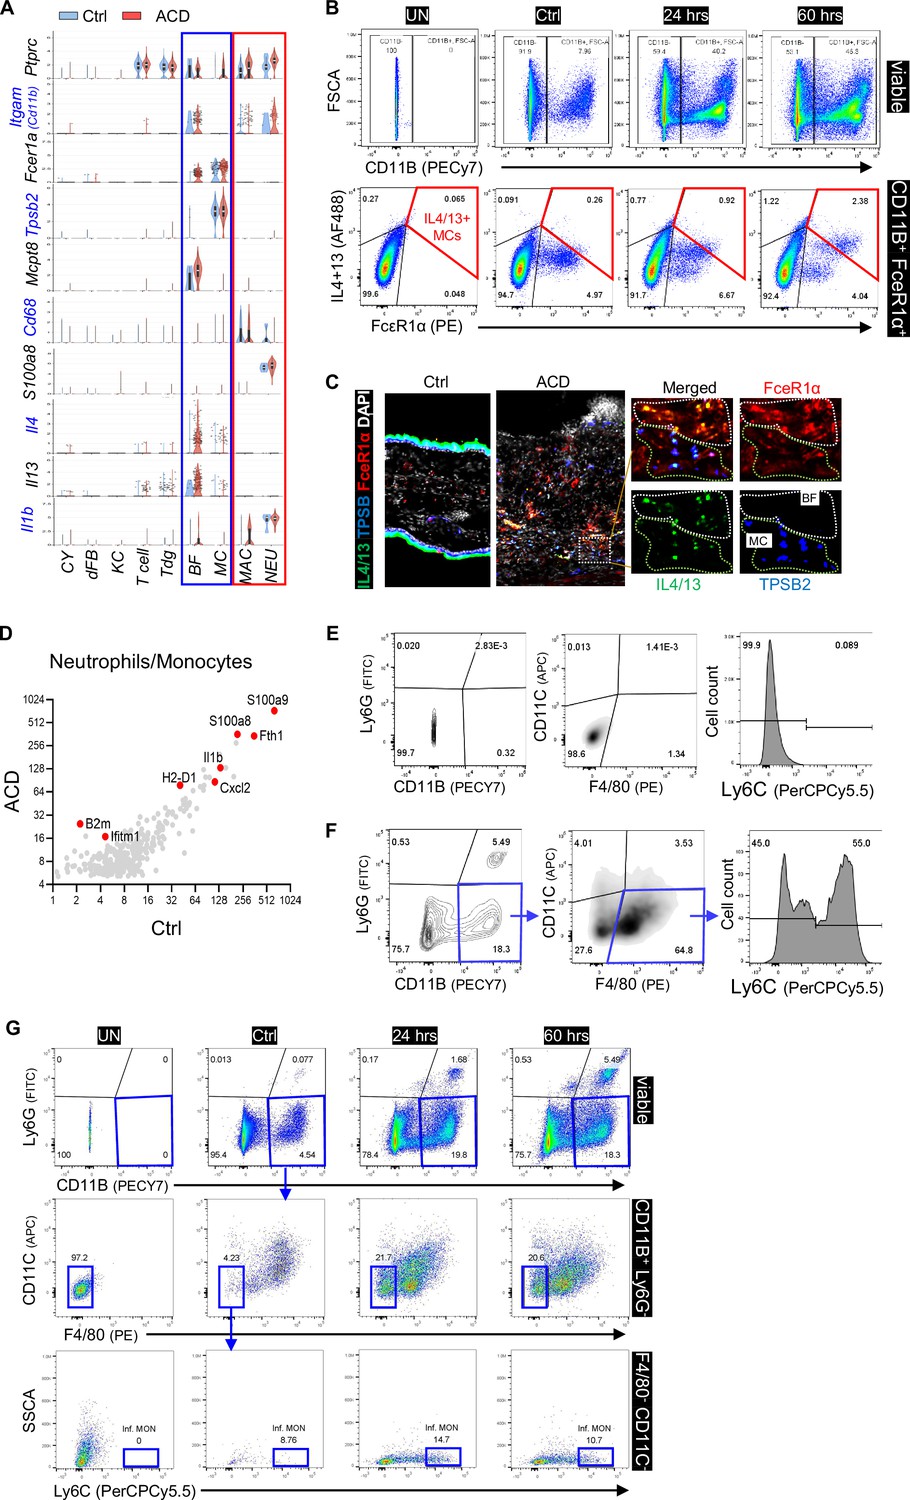
Analysis of myeloid cell activation in ACD.
(A) Violin plots showing the expression of indicated genes across major skin resident and immune cells as indicated. (B) FACS plots showing the percentage of CD11B-FcεR1a+IL4/13+ (mast cell) or CD11B+ FcεR1a+ IL4/13+ (basophil) cells within CD45+ immune cells in control, ACD (24 hr) and ACD (60 hr) ear skin samples. Unstained (UN) plot was shown as negative gating control. All error bars indicate mean ± SEM. ****p<0.0001. (C) Frozen sections of control and ACD (60 hrs) ear skin samples were subjected to immunostaining analysis using antibodies against IL4 +IL13 (green), TBSP2 (blue) and FceR1a (red). Nuclei were counter stained by DAPI (white). Scale bar, 200 μm. Zoom-in image with overlaid or single-color channel is shown on the right hand side. (D) Gene expression plot showing differentially expressed genes in control and ACD samples within the neutrophil cluster. (E) Gating strategies to analyze Ly6C expression in CD11B+;F4/80+;Ly6G-;CD11C- macrophages. (F) Unstained control plots for various markers used to analyze neutrophils or macrophages. (G) FACS plots showing the gating strategies to analyze Ly6Chi (CD11B+Ly6G-F4/80-CD11C-) inflammatory monocytes in viable cells.
Figure 4 with 1 supplement

Characterization of the immune response of dermal fibroblasts in ACD.
(A) tSNE plots showing cell distribution of the Pdgfra+ dermal fibroblasts after re-clustering. (B) Bubble plots showing the expression of marker genes for each dFB cell cluster. Abbreviations: AP, adipocyte progenitors; Areg, adipogenesis-regulatory cells; pAd, preadipocytes; RET/PAP, reticular and/or papillary dFBs; pF, peri-follicular dFBs. (C) Violin plots showing the expression of indicated genes across various dFB sub-populations in the control and the ACD samples. (D) SCENIC analysis showing the top enriched transcriptional factors in various dFB clusters. (E) GO pathway analysis of the upregulated genes (red) or downregulated genes (blue) in the r5 dFB cluster after ACD elicitation. (F) Volcano plot showing differentially expressed genes in control and ACD samples within the r5 dFB cluster. (G) Violin plots showing the expression of indicated genes across various cell populations in the control and the ACD samples. (H) Frozen sections of control and ACD ear skin samples were subjected to immunostaining analysis using antibodies against CXCL9 (green) and PDGFRA (red). Nuclei were counter stained by DAPI (blue). Dermal CXCL9+ or PDGFRA- cells were highlighted by either red- or green-dotted lines in the zoom-in panel. Scale bar, 200 μm. Zoom-in image is shown on the right-hand side. (I–J) Quantified results showing the fluorescent intensity (arbitrary unit, AU) of CXCL9, CXCL10 or PDGFRA in the dermal CXCL9/10+ cells or PDGFRA- cells shown in (H) or Figure 4—figure supplement 1G (n=5~6/group). All error bars indicate mean ± SEM. *p<0.05, ***p<0.001, ****p<0.0001, ns, non-significant.
Figure 4—figure supplement 1
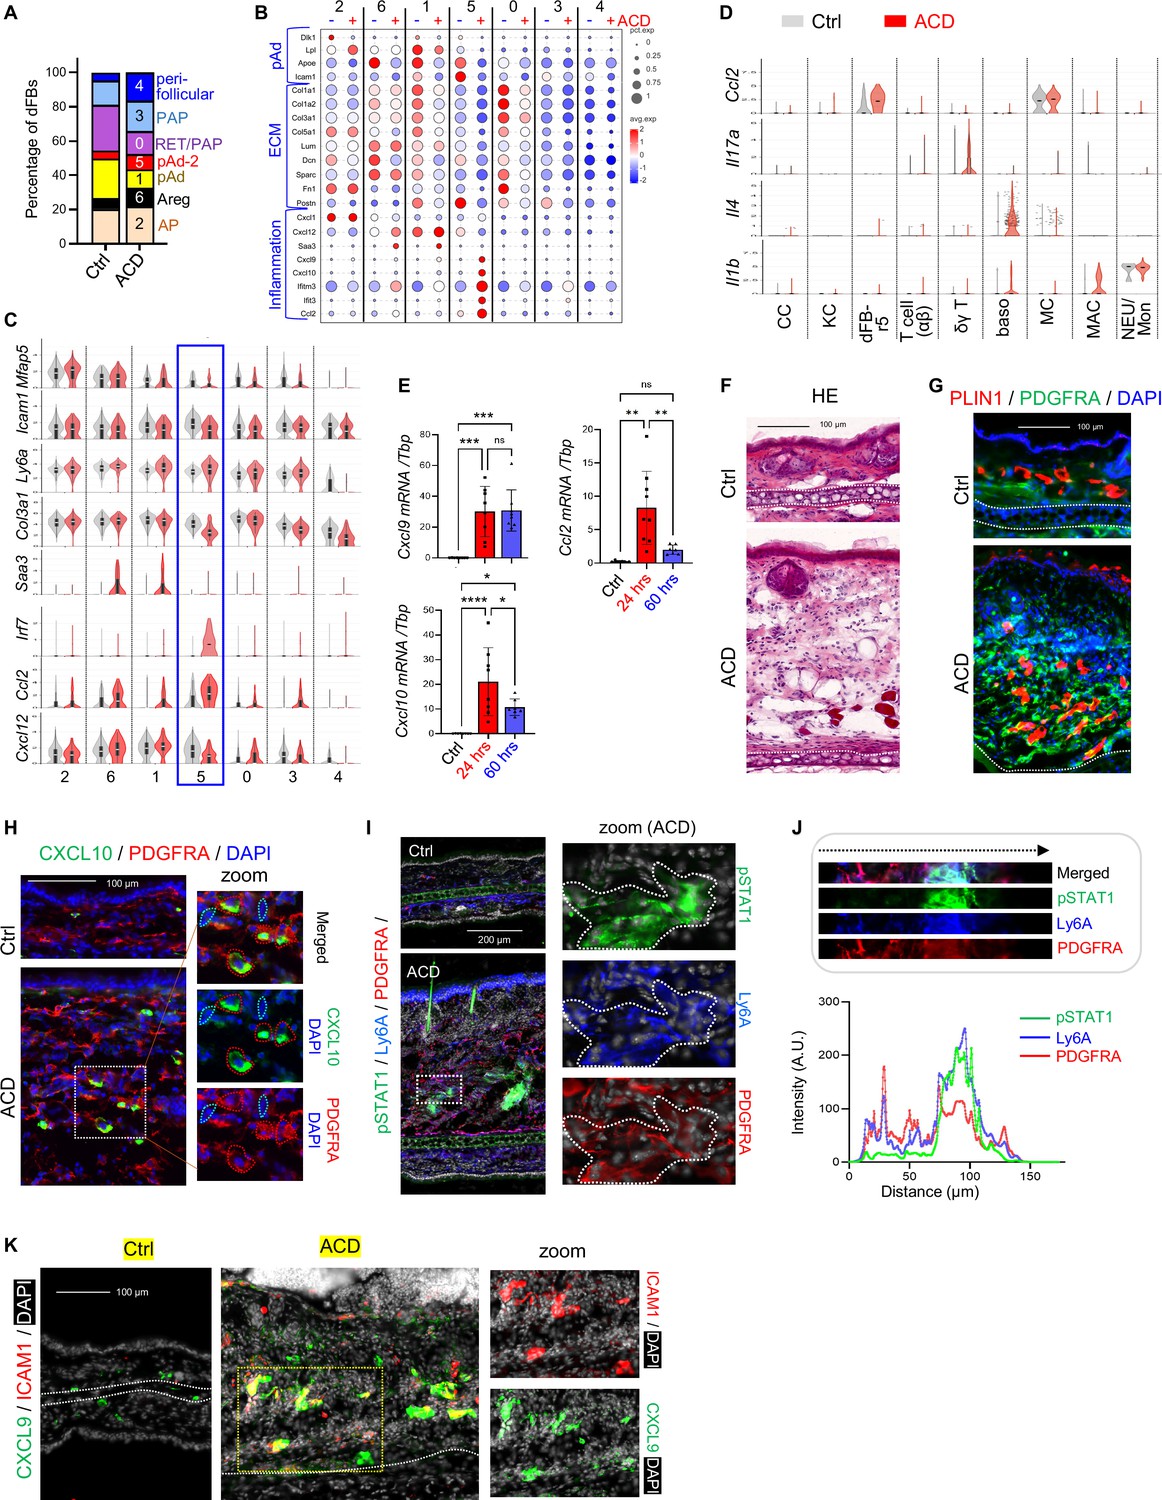
Characterization of the immune response of dermal fibroblasts in ACD.
(A) Stacked bar graphs showing the percentage of each dFB sub-cluster in the control and the ACD samples. (B–C) Bubble plots (B) or Violin plots (C) showing the expression of indicated genes across various dFB sub-populations in the control and the ACD samples. (D) Violin plots showing the expression of indicated genes across various cell populations in the control and the ACD samples. (E) qRT-PCR analysis of the expression of Cxcl9, Cxcl10, Ccl2 in control, 24 hr, or 60 hr after elicitation of ACD (n=7–8/group). Error bars indicate mean ± SEM. n.s., non-significant; **p<0.01. (F) Frozen sections of control and ACD ear skin samples were subjected to hematoxylin and eosin (HE) staining. Dash line marks the boarder between the dermis and the cartilage. (G) Frozen sections of control and ACD ear skin samples were subjected to immunostaining analysis using antibodies against PDGFRA (green) and adipocyte marker PLIN1 (red). Nuclei were counter stained by DAPI (blue). Scale bar, 100 μm. (H) Frozen sections of control and ACD ear skin samples were subjected to immunostaining analysis using antibodies against CXCL10 (green) and PDGFRA (red). Nuclei were counter stained by DAPI (blue). Scale bar, 100 μm. Zoom-in image is shown on the right-hand side, in which dermal CXCL10+ or PDGFRA- cells were highlighted by either red- or blue-dotted lines. (I) Frozen sections of control and ACD ear skin samples were subjected to immunostaining analysis using antibodies against pSTAT1 (green), Ly6A (blue) and PDGFRA (red). Nuclei were counter stained by DAPI (white). Scale bar, 200 μm. Zoom-in image is shown on the right-hand side. (J) Quantified result showing the fluorescent intensity (arbitrary unit, AU) of pSTAT1 (green), Ly6A (blue) and PDGFRA (red) across image shown on the top panel from left to right. (K) Frozen sections of control and ACD ear skin samples were subjected to immunostaining analysis using antibodies against CXCL9 (green) and ICAM1 (red). Nuclei were counter stained by DAPI (white). Scale bar, 100 μm. Zoom-in image of ACD sample is shown on the lower panel.
Figure 5 with 1 supplement

Interaction between dFBs and T cells via the IFNG-CXCL10-CXCR3 signaling axis in ACD.
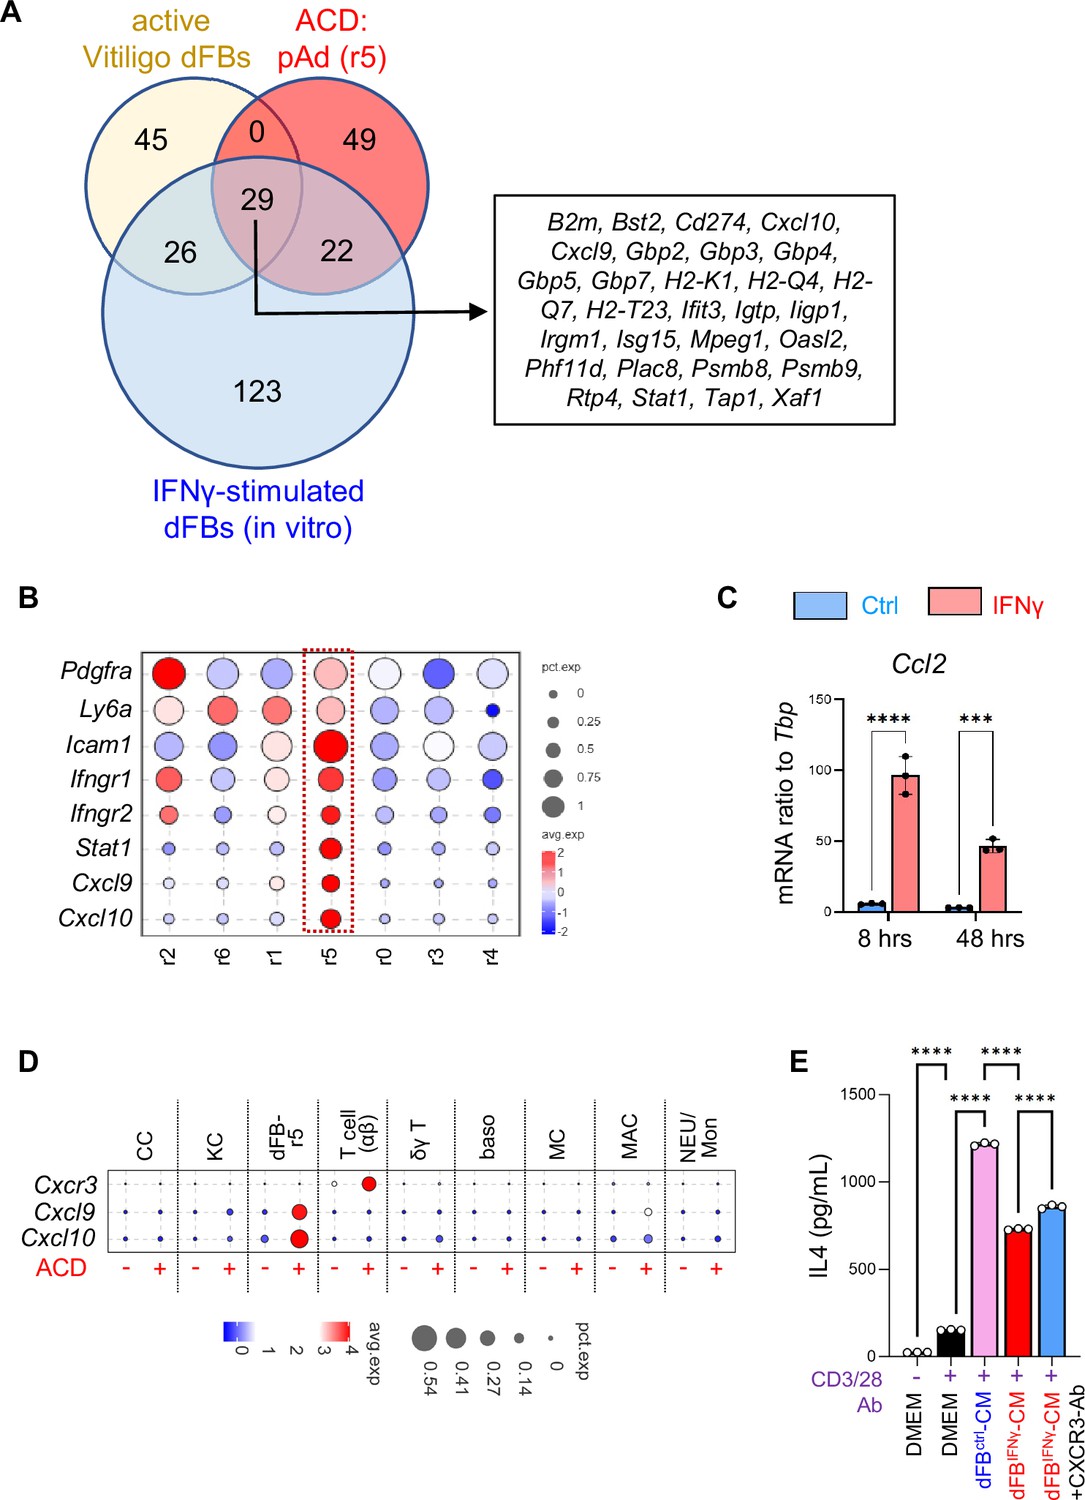
(A) Circle plot from cell-chat analysis showing the inferred intercellular communication network for IFNγ-IFNGR signaling in the control and the ACD cells. (B–C) Primary neonatal dFBs were treated with IFNγ, IL4 or IL17A for 48 hr and subjected to RNA-seq analysis. (B) Venn diagram comparing genes up-regulated by IFNγ, IL4. (C) GO pathway analysis of the genes upregulated only by IFNγ. (D) Primary dFBs were treated with IFNγ for 8 hr or 48 hr, and control or IFNγ treated samples were subjected to qRT-PCR analysis of Cxcl9, Cxcl10, Stat1, Apoe, and Col1a1 mRNA expression (n=~3/group). (E–H E) Experiment scheme for collection of IFNγ-primed dFB conditioned medium (dFBIFNγ-CM) or control dFBctrl-CM to stimulate naive T cells. (F) ELISA analysis showing protein levels of CXCL10 in dFBctrl-CM and dFBIFNγ-CM (n=3/group). (G–H) Naive T lymphocytes stimulated without (G) or with CD3/28-Ab (H) were treated with dFBctrl-CM or dFBIFNγ-CM with or w/o CXCR3 neutralizing antibody, and cell supernatants were collected for ELISA analysis of IFNγ protein expression (n=3/group). All error bars indicate mean ± SEM. *p<0.05, **p<0.01, ***p<0.001, ****p<0.0001, ns, non-significant.
Figure 5—figure supplement 1
Interaction between dFBs and T cells via the IFNG-CXCL10-CXCR3 signaling axis in ACD.
(A) Venn diagram comparing the top 100 lFNγ signaling dependent genes upregulated in the active vitiligo mouse dFBs (Xu et al., 2022), the top 100 genes enriched in the pAd (dFB_r5) cells, and the top 200 IFNγ-inducible genes in primary dFBs (in vitro). The identities of the 29 genes upregulated in all 3 conditions are shown in the box on the right panel as indicated. (B) Violin plots showing the expression of indicated genes across various dFB clusters. (C) Primary dFBs were treated with IFNγ for 8 hr or 48 hr, and control or IFNγ treated samples were subjected to qRT-PCR analysis of Ccl2 mRNA expression (n=~3/group). (D) Bubble plots showing the expression of indicated genes across various cell populations. (E). Primary naïve T lymphocytes were co-stimulated with CD3/CD28 antibody and control or IFNγ-primed dFB-CM with or w/o CXCR3 neutralizing antibody, and cell supernatants were collected for ELISA analysis of IL4 protein levels (n=3/group). All error bars indicate mean ± SEM. **p<0.01; ***p<0.001; ****p<0.0001; ns, non-significant.
Figure 6 with 1 supplement

Targeted deletion of Ifngr in dFBs inhibited the development of type-1 skin inflammation in ACD.
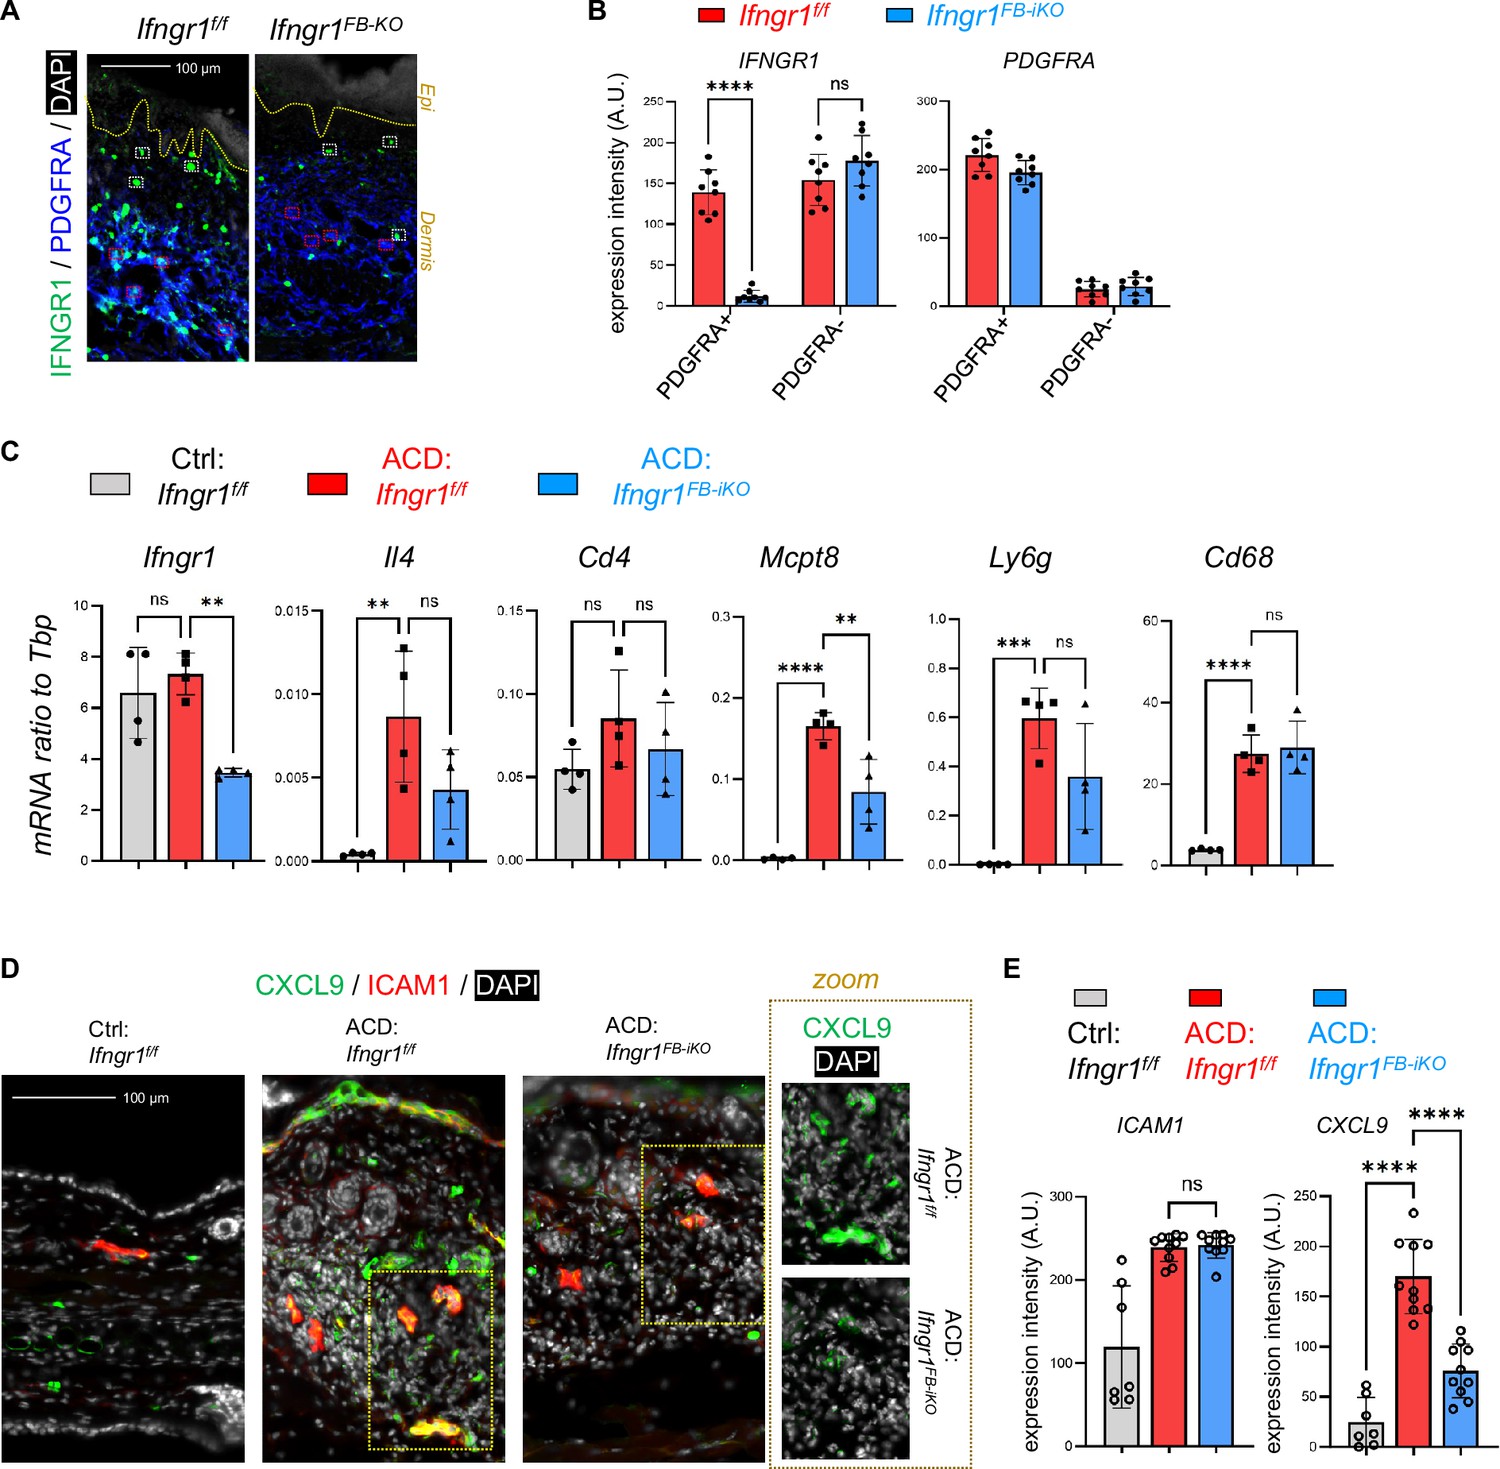
(A) Tamoxifen-inducible targeted deletion of Ifngr1 in PDGFRA+ fibroblasts (Ifngr1FB-iKO) was achieved by crossing Ifngr1f/f and Pdgfra-cre/ERT mice, and mice were subjected to DNFB-induced ACD model as indicated. (B) Multiplex-PCR-based genotyping using allele specific primers yields DNA products having sizes specific for the wild-type and Ifngr1-floxed alleles. Lower gel shows gene products for Cre and/or internal product control (IPC) as indicated. (C) Skin samples were immunostained with IFNGR1 (green) and PDGFRA (blue), and nuclei were counterstained with DAPI (white). Scale, 100 μm. (D–E) Representative ear skin images (D) for each group at 60 hours after ACD elicitation. Br graphs (E) showing quantified Eczema Area and Severity Index (EASI) scores for each group (n=6–12/group). (F) H&E staining of skin sections for each group at 60 hours after ACD elicitation. (G) qRT-PCR analysis of the mRNA expression levels of indicated genes (ratios to HK gene Tbp were shown, n=3–4/group). (H–I) Immunostaining (H) of skin sections with anti-CD8 (red) and anti-PDGFRA (blue) antibodies, and nuclei were counter stained by DAPI (white). Zoom-in images were shown in the lower panel. Quantified results (I) showing the # of CD8+ T cells per 1 mm2 of dermal area in ACD skin (n=7~9/group). All error bars indicate mean ± SEM. *p<0.05, **p<0.01, ***p<0.001, ****p<0.0001.
Figure 6—figure supplement 1
Targeted deletion of Ifngr1 in dFBs inhibited the development of type-1 skin inflammation in ACD.
(A–B) Lesional skin samples were immunostained with IFNGR1 and PDGFRA (A), and quantified result (B) showing the expression of IFNGR1 or PDGFRA in PDGFRA+ dFB or PDGFRA- dermal cells as indicated (n=8/group). Yellow dash line indicated the epidermal-dermal junction; white boxes mark PDGFRA- dermal cells and red boxes mark PDGFRA+ cells for quantification analysis (B); scale, 100 μm. All error bars indicate mean ± SEM. ****p<0.0001; ns, non-significant. (C) qRT-PCR analysis of the mRNA expression levels of indicated genes (ratios to HK gene Tbp were shown, n=3–4/group). (D–E) Frozen sections of control and ACD ear skin samples were subjected to immunostaining analysis (D) using antibodies against CXCL9 (green) and ICAM1 (red). Nuclei were counter stained by DAPI (white). Scale bar, 100 μm. Zoom-in images are shown on the lower panel. Quantified result (E) showing the expression of ICAM1 or CXCL9 in ICAM1+ cells as indicated (n=7~10/group). All error bars indicate mean ± SEM. **p<0.01; ***p<0.001; ****p<0.0001; ns, non-significant.
Figure 7 with 1 supplement

Activation of dermal T cells and fibroblasts in human ACD skin samples.
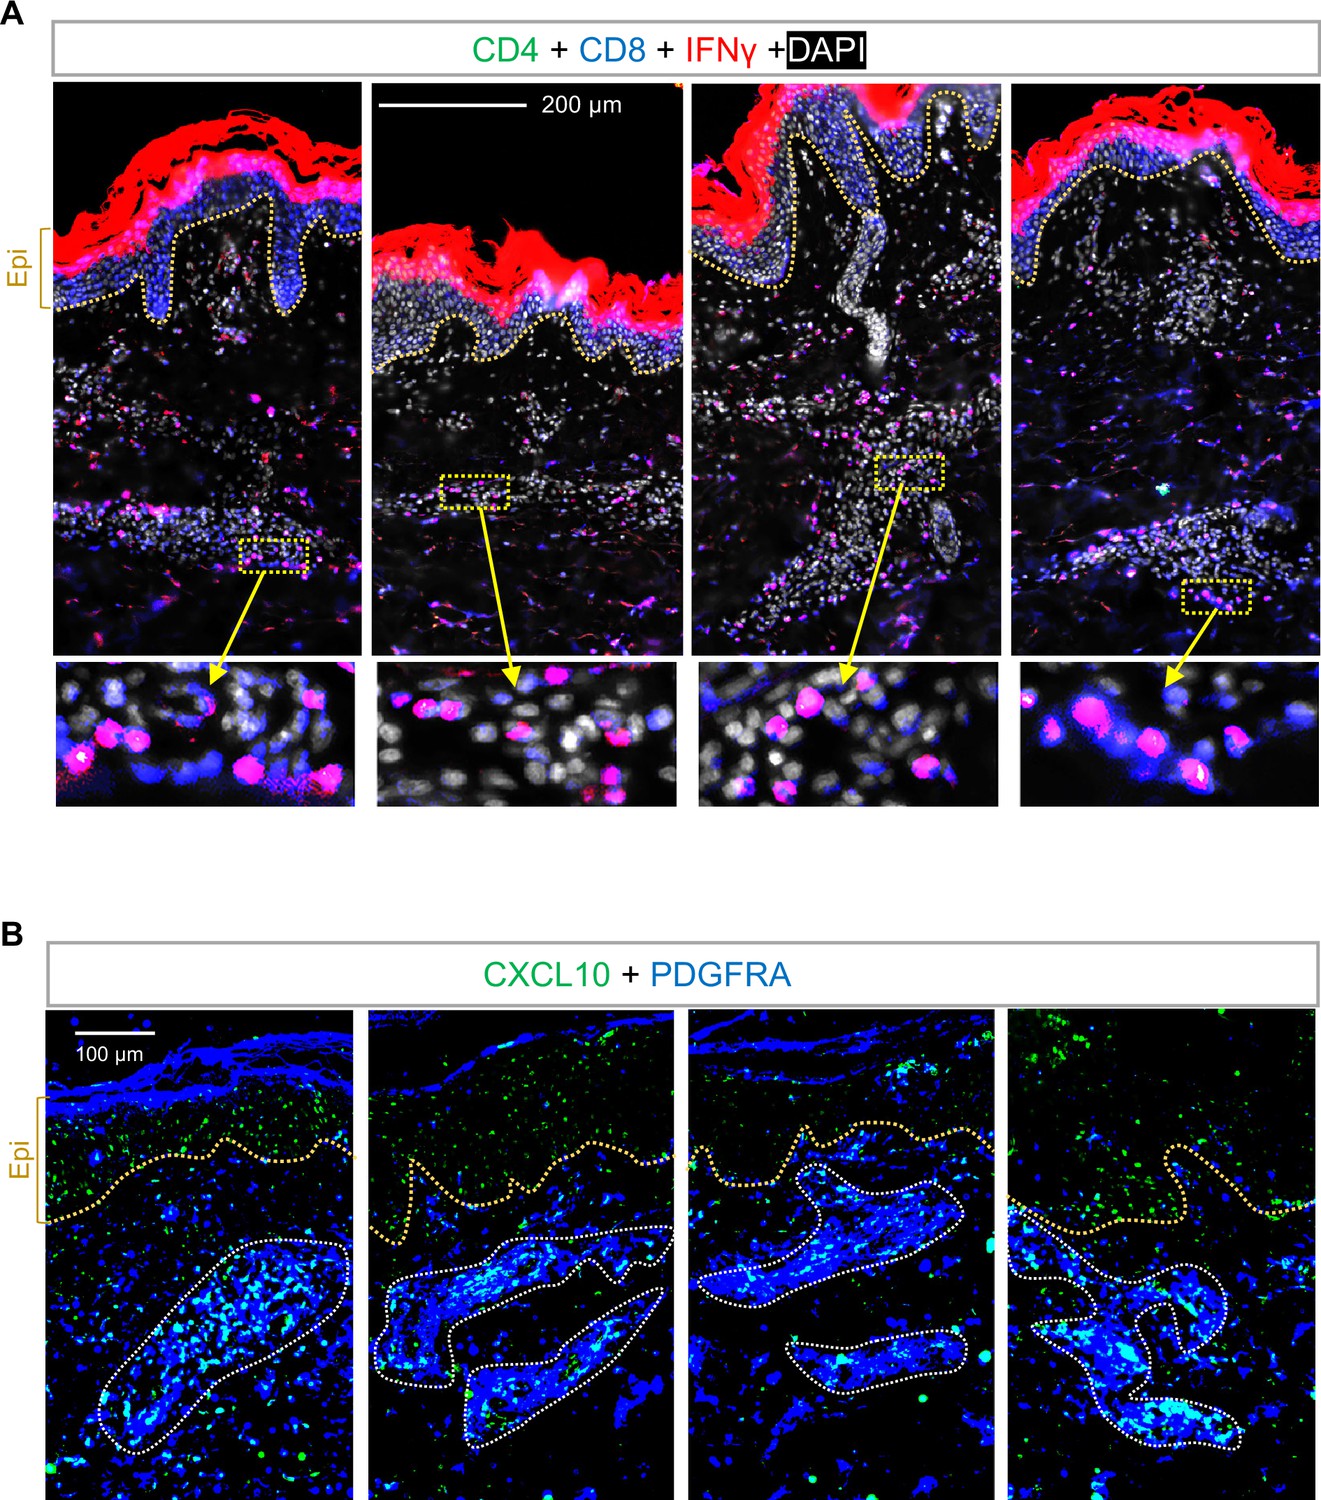
(A) Skin sections from healthy control (HC) or ACD human skin samples were immunostained with antibodies against CD4 (green), CD8 (blue), and IFNγ (red) (representative of n=4/group). Nuclei were counter stained by DAPI (white). Scale bar, 200 μm. Zoom-in image is shown on the right-hand side. (B) Upper panel is the zoom-in images from panel A. Lower panel is the quantified intensity profiles of CD8 (blue) and IFNγ (red) from left to right of the images marked by yellow dashed boxes. (C) Skin sections from healthy control (HC) or ACD human skin samples were subjected to Masson’s staining, in which collagen bundles were stained in blue. (D) Skin sections from healthy control (HC) or ACD human skin samples were immunostained with antibodies against CD8 (red) and PDGFRA (blue), and representative images of dermal lobular structures were shown (representative of n=4/group). (E) Skin sections from healthy control (HC) or ACD human skin samples were immunostained with CXCL10 (green) and PDGFRA (blue). Scale bar, 200 μm. Zoom-in image is shown on the right-hand side (F) Upper panel is the zoom-in images from panel E. Lower panel is the quantified intensity profiles of PDGFRA (blue) and CXCL10 (green) from left to right of the images marked by yellow dashed boxes.
Figure 7—figure supplement 1
Activation of dermal T cells and fibroblasts in human ACD skin samples.
(A) Skin sections from ACD human skin samples were immunostained with antibodies against CD4 (green), CD8 (blue) and IFNγ (red) (n=4). Nuclei were counter stained by DAPI (white). Scale bar, 200 μm. Zoom-in image is shown on the bottom panel. (B) Skin sections from ACD human skin samples were immunostained with CXCL10 (green) and PDGFRA (blue) (n=4). Scale bar, 200 μm.
Additional files
-
MDAR checklist
- https://cdn.elifesciences.org/articles/94698/elife-94698-mdarchecklist1-v2.pdf
-
Supplementary file 1
List of gene primers used for RT-qPCR.
- https://cdn.elifesciences.org/articles/94698/elife-94698-supp1-v2.docx
-
Supplementary file 2
List of Top 5 enriched genes in cell clusters shown in Figure 1B–C.
- https://cdn.elifesciences.org/articles/94698/elife-94698-supp2-v2.xlsx
-
Supplementary file 3
List of the differentially upregulated genes in the active vitiligo mouse dFBs, the ACD pAd (dFB_r5) cells, and the IFNγ-stimulated primary dFBs as shown in Figure 5—figure supplement 1A.
- https://cdn.elifesciences.org/articles/94698/elife-94698-supp3-v2.xlsx
-
Supplementary file 4
The RNA-seq FPKM data of primary neonatal dFBs treated with IFNγ, IL4 or IL17A.
- https://cdn.elifesciences.org/articles/94698/elife-94698-supp4-v2.xlsx
-
Supplementary file 5
List of the differentially upregulated genes in primary neonatal dFBs treated with IFNγ, IL4 or IL17A as shown in Figure 5B–C.
- https://cdn.elifesciences.org/articles/94698/elife-94698-supp5-v2.xlsx
Download links
A two-part list of links to download the article, or parts of the article, in various formats.
Downloads (link to download the article as PDF)
Open citations (links to open the citations from this article in various online reference manager services)
Cite this article (links to download the citations from this article in formats compatible with various reference manager tools)
Defining cell type-specific immune responses in a mouse model of allergic contact dermatitis by single-cell transcriptomics
eLife 13:RP94698.
https://doi.org/10.7554/eLife.94698.3


