Robust estimation of cancer and immune cell-type proportions from bulk tumor ATAC-Seq data
- Department of Oncology, Ludwig Institute for Cancer Research, University of Lausanne, Switzerland
- Agora Cancer Research Center, Switzerland
- Swiss Cancer Center Leman (SCCL), Switzerland
- Swiss Institute of Bioinformatics (SIB), Switzerland
- Ludwig Institute for Cancer Research, Lausanne Branch, Switzerland
- Department of Pathology and Immunology, Faculty of Medicine, University of Geneva, Switzerland
- Geneva Center for Inflammation Research, Switzerland
Figures
Figure 1 with 1 supplement
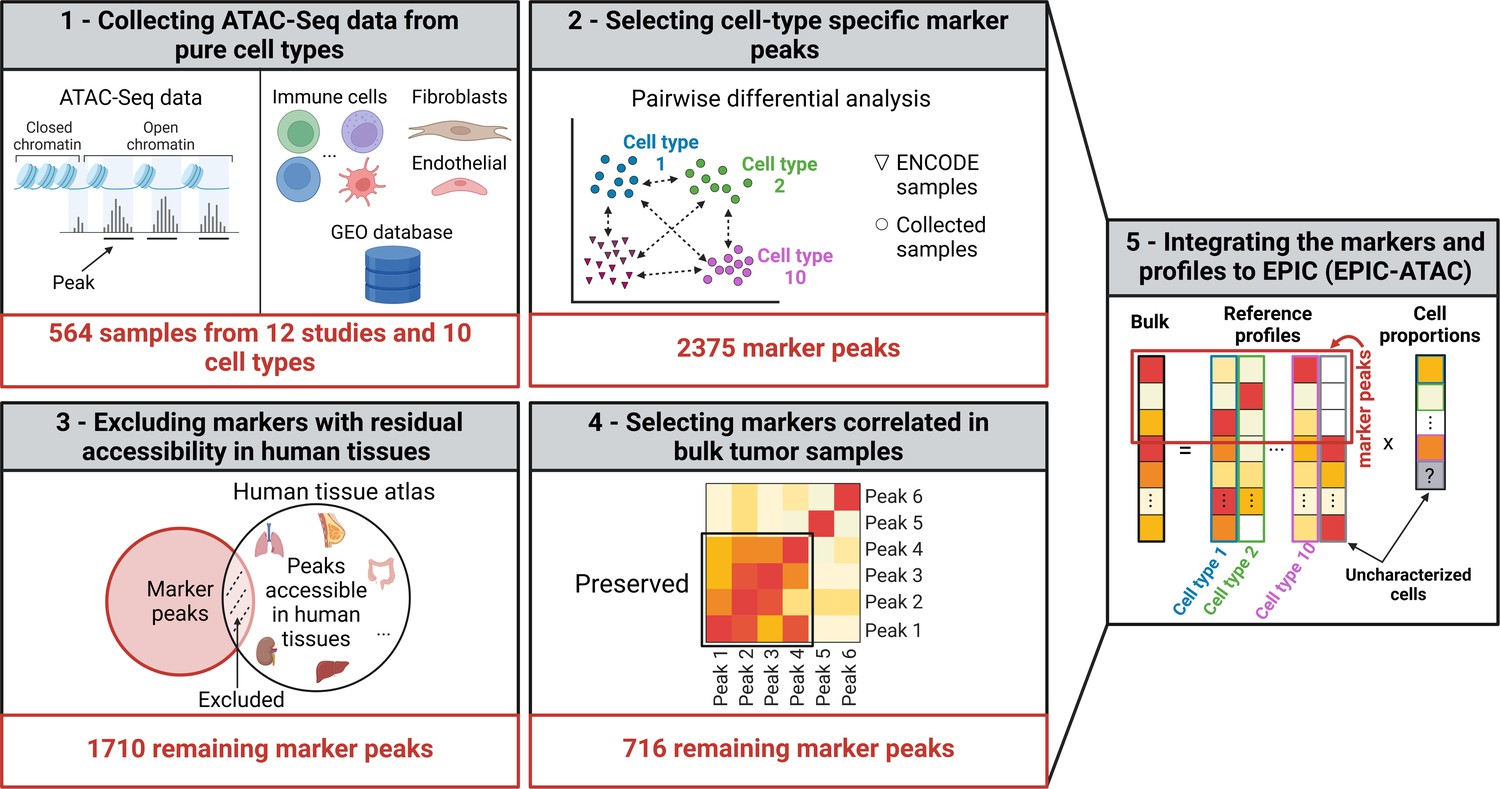
Graphical description of the identification of cell-type specific marker peaks and reference ATAC-Seq profiles included in the EPIC-ATAC framework.
(1) 564 pure ATAC-Seq data of sorted cells were collected to build reference profiles for non-malignant cell types observed in the tumor microenvironment. (2) Cell-type specific marker peaks were identified using differential accessibility analysis. (3) Markers with previously observed chromatin accessibility in human healthy tissues were excluded. (4) For tumor bulk deconvolution, the set of remaining marker peaks was refined by selecting markers with correlated behavior in tumor bulk samples. (5) The cell-type specific marker peaks and reference profiles were integrated into the EPIC-ATAC framework to perform bulk ATAC-Seq deconvolution. Created with BioRender.com.
Figure 1—figure supplement 1
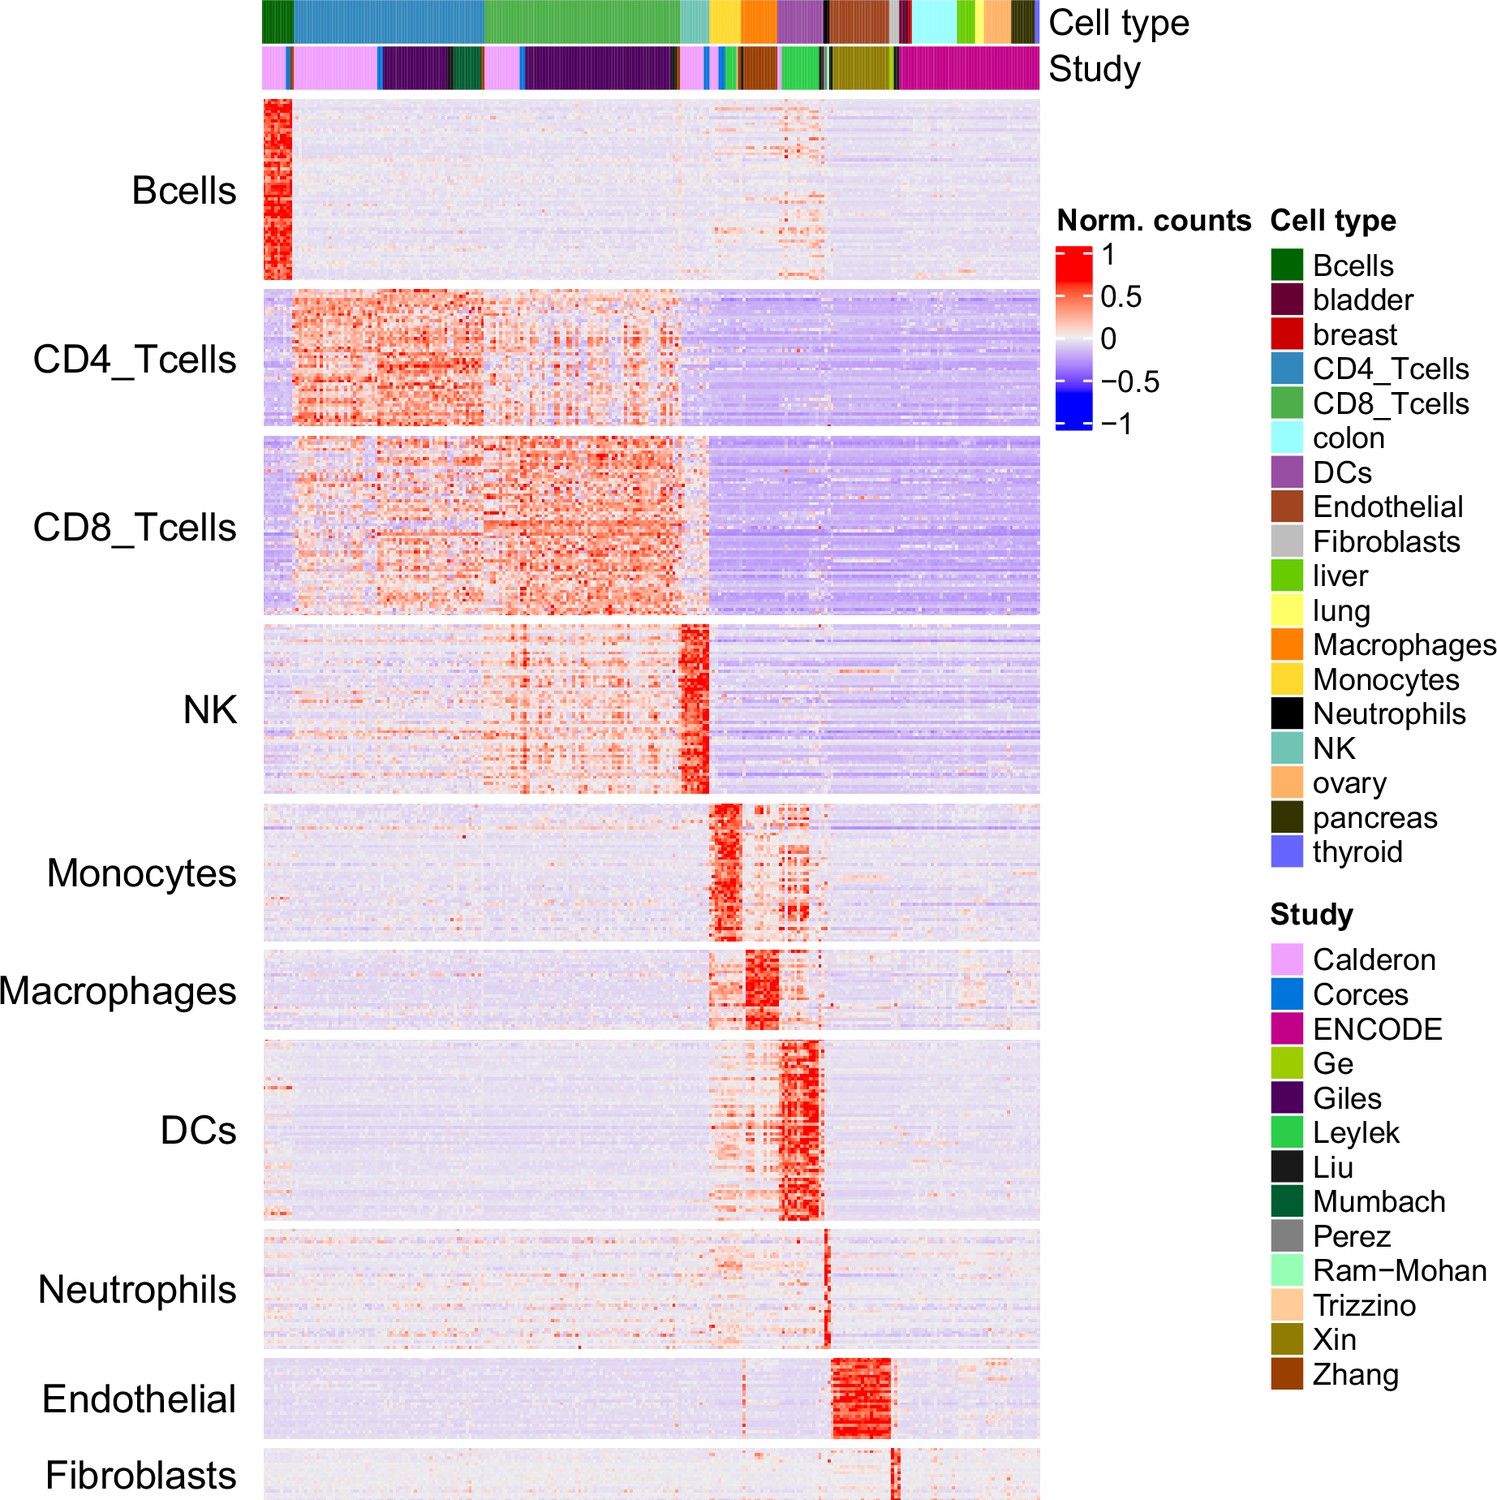
Chromatin accessibility of the markers in the reference and ENCODE samples.
Chromatin accessibility signal of each marker peak (rows) in each reference sample and in the ENCODE samples from diverse tissues (columns).
Figure 2 with 1 supplement
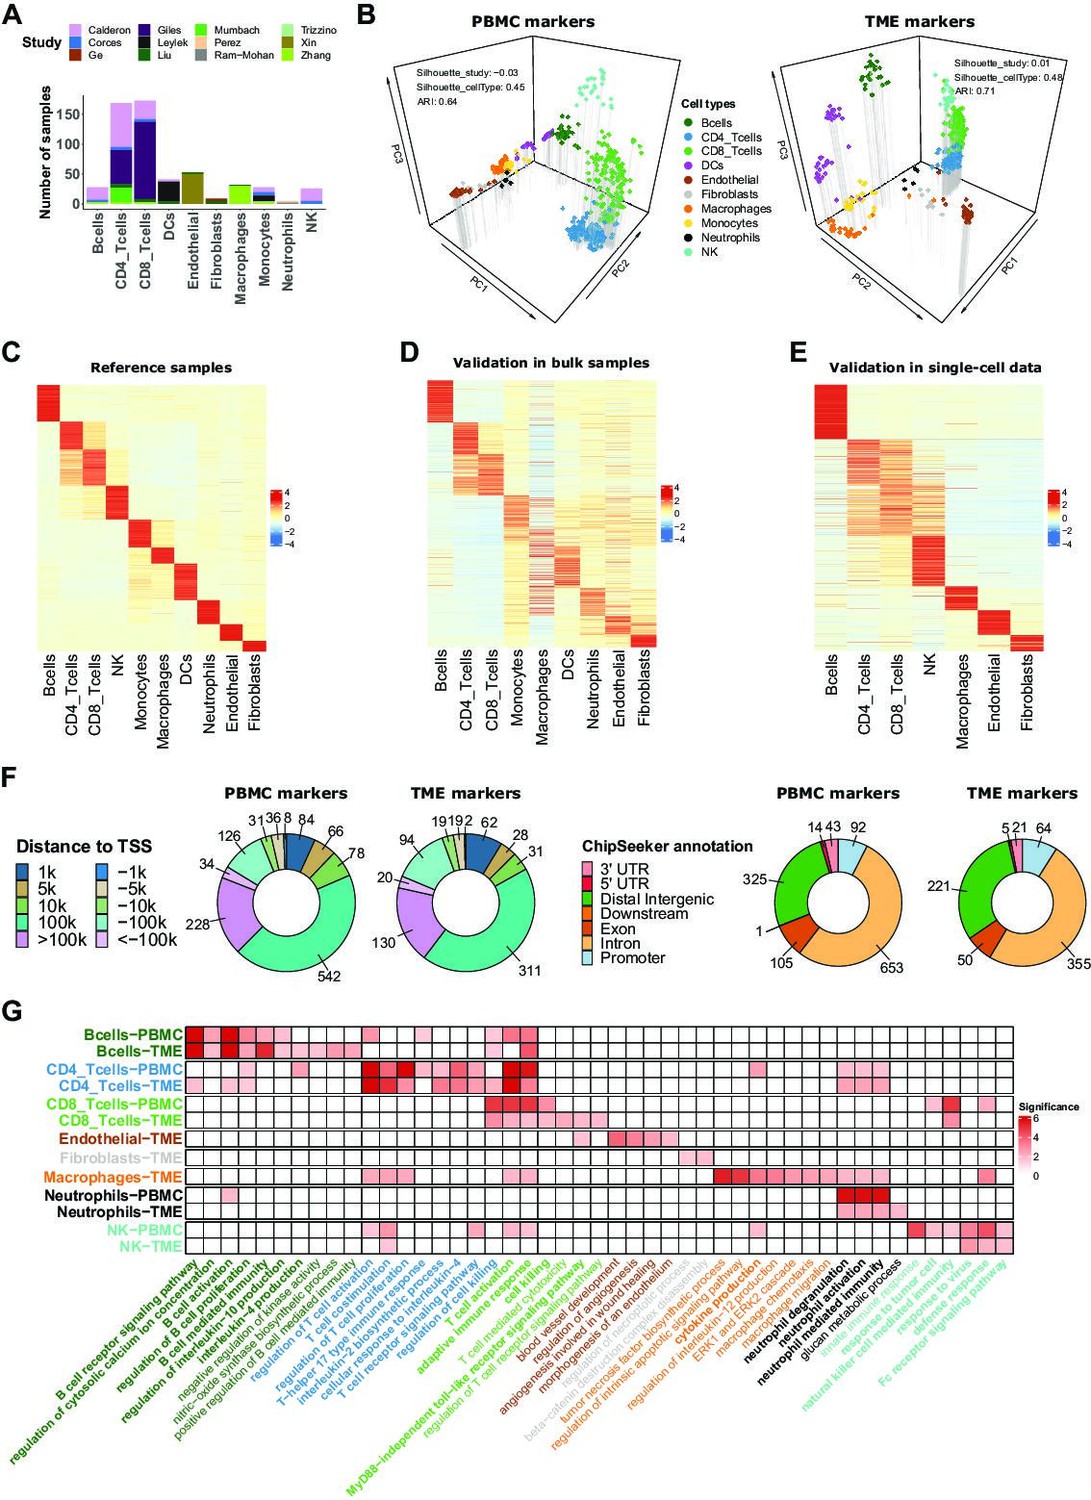
ATAC-Seq data from sorted cell populations reveal cell-type specific marker peaks and reference profiles.
(A) Number of samples collected for each cell type. The colors correspond to the different studies of origin. (B) Representation of the collected samples using the first three components of the PCA based on the PBMC markers (left) and TME markers (right). Colors correspond to cell types. (C) Scaled averaged chromatin accessibility of all the cell-type specific marker peaks (PBMC and TME markers) (rows) in each cell type (columns) in the ATAC-Seq reference samples used to identify the marker peaks. (D) Scaled averaged chromatin accessibility of all the marker peaks in external ATAC-Seq data from samples of pure cell types excluded from the reference samples (see Materials and methods). (E) Scaled averaged chromatin accessibility of all the marker peaks in an external scATAC-Seq dataset (Human Atlas Zhang et al., 2021b). (F) Distribution of the marker peak distances to the nearest transcription start site (TSS) (left panel) and the ChIPseeker annotations (right panel). (G) Significance (-log10(q.value)) of pathways (columns) enrichment test obtained using ChIP-Enrich on each set of cell-type specific marker peaks (rows). A subset of relevant enriched pathways is represented. Colors of the names of the pathways correspond to cell types where the pathways were found to be enriched. When pathways were significantly enriched in more than one set of peaks, pathway names are written in bold.
Figure 2—figure supplement 1
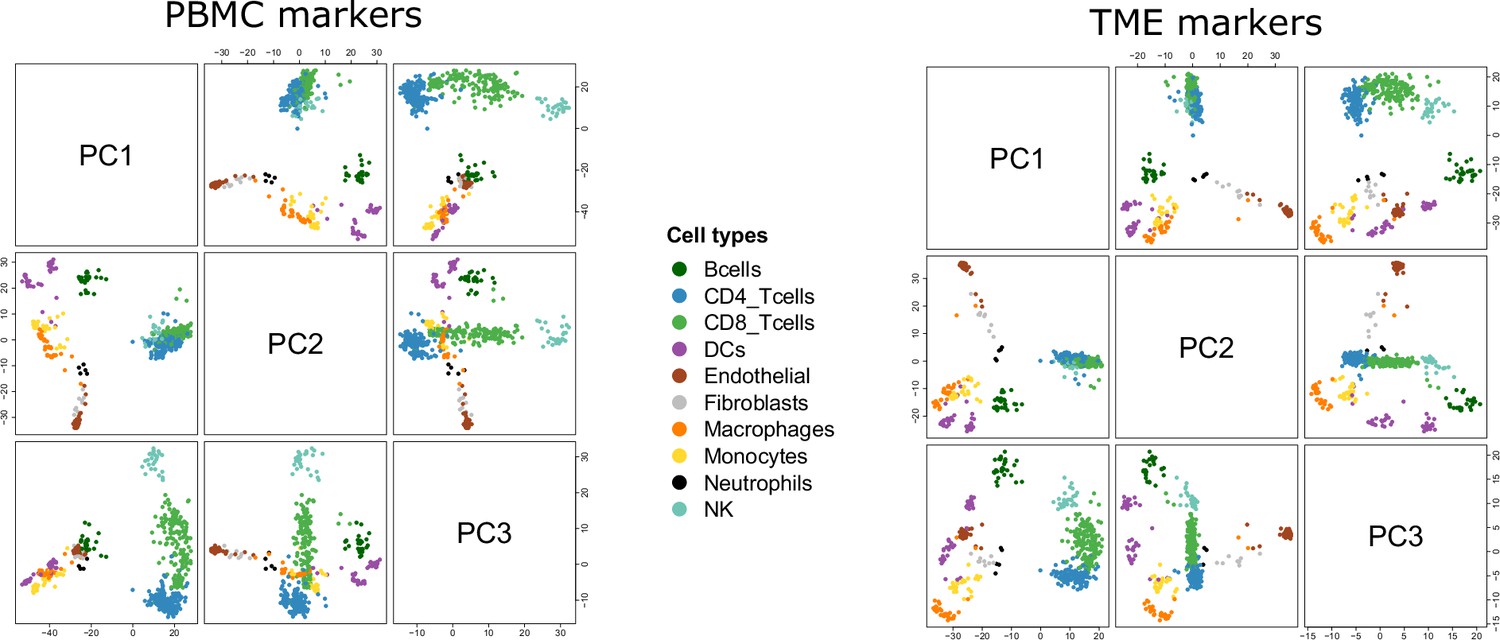
Reference samples in the PCA space.
Pairwise scatterplots of the first 3 axes of the PCA run on the PBMC markers (left) and TME markers (right).
Figure 3 with 2 supplements
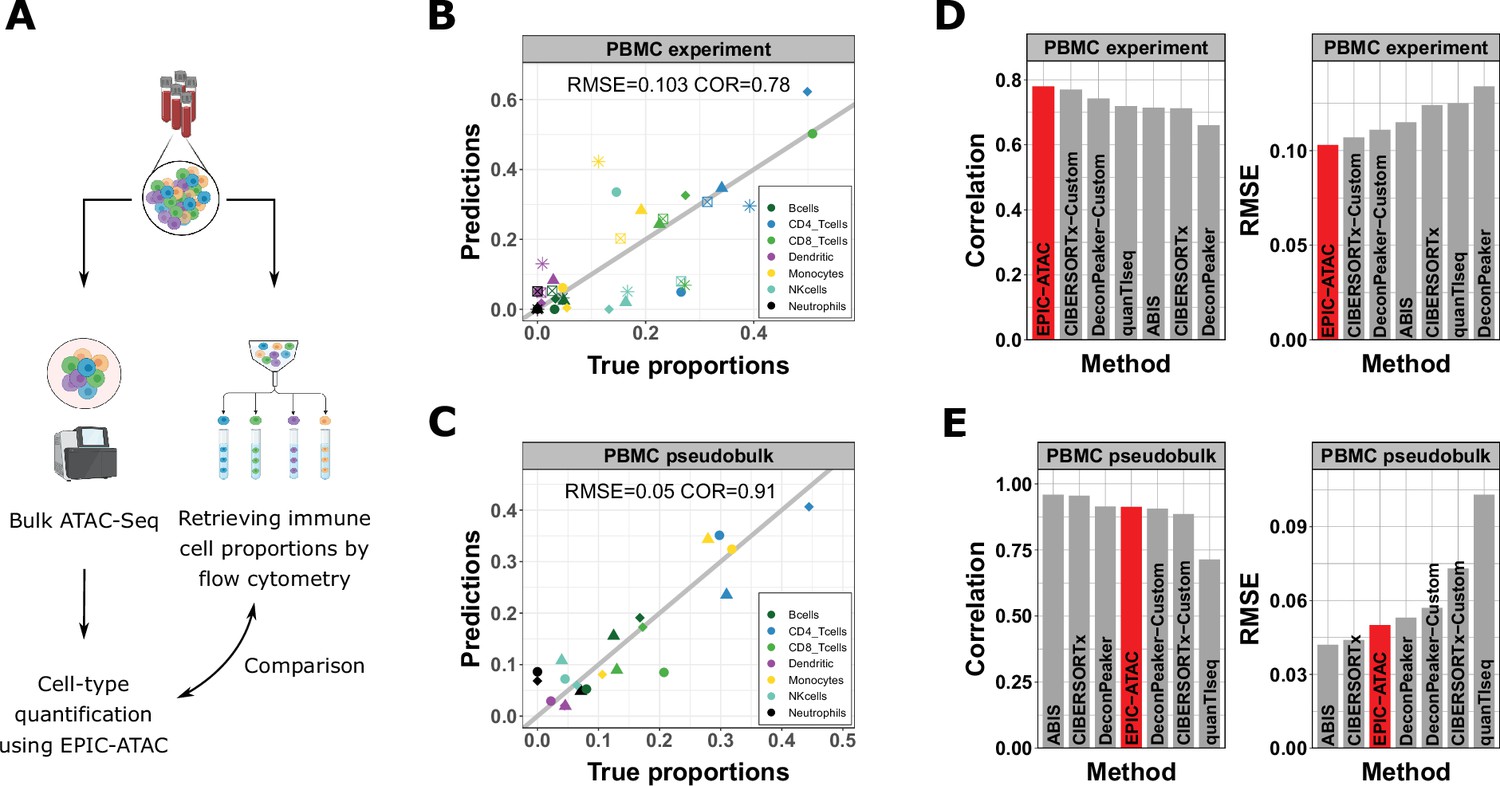
EPIC-ATAC accurately estimates immune cell fractions in PBMC ATAC-Seq samples.
(A) Schematic description of the experiment designed to validate the ATAC-Seq deconvolution on PBMC samples. Created with BioRender.com. (B) Comparison between cell-type proportions predicted by EPIC-ATAC and the true proportions in the PBMC bulk dataset. Symbols correspond to donors. (C) Comparison between the proportions of cell types predicted by EPIC-ATAC and the true proportions in the PBMC pseudobulk dataset. Symbols correspond to pseudobulks. (D) Pearson correlation (left) and RMSE (right) values obtained by each deconvolution tool on the PBMC bulk dataset. The EPIC-ATAC results are highlighted in red. (E) Pearson correlation (left) and RMSE (right) values obtained by each deconvolution tool on the PBMC pseudobulk dataset.
Figure 3—figure supplement 1
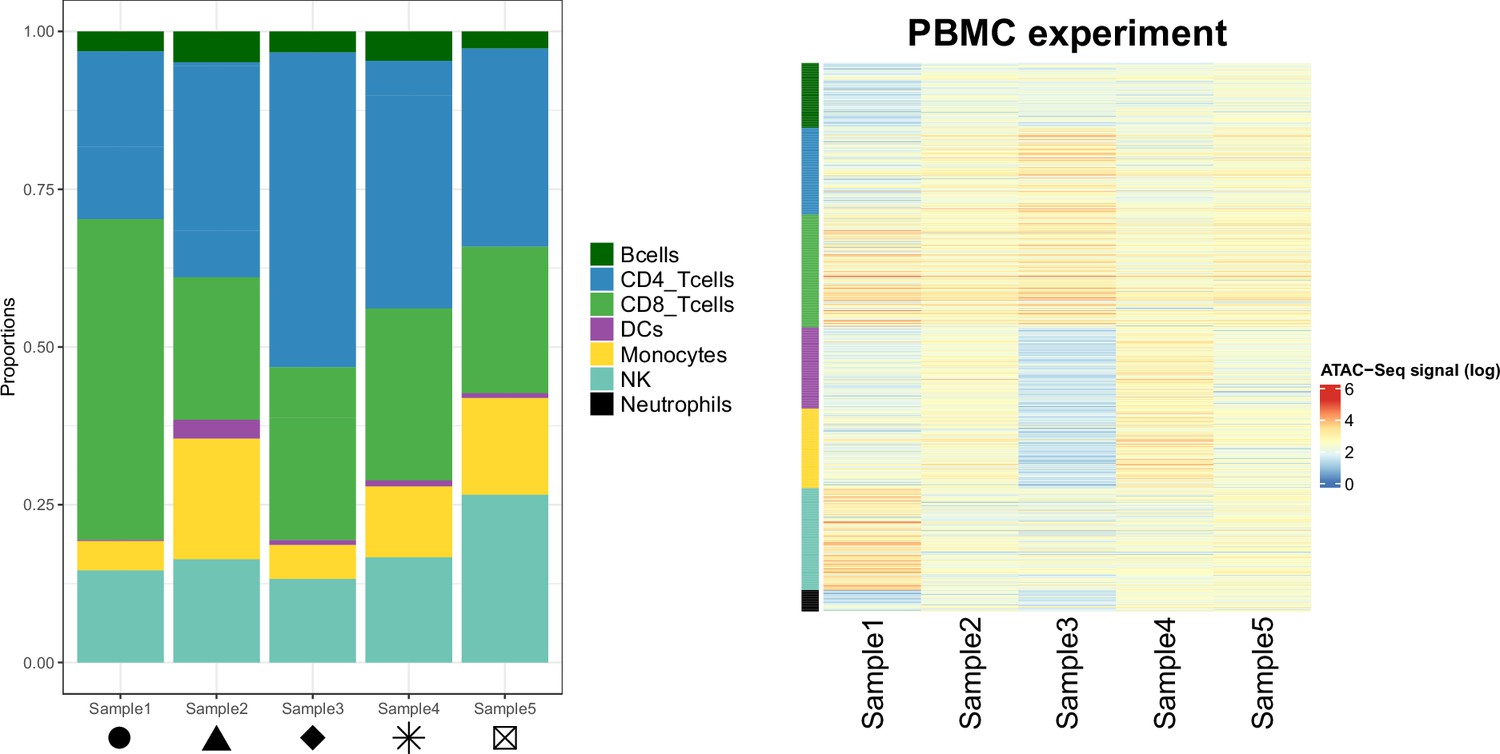
Cellular composition of the samples from the PBMC experiment.
Left panel: Proportions of each cell type in the PBMC experiment samples. Shapes match the points shapes from Figure 3B in the main text. Right panel: Chromatin accessibility signal (log scale) of the cell-type specific marker peaks (rows) in each sample (columns) of the PBMC experiment dataset.
Figure 3—figure supplement 2
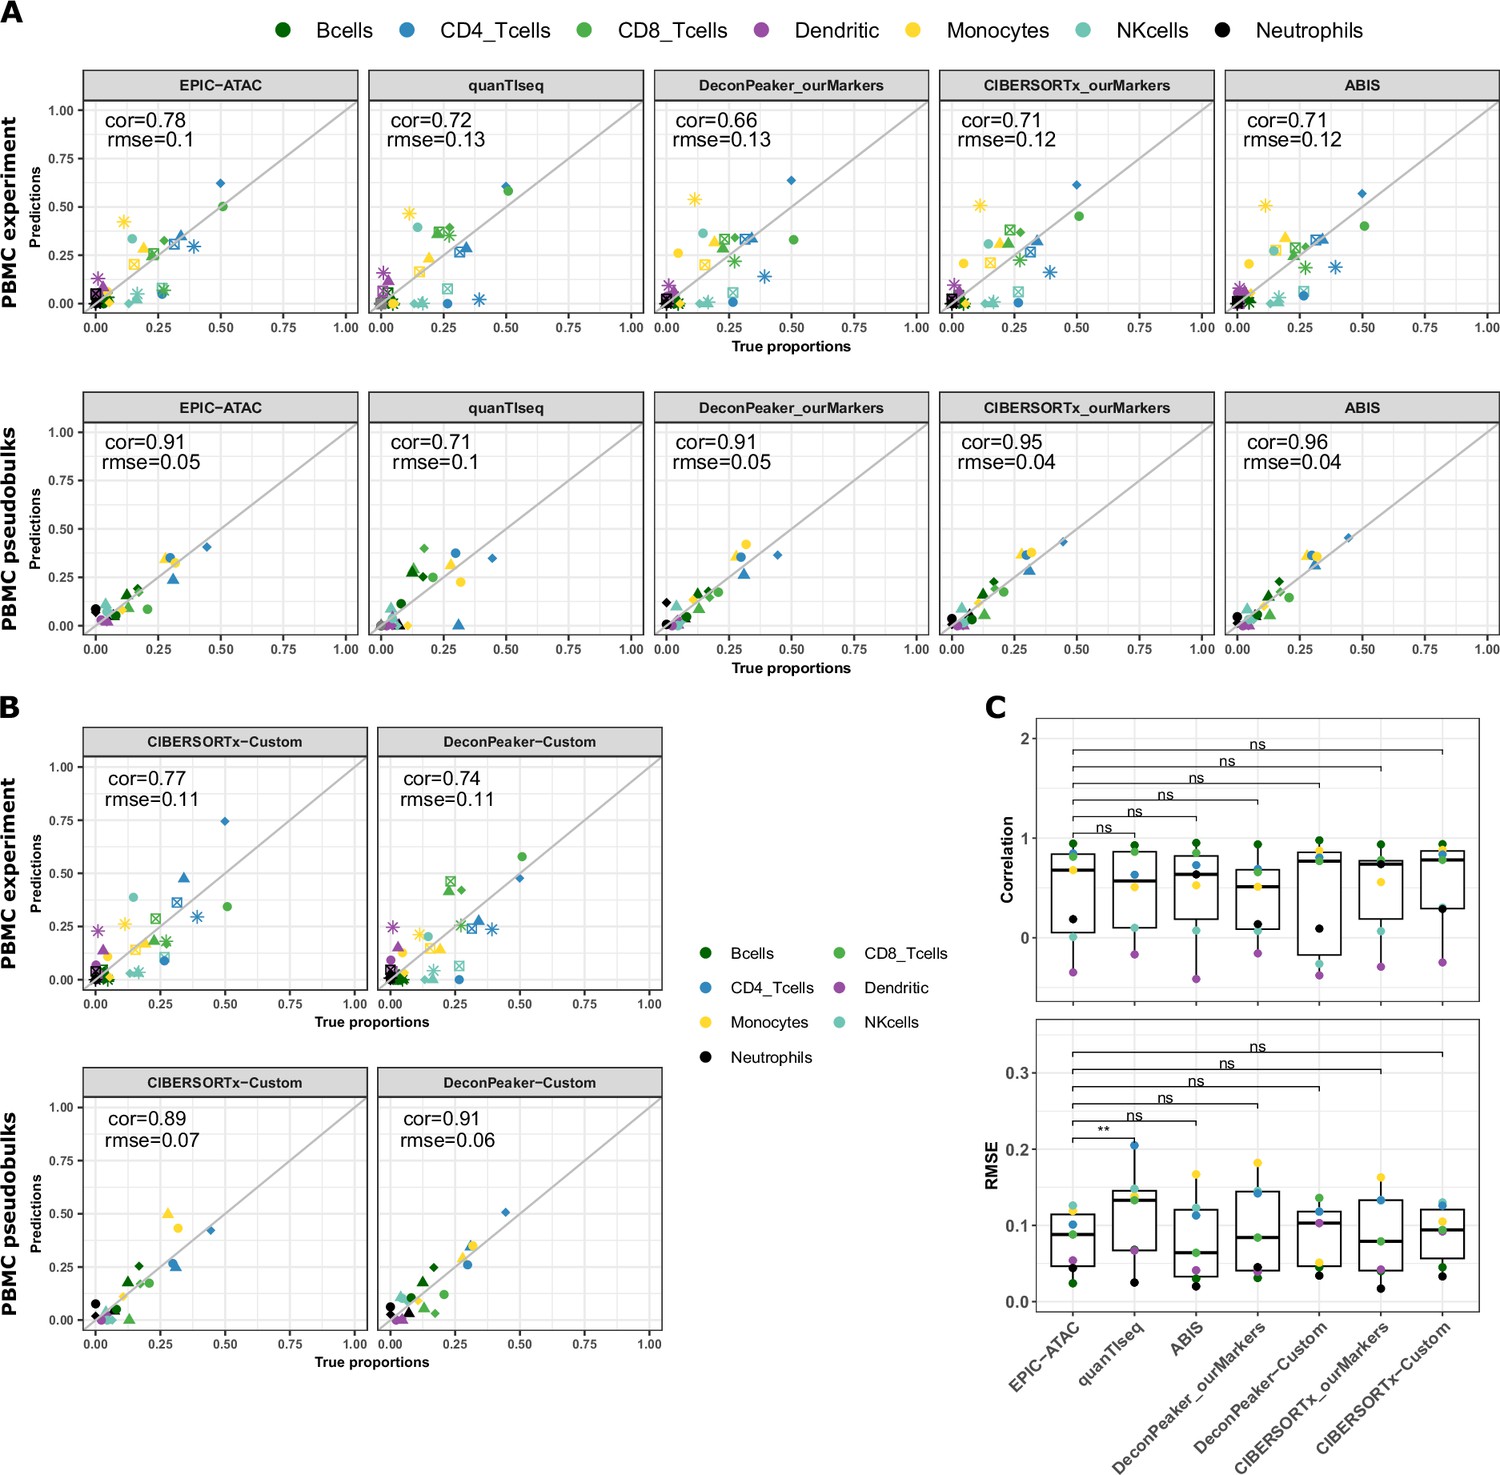
Cell-type proportions estimated by different deconvolution methods on the PBMC datasets.
(A) Comparison of the cell-type proportions estimated by the different deconvolution methods included in the benchmark (y-axis) and the true proportions (x-axis) in the PBMC experiment samples (top panel) and in the PBMC pseudobulk samples (bottom panel). (B) Comparison of the cell-type proportions estimated by CIBERSORTx and DeconPeaker using reference profiles built by each tool using our collection of pure ATAC-Seq samples and the true proportions in the PBMC experiment samples (top panel) and in the PBMC pseudobulk samples (bottom panel). (C) Pearson’s correlation coefficient and RMSE values associated with the comparison of the cell-type proportions estimated by each deconvolution tool in each cell type of the PBMC datasets, colors correspond to cell types. Note that for quanTIseq, gray dots correspond to uncharacterized cells since the prediction of an uncharacterized cell type cannot be turned off using the quanTIseq function from the quantiseqr R package. p-values resulting from a paired Wilcoxon test are represented for each pair of comparison between tools. Significance levels are represented as follows: *: p<0.05, **: p<0.01, ***: p<0.001.
Figure 4 with 5 supplements
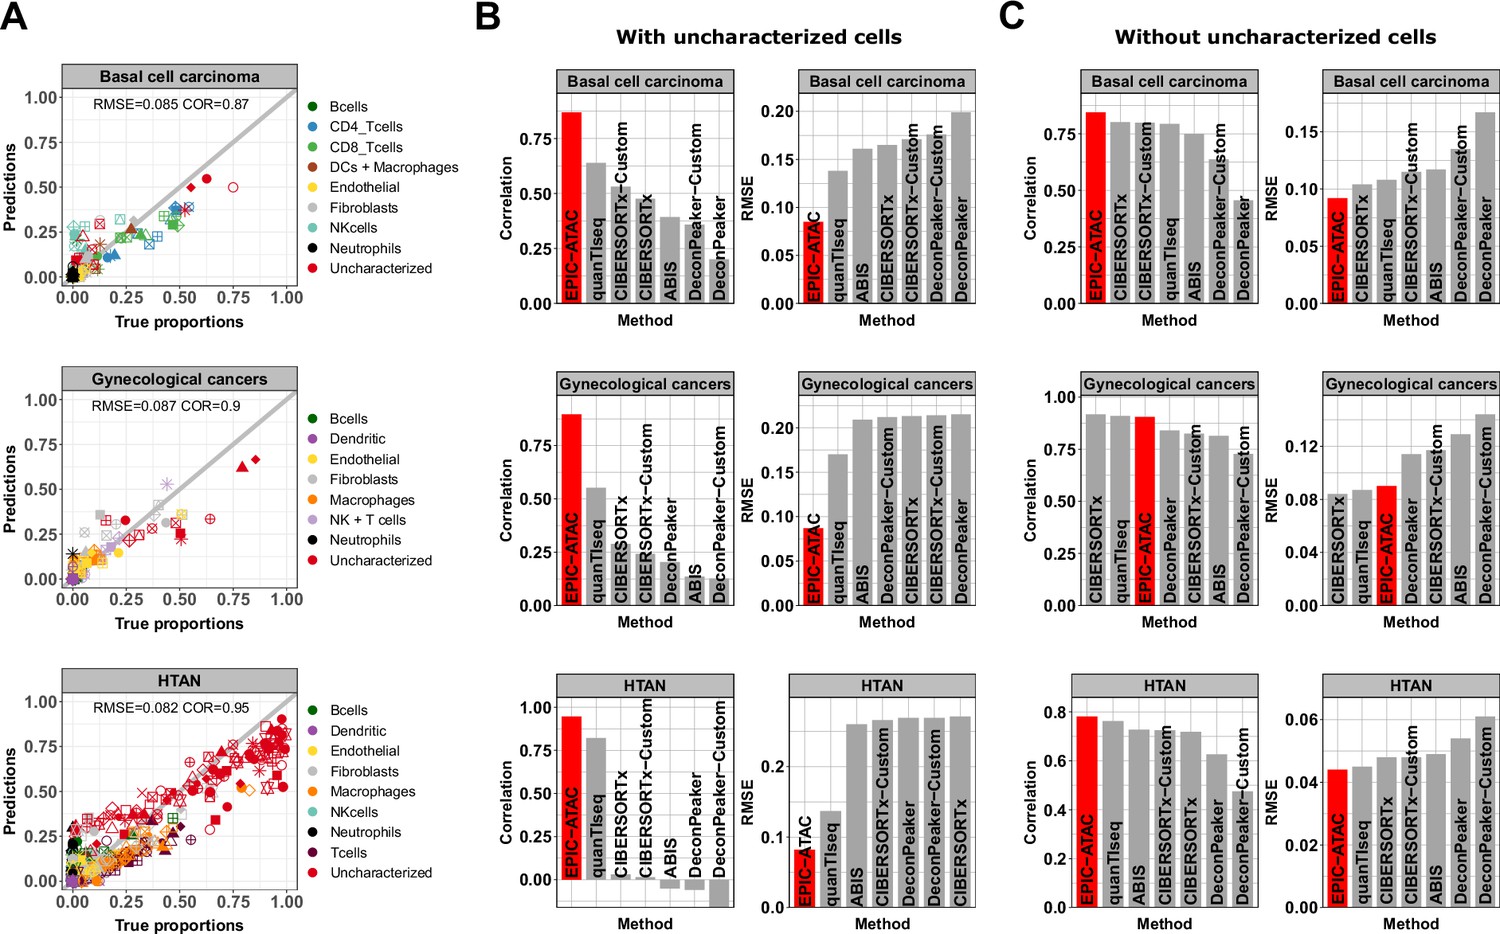
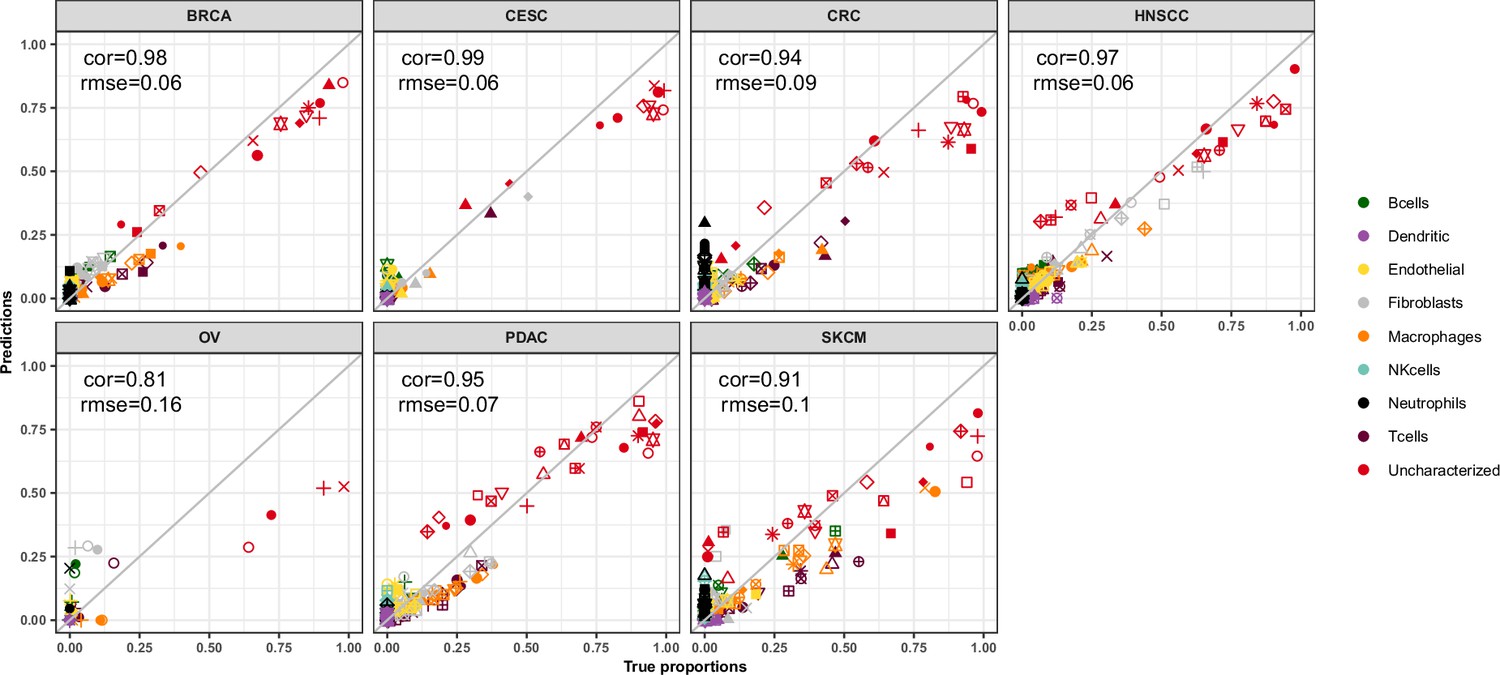
EPIC-ATAC accurately predicts fractions of cancer and non-malignant cells in tumor samples.
(A) Comparison between cell-type proportions estimated by EPIC-ATAC and true proportions for the basal cell carcinoma (top), gynecological (middle) and HTAN (bottom) pseudobulk datasets. Symbols correspond to pseudobulks. (B) Pearson’s correlation and RMSE values obtained for the deconvolution tools included in the benchmark. EPIC-ATAC is highlighted in red. (C) Same analyses as in panel B, with the uncharacterized cell population excluded for the evaluation of the prediction accuracy. The predicted and true proportions of the immune, stromal and vascular cell types were rescaled to sum to 1.
Figure 4—figure supplement 1
EPIC-ATAC estimations across different cancer types in the HTAN data.
Comparison of the cell-type proportions estimated by EPIC-ATAC (y-axis) and the true proportions (x-axis) in the HTAN dataset.
Figure 4—figure supplement 2
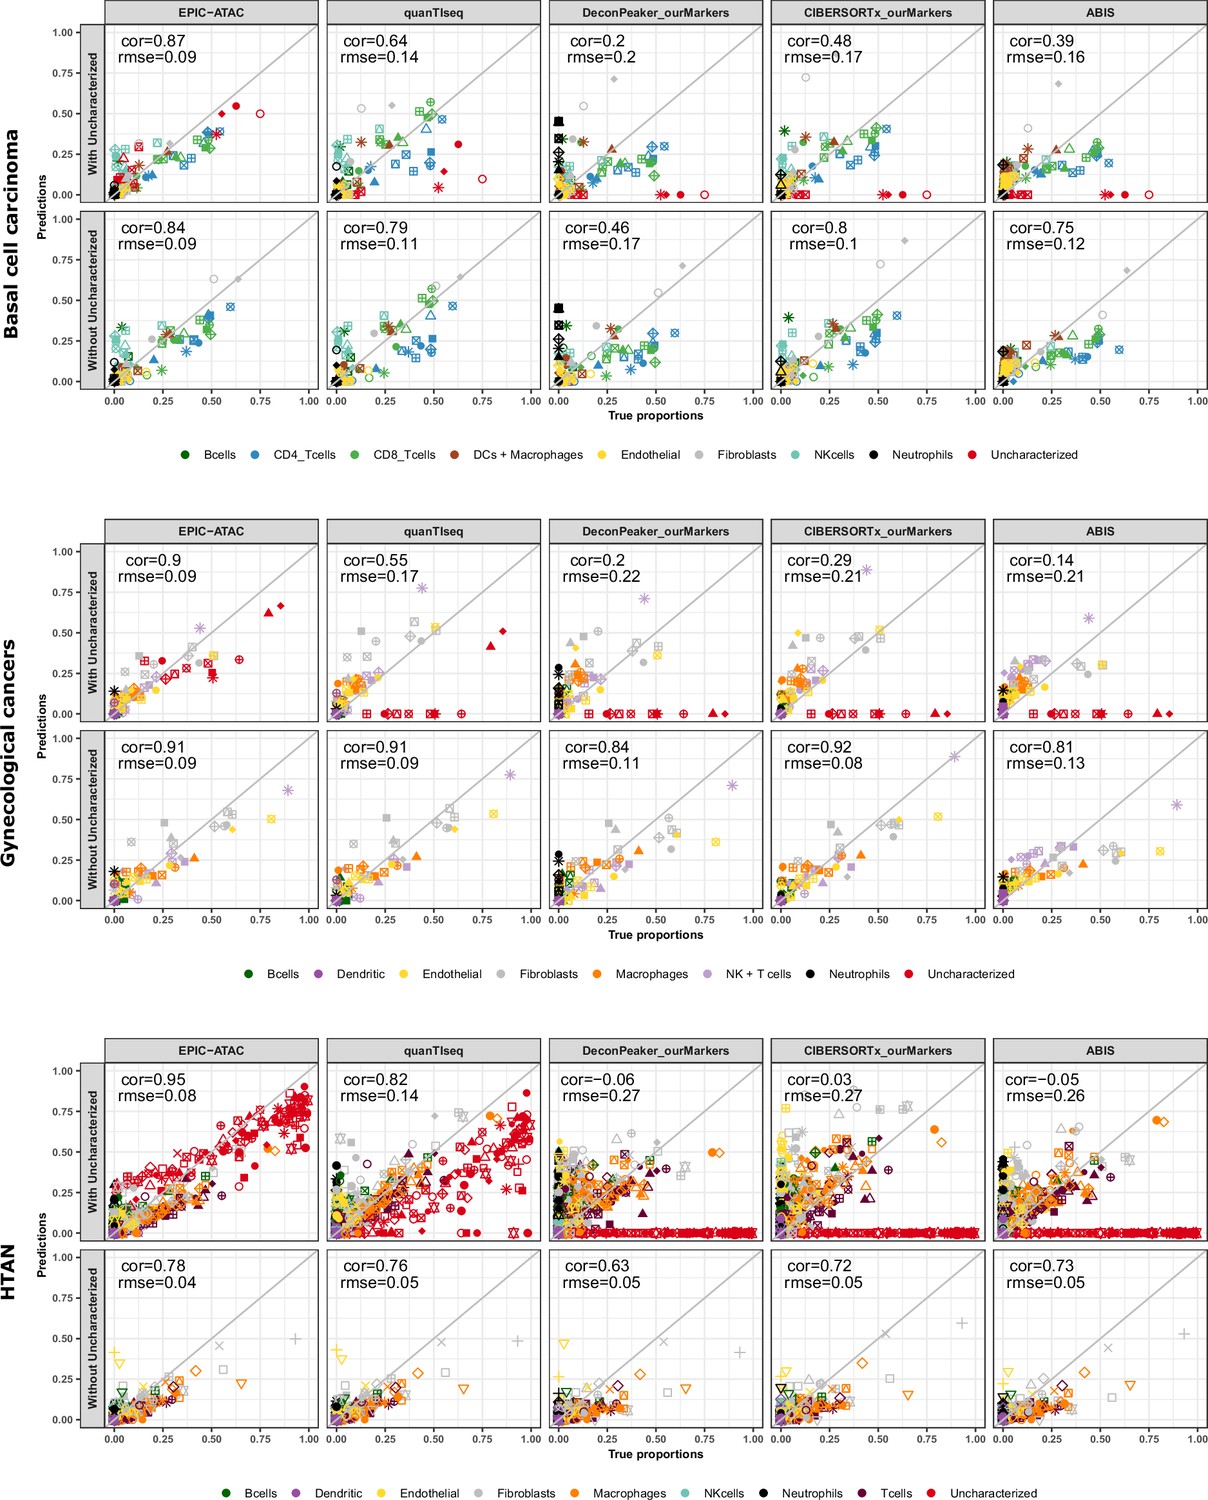
Cell-type proportions estimated by different deconvolution methods on the tumor samples.
Comparison of the cell-type proportions estimated by the different deconvolution methods using our reference profiles and the true proportions in the basal cell carcinoma samples (top panel), in the gynecological cancer samples (middle panel) and in the HTAN samples (bottom panel). In each panel, the top row includes the uncharacterized cells while the bottom row excludes them.
Figure 4—figure supplement 3
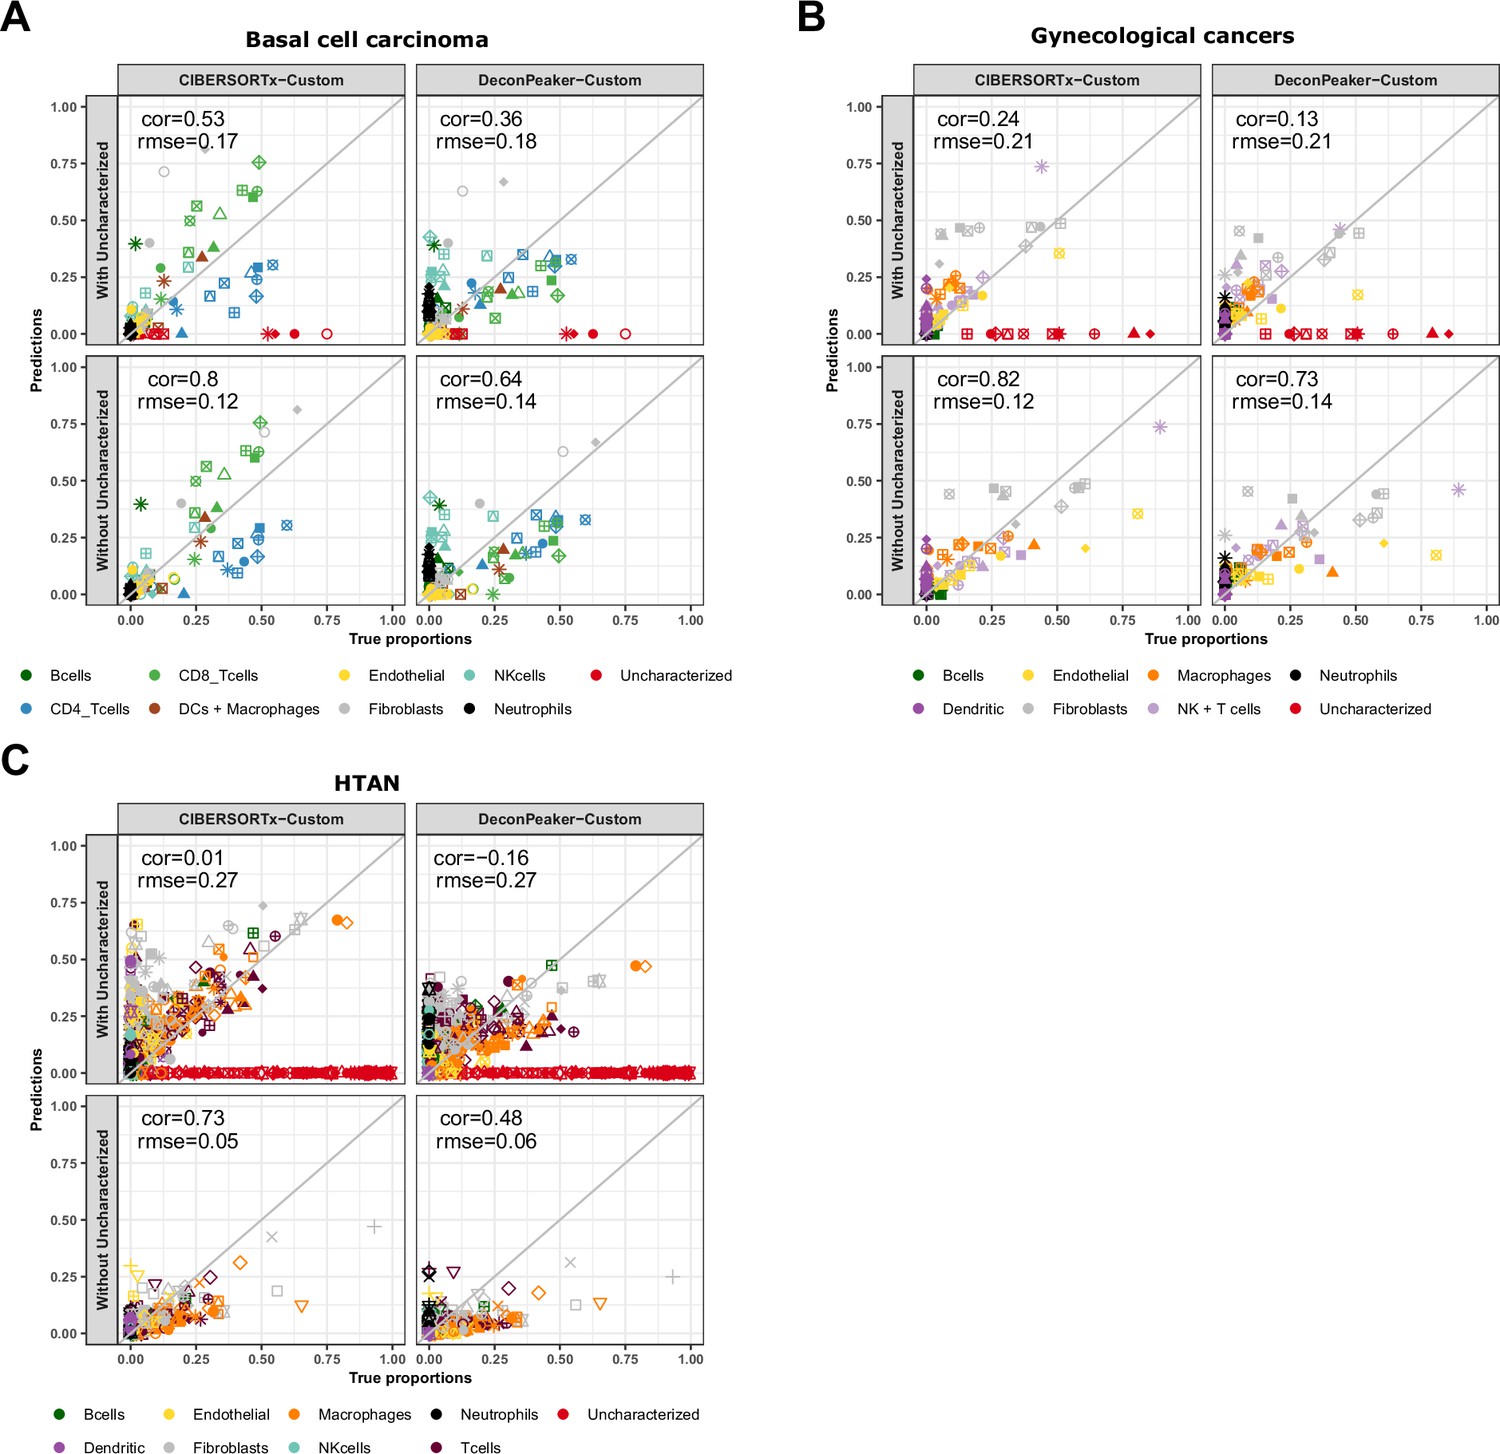
Cell-type proportions estimated by CIBERSORTx and DeconPeaker in tumor samples, using reference profiles built from our collection of pure ATAC-Seq samples.
Comparison of the cell-type proportions estimated by CIBERSORTx and DeconPeaker using reference profiles built by each tool using our collection of pure ATAC-Seq samples and the true proportions in the basal cell carcinoma samples (A), in the gynecological cancer samples (B) and in the HTAN samples (C) In each panel, the top row includes the uncharacterized cells while the bottom row excludes them.
Figure 4—figure supplement 4
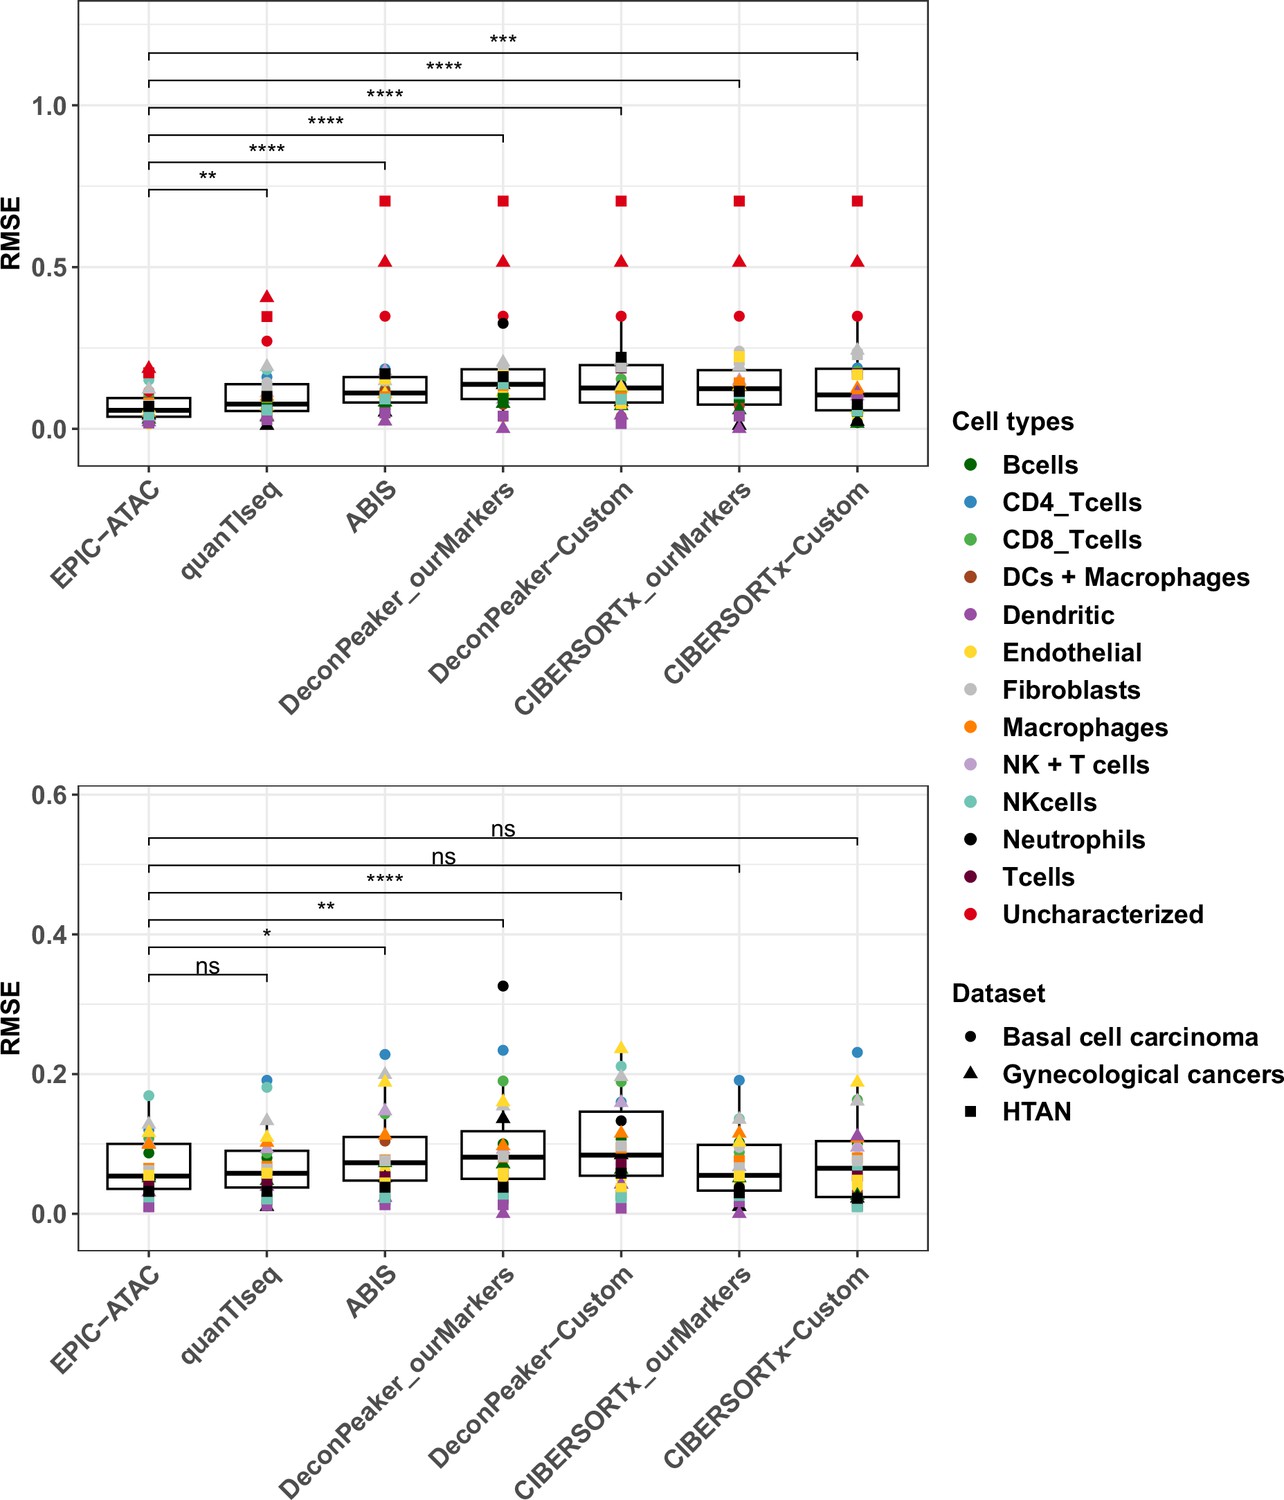
RMSE values for cell-type predictions obtained by each tool on the tumor samples.
Top panel: RMSE values associated to the comparison of the true proportions and the cell-type proportions estimated by each deconvolution tool in each cell type. For each cell type, all samples from each cancer pseudobulk dataset were considered, that is colors correspond to cell types and shapes to datasets. p-values resulting from a paired Wilcoxon test are represented for each pair of comparisons between tools. Significance levels are represented as follows: *: p<0.05, **: p<0.01, ***: p<0.001. Bottom panel: Considering that not all deconvolution tools are able to predict the proportion of uncharacterized cells, the same analysis as in the top panel was performed without considering the uncharacterized cells predictions.
Figure 4—figure supplement 5
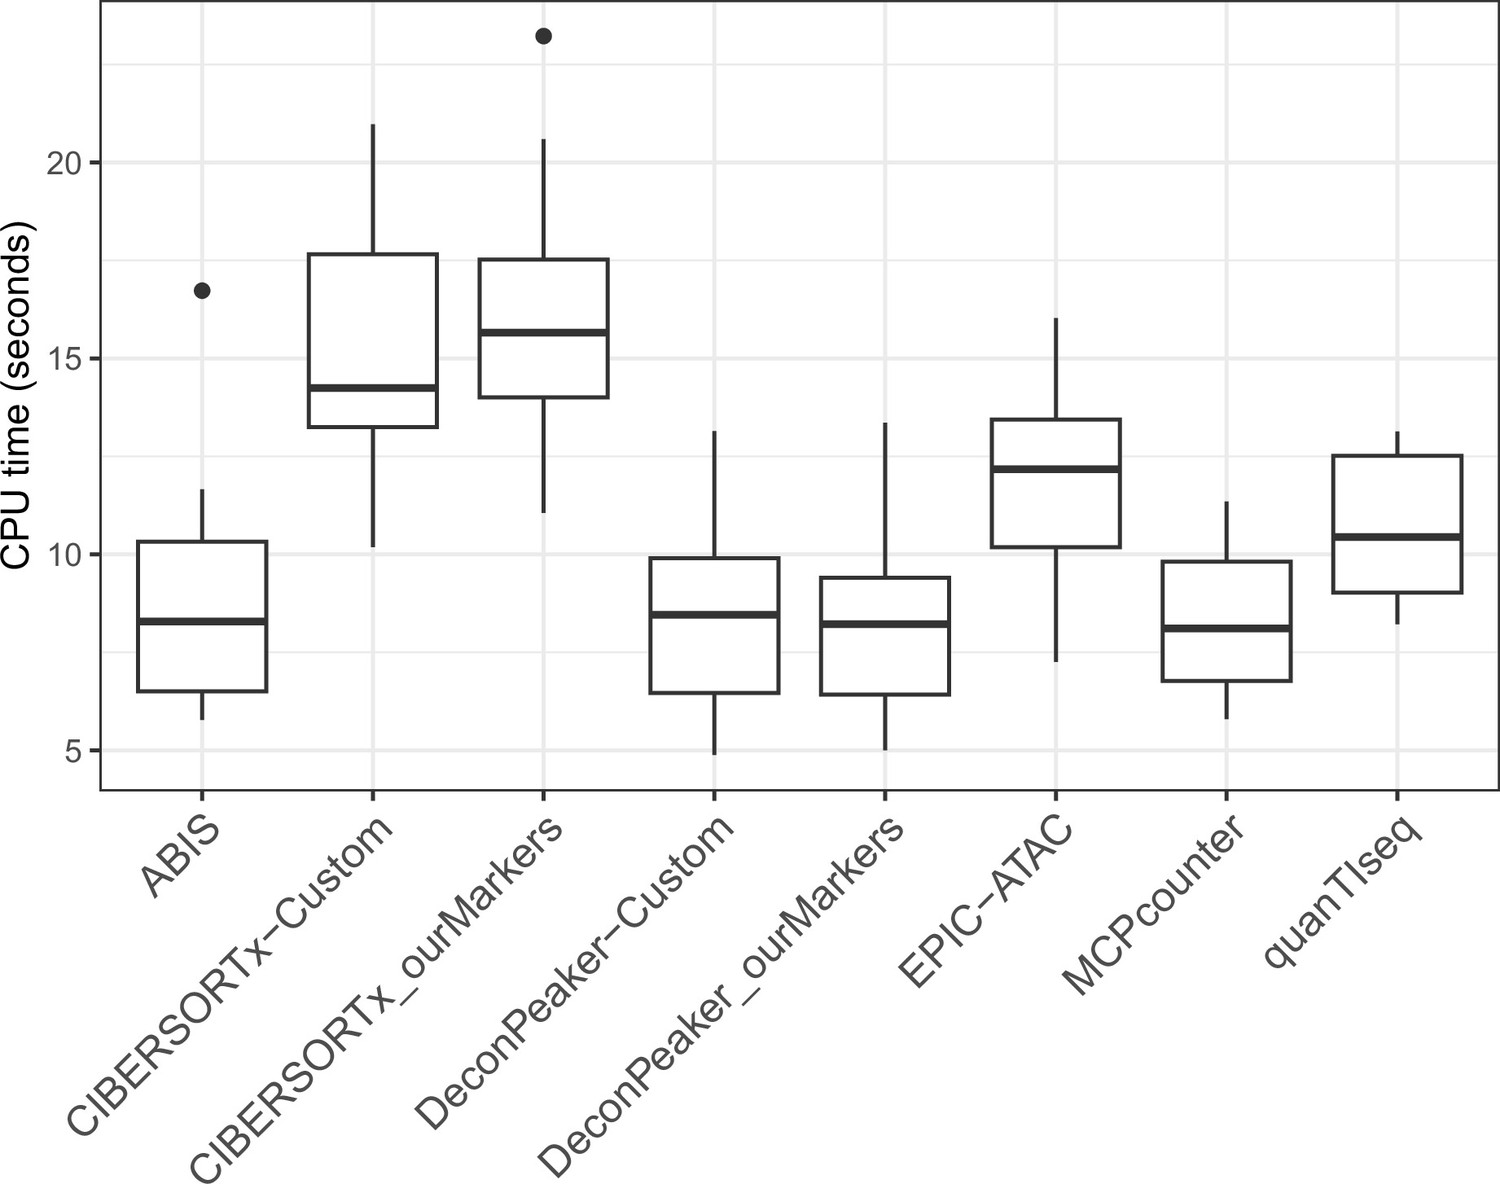
CPU time in seconds needed to run each tool on the benchmarking datasets.
Figure 5 with 4 supplements
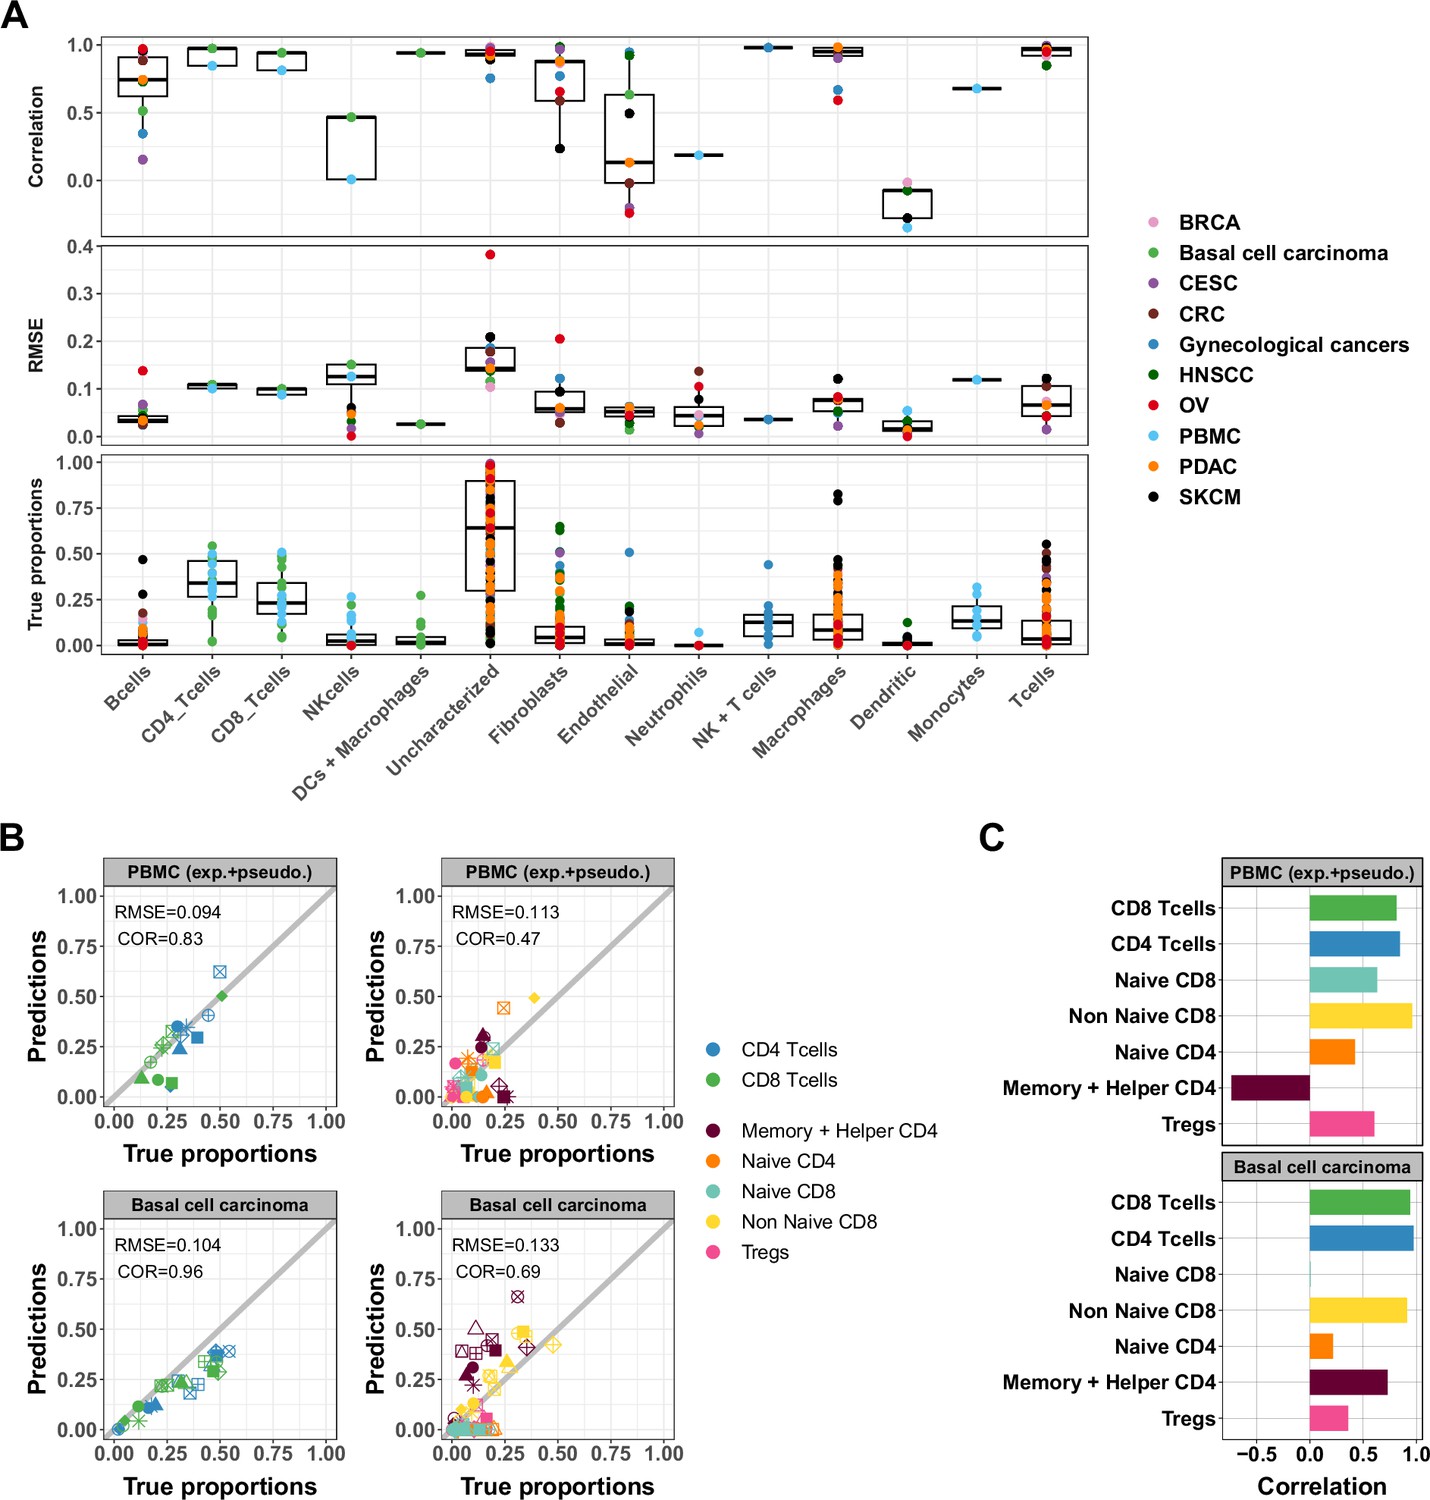
Accuracy of ATAC-Seq deconvolution is determined by the abundance and specificity of each cell type.
(A) Correlations (top) and RMSE (middle) between EPIC-ATAC predictions and true cell-type proportions in each cell type. True proportions are also shown for each cell type (bottom). Colors correspond to different datasets. (B) Comparison of the proportions estimated by EPIC-ATAC and the true proportions for PBMC samples (PBMC experiment and PBMC pseudobulk samples combined) (top) and the basal cell carcinoma pseudobulks (bottom). Predictions of the proportions of CD4+ and CD8+ T cells were obtained using the reference profiles based on the major cell types, and subtypes predictions using the reference profiles including the T-cell subtypes. (C) Pearson’s correlation values obtained by EPIC-ATAC in each cell type.
Figure 5—figure supplement 1
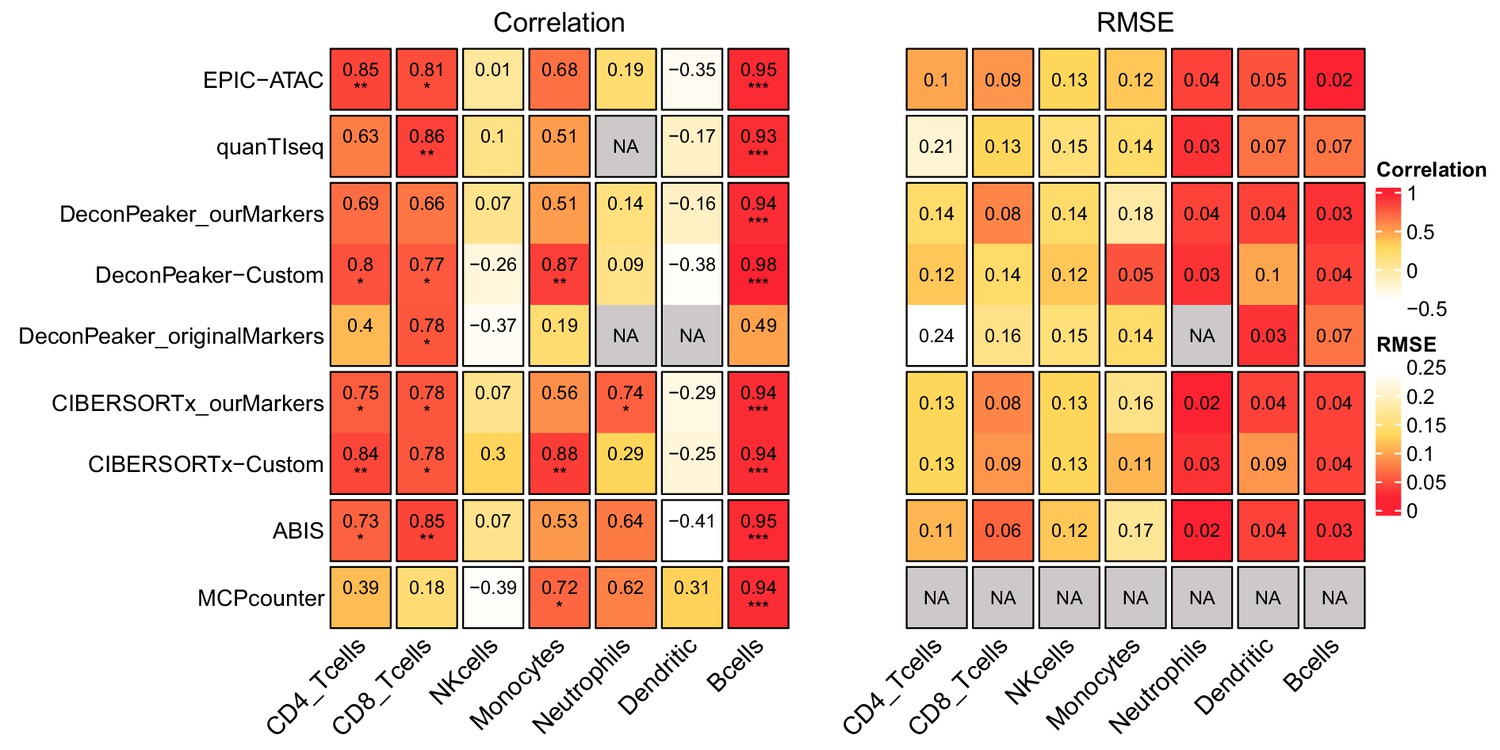
Pearson’s correlation and RMSE values for cell-type predictions obtained by each tool for each cell type in the PBMC samples.
Pearson’s correlation (left panel) and RMSE values (right panel) associated with the comparison of the cell-type proportions estimated by each deconvolution tool (rows) included in the benchmark and the true cell-type proportions in the PBMC samples. The comparisons were made in each cell type (columns) separately. Significance levels of the correlations are represented as follows: *: p<0.05, **: p<0.01, ***: p<0.001.
Figure 5—figure supplement 2
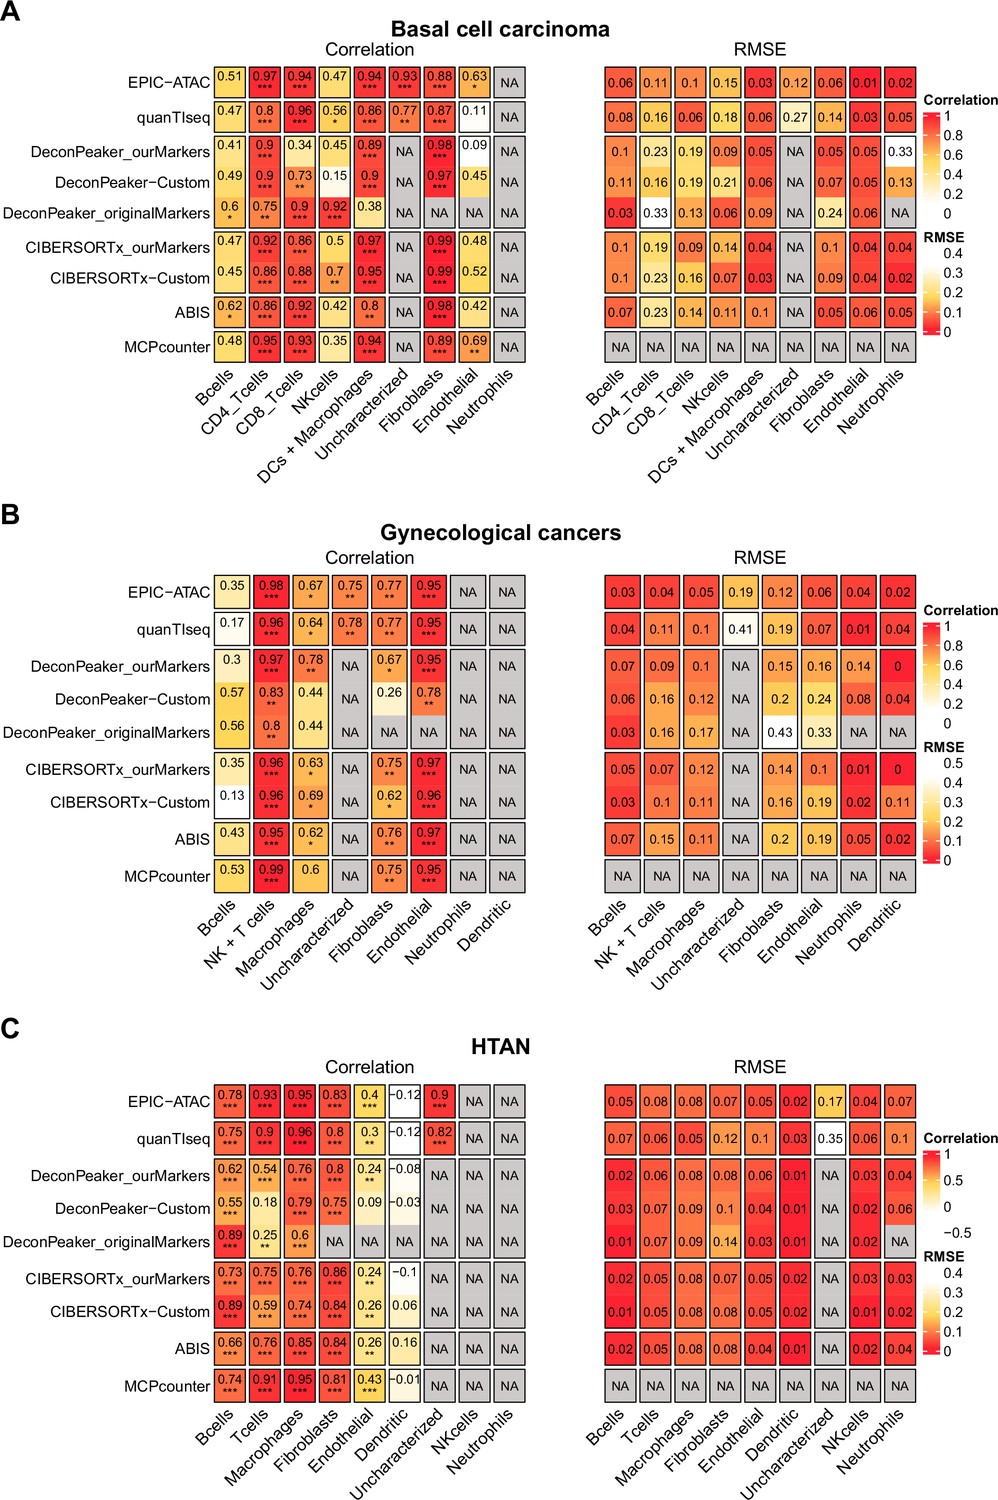
Pearson’s correlation and RMSE values for cell-type predictions obtained by each tool for each cell type in the tumor samples.
Pearson’s correlation (left panel) and RMSE values (right panel) associated with the comparison of the cell-type proportions estimated by each deconvolution tool (rows) included in the benchmark and the true cell-type proportions. The comparisons were made in each cell type (columns) separately. Panels A, B, and C are associated with the benchmarks performed on the basal cell carcinoma dataset (A), the gynecological cancer dataset (B) and the HTAN dataset (C). Significance levels of the correlations are represented as follows: *: p<0.05, **: p<0.01, ***: p<0.001.
Figure 5—figure supplement 3
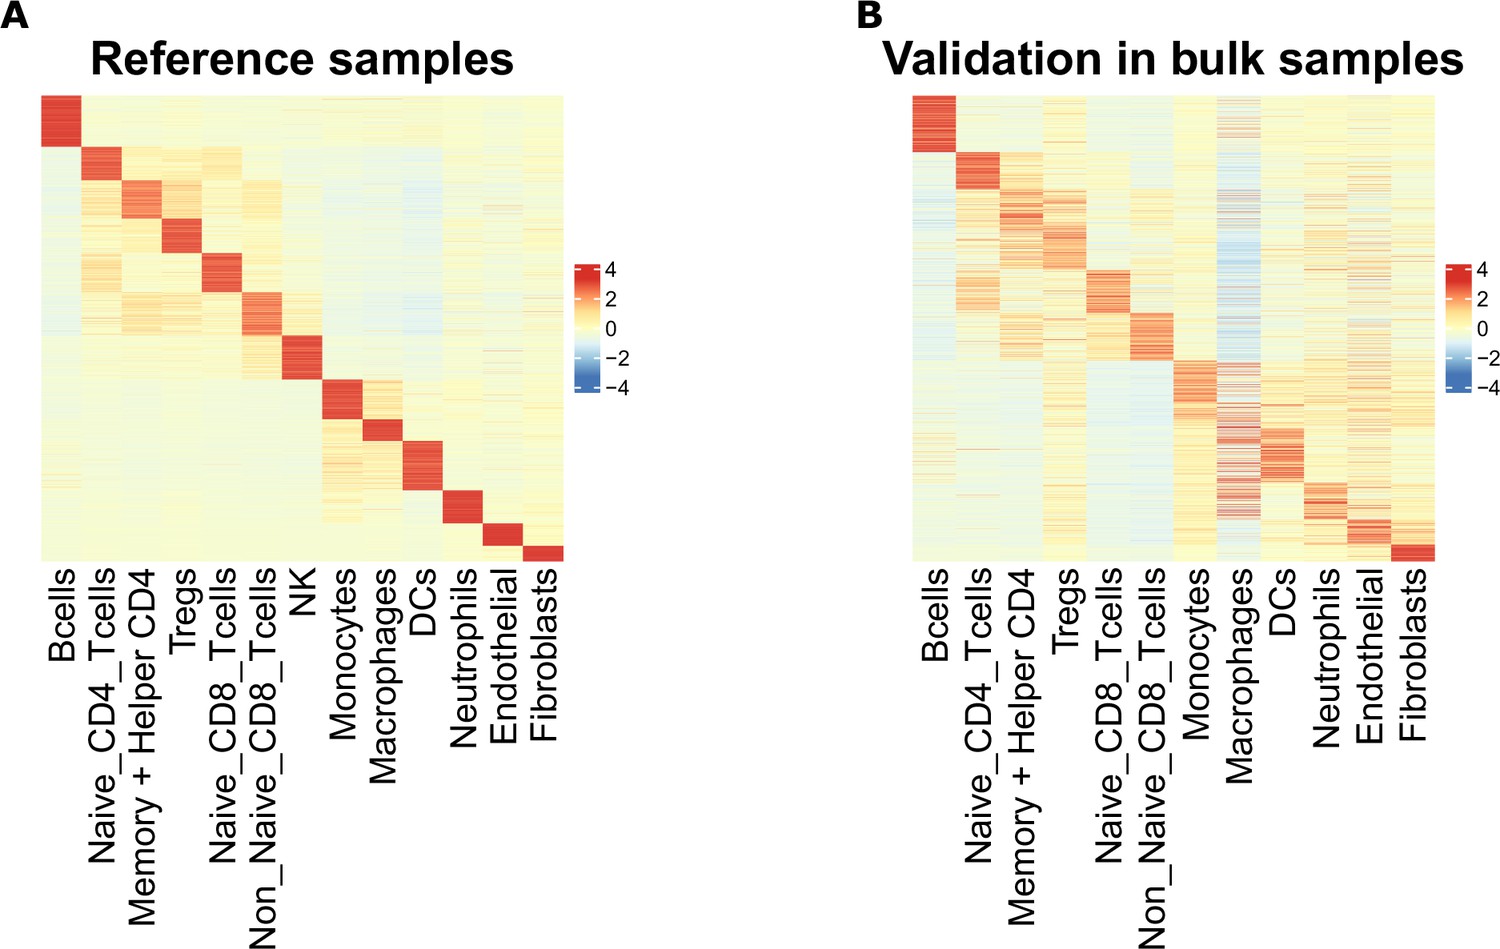
Scaled average chromatin accessibility of each cell-type-specific marker peak, including T-cell subtype markers, in the reference and validation samples.
(A) Scaled averaged chromatin accessibility of each cell-type specific marker peak in each cell-type obtained based on the ATAC-Seq reference samples used to identify the marker peaks. (B) Scaled averaged chromatin accessibility of each cell-type specific marker peak in each cell-type from the sorted samples excluded from the reference samples (see Materials and methods).
Figure 5—figure supplement 4
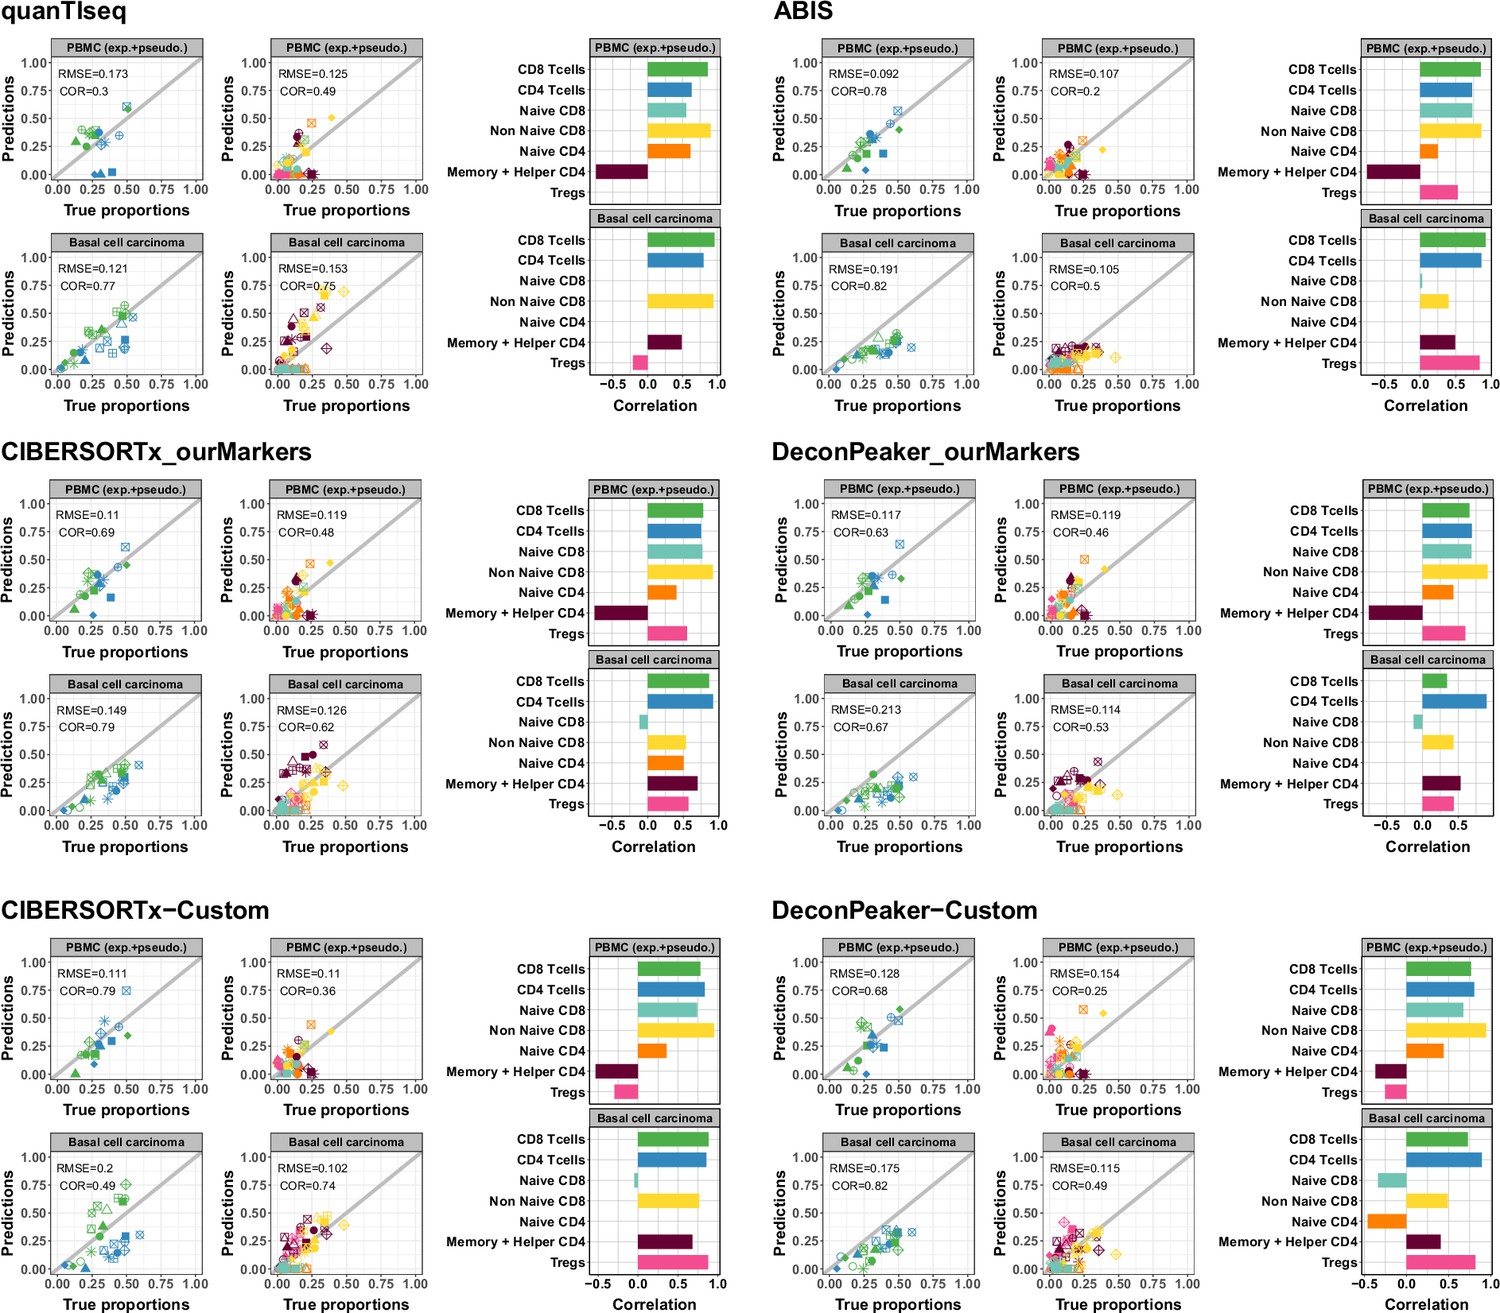
Predicted proportions of CD4+ and CD8+ T-cell subtypes using different deconvolution tools.
Left panels: Scatter plots representing proportions estimated by the different deconvolution tools included in the benchmark (y-axis) as a function of the true proportions (x-axis) for PBMC samples (top row) and the basal cell carcinoma pseudobulks (bottom row). CD4+ and CD8+ T cells predictions were obtained using the reference profiles based on the major cell types and the CD4+ and CD8+ T cell subtypes predictions using the reference profiles including the T-cells subtypes. Right panels: Barplots representing Pearson’s correlation values (x-axis) obtained based on the comparison of the predictions and true proportions in each cell type (y-axis).
Figure 6 with 1 supplement
EPIC-ATAC accurately infers the immune contexture in a bulk ATAC-Seq breast cancer cohort.
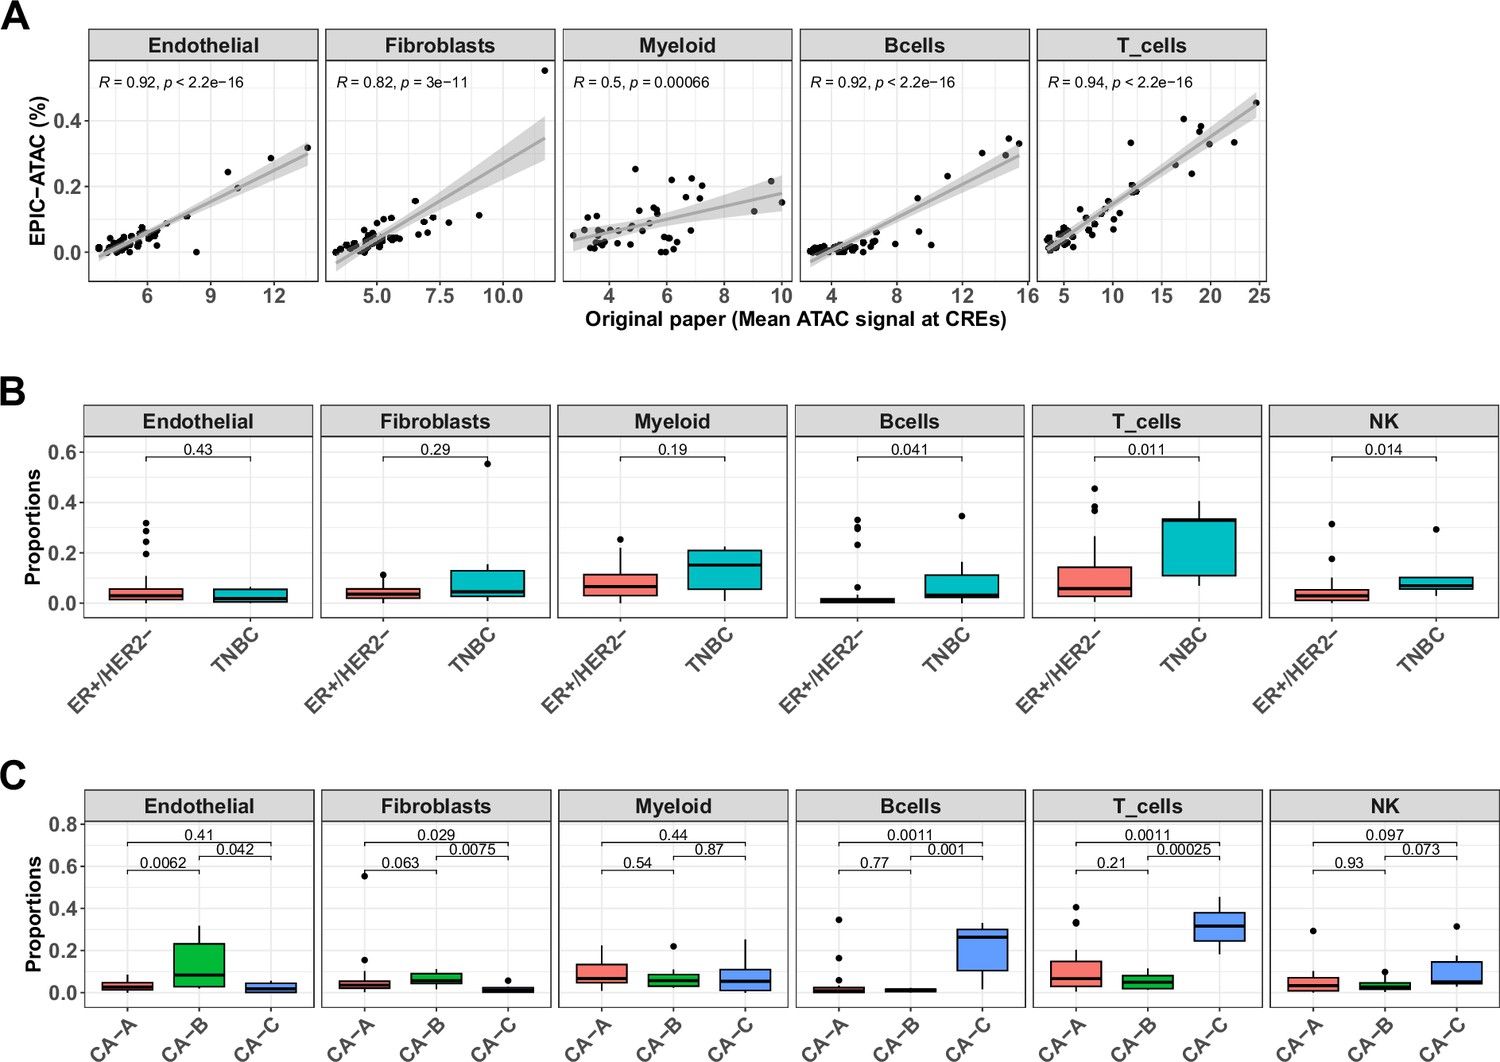
(A) Proportions of different cell types predicted by EPIC-ATAC in each sample as a function of the average ATAC signal at the cell-type specific CREs used by Kumegawa et al., 2023 to infer the level of cell-type infiltration in the tumor samples (42 samples). Pearson's correlation coefficients and linear regression lines were calculated for each cell type, 95% confidence intervals are represented by the shaded areas. (B) Proportions of different cell types predicted by EPIC-ATAC in the samples stratified based on two breast cancer subtypes. (C) Proportions of different cell types predicted by EPIC-ATAC in the samples stratified based on three ER+/HER2- subgroups. Wilcoxon test p-values are represented at the top of the boxplots.
Figure 6—figure supplement 1
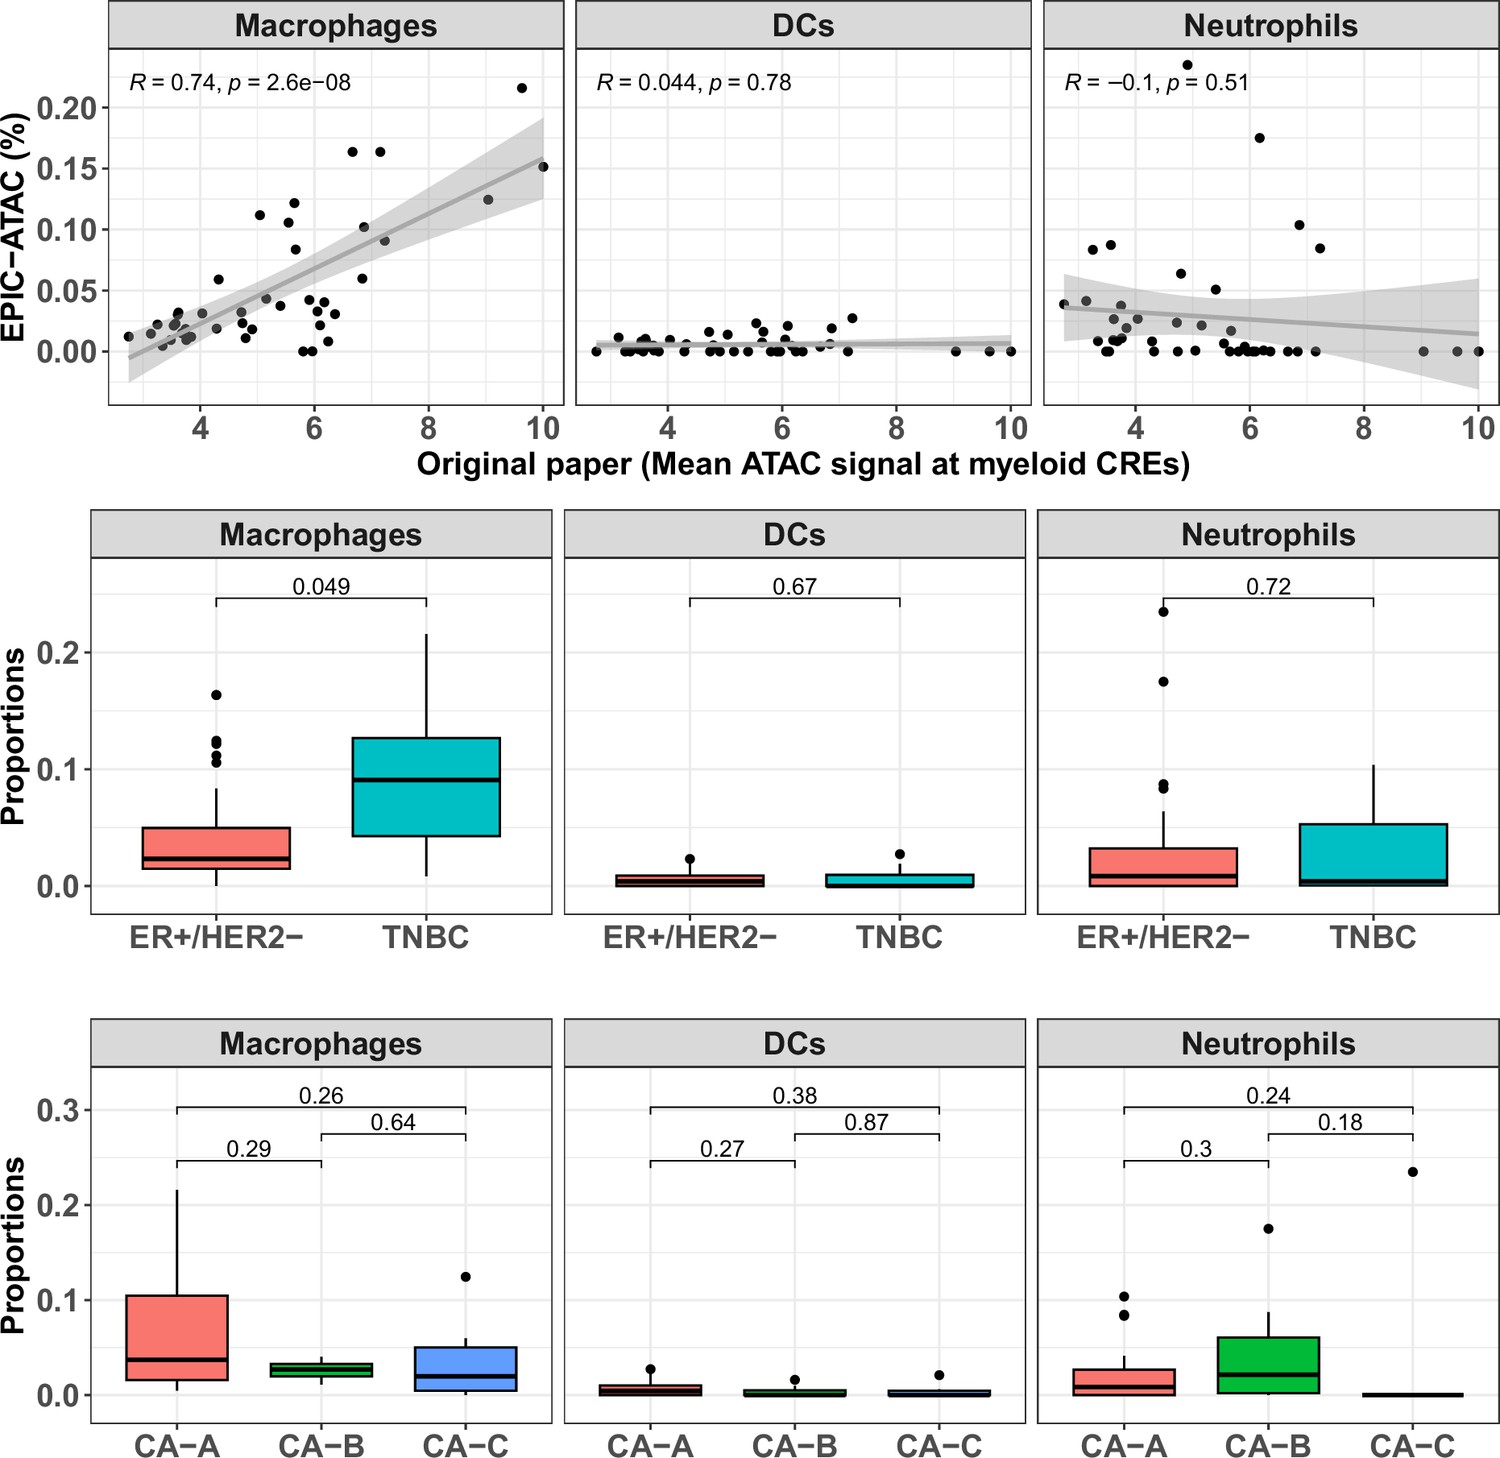
EPIC-ATAC predictions of the proportions of each myeloid cell type in breast cancer samples.
Top panel: Proportions of each myeloid cell type predicted by EPIC-ATAC. in each sample as a function of the average ATAC signal at the myeloid specific CREs used by Kumegawa and colleagues to infer the level of infiltration in the tumor samples (42 samples). Pearson's correlation coefficients and linear regression lines were calculated for each cell type, 95% confidence intervals are represented by the shaded areas. Middle panel: Proportions of different cell types predicted by EPIC-ATAC in the samples stratified based on two breast cancer subtypes. Bottom panel: Proportions of different cell types predicted by EPIC-ATAC in the samples stratified based on three ER+/HER2- subgroups. Wilcoxon test p-values are represented at the top of the boxplots.
Figure 7
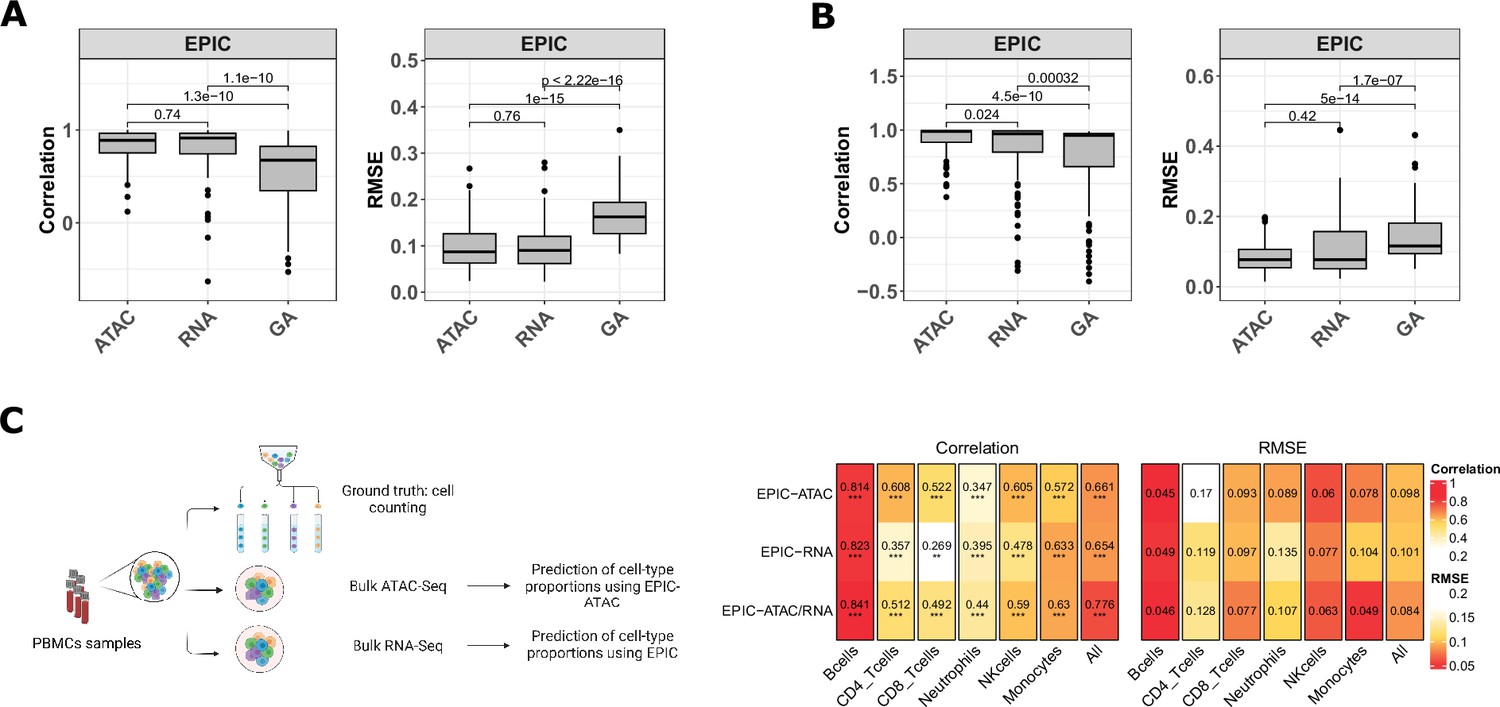
EPIC-ATAC and EPIC RNA-seq based deconvolution have similar accuracy and can complement each other.
(A–B) Pearson’s correlation (left) and RMSE (right) values comparing the proportions predicted by the ATAC-Seq deconvolution, the RNA-Seq deconvolution and the GA-based RNA deconvolution and true cell-type proportions in 100 pseudobulks simulated form the 10 x multiome PBMC dataset (10x Genomics, 2021) (panel A) and in the pseudobulks generated from the HTAN cohorts (panel B). Dots correspond to outlier pseudobulks. (C) Left panel: Schematic description of the dataset from Morandini et al., 2024 composed of matched bulk ATAC-Seq, RNA-Seq and flow cytometry data from PBMC samples. Created with BioRender.com. Right panel: Pearson’s correlation (left) and RMSE values (right) obtained by EPIC-ATAC, EPIC-RNA and EPIC-ATAC/RNA (i.e., averaged predictions of EPIC-ATAC and EPIC-RNA) in each cell type separately or all cell types together (columns).
Tables
Table 1
List of nearest genes and enriched CBPs reported in the PanglaoDB or CellMarker databases.
| Cell type | Nearest genes | Enriched CPBs |
|---|---|---|
| Bcells | DHTKD1 LHPP WDFY4 ARID5B HHEX SIDT2 CD82 MS4A1 FCHSD2 USP8 RHCG ATF7IP2 CIITA GGA2 SNX29P2 C16orf74 CBFA2T3 CD79B BCL2 GNG7 CD22 FCER2 FCRL1 LY9 PTPRC LAPTM5 IGLL5 VPREB3 CENPM AFF3 SP100 INPP5D DTNB CD86 RFTN1 ST6GAL1 NGLY1 OSBPL10 TLR9 CD38 SMIM14 ARHGAP24 ADAM19 EBF1 BASP1 CD83 PLEKHG1 CCR6 CCND3 HDAC9 CDCA7L BLK MTSS1 LYN PLEKHF2 MOB3B PAX5 | SPIB POU2F2 TCF4 EBF1 TCF3 NFKB1 STAT1 NFKB2 IKZF1 FOXO1 FOXP1 BCL6 POU2AF1 STAT3 BACH2 IKZF3 FLI1 TBX21 JUNB MITF NKX6-2 RBPJ |
| CD4_Tcells | IL2RA CD6 CD5 CD4 RORA PTPRC CTLA4 ICOS SLC9A9 FHIT TCF7 FYB1 ATXN1 CD40LG | TCF7 RUNX3 SOHLH2 IRF9 GATA3 TBX21 MAF RORA BATF CREM |
| CD8_Tcells | MKI67 JAML MAML2 KLRD1 NELL2 LAG3 PPP1R13B PTPRC LYST CASP8 CD8A CD8B CD96 BTLA GZMA THEMIS ETV1 | ETV1 FOXP3 TBX21 FOXP1 EOMES CREM IRF4 ZEB1 ARNT JUNB TCF7 |
| NK | PRF1 ZBTB16 KLRD1 SPN CD226 SH2D1B CD247 IL2RB CXCR4 NMUR1 GNLY ZAP70 TXK | EOMES TBX21 NFIL3 FOS JUN |
| DCs | C12orf75 LYZ APP CD8A RIOX2 NFKB1 QDPR ABCG2 PRELID2 DST CD36 IDO2 PCMTD1 | SPIB IRF8 MYB NR4A1 REL CUX2 FOXO1 ETV6 IRF5 BATF3 RUNX2 |
| Neutrophils | TLE3 CA4 CYP4F3 CEACAM8 PGLYRP1 FPR1 CTSS ALPL PI3 MMP9 CXCR1 DRC1 ASPRV1 LTF MGAM SLC25A37 | FOS |
| Monocytes | VENTX GLT1D1 CLEC4E CARS2 SLC24A4 C16orf74 FFAR2 STXBP2 NLRP3 CYRIA CMTM7 TGFBI DIAPH1 VCAN MCTP1 IFNGR1 STX11 CAPZA2 CD36 MTSS1 DENND3 ASAH1 TNFRSF10B BNIP3L NACC2 MAMDC2 FBP1 | CEBPA CEBPD CEBPB CEBPE SPI1 VENTX JUND RXRA TCF7L2 |
| Macrophages | CXCL12 PSAP P2RY6 SLCO2B1 CMKLR1 MMP19 LGMN CLEC10A C5AR1 FPR3 LILRB4 RGL1 SIGLEC1 MMP9 CD80 | STAT1 SPI1 FOSL2 FOS SPIC |
| Endothelial | FAM107B ROBO4 FLI1 ACVRL1 FLT1 DOCK9 ABCC1 S1PR1 ELOVL1 PLPP3 ASAP2 SNRK ECSCR ARAP3 LAMA4 BMP6 SERPINE1 LAMB1 DOCK4 NOS3 | ETV2 ELF1 FLI1 ELK3 FOSB ETS1 ERG GATA2 ZEB1 ETS2 FOXC1 SOX18 |
| Fibroblasts | LOX CAV1 COL15A1 | FOSL2 FOSB EGR1 FLI1 HIF1A PBX1 |
Additional files
-
Supplementary file 1
Metadata of the ATAC-Seq samples used in the study.
- https://cdn.elifesciences.org/articles/94833/elife-94833-supp1-v1.xlsx
-
Supplementary file 2
Averaged chromatin accessibility of the PBMC marker peaks in each cell type.
- https://cdn.elifesciences.org/articles/94833/elife-94833-supp2-v1.xlsx
-
Supplementary file 3
Averaged chromatin accessibility of the TME marker peaks in each cell type.
- https://cdn.elifesciences.org/articles/94833/elife-94833-supp3-v1.xlsx
-
Supplementary file 4
Annotations of the cell-type specific PBMC marker peaks.
- https://cdn.elifesciences.org/articles/94833/elife-94833-supp4-v1.xlsx
-
Supplementary file 5
Annotations of the cell-type specific TME marker peaks.
- https://cdn.elifesciences.org/articles/94833/elife-94833-supp5-v1.xlsx
-
Supplementary file 6
GO pathways enriched in each set of cell-type specific PBMC marker peaks.
- https://cdn.elifesciences.org/articles/94833/elife-94833-supp6-v1.xlsx
-
Supplementary file 7
GO pathways enriched in each set of cell-type specific TME marker peaks.
- https://cdn.elifesciences.org/articles/94833/elife-94833-supp7-v1.xlsx
-
Supplementary file 8
Averaged chromatin accessibility of the PBMC marker peaks in each cell type (T cells subtypes included).
- https://cdn.elifesciences.org/articles/94833/elife-94833-supp8-v1.xlsx
-
Supplementary file 9
Averaged chromatin accessibility of the TME marker peaks in each cell type (T cells subtypes included).
- https://cdn.elifesciences.org/articles/94833/elife-94833-supp9-v1.xlsx
-
Supplementary file 10
Annotations of the cell-type specific PBMC marker peaks (T cells subtypes included).
- https://cdn.elifesciences.org/articles/94833/elife-94833-supp10-v1.xlsx
-
Supplementary file 11
Annotations of the cell-type specific TME marker peaks (T cells subtypes included).
- https://cdn.elifesciences.org/articles/94833/elife-94833-supp11-v1.xlsx
-
Supplementary file 12
GO pathways enriched in each set of cell-type specific PBMC marker peaks (T cell subtypes).
- https://cdn.elifesciences.org/articles/94833/elife-94833-supp12-v1.xlsx
-
Supplementary file 13
GO pathways enriched in each set of cell-type specific TME marker peaks (T cell subtypes).
- https://cdn.elifesciences.org/articles/94833/elife-94833-supp13-v1.xlsx
-
MDAR checklist
- https://cdn.elifesciences.org/articles/94833/elife-94833-mdarchecklist1-v1.pdf
Download links
A two-part list of links to download the article, or parts of the article, in various formats.
Downloads (link to download the article as PDF)
Open citations (links to open the citations from this article in various online reference manager services)
Cite this article (links to download the citations from this article in formats compatible with various reference manager tools)
Robust estimation of cancer and immune cell-type proportions from bulk tumor ATAC-Seq data
eLife 13:RP94833.
https://doi.org/10.7554/eLife.94833.4


