Protection afforded by post-infection SARS-CoV-2 vaccine doses: A cohort study in Shanghai
- Department of Epidemiology, School of Public Health, Fudan University, China
- Department of Comparative Biomedical Sciences, School of Veterinary Medicine, University of Surrey, United Kingdom
- Shanghai Pudong New Area Center for Disease Control and Prevention, China
- Key Laboratory of Public Health Safety of Ministry of Education, Fudan University, China
- School of Public Health, Shanghai Institute of Infectious Disease and Biosecurity, Fudan University, China
Figures
Figure 1
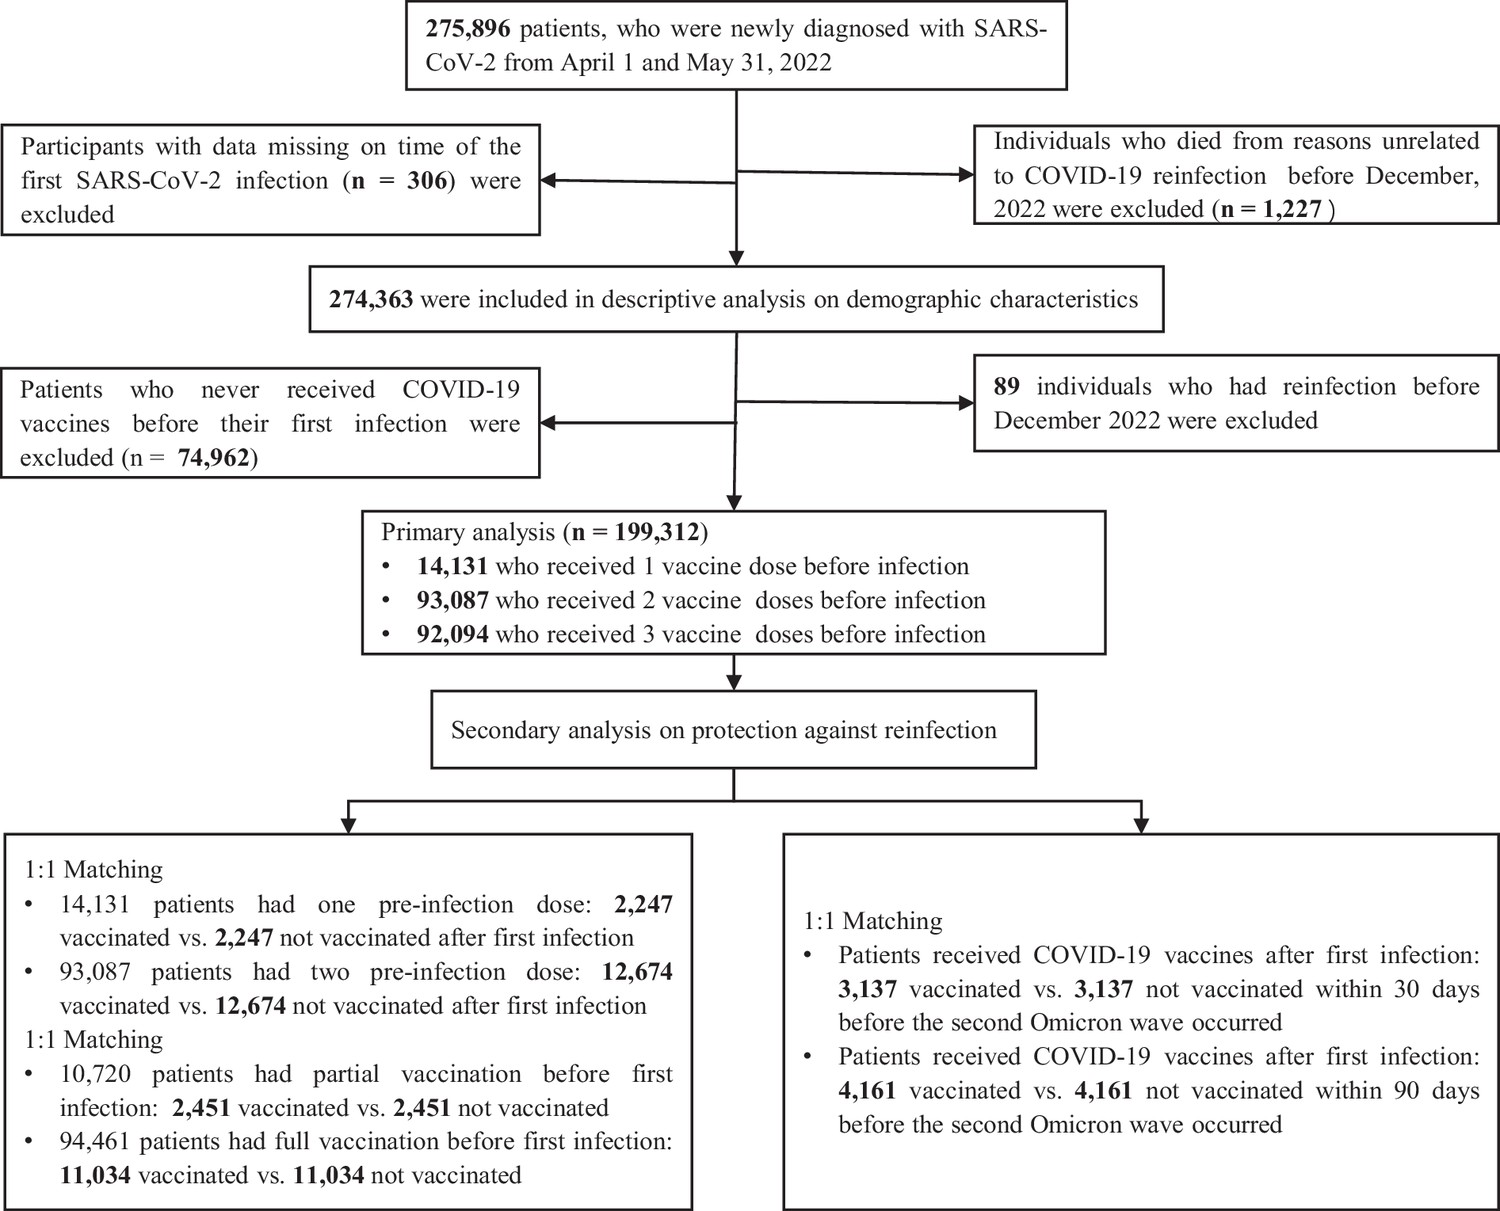
Flow chart describing the selection of participants for the analysis.
The number of individuals in this figure is not the same as some of the numbers in Table 1 because of missing data in key variables. Note that in the bottom part of the chart, related to secondary analyses, the boxes represent overlapping sets of study participants; in other words, some individuals included in the secondary analyses that correspond to the left box were also included in analyses corresponding to the box on the right.
Figure 2
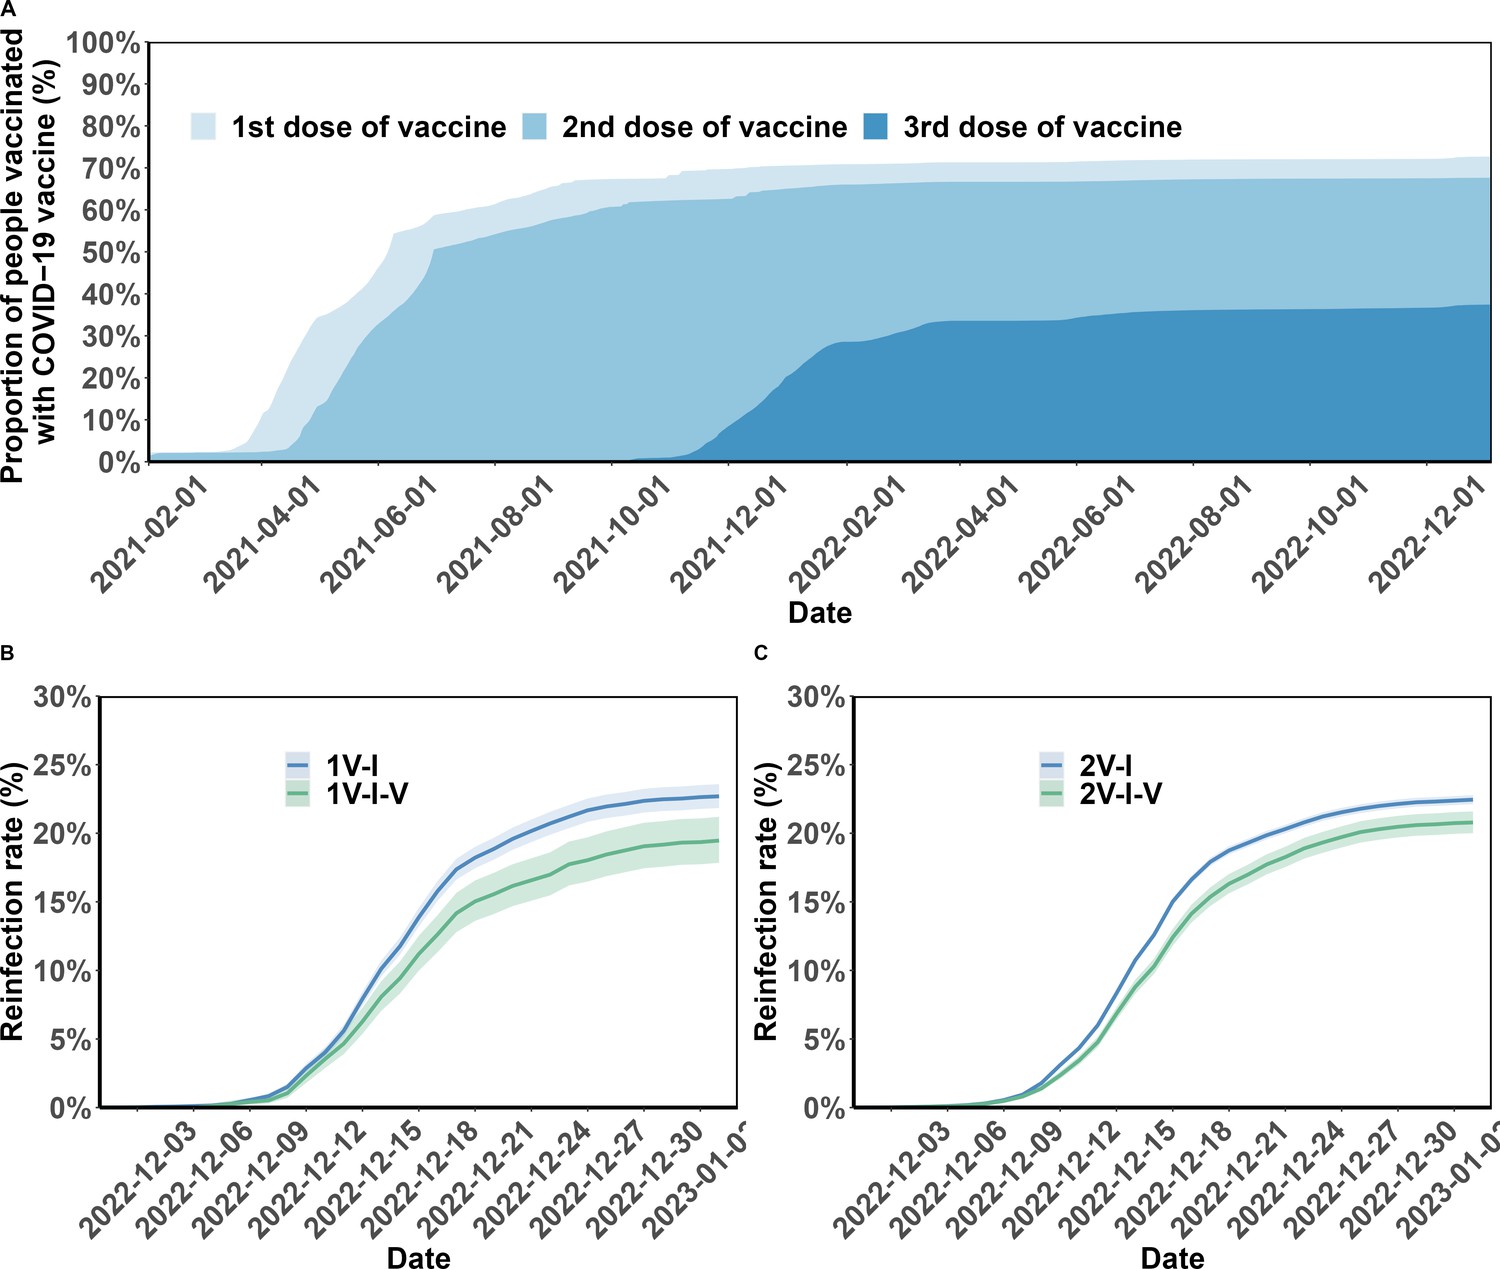
Vaccination coverage and cumulative incidence of severe acute respiratory syndrome coronavirus 2 (SARS-CoV-2) reinfection in the study population.
Panel A presents the percentages of the study population vaccinated over time. The cumulative incidence of SARS-CoV-2 reinfections is presented by the number of vaccination doses before (panels) and after (lines) first infection (Panels B and C). Shaded regions: 95% confidence intervals (CIs). 1V-I and 2V-I represented 1 and 2 vaccine doses before infection, respectively; 1V-I-V and 2V-I-V correspond to 1 and 2 doses before infection, then post-infection vaccination, respectively. As mentioned in the Results section, 142 and 144 study participants who received one and two pre-infection vaccine doses received two post-infection vaccine doses. We do not show the corresponding plot for those individuals who received three pre-infection doses as their post-infection dose was after the start of the follow-up, in December.
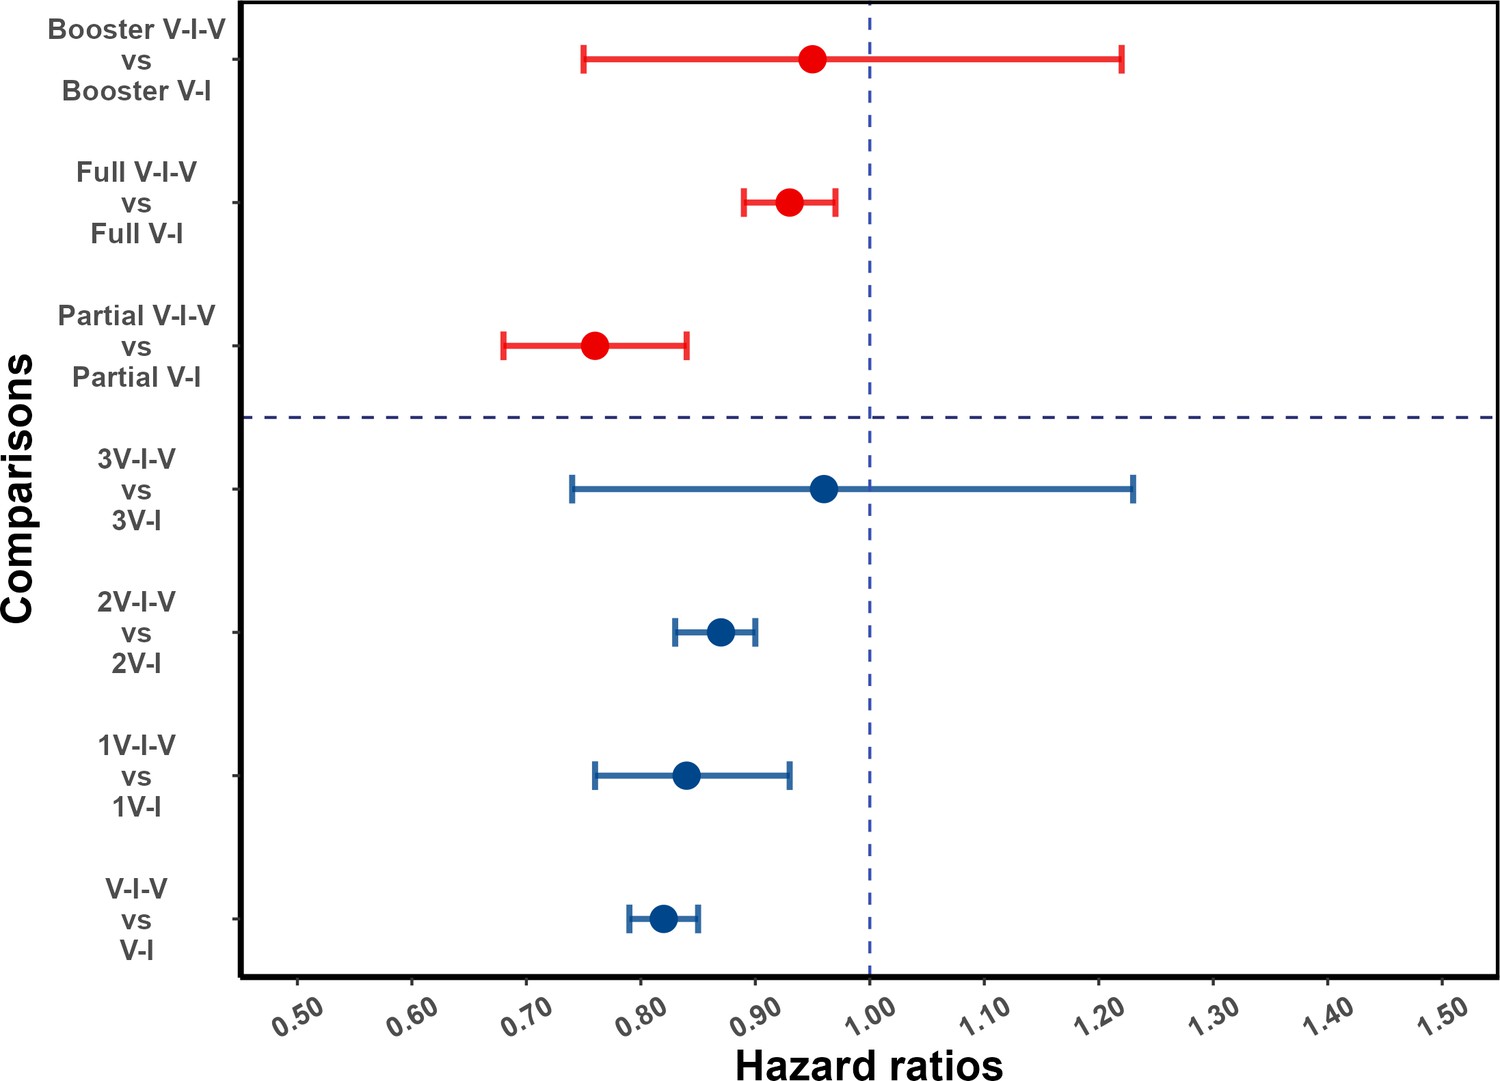
Figure 3
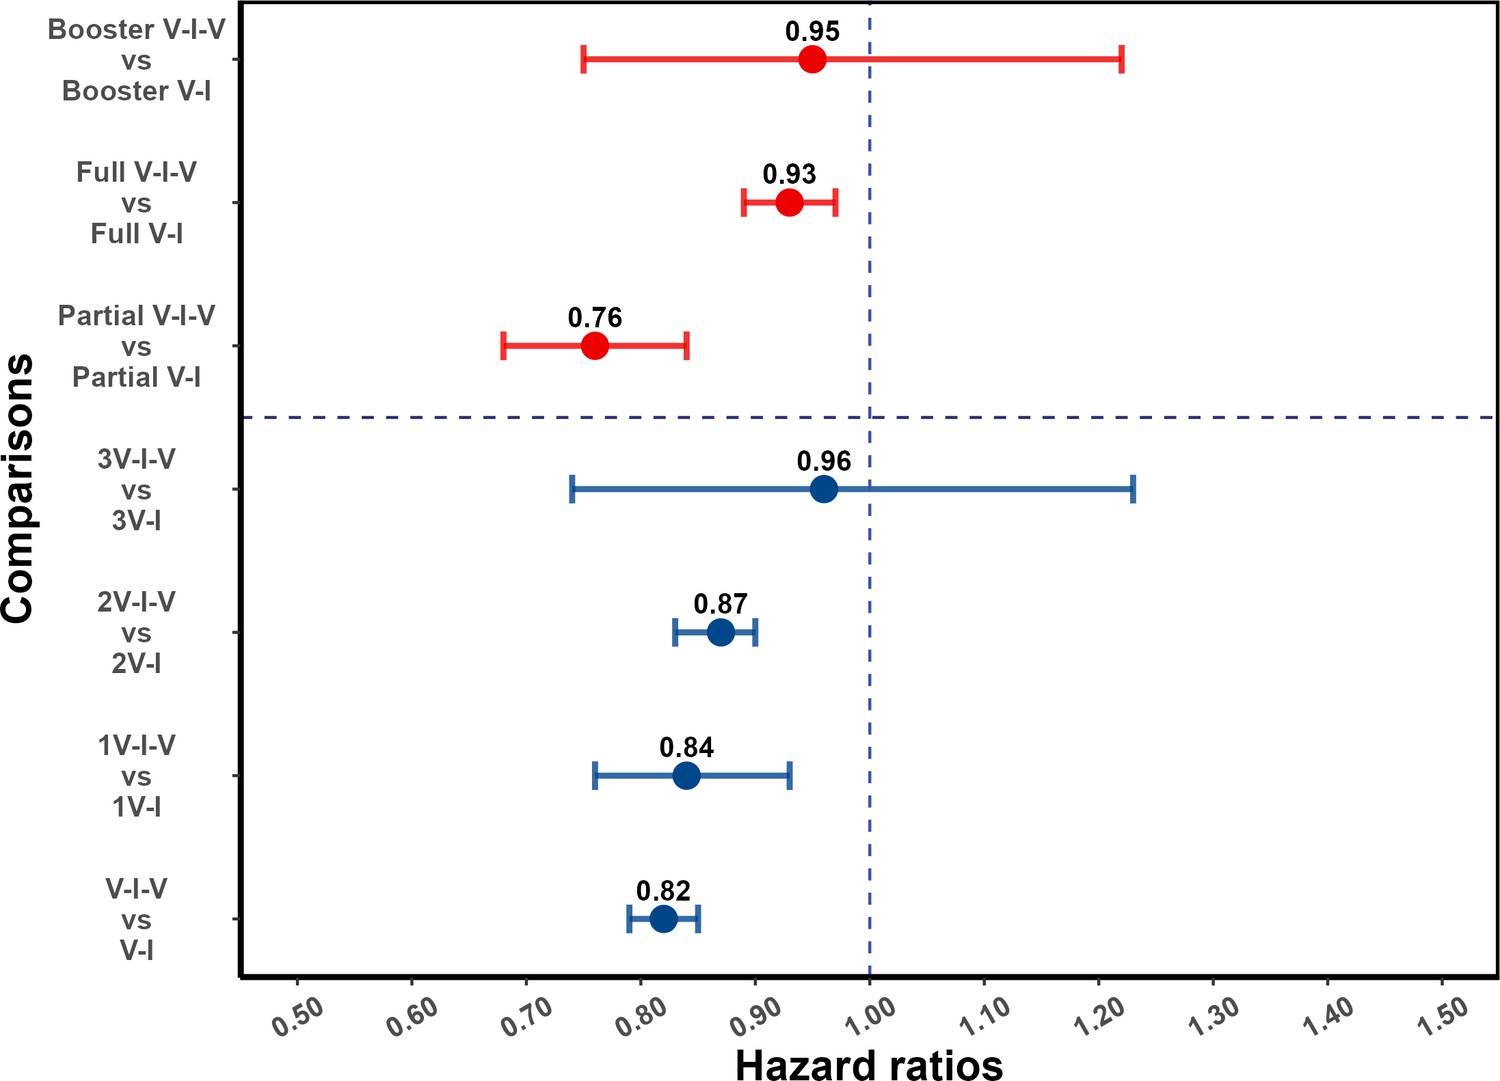
Effect of post-infection vaccination on severe acute respiratory syndrome coronavirus 2 (SARS-CoV-2) reinfection stratified by pre-infection vaccination.
Error bars (95% confidence intervals [CIs]) and circles represent adjusted hazard ratio (aHR) for SARS-CoV-2 reinfection estimated using Cox proportional hazards models. V-I-V, 1V-I-V, 2V-I-V, and 3V-I-V correspond to any pre-infection vaccination, 1, 2, and 3 vaccine doses before infection, then vaccination, respectively; they were compared to V-I, 1V-I, 2V-I, and 3V-I, respectively. Partial V-I-V, Full V-I-V, and Booster V-I-V represent partial vaccination, full vaccination, and booster vaccination before infection, followed by post-infection vaccination, respectively. The number of doses received by individuals with partial versus full (and full with booster) vaccination depends on the type of SARS-CoV-2 vaccine received; in Appendix 1—table 3 we present a cross-classification of participants in the analytic population by these vaccination-related categorical variables.
Figure 4
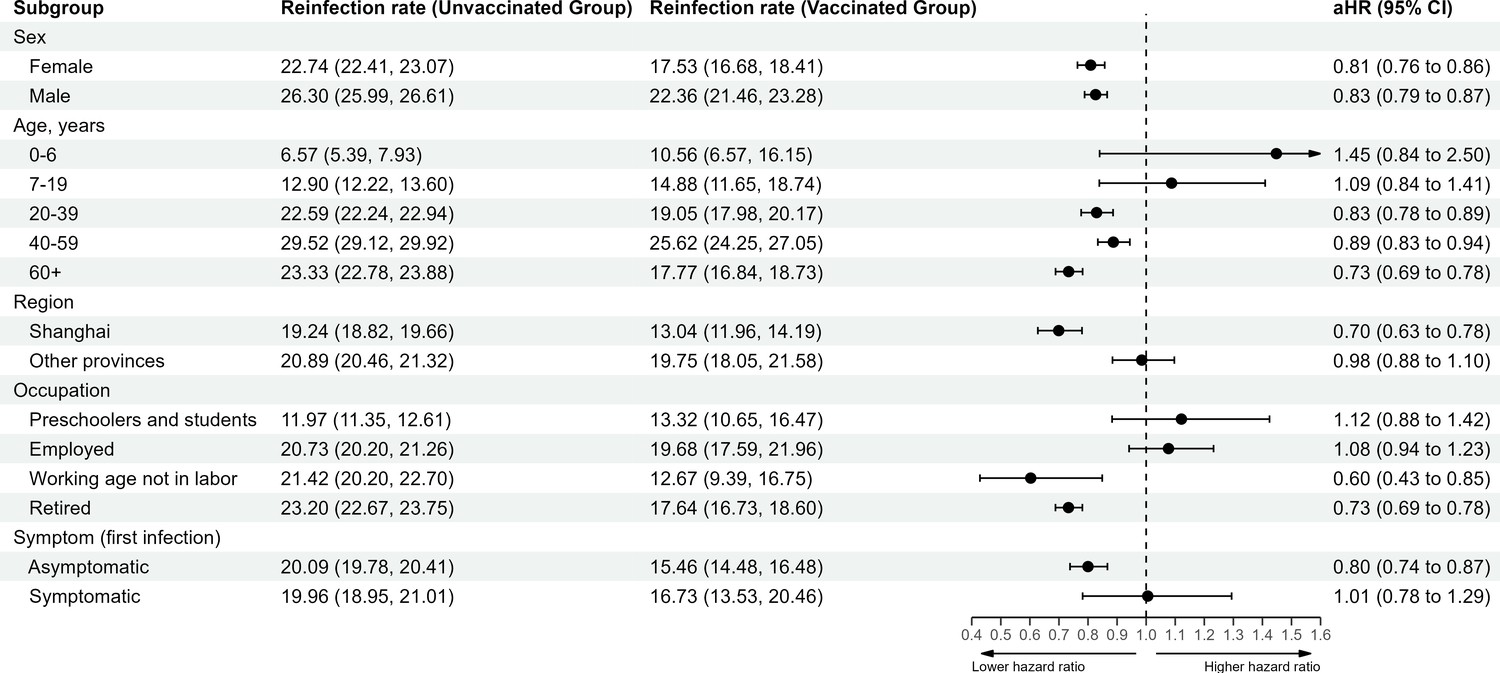
Vaccine-related protection against severe acute respiratory syndrome coronavirus 2 (SARS-CoV-2) reinfection stratified by demographic characteristic.
The vertical dotted line at 1.0 indicates no effect on protection.
Appendix 1—figure 1
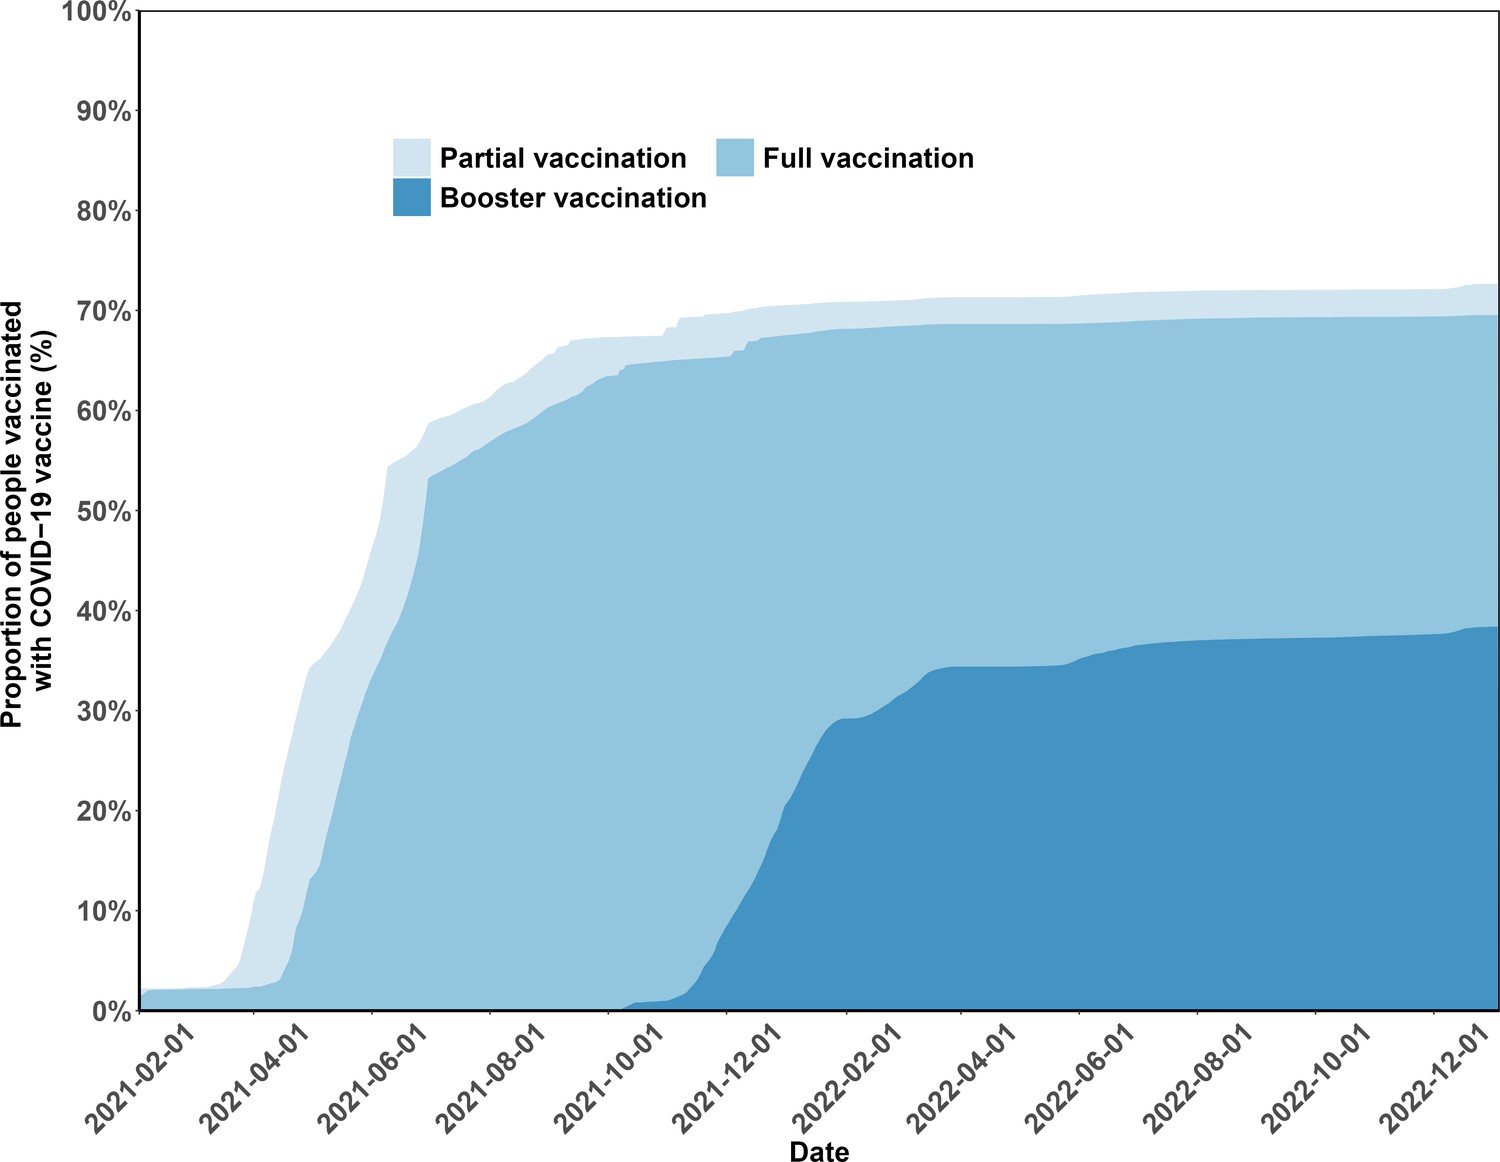
Vaccination status coverage in the study population.
The figure presents the percentages of the study population vaccinated over time.
Appendix 1—figure 2
Effect of post-infection vaccination on severe acute respiratory syndrome coronavirus 2 (SARS-CoV-2) reinfection stratified by pre-infection vaccination and not adjusted for the severity of the first infection.
Error bars (95% confidence intervals [CIs]) and dots represent aHR for SARS-CoV-2 reinfection estimated using Cox proportional hazards models. 1V-I-V, 2V-I-V, and 3V-I-V correspond to 1, 2, and 3 vaccine doses before infection, then vaccination, respectively; they were compared to 1V-I, 2V-I, and 3V-I, respectively. V-I-V, Partial V-I-V, Full V-I-V, and Booster V-I-V represent any pre-infection vaccination, partial vaccination, full vaccination, and booster vaccination before infection, followed by post-infection vaccination, respectively.
Tables
Table 1
Characteristics of the study population and reinfection rate by post-infection vaccination status.
Here, reinfection rate refers to the percentage of the relevant study subpopulation with evidence of reinfection between December 1, 2022 and January 3, 2023. Note that for the variables on region, occupation, and clinical severity, data are missing for large fractions of the study population. Note also that information was only available on sex at birth, but not on gender.
| Characteristics | All | No post-infection vaccination | Post-infection vaccination | ||||
|---|---|---|---|---|---|---|---|
| N (%) | Reinfection rate, % (95% CI) | N (%) | Reinfection rate, % (95% CI) | N (%) | Reinfection rate, % (95% CI) | ||
| Overall | 199,312 | 24.4 (24.2, 24.6) | 183,165 | 24.7 (24.5, 24.9) | 16,147 | 21.5 (20.8, 22.2) | |
| Sex | Male | 112,672 (56.5) | 26.1 (25.8, 26.4) | 104,002 (56.8) | 26.4 (26.1, 26.7) | 8670 (53.7) | 22.3 (21.3, 23.3) |
| Female | 85,804 (43.1) | 22.4 (22.1, 22.7) | 78,403 (42.8) | 22.9 (22.6, 23.2) | 7401 (45.8) | 17.4 (16.4, 18.3) | |
| Age, years | 0–6 | 1736 (0.9) | 7.0 (5.8, 8.3) | 1569 (0.9) | 6.6 (5.4, 8.0) | 167 (1.0) | 10.2 (6.2, 15.9) |
| 7–19 | 10,762 (5.4) | 13.0 (12.3, 13.7) | 10,347 (5.6) | 12.9 (12.3, 13.6) | 415 (2.6) | 14.7 (11.4, 18.8) | |
| 20–39 | 75,955 (38.1) | 22.4 (22.1, 22.8) | 71,005 (38.8) | 22.7 (22.3, 23.0) | 4950 (30.7) | 19.1 (17.9, 20.3) | |
| 40–59 | 74,680 (37.5) | 29.4 (29.0, 29.8) | 70,569 (38.5) | 29.6 (29.2, 30.0) | 4111 (25.5) | 25.8 (24.2, 27.4) | |
| 60+ | 35,903 (18.0) | 22.6 (22.1, 23.1) | 29,446 (16.1) | 23.7 (23.1, 24.2) | 6457 (40.0) | 17.6 (16.6, 18.6) | |
| Regions | Shanghai | 44,259 (22.2) | 18.9 (18.5, 19.3) | 41,250 (22.5) | 19.4 (19.0, 19.9) | 3009 (18.6) | 11.9 (10.7, 13.1) |
| Other provinces | 44,959 (22.6) | 20.9 (20.5, 21.3) | 43,045 (23.5) | 21.0 (20.6, 21.5) | 1914 (11.9) | 18.2 (16.4, 20.2) | |
| Occupations | Preschoolers and students | 12,232 (6.1) | 12.1 (11.5, 12.7) | 11,677 (6.4) | 12.0 (11.4, 12.6) | 555 (3.4) | 13.2 (10.4, 16.4) |
| Employed | 29,537 (14.8) | 20.8 (20.2, 21.3) | 28,343 (15.5) | 20.8 (20.3, 21.4) | 1194 (7.4) | 18.8 (16.4, 21.3) | |
| Retired | 37,482 (18.8) | 22.5 (22.0, 23.0) | 30,955 (16.9) | 23.5 (23.0, 24.1) | 6527 (40.4) | 17.5 (16.5, 18.5) | |
| Working age not in labor† | 5606 (2.8) | 21.0 (19.8, 22.2) | 5311 (2.9) | 21.5 (20.3, 22.8) | 295 (1.8) | 11.5 (8.1, 15.9) | |
| Clinical severity* | Asymptomatic | 81,584 (40.9) | 19.9 (19.6, 20.2) | 77,057 (42.1) | 20.3 (19.9, 20.6) | 4527 (28.0) | 14.1 (13.1, 15.3) |
| Mild/moderate | 7602 (3.8) | 19.9 (18.9, 21.0) | 7216 (3.9) | 20.1 (19.1, 21.2) | 386 (2.4) | 16.6 (12.9, 21.0) | |
| Severe or critical | 32 (0.0) | 15.6 (5.9, 34.3) | 22 (0.0) | 13.6 (3.8, 36.4) | 10 (0.1) | 20.0 (4.0, 64.1) | |
-
CI: confidence interval.
-
† People of working age (≥18 years) unemployed or not in the labor force (disabled); *Clinical severity of first infection.
Appendix 1—table 1
Baseline demographic characteristics of unvaccinated and vaccinated groups after first infection stratified by dose received before first infection.
This comparison only refers to the secondary analyses where exposed and unexposed individuals were matched based on propensity scores.
| Characteristics | Received 1 vaccine dose prior first infection | Received 2 vaccine doses prior first infection | |||||
|---|---|---|---|---|---|---|---|
| Unvaccinated group (N = 2247) | Vaccinated group (N = 2247) | SMD | Unvaccinated group (N = 12,674) | Vaccinated group (N = 12,674) | SMD | ||
| Sex | Male | 1309 (58.3) | 1309 (58.3) | <0.001 | 6784 (53.5) | 6784 (53.5) | <0.001 |
| Female | 924 (41.1) | 924 (41.1) | 5841 (46.1) | 5841 (46.1) | |||
| Unknown | 14 (0.6) | 14 (0.6) | 49 (0.4) | 49 (0.4) | |||
| Age, years | 0–6 | 78 (3.5) | 78 (3.5) | <0.001 | 89 (0.7) | 89 (0.7) | <0.001 |
| 7–19 | 155 (6.9) | 155 (6.9) | 258 (2.0) | 258 (2.0) | |||
| 20–39 | 819 (36.4) | 819 (36.4) | 3828 (30.2) | 3828 (30.2) | |||
| 40–59 | 479 (21.3) | 479 (21.3) | 3323 (26.2) | 3323 (26.2) | |||
| 60+ | 709 (31.6) | 709 (31.6) | 5142 (40.6) | 5142 (40.6) | |||
| Unknown | 7 (0.3) | 7 (0.3) | 34 (0.3) | 34 (0.3) | |||
| Regions | Shanghai | 370 (16.5) | 370 (16.5) | <0.001 | 2369 (18.7) | 2369 (18.7) | <0.001 |
| Other provinces | 296 (13.2) | 296 (13.2) | 1481 (11.7) | 1481 (11.7) | |||
| Unknown | 1581 (70.4) | 1581 (70.4) | 8824 (69.6) | 8824 (69.6) | |||
| Occupations | Preschoolers and students | 228 (10.1) | 228 (10.1) | <0.001 | 326 (2.6) | 326 (2.6) | <0.001 |
| Employed | 161 (7.2) | 161 (7.2) | 865 (6.8) | 865 (6.8) | |||
| Working age not in labor | 31 (1.4) | 31 (1.4) | 245 (1.9) | 245 (1.9) | |||
| Retired | 716 (31.9) | 716 (31.9) | 5205 (41.1) | 5205 (41.1) | |||
| Unknown | 1111 (49.4) | 1111 (49.4) | 6033 (47.6) | 6033 (47.6) | |||
| Clinical severity | Asymptomatic | 612 (27.2) | 612 (27.2) | 0.043 | 3546 (28.0) | 3546 (28.0) | 0.016 |
| Mild and moderate | 54 (2.4) | 52 (2.3) | 301 (2.4) | 297 (2.3) | |||
| Severe or critical | 0 (0.0) | 2 (0.1) | 3 (0.0) | 7 (0.1) | |||
| Unknown | 1581 (70.4) | 1581 (70.4) | 8824 (69.6) | 8824 (69.6) | |||
-
SMD: standardized mean difference.
Appendix 1—table 2
Baseline demographic characteristics of unvaccinated and vaccinated groups after first infection stratified by intervals before the policy change.
This comparison only refers to the secondary analyses where exposed and unexposed individuals were matched based on propensity scores.
| Characteristics | Within 30 days* | Within 90 days* | |||||||
|---|---|---|---|---|---|---|---|---|---|
| Unvaccinated group (N = 3137) | Vaccinated group (N = 3137) | SMD | Unvaccinated group (N = 4161) | Vaccinated group (N = 4161) | SMD | ||||
| Sex | Male | 1585 (50.5) | 1585 (50.5) | <0.001 | 2275 (54.7) | 2275 (54.7) | <0.001 | ||
| Female | 1541 (49.1) | 1541 (49.1) | 1865 (44.8) | 1865 (44.8) | |||||
| Unknown | 11 (0.4) | 11 (0.4) | 21 (0.5) | 21 (0.5) | |||||
| Age, years | 0–6 | 69 (2.2) | 69 (2.2) | <0.001 | 77 (1.9) | 77 (1.9) | <0.001 | ||
| 7–19 | 56 (1.8) | 56 (1.8) | 107 (2.6) | 107 (2.6) | |||||
| 20–39 | 870 (27.7) | 870 (27.7) | 1472 (35.4) | 1472 (35.4) | |||||
| 40–59 | 645 (20.6) | 645 (20.6) | 1003 (24.1) | 1003 (24.1) | |||||
| 60+ | 1495 (47.7) | 1495 (47.7) | 1494 (35.9) | 1494 (35.9) | |||||
| Unknown | 2 (0.1) | 2 (0.1) | 8 (0.2) | 8 (0.2) | |||||
| Regions | Shanghai | 1015 (32.4) | 1015 (32.4) | <0.001 | 1060 (25.5) | 1060 (25.5) | <0.001 | ||
| Other provinces | 341 (10.9) | 341 (10.9) | 646 (15.5) | 646 (15.5) | |||||
| Unknown | 1781 (56.8) | 1781 (56.8) | 2455 (59.0) | 2455 (59.0) | |||||
| Occupations | Preschoolers and students | 124 (4.0) | 124 (4.0) | <0.001 | 180 (4.3) | 180 (4.3) | <0.001 | ||
| Employed | 181 (5.8) | 181 (5.8) | 344 (8.3) | 344 (8.3) | |||||
| Working age not in labor | 54 (1.7) | 54 (1.7) | 81 (1.9) | 81 (1.9) | |||||
| Retired | 1526 (48.6) | 1526 (48.6) | 1528 (36.7) | 1528 (36.7) | |||||
| Unknown | 1252 (39.9) | 1252 (39.9) | 2028 (48.7) | 2028 (48.7) | |||||
| Clinical severity | Asymptomatic | 1273 (40.6) | 1273 (40.6) | 0.01 | 1600 (38.5) | 1600 (38.5) | <0.001 | ||
| Mild and moderate | 79 (2.5) | 80 (2.6) | 102 (2.5) | 102 (2.5) | |||||
| Severe or critical | 4 (0.1) | 3 (0.1) | 4 (0.1) | 4 (0.1) | |||||
| Unknown | 1781 (56.8) | 1781 (56.8) | 2455 (59.0) | 2455 (59.0) | |||||
-
SMD: standardized mean difference. *Before second Omicron variant wave
Appendix 1—table 3
Baseline demographic characteristics of unvaccinated and vaccinated groups after first infection stratified by vaccination status prior infection.
This comparison only refers to the secondary analyses where exposed and unexposed individuals were matched based on propensity scores.
| Characteristics | Partial vaccination prior to infection | Full vaccination prior to infection | |||||
|---|---|---|---|---|---|---|---|
| Unvaccinated group (N = 2451) | Vaccinated group (N = 2451) | SMD | Unvaccinated group (N = 11,034) | Vaccinated group (N = 11,034) | SMD | ||
| Sex | Male | 1286 (52.5) | 1286 (52.5) | <0.001 | 6133 (55.6) | 6133 (55.6) | <0.001 |
| Female | 1148 (46.8) | 1148 (46.8) | 4859 (44.0) | 4859 (44.0) | |||
| Unknown | 17 (0.7) | 17 (0.7) | 42 (0.4) | 42 (0.4) | |||
| Age, years | 0–6 | 163 (6.7) | 163 (6.7) | <0.001 | 181 (1.6) | 181 (1.6) | <0.001 |
| 7–19 | 232 (9.5) | 232 (9.5) | 3722 (33.7) | 3722 (33.7) | |||
| 20–39 | 905 (36.9) | 905 (36.9) | 3186 (28.9) | 3186 (28.9) | |||
| 40–59 | 559 (22.8) | 559 (22.8) | 3914 (35.5) | 3914 (35.5) | |||
| 60+ | 585 (23.9) | 585 (23.9) | 31 (0.3) | 31 (0.3) | |||
| Unknown | 7 (0.3) | 7 (0.3) | 1674 (15.2) | 1674 (15.2) | <0.001 | ||
| Regions | Shanghai | 460 (18.8) | 460 (18.8) | <0.001 | 1428 (12.9) | 1428 (12.9) | |
| Other provinces | 330 (13.5) | 330 (13.5) | 7932 (71.9) | 7932 (71.9) | |||
| Unknown | 1661 (67.8) | 1661 (67.8) | 168 (1.5) | 168 (1.5) | <0.001 | ||
| Occupations | Preschoolers and students | 382 (15.6) | 382 (15.6) | <0.001 | 834 (7.6) | 834 (7.6) | |
| Employed | 184 (7.5) | 184 (7.5) | 186 (1.7) | 186 (1.7) | |||
| Working age not in labor | 62 (2.5) | 62 (2.5) | 3959 (35.9) | 3959 (35.9) | |||
| Retired | 593 (24.2) | 593 (24.2) | 5887 (53.4) | 5887 (53.4) | |||
| Unknown | 1230 (50.2) | 1230 (50.2) | 2827 (25.6) | 2827 (25.6) | <0.001 | ||
| Clinical severity | Asymptomatic | 726 (29.6) | 726 (29.6) | 0.039 | 272 (2.5) | 272 (2.5) | |
| Mild and moderate | 63 (2.6) | 60 (2.4) | 3 (0.0) | 3 (0.0) | |||
| Severe or critical | 1 (0.0) | 4 (0.2) | 7932 (71.9) | 7932 (71.9) | |||
| Unknown | 1661 (67.8) | 1661 (67.8) | 7943 (71.9) | 7943 (71.9) | |||
-
SMD: standardized mean difference.
Appendix 1—table 4
STROBE statement—checklist of items that should be included in reports of cohort studies.
| Item No | Recommendation | Page/Figure | |
|---|---|---|---|
| Title and abstract | 1 | Indicate the study’s design with a commonly used term in the title or the abstract | Page 1 |
| Provide in the abstract an informative and balanced summary of what was done and what was found | Page 1 and 2 | ||
| Introduction | |||
| Background/rationale | 2 | Explain the scientific background and rationale for the investigation being reported | Page 2 |
| Objectives | 3 | State specific objectives, including any prespecified hypotheses | Page 2 |
| Methods | |||
| Study design | 4 | Present key elements of study design early in the paper | Page 2 and 3 |
| Setting | 5 | Describe the setting, locations, and relevant dates, including periods of recruitment, exposure, follow-up, and data collection | Page 2 and 3 |
| Participants | 6 | Give the eligibility criteria, and the sources and methods of selection of participants. Describe methods of follow-up | Page 2 and 3 |
| For matched studies, give matching criteria and number of exposed and unexposed | Page 3 and 4 | ||
| Variables | 7 | Clearly define all outcomes, exposures, predictors, potential confounders, and effect modifiers. Give diagnostic criteria, if applicable | Page 3 and 4 |
| Data sources/ measurement | 8* | For each variable of interest, give sources of data and details of methods of assessment (measurement). Describe comparability of assessment methods if there is more than one group | Page 3 and 4 |
| Bias | 9 | Describe any efforts to address potential sources of bias | Page 3 and 4 |
| Study size | 10 | Explain how the study size was arrived at | - |
| Quantitative variables | 11 | Explain how quantitative variables were handled in the analyses. If applicable, describe which groupings were chosen and why | Page 3 and 4 |
| Statistical methods | 12 | Describe all statistical methods, including those used to control for confounding | Page 3 and 4 |
| Describe any methods used to examine subgroups and interactions | Page 3 and 4 | ||
| Explain how missing data were addressed | Page 3 and 4 | ||
| If applicable, explain how loss to follow-up was addressed | - | ||
| Describe any sensitivity analyses | Page 3 and 4 | ||
| Results | |||
| Participants | 13* | Report numbers of individuals at each stage of study—e.g. numbers potentially eligible, examined for eligibility, confirmed eligible, included in the study, completing follow-up, and analyzed | Page 4 and 5 |
| Give reasons for non-participation at each stage | Page 5 | ||
| Consider use of a flow diagram | Figure 1 | ||
| Descriptive data | 14* | Give characteristics of study participants (e.g. demographic, clinical, social) and information on exposures and potential confounders | Page 5 |
| Indicate number of participants with missing data for each variable of interest | Page 5 | ||
| Summarize follow-up time (e.g. average and total amount) | Page 5 | ||
| Outcome data | 15* | Report numbers of outcome events or summary measures over time | Table 1 and Appendix 1—table 5 |
| Main results | 16 | Give unadjusted estimates and, if applicable, confounder-adjusted estimates and their precision (e.g. 95% confidence interval). Make clear which confounders were adjusted for and why they were included | Page 5 and 6 |
| Report category boundaries when continuous variables were categorized | Figures 2—4 | ||
| If relevant, consider translating estimates of relative risk into absolute risk for a meaningful time period | Page 7 and 8 | ||
| Other analyses | 17 | Report other analyses done—e.g. analyses of subgroups and interactions, and sensitivity analyses | Page 8 |
| Discussion | |||
| Key results | 18 | Summarize key results with reference to study objectives | Page 5–8 |
| Limitations | 19 | Discuss limitations of the study, taking into account sources of potential bias or imprecision. Discuss both direction and magnitude of any potential bias | Page 9–11 |
| Interpretation | 20 | Give a cautious overall interpretation of results considering objectives, limitations, multiplicity of analyses, results from similar studies, and other relevant evidence | Page11 |
| Generalisability | 21 | Discuss the generalisability (external validity) of the study results | Page10 |
| Other information | |||
| Funding | 22 | Give the source of funding and the role of the funders for the present study and, if applicable, for the original study on which the present article is based | Page 11 and 12 |
-
*
Give information separately for exposed and unexposed groups.
Appendix 1—table 5
Descriptive overview of the study population.
While in Table 1 we present information by post-infection vaccination status, in this table data are shown based on reinfection during the second Omicron variant wave. Note that this table reflects the vaccination status by the end of the study period, January 2023. According to vaccination procedures, boosters are given post-full vaccination, indicating that those with boosters have completed the initial series.
| Characteristic | N = 199,312 (%) | Not reinfection (n = 150,661), n (%) | Reinfection (n = 48,651), n (%) | ||
|---|---|---|---|---|---|
| Median age (IQR), years | 42.79 (31.77, 55.73) | 41.66 (31.03, 55.70) | 45.82 (33.97, 55.85) | ||
| Mean age (95% CI), years | 43.88 (43.8, 43.95) | 43.37 (43.28, 43.45) | 45.45 (45.32, 45.58) | ||
| Age group, years | 0–6 | 1736 (0.9) | 1615 (1.1) | 121 (0.2) | |
| 7–19 | 10,762 (5.4) | 9363 (6.2) | 1399 (2.9) | ||
| 20–39 | 75,955 (38.1) | 58,911 (39.1) | 17,044 (35.0) | ||
| 40–59 | 74,680 (37.5) | 52,726 (35.0) | 21,954 (45.1) | ||
| ≥ 60 | 35,903 (18.0) | 27,796 (18.4) | 8107 (16.7) | ||
| Sex | Male | 112,672 (56.5) | 83,263 (55.3) | 29,409 (60.4) | |
| Female | 85,804 (43.1) | 66,581 (44.2) | 19,223 (39.5) | ||
| Vaccination status | Partial vaccination | 8497 (4.3) | 6968 (4.6) | 1529 (3.1) | |
| Full vaccination | 85,546 (42.9) | 66,486 (44.2) | 19,060 (39.2) | ||
| Booster vaccination | 105,269 (52.8) | 77,207 (51.2) | 28,062 (57.7) | ||
| Clinical severity during the first infection | Asymptomatic | 81,584 (40.9) | 65,333 (43.4) | 16,251 (33.4) | |
| Mild and moderate | 7602 (3.8) | 6087 (4.0) | 1515 (3.1) | ||
| Severe or critical | 32 (0.0) | 27 (0.0) | 5 (0.0) | ||
-
IQR: interquartile range. Data are presented as means with 95% confidence intervals (95% CIs) or as proportions (%). Note that for the variables on age, sex, and clinical severity, data are missing for fractions of the study population, especially the clinical severity during the first infection.
Appendix 1—table 6
Characteristics of vaccination distribution among study population.
| Number of vaccine doses before infection | Participants in the analysis | Participants received post-infection dose | 1 dose after infection | 2 doses after infection | |||
|---|---|---|---|---|---|---|---|
| Total | Total | Total | Before Dec. | Total | Dose 1 before Dec. | Dose 2 before Dec. | |
| 1 | 14,131 | 2466 | 2324 | 2324 | 142 | 142 | 13 |
| 2 | 93,087 | 12,886 | 12,742 | 12,727 | 144 | 144 | 32 |
| 3 | 92,094 | 795 | 795 | 0 | 0 | 0 | 0 |
Appendix 1—table 7
Cross-classification based on the number of vaccine doses received before the first infection and vaccination status.
| Number of vaccine doses before infection | Participants in the analysis | Partial vaccination | Full vaccination | Booster vaccination |
|---|---|---|---|---|
| 1 | 14,131 | 8665 | 5466 | 0 |
| 2 | 93,087 | 2055 | 88,673 | 2359 |
| 3 | 92,094 | 0 | 322 | 91,772 |
Appendix 1—table 8
Effect of post-infection vaccination in individuals with no history of vaccination before infection.
This table only include the 74,962 unvaccinated from the analysis and is stratified by demographic characteristic.
| Subgroup | Reinfection rate (unvaccinated group) | Reinfection rate (vaccinated group) | aHR (95% CI) | p value | |
|---|---|---|---|---|---|
| Overall | 10.88 (10.53, 11.24) | 7.62 (6.47, 8.92) | 1.06 (0.97, 1.16) | 0.216 | |
| Sex | Female | 12.63 (12.24, 13.04) | 10.95 (9.75, 12.25) | 0.97 (0.84, 1.11) | 0.653 |
| Male | 14.10 (13.75, 14.46) | 14.87 (13.41, 16.44) | 1.12 (0.99, 1.26) | 0.070 | |
| Age, years | 0–6 | 5.31 (4.69, 5.99) | 9.45 (5.88, 14.46) | 1.89 (1.08, 3.30) | 0.026 |
| 7–19 | 9.81 (8.86, 10.83) | 11.89 (7.66, 17.68) | 1.32 (0.83, 2.10) | 0.238 | |
| 20–39 | 13.17 (12.72, 13.64) | 16.4 (13.88, 19.25) | 1.12 (0.92, 1.37) | 0.250 | |
| 40–59 | 14.34 (13.82, 14.87) | 14.17 (11.66, 17.07) | 1.34 (1.08, 1.67) | 0.008 | |
| 60+ | 15.04 (14.54, 15.56) | 11.72 (10.57, 12.95) | 0.92 (0.82, 1.04) | 0.204 | |
| Region | Shanghai | 11.79 (11.32, 12.27) | 6.74 (5.61, 8.03) | 0.77 (0.61, 0.98) | 0.034 |
| Other provinces | 9.83 (9.36, 10.32) | 13.47 (9.76, 18.15) | 1.72 (1.21, 2.43) | 0.002 | |
| Occupation | Preschoolers and students | 7.21 (6.65, 7.80) | 10.40 (7.51, 14.06) | 1.47 (1.02, 2.12) | 0.041 |
| Employed | 9.76 (9.17, 10.38) | 17.61 (11.67, 25.57) | 1.84 (1.17, 2.91) | 0.009 | |
| Working age not in labor | 12.55 (11.06, 14.18) | 1.28 (0.26, 4.11) | 0.27 (0.07, 1.10) | 0.069 | |
| Retired | 15.13 (14.63, 15.65) | 11.37 (10.26, 12.57) | 0.90 (0.79, 1.02) | 0.095 | |
| Symptom (first infection) | Asymptomatic | 10.88 (10.53, 11.24) | 7.62 (6.47, 8.92) | 0.94 (0.76, 1.15) | 0.551 |
| Symptomatic | 10.99 (9.87, 12.22) | 9.26 (4.75, 16.43) | 1.12 (0.55, 2.27) | 0.748 | |
Appendix 1—table 9
Effect of vaccination after first infection against severe acute respiratory syndrome coronavirus 2 (SARS-CoV-2) reinfection stratified by sequence of vaccination dose and vaccination status before first infection.
| Characteristics# | Unvaccinated group | Vaccinated group | Number with same type of vaccine before infection, N (%) | aHR (95% CI) | |||
|---|---|---|---|---|---|---|---|
| N (%) | Reinfection rate, % (95% CI) | N (%) | Reinfection rate, % (95% CI) | ||||
| 1 dose of vaccine before first infection | Overall | 2247 (100) | 23.63 (21.69, 25.71) | 2247 (100) | 19.94 (18.16, 21.85) | 1284 (57.14) | 0.81 (0.72, 0.92) |
| Ad5-nCoV | 423 (18.83) | 27.90 (23.20, 33.28) | 423 (18.83) | 26.00 (21.48, 31.21) | 213 (50.35) | 0.91 (0.70, 1.18) | |
| Inactivated vaccine | 1679 (74.72) | 22.75 (20.56, 25.12) | 1679 (74.72) | 18.23 (16.27, 20.35) | 1064 (63.37) | 0.77 (0.66, 0.89) | |
| Recombinant protein vaccine | 12 (0.53) | 33.33 (11.14, 79.25) | 12 (0.53) | 41.67 (15.80, 91.33) | 7 (58.33) | 1.28 (0.34, 4.80) | |
| 2 doses of vaccine before first infection | Overall | 12,674 (100) | 24.57 (23.72, 25.44) | 12,674 (100) | 20.81 (20.03, 21.62) | 11,979 (94.52) | 0.83 (0.79, 0.87) |
| Ad5-nCoV | 787 (6.21) | 24.27 (21.01, 27.90) | 787 (6.21) | 11.61 (9.40, 14.20) | 512 (65.06) | 0.45 (0.35, 0.58) | |
| Inactivated vaccine | 10,747 (84.80) | 24.60 (23.68, 25.55) | 10,747 (84.80) | 21.39 (20.53, 22.27) | 10,465 (97.38) | 0.85 (0.80, 0.90) | |
| Recombinant protein vaccine | 1057 (8.34) | 25.26 (22.37, 28.43) | 1057 (8.34) | 20.91 (18.29, 23.80) | 1002 (94.80) | 0.79 (0.66, 0.95) | |
| Partial vaccination before first infection† | Overall | 2451 (100) | 20.52 (18.79, 22.38) | 2451 (100) | 16.40 (14.86, 18.06) | 2349 (95.84) | 0.78 (0.69, 0.89) |
| Inactivated vaccine | 2343 (95.59) | 20.44 (18.67, 22.34) | 2343 (95.59) | 16.30 (14.73, 18.00) | 2304 (98.34) | 0.78 (0.68, 0.90) | |
| Recombinant protein vaccine | 47 (1.92) | 19.15 (9.46, 34.95) | 47 (1.92) | 17.02 (8.03, 32.12) | 45 (95.74) | 0.92 (0.35, 2.38) | |
| Full vaccination before first infection | Overall | 11,034 (100) | 25.33 (24.40, 26.28) | 11,034 (100) | 22.72 (21.84, 23.62) | 9542 (86.48) | 0.88 (0.83, 0.93) |
| Ad5-nCoV | 1209 (10.96) | 24.32 (21.66, 27.22) | 1209 (10.96) | 17.12 (14.91, 19.58) | 805 (66.58) | 0.67 (0.56, 0.80) | |
| Inactivated vaccine | 8787 (79.64) | 25.37 (24.33, 26.44) | 8787 (79.64) | 23.69 (22.69, 24.73) | 7944 (90.41) | 0.92 (0.87, 0.98) | |
| Recombinant protein vaccine | 1037 (9.40) | 26.13 (23.16, 29.39) | 1037 (9.40) | 20.93 (18.28, 23.85) | 793 (76.47) | 0.77 (0.64, 0.92) | |
-
Data are presented as average (95% CI), or n (n/N%), where N is the total number of patients. #Individuals received two doses of inactivated vaccine, recombinant protein vaccine or Ad5-nCoV were excluded. †Only few post-infection Ad5-nCoV vaccine dose given to those had partial vaccination before the first infection.
Additional files
-
MDAR checklist
- https://cdn.elifesciences.org/articles/94990/elife-94990-mdarchecklist1-v1.docx
-
Source code 1
Data analysis and graph plotting for Cox models.
- https://cdn.elifesciences.org/articles/94990/elife-94990-code1-v1.zip
Download links
A two-part list of links to download the article, or parts of the article, in various formats.
Downloads (link to download the article as PDF)
Open citations (links to open the citations from this article in various online reference manager services)
Cite this article (links to download the citations from this article in formats compatible with various reference manager tools)
Protection afforded by post-infection SARS-CoV-2 vaccine doses: A cohort study in Shanghai
eLife 13:RP94990.
https://doi.org/10.7554/eLife.94990.3


