Damage-induced basal epithelial cell migration modulates the spatial organization of redox signaling and sensory neuron regeneration
- Department of Medical Microbiology and Immunology, University of Wisconsin-Madison, United States
- Cellular and Molecular Biology Graduate Program, University of Wisconsin-Madison, United States
- Department of Biostatistics and Medical Informatics, University of Wisconsin-Madison, United States
- Department of Pediatrics, University of Wisconsin-Madison, United States
Figures
Figure 1 with 1 supplement
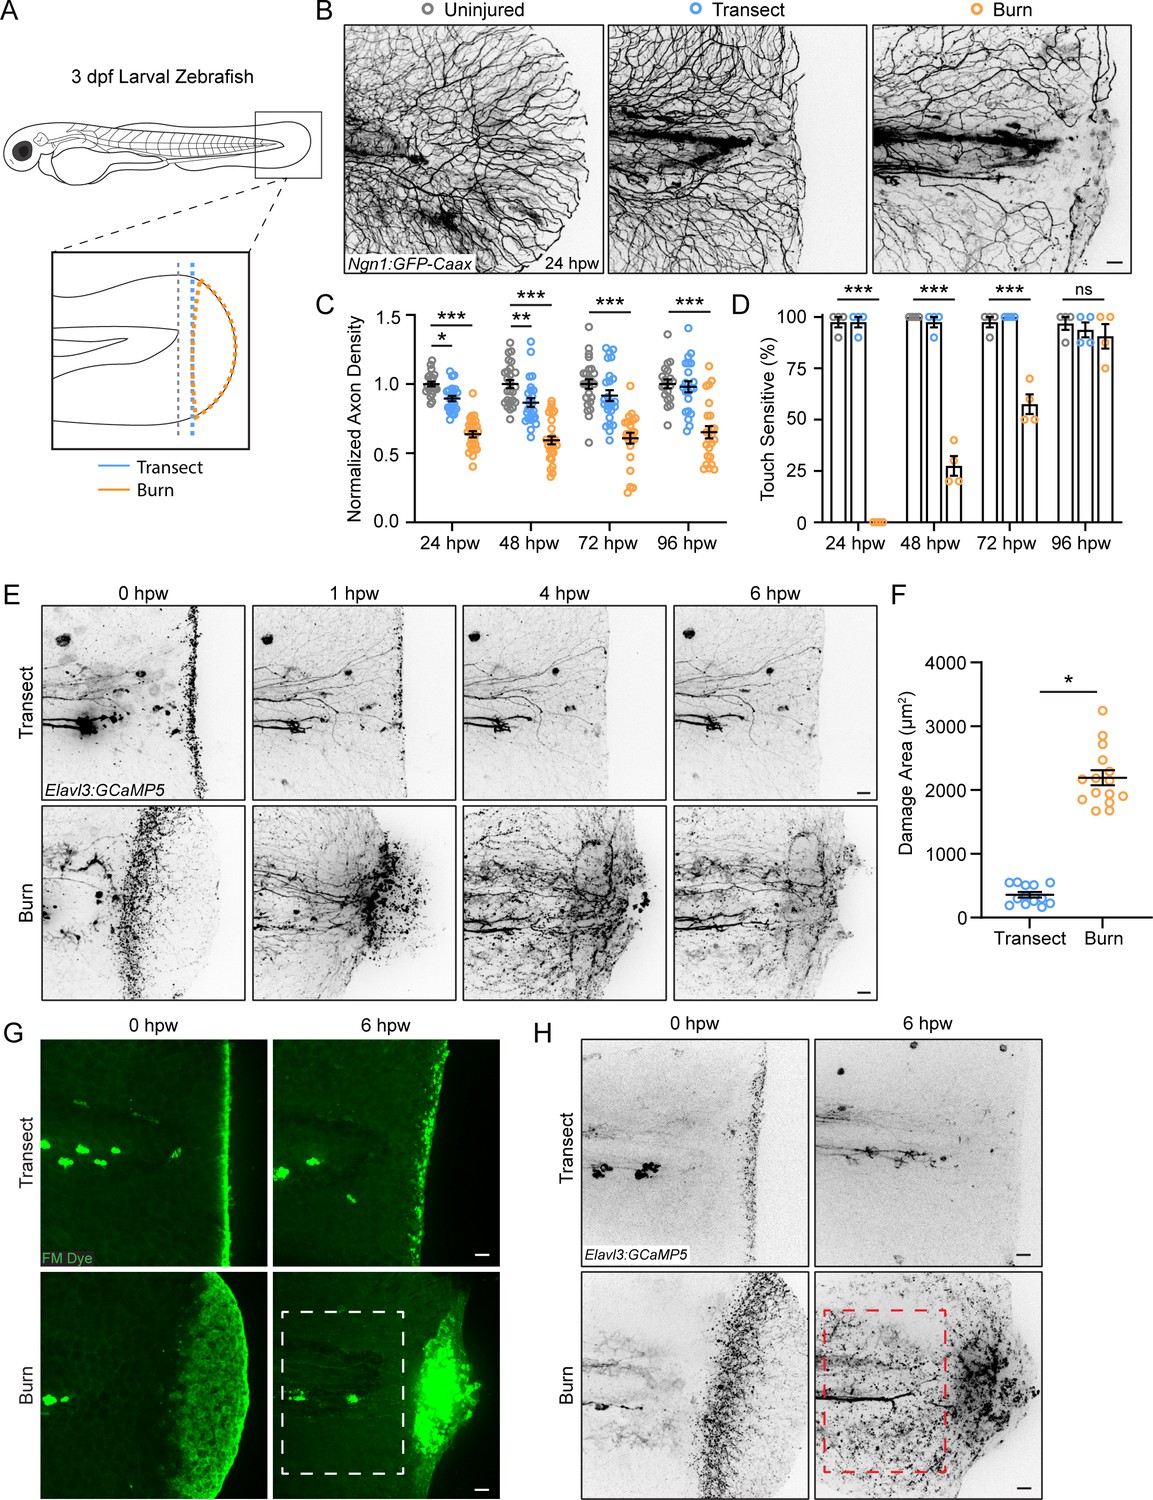
Peripheral sensory axons have impaired regeneration after burn injury.
(A) Schematic of larval zebrafish injury. Gray dashed line denotes area used to measure axon density to the right of the notochord. (B) Confocal max-projected images of sensory axons in uninjured, transected, and burned Tg(Ngn1:GFP-Caax) caudal fins 24 hr post-wound (hpw). (C) Quantification of axon density for uninjured, transected, and burned larvae in the wound area 24–96 hpw. N>20 larvae per condition from four replicates. (D) Quantification of sensory perception for uninjured, transected, and burned larvae 24–96 hpw. N>32 larvae per condition from four replicates. (E) Confocal time-series images of axonal damage, indicated by calcium-positive punctae (black dots), in Tg(Elavl3:GCaMP5) larvae following either transection or burn injury. Each series follows one representative larva over 6 hpw. (F) Quantification of axon damage area in transected and burned larvae 6 hpw. N>12 larvae per condition from two replicates. (G) Images of larvae either transected or burned in the presence of FM 1–43 dye. White dashed box denotes area of uninjured tissue in which axonal damage appears in H. (H) Images show axonal damage following transection or burn injury. Red dashed box corresponds to the tissue region highlighted in G. In all cases, scale bars = 20 µm. *p<0.05, **p<0.01, ***p<0.001, ns = not significant.
-
Figure 1—source data 1
Numerical data for Figure 1C.
- https://cdn.elifesciences.org/articles/94995/elife-94995-fig1-data1-v1.xlsx
-
Figure 1—source data 2
Numerical data for Figure 1D.
- https://cdn.elifesciences.org/articles/94995/elife-94995-fig1-data2-v1.xlsx
-
Figure 1—source data 3
Numerical data for Figure 1F.
- https://cdn.elifesciences.org/articles/94995/elife-94995-fig1-data3-v1.xlsx
Figure 1—figure supplement 1
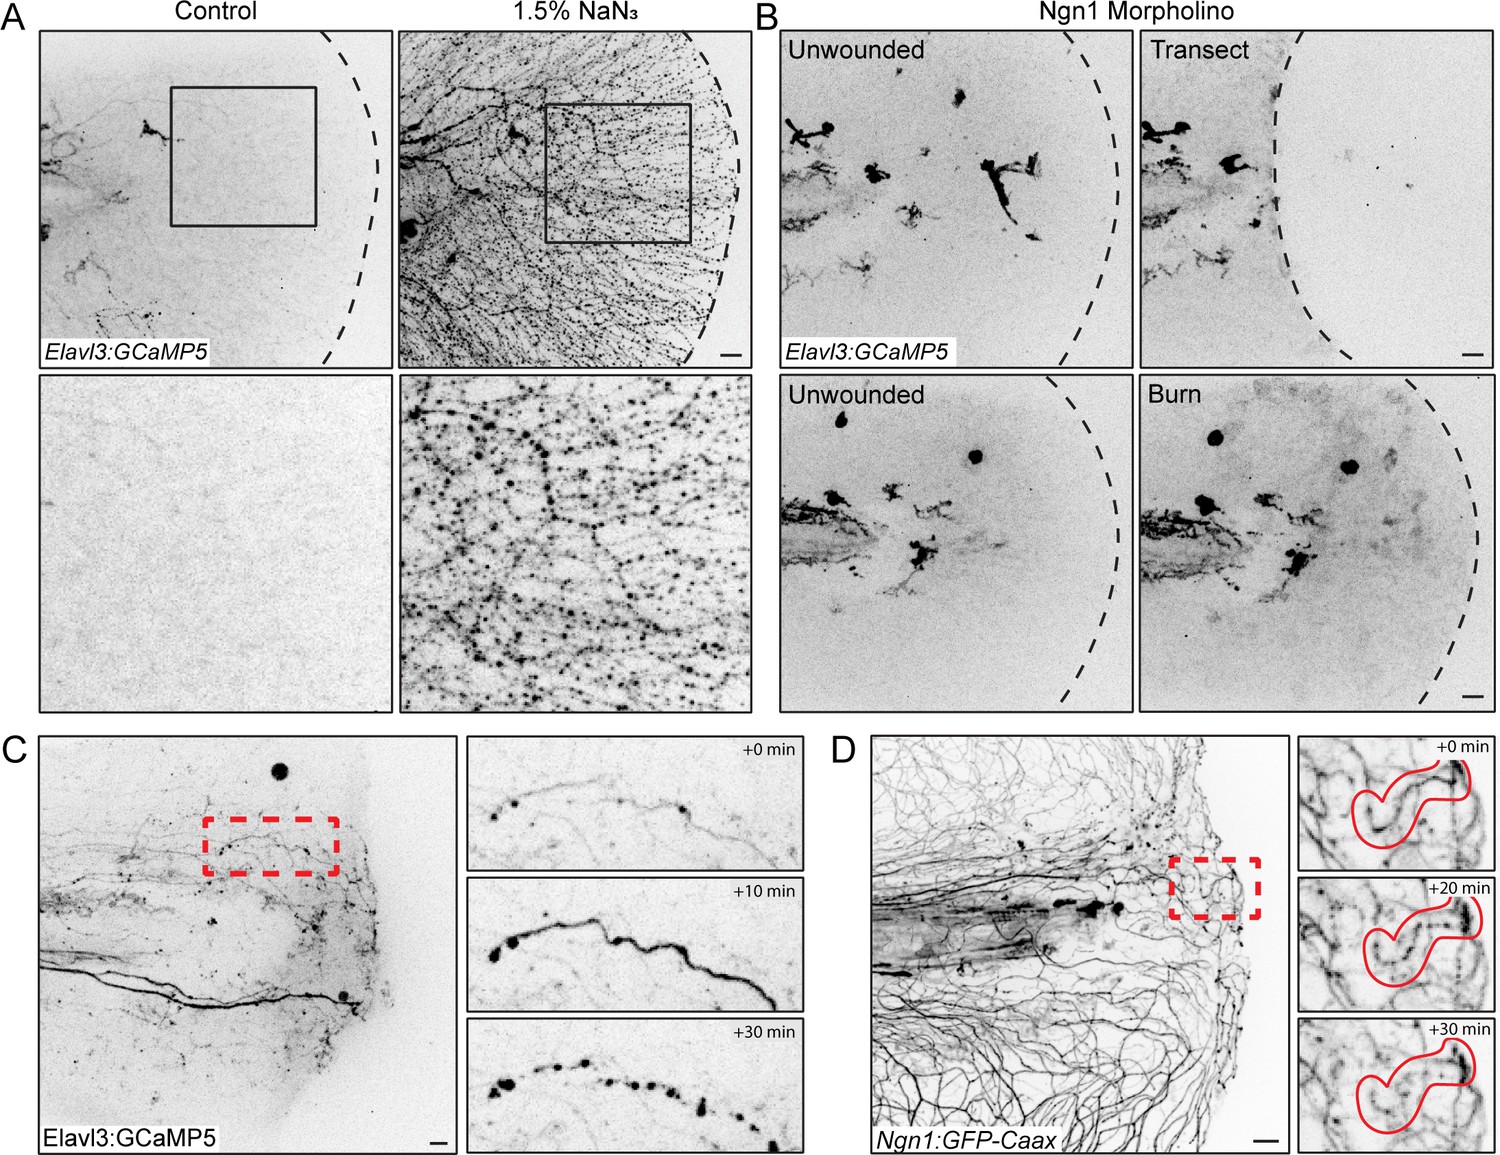
Elavl3-GCaMP5 transgenic fish show sensory axon damage.
(A) Confocal max-projected images of axon damage in Tg(Elavl3:GCaMP5) larval zebrafish caudal fins either untreated or 30 min post-treatment with the neurotoxin sodium azide (NaN3, 1.5% final concentration). Sensory neuron damage is indicated by calcium-positive axon fragments (black dots). Dashed black lines denote the fin edge. Black boxes highlight area of inset, shown below. (B) Confocal max-projected images of Tg(Elavl3:GCaMP5) larvae injected with Ngn1 morpholino both before and 5 min after the indicated injury. (C) Confocal max-projected images of Tg(Elavl3:GCaMP5) larvae taken from a time series. Red dashed box denotes inset area shown on right of a sensory axon fragmenting over a period of 30 min. (D) Confocal max-projected images of Tg(Ngn1:GFP-Caax) larvae taken from a time series. Red dashed box denotes inset area shown on right of a sensory axon fragmenting over a period of 30 min. In all cases, scale bar = 20 µm.
Figure 2
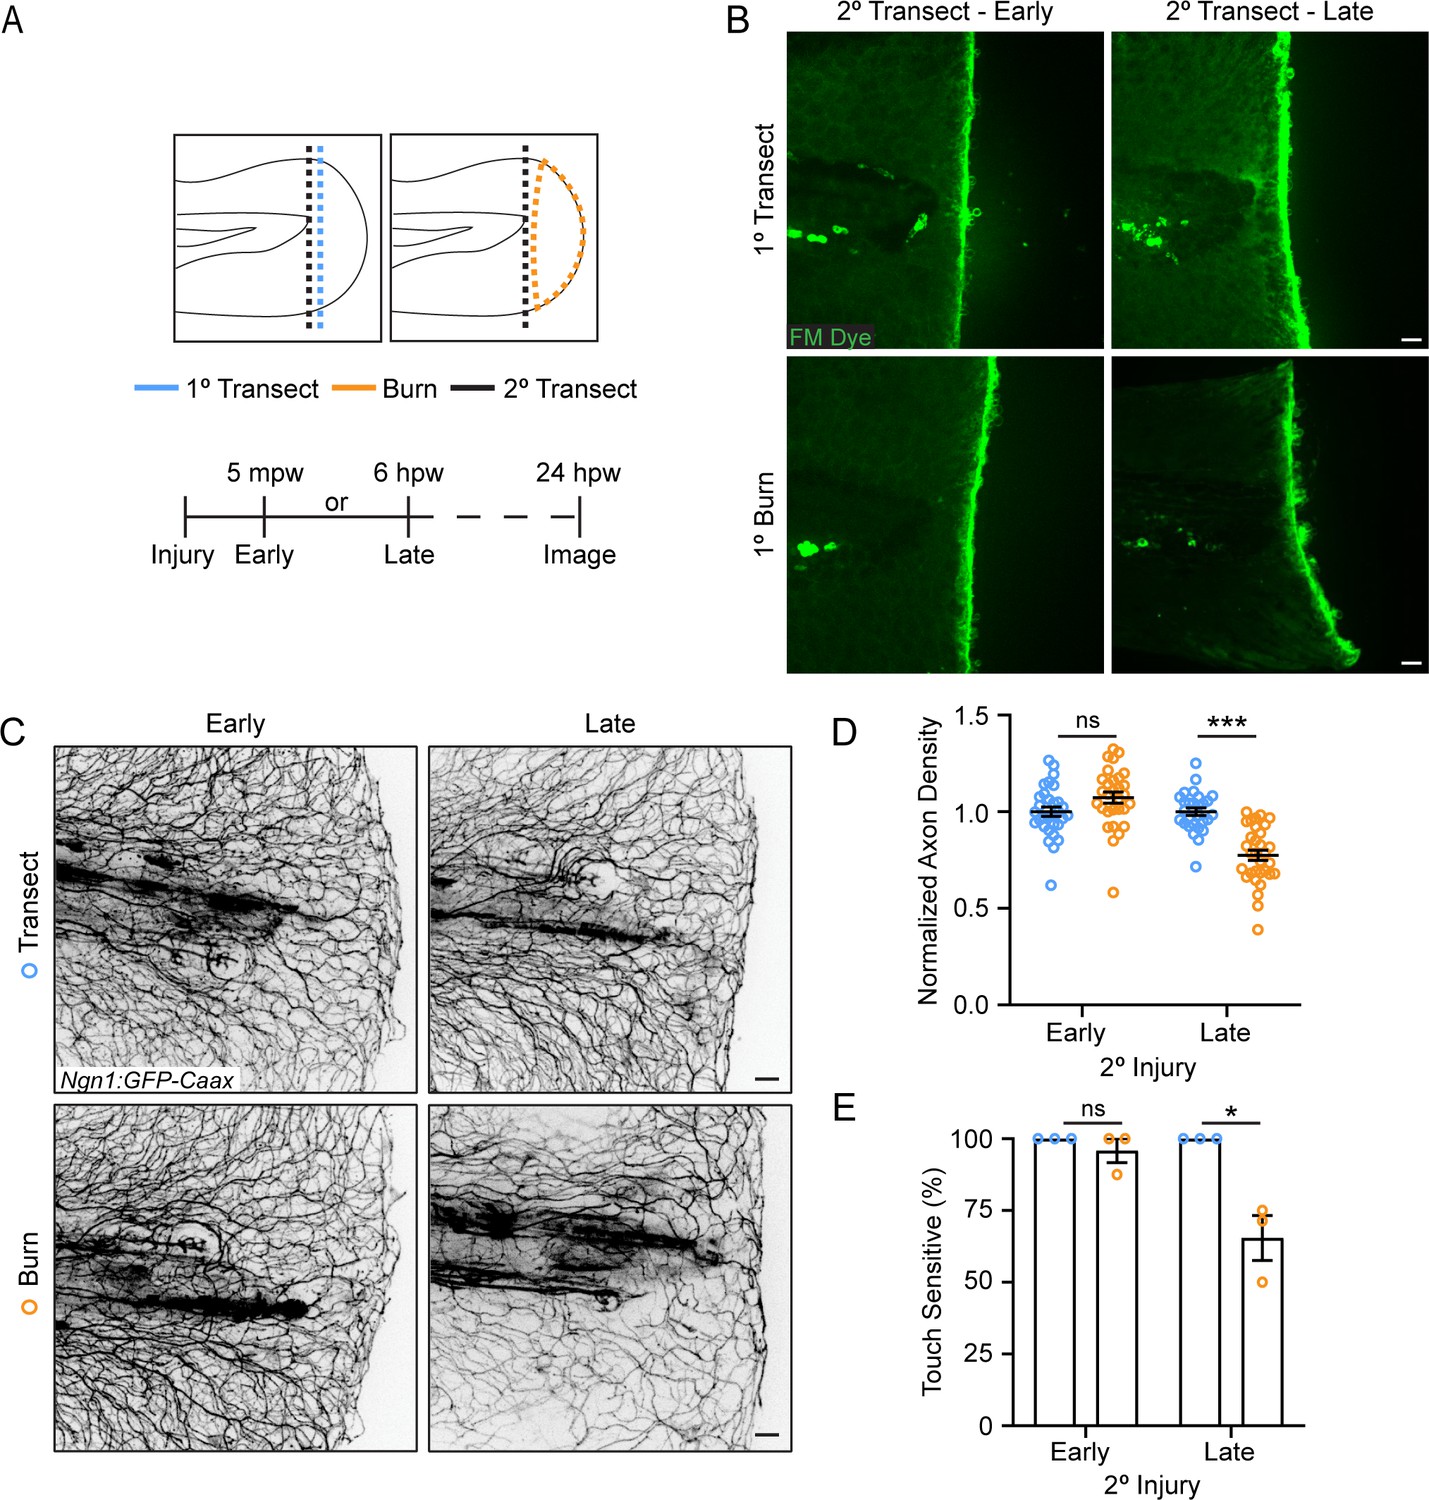
The burn wound microenvironment contributes to impaired sensory axon regeneration.
(A) Schematic of two-wound experiment design. (B) Confocal max-projected images of FM dye staining following secondary transection in the two-wound experiment at 5 min post-wound (mpw) and 6 hr post-wound (hpw). (C) Images of sensory axons in larvae subjected to an initial transection or burn injury followed by subsequent transection either early (5 mpw) or late (6 hpw). (D) Quantification of axon density in wounded tissue 24 hpw from larvae wounded as in B. N>28 larvae per condition from three replicates. (E) Quantification of sensory perception in wounded tissue 24 hpw from larvae wounded as in B. N = 24 larvae each from three replicates. In all cases, scale bars = 20 µm. *p<0.05, ***p<0.001, ns = not significant.
-
Figure 2—source data 1
Numerical data for Figure 2D.
- https://cdn.elifesciences.org/articles/94995/elife-94995-fig2-data1-v1.xlsx
-
Figure 2—source data 2
Numerical data for Figure 2E.
- https://cdn.elifesciences.org/articles/94995/elife-94995-fig2-data2-v1.xlsx
Figure 3 with 2 supplements
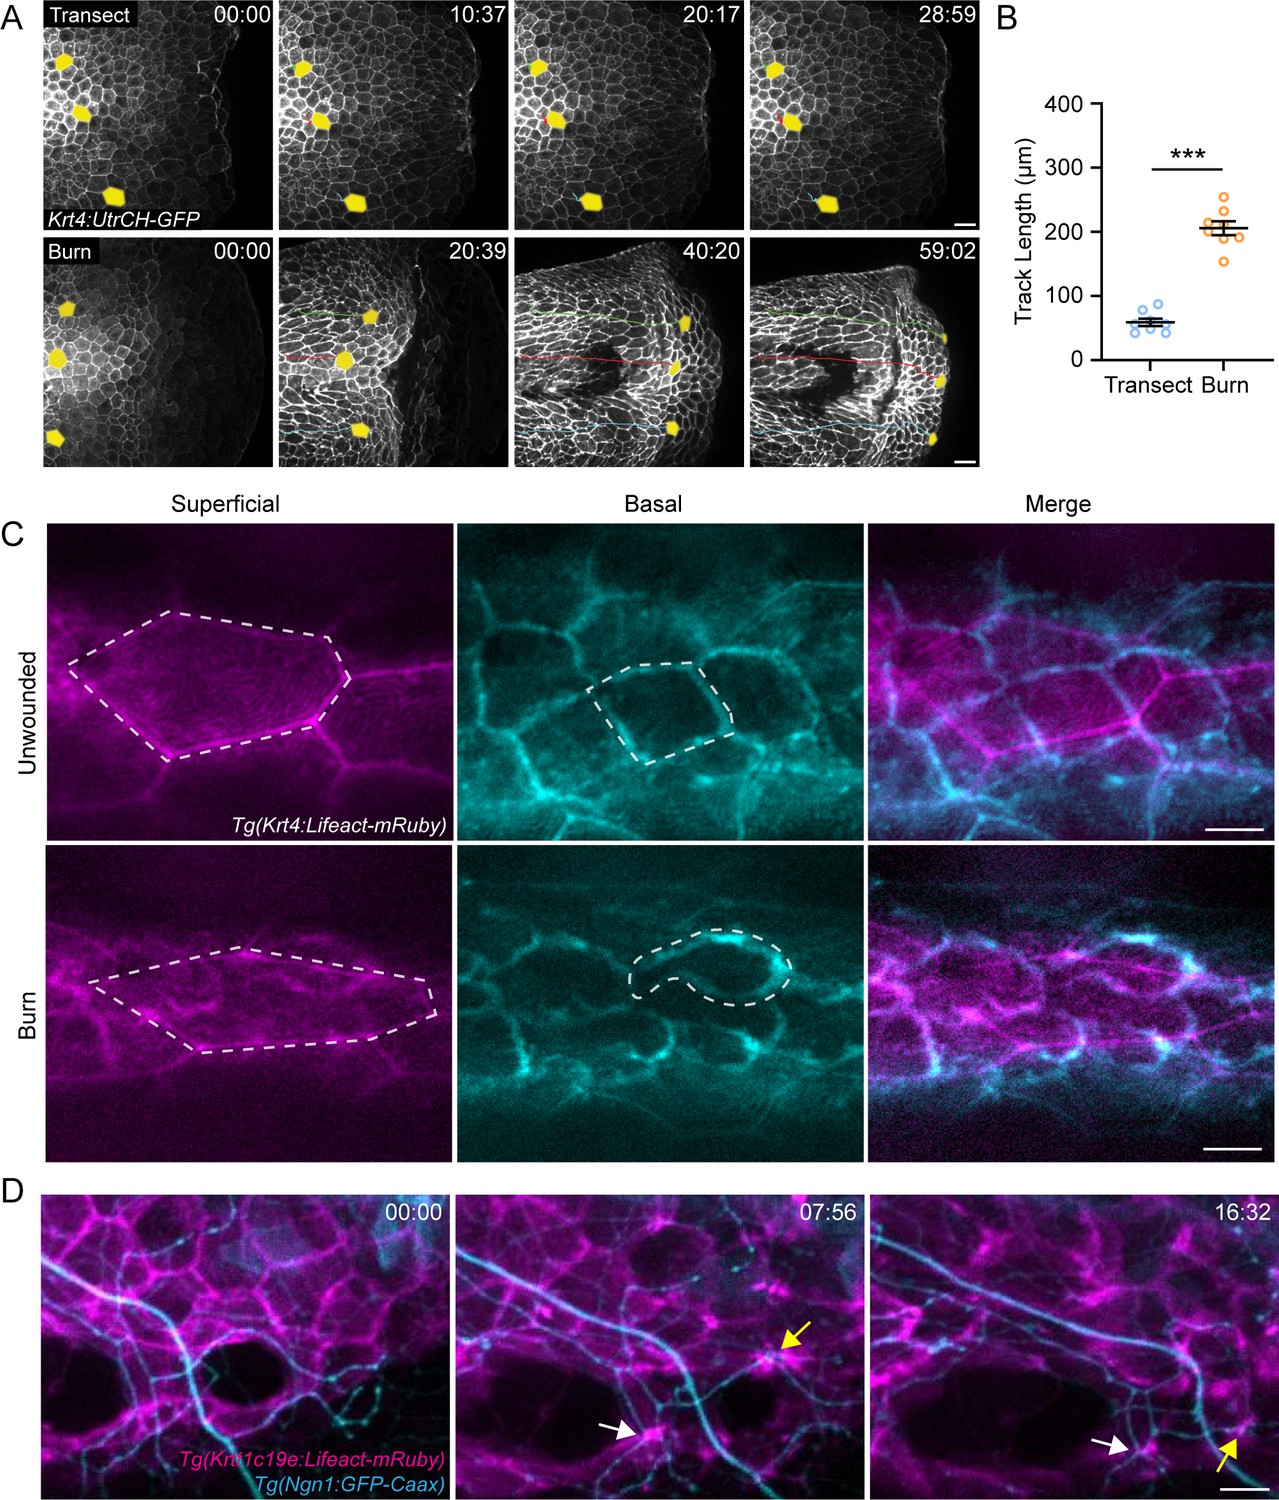
Burn injury induces coordinated keratinocyte and sensory axon movement.
(A) Confocal max-projected time-series images of Tg(Krt4:UtrCH-GFP) larvae after either transection or burn injury. Yellow pseudocolored cells and colored tracks highlight keratinocyte displacement. Scale bar = 20 µm. (B) Quantification of keratinocyte movement distance over 1 hr post-wound (hpw). N = 8 larvae each collected from three replicates. (C) Confocal max-projected images of superficial and basal keratinocytes in Tg(Krt4:Lifeact-mRuby) labeled larvae. Left, superficial keratinocytes. Middle, basal keratinocytes. Right, merge. Superficial and basal cell images were taken from the same z-stack and pseudocolored to match the appropriate cell layer. Dashed lines outline one individual keratinocyte. Scale bar = 10 µm. (D) Confocal max-projected time-series images of sensory axons and basal keratinocytes in dual-labeled Tg(Krt4:Lifeact-mRuby); Tg(Ngn1:GFP-Caax) larvae unwounded or after burn. Arrows highlight coincident movement between keratinocytes and associated sensory axons. Unless otherwise stated, scale bar = 20 µm. ***p<0.001.
-
Figure 3—source data 1
Numerical data for Figure 3A.
- https://cdn.elifesciences.org/articles/94995/elife-94995-fig3-data1-v1.xlsx
Figure 3—figure supplement 1
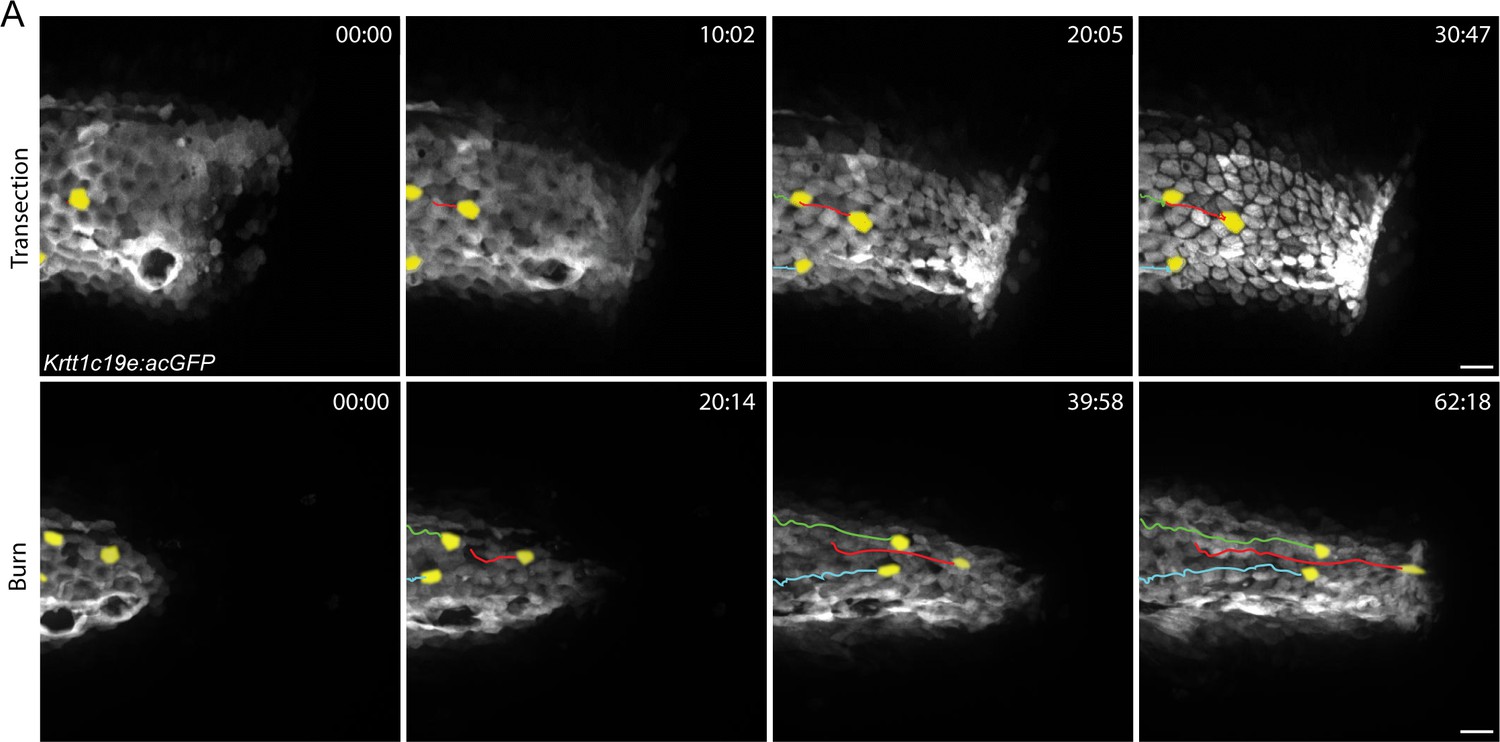
Basal keratinocyte migration in response to injury.
(A) Confocal time series of basal keratinocyte, Tg(Krtt1c19e:acGFP), movement after the indicated injury. Yellow pseudocolored cells highlight keratinocyte displacement. Scale bars = 20 µm.
Figure 3—figure supplement 2
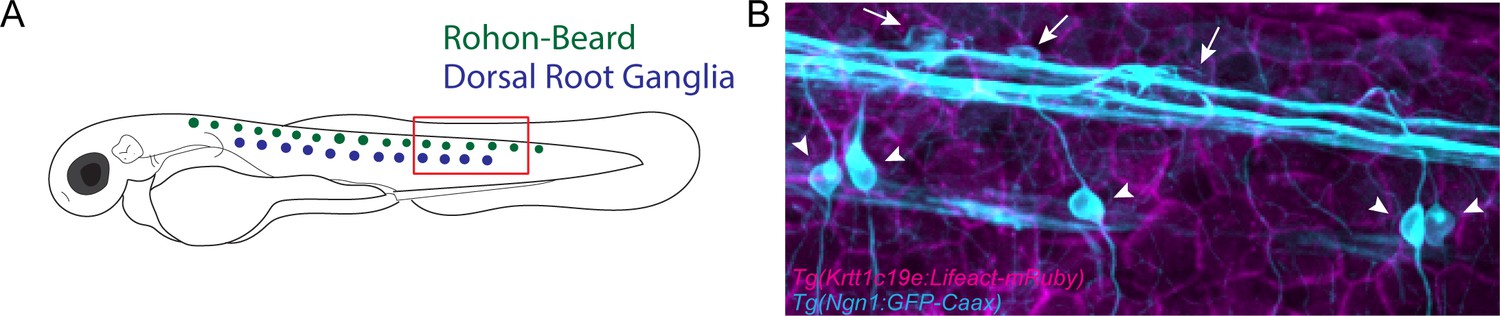
Sensory axon cell bodies are not displaced following burn injury.
(A) Schematic of Rohon-Beard (RB) (green) and dorsal root ganglia (DRG) (blue) soma localization in 3 days post-fertilization (dpf) zebrafish. Red box denotes area in which the image shown in B was acquired. (B) Representative confocal max-projected image of intact RB and DRG somas 24 hr post-wound (hpw) in a Tg(Ngn1:GFP-Caax); Tg(Krtt1c19e:Lifeact-mRuby) dual-labeled larva. Arrows denote RB somas, while arrowheads indicate DRG somas. Soma position was unchanged compared to pre-wounding.
Figure 4 with 1 supplement
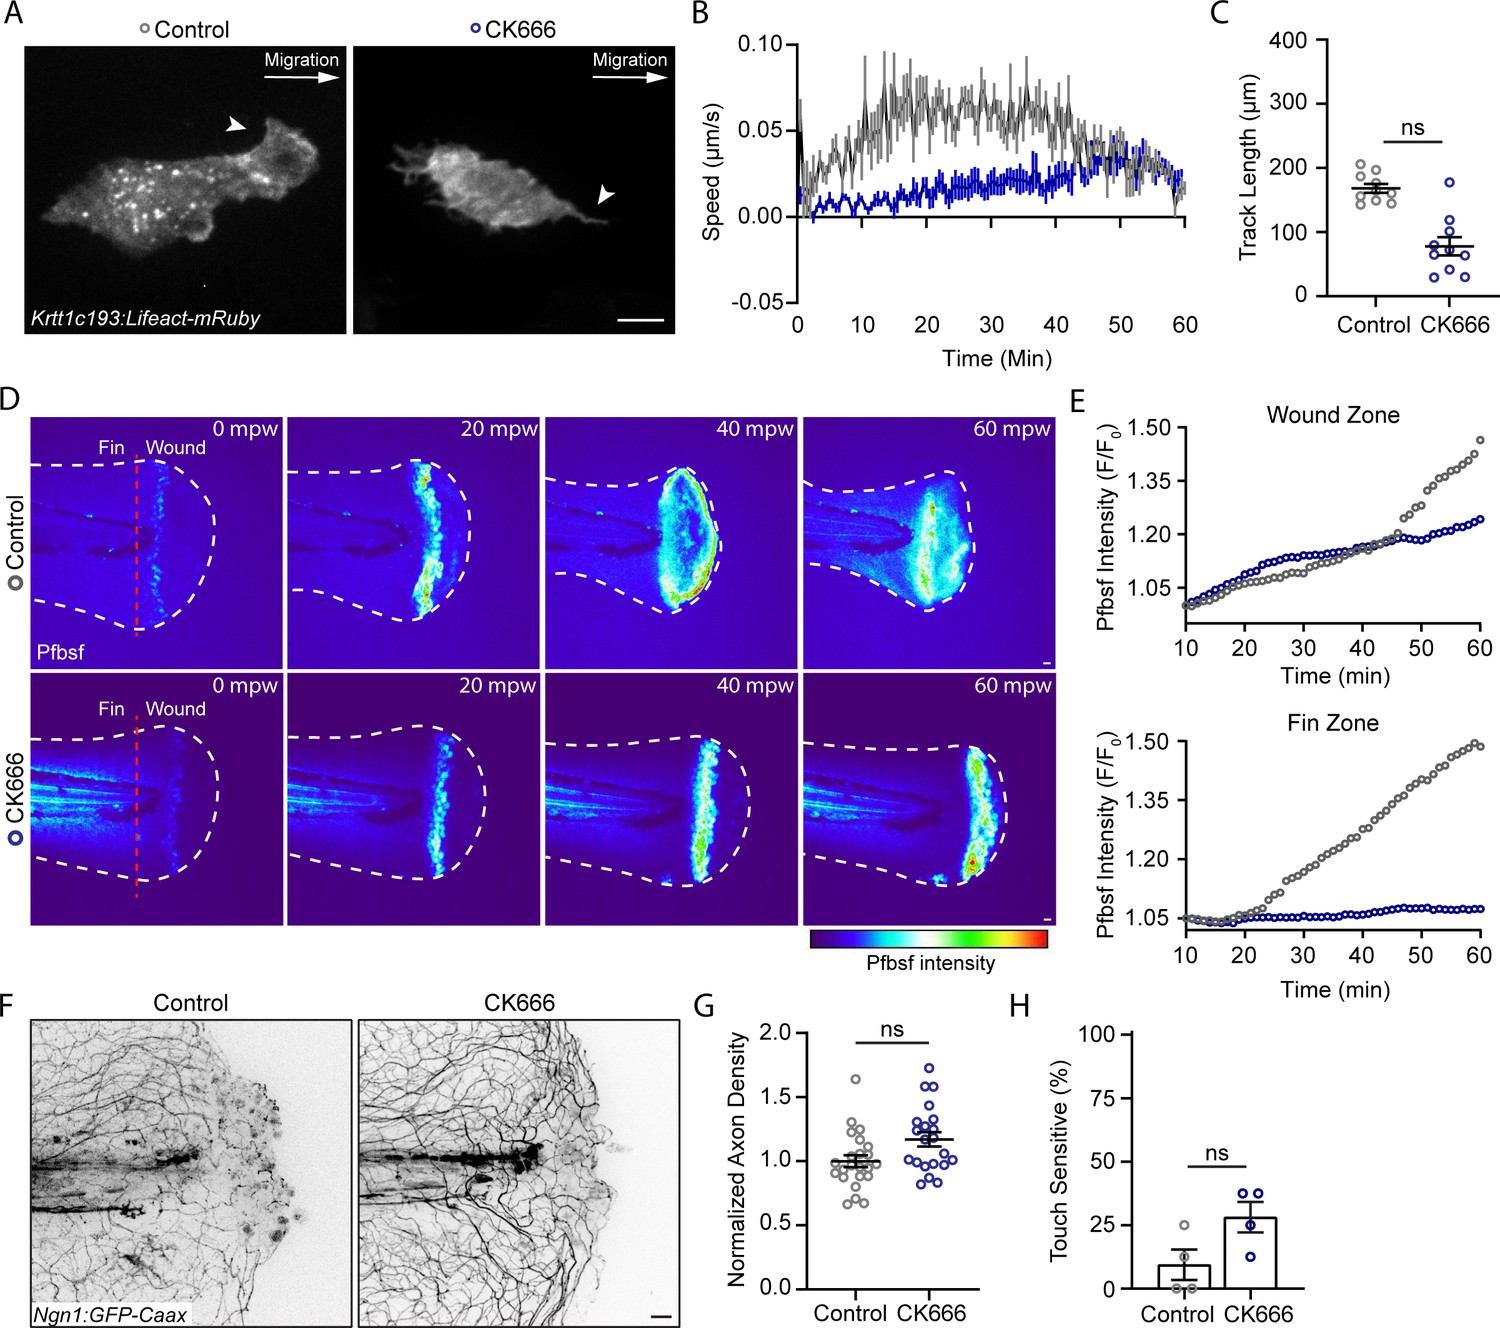
The Arp 2/3 inhibitor CK666 impairs early keratinocyte movement and alters the spatial distribution of reactive oxygen species signaling.
(A) Confocal max-projected images of control or CK666-treated transiently injected Tg(Krtt1c19e:Lifeact-mRuby) larvae. Arrows point to lamellipodia in the control larva, and lack of lamellipodia in the CK666-treated larva. Scale bar = 10 µm. (B) Plot of keratinocyte speed over 1 hr post-wound (hpw) as treated in A. N = 10 larvae each collected from three replicates. (C) Plot of keratinocyte distance moved over 1 hpw as treated in A. N = 10 larvae each collected from three replicates. (D) Confocal sum-projected time-series images of hydrogen peroxide level (pentafluorobenzenesulfonyl fluorescein [Pfbsf] intensity) in 1 larva over 1 hpw in the indicated treatment. (E) Quantification of Pfbsf intensity in the wound or fin area of the represented larva after burn injury as treated in D over 1 hpw. N = 1 representative larva per condition. (F) Confocal max-projected images of sensory axons 24 hpw in larvae wounded in control medium or CK666. (G) Quantification of axon density 24 hpw in larvae treated as in J. N>22 larvae per condition from four replicates. (H) Quantification of sensory perception 24 hpw in larvae treated as in J. N = 32 larvae per condition from four replicates. Unless otherwise specified, scale bars = 20 µm. ns = not significant.
-
Figure 4—source data 1
Numerical data for Figure 4B.
- https://cdn.elifesciences.org/articles/94995/elife-94995-fig4-data1-v1.xlsx
-
Figure 4—source data 2
Numerical data for Figure 4C.
- https://cdn.elifesciences.org/articles/94995/elife-94995-fig4-data2-v1.xlsx
-
Figure 4—source data 3
Numerical data for Figure 4E.
- https://cdn.elifesciences.org/articles/94995/elife-94995-fig4-data3-v1.xlsx
-
Figure 4—source data 4
Numerical data for Figure 4G.
- https://cdn.elifesciences.org/articles/94995/elife-94995-fig4-data4-v1.xlsx
-
Figure 4—source data 5
Numerical data for Figure 4H.
- https://cdn.elifesciences.org/articles/94995/elife-94995-fig4-data5-v1.xlsx
Figure 4—figure supplement 1
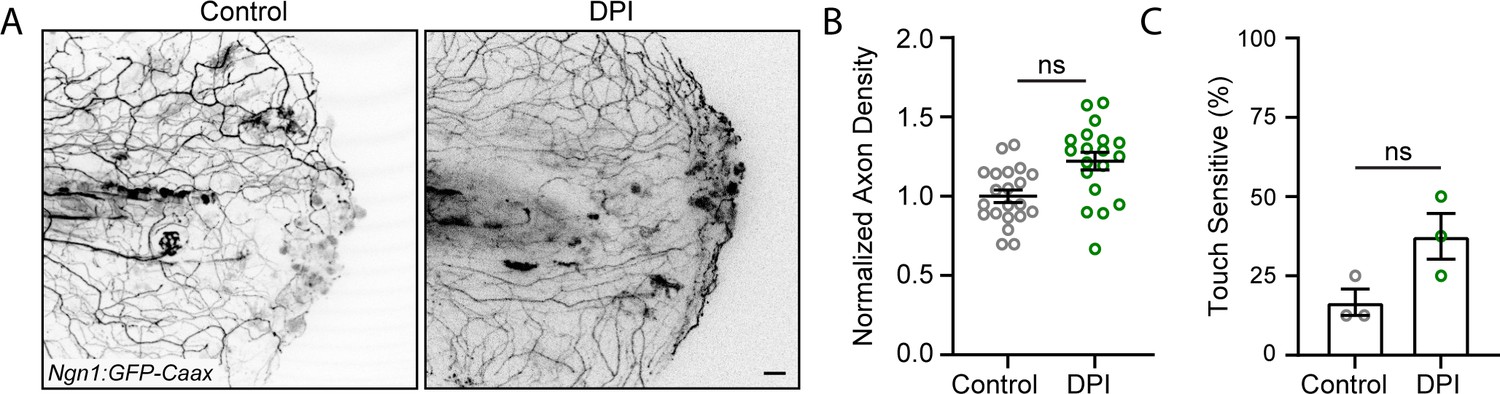
Early reactive oxygen species (ROS) inhibition is not sufficient to improve axon regeneration.
(A) Confocal max-projected images of sensory axons treated with diphenyleneiodonium (DPI). (B) Quantification of axon density 24 hr post-wound (hpw). N>19 larvae per condition from three replicates. (C) Quantification of sensory perception 24 hpw. N = 24 larvae each from three replicates. Scale bar = 20 µm. ns = not significant.
-
Figure 4—figure supplement 1—source data 1
Numerical data for Figure 4—figure supplement 1B.
- https://cdn.elifesciences.org/articles/94995/elife-94995-fig4-figsupp1-data1-v1.xlsx
-
Figure 4—figure supplement 1—source data 2
Numerical data for Figure 4—figure supplement 1C.
- https://cdn.elifesciences.org/articles/94995/elife-94995-fig4-figsupp1-data2-v1.xlsx
Figure 5
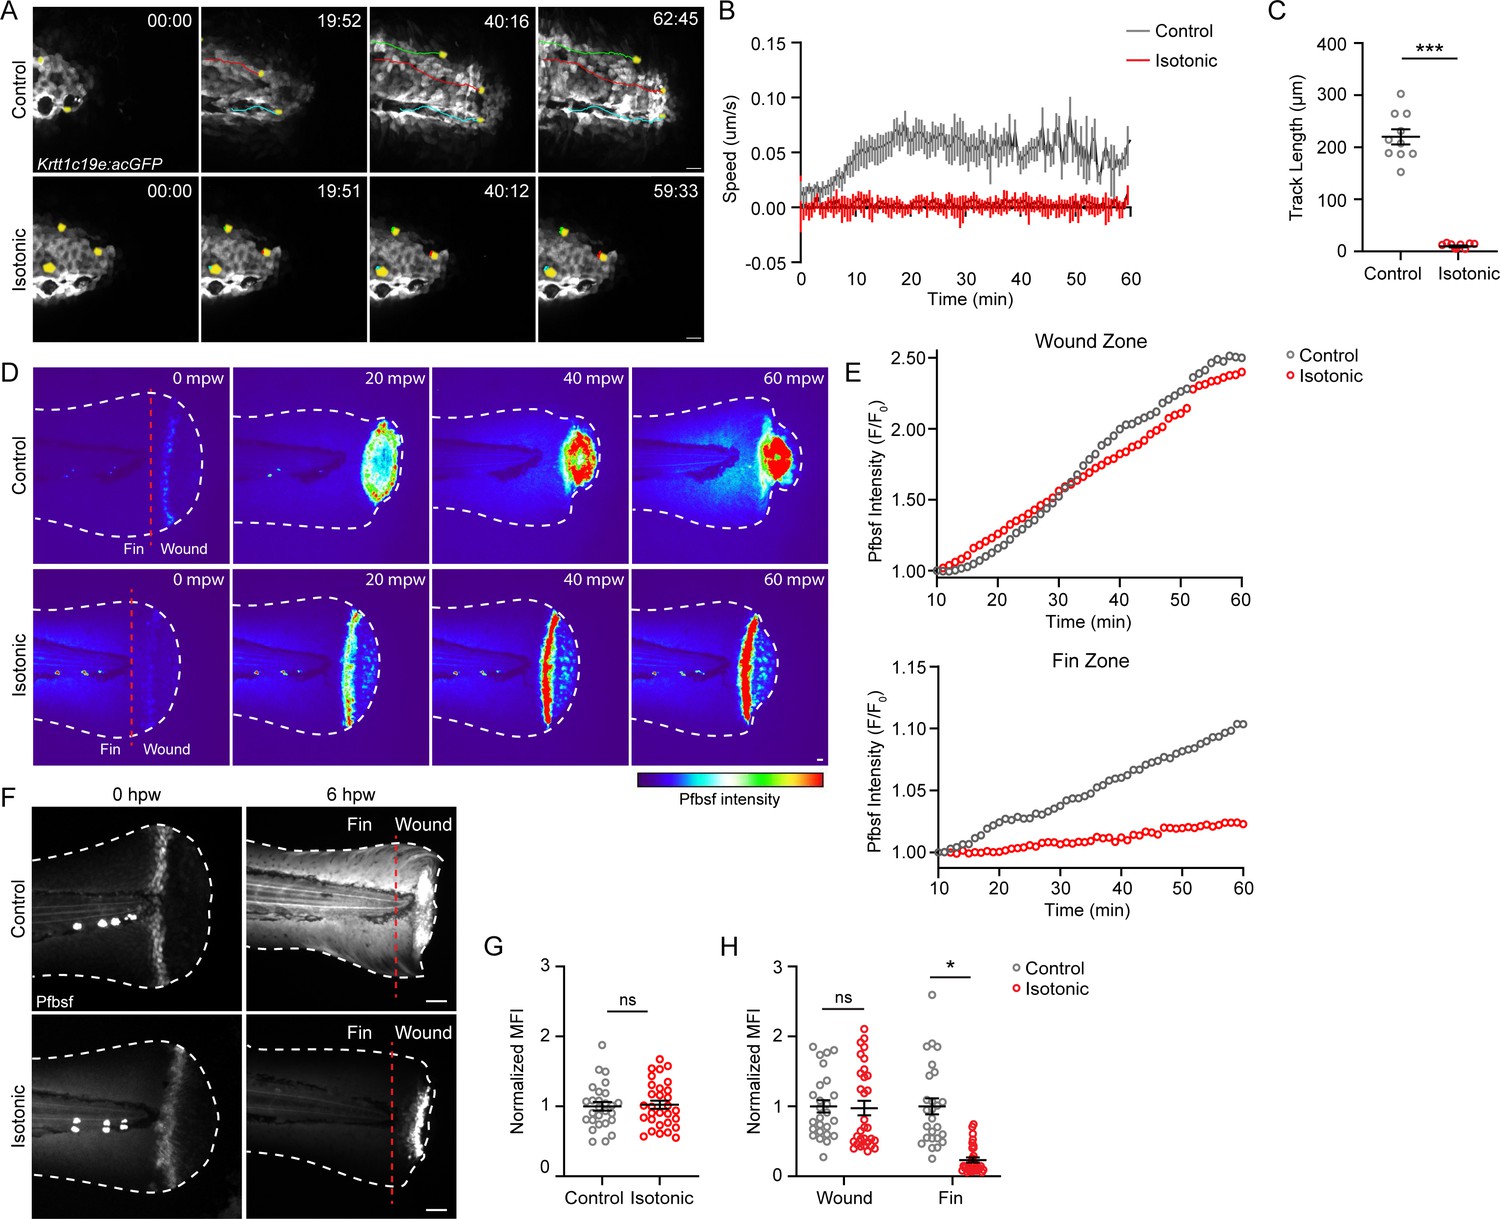
Treatment with isotonic solution inhibits keratinocyte migration and dampens reactive oxygen species (ROS) signaling.
(A) Confocal time-series images of basal keratinocyte movement in Tg(Krtt1c19e:acGFP) larvae over 1 hr post-wound (hpw) after burn injury in the indicated treatment. (B) Plot of basal keratinocyte average speed over 1 hpw treated as in A. N = 10 larvae per condition collected from three replicates. (C) Distance of keratinocyte movement over 1 hpw treated as in A. N = 10 larvae per condition collected from three replicates. (D) Confocal sum-projected, heat-mapped time-series images of hydrogen peroxide level (pentafluorobenzenesulfonyl fluorescein [Pfbsf] intensity) over 1 hpw as treated in A. (E) Quantification of Pfbsf intensity in the wound or fin area of the represented larva after burn injury as treated in D over 1 hpw. N = 1 representative larva per condition. (F) Confocal sum-projected images of Pfbsf intensity in the fin and wound zone either 0 or 6 hr following burn injury. Dashed red line denotes the boundary between the wound area and distal fin tissue. Scale bar = 50 µm. (G) Quantification of mean Pfbsf fluorescence intensity (MFI) immediately (0 hpw) after burn injury normalized to the control condition. N>27 larvae per condition from three replicates. (H) Quantification of MFI 6 hpw in the indicated region of the fin normalized to the control condition. N>26 larvae per condition from three replicates. Unless otherwise indicated, scale bars = 20 µM. *p<0.05, ***p<0.001, ns = not significant.
-
Figure 5—source data 1
Numerical data for Figure 5B.
- https://cdn.elifesciences.org/articles/94995/elife-94995-fig5-data1-v1.xlsx
-
Figure 5—source data 2
Numerical data for Figure 5C.
- https://cdn.elifesciences.org/articles/94995/elife-94995-fig5-data2-v1.xlsx
-
Figure 5—source data 3
Numerical data for Figure 5E.
- https://cdn.elifesciences.org/articles/94995/elife-94995-fig5-data3-v1.xlsx
-
Figure 5—source data 4
Numerical data for Figure 5G.
- https://cdn.elifesciences.org/articles/94995/elife-94995-fig5-data4-v1.xlsx
-
Figure 5—source data 5
Numerical data for Figure 5H.
- https://cdn.elifesciences.org/articles/94995/elife-94995-fig5-data5-v1.xlsx
Figure 6 with 1 supplement
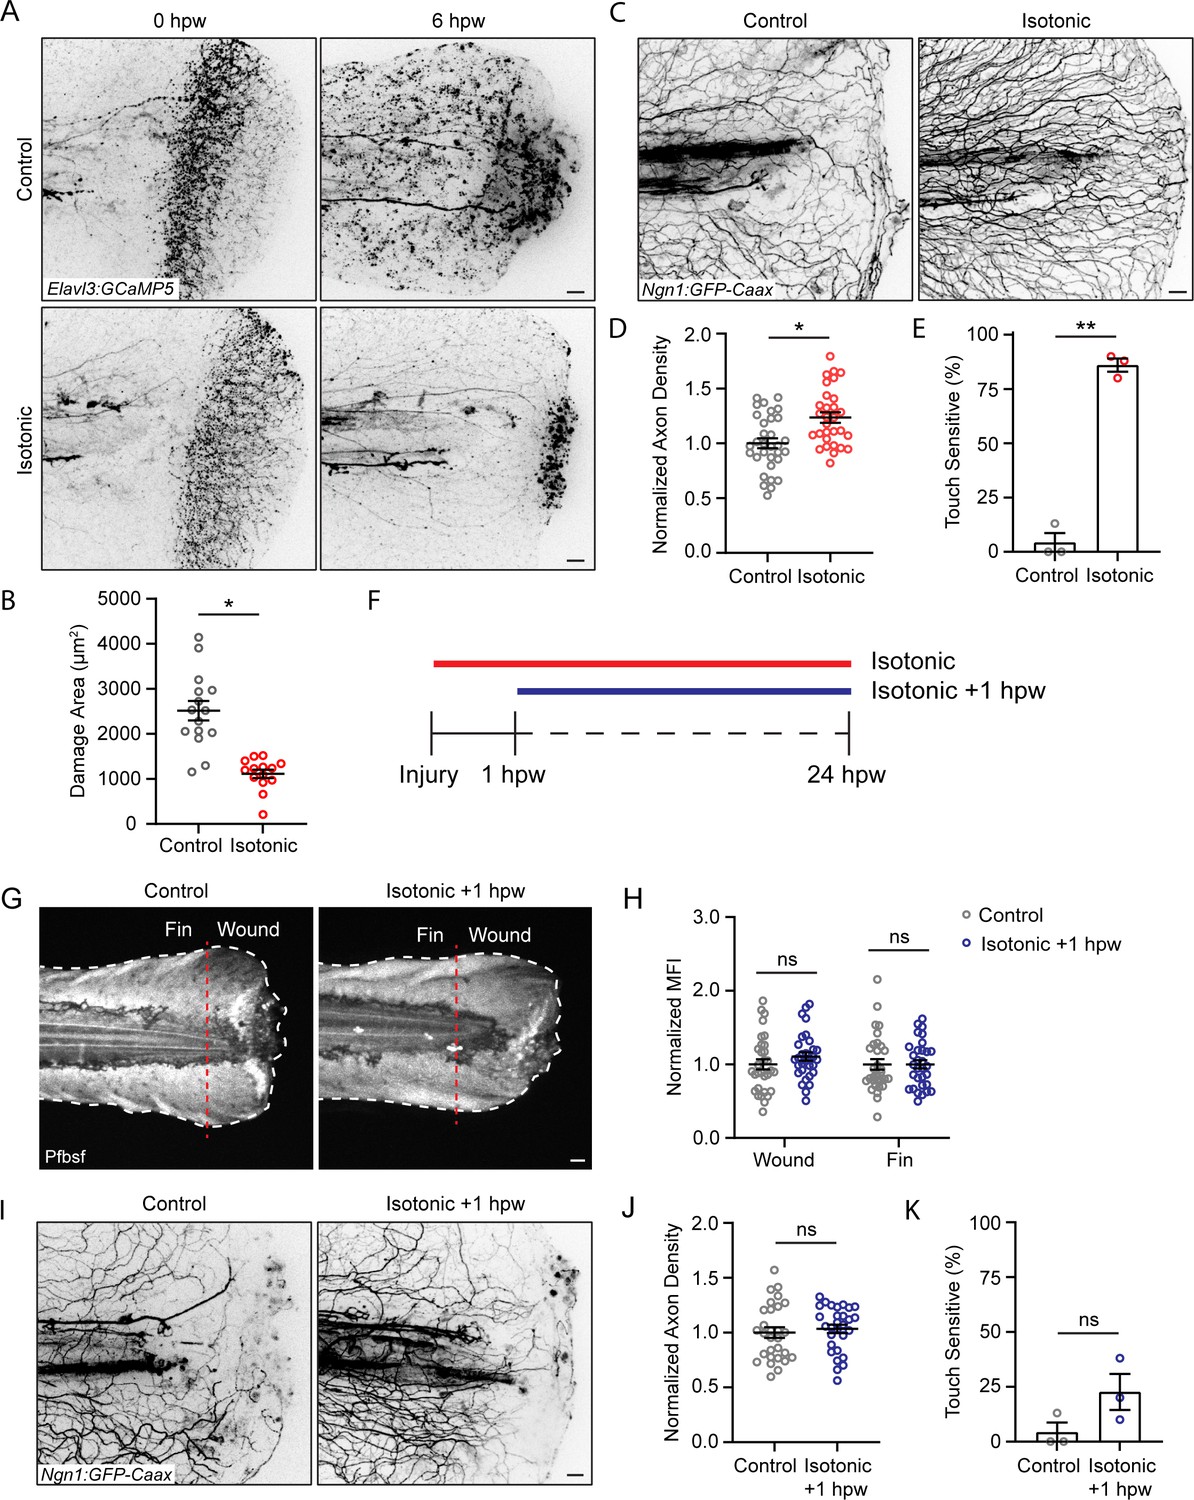
Isotonic treatment improves axon regeneration.
(A) Confocal max-projected images of axon damage in control or isotonic-treated Tg(Elavl3:GCaMP5) larvae 0 or 6 hr post-wound (hpw). (B) Quantification of axon damage in control and isotonic-treated burned fins at 6 hpw as treated in A. N = 16 larvae per condition from three replicates. (C) Confocal max-projected images of sensory axons in larvae 24 hpw as treated in A. (D) Quantification of axon density 24 hpw in larvae treated as depicted in C. N>30 larvae per condition from three replicates. (E) Quantification of sensory perception 24 hpw in larvae treated as in C. N = 24 larvae each from three replicates. (F) Schematic illustrating the different isotonic treatment paradigms that are being compared. (G) Confocal sum-projected images of pentafluorobenzenesulfonyl fluorescein [Pfbsf] intensity in control and isotonic +1 hpw treated burned larvae. Dashed red line denotes the boundary between the wound area and distal fin tissue. White dashed line denotes the fin. (H) Quantification of mean Pfbsf fluorescence intensity (MFI) 6 hpw in the indicated region of the fin normalized to the control condition. N = 31 larvae per condition from three replicates. (I) Confocal max-projected images of sensory axons 24 hpw in burned control or isotonic-treated larvae starting 1 hpw. (J) Quantification of axon density 24 hpw in larvae treated as in D. N = 29 larvae per condition from three replicates. (K) Quantification of sensory perception 24 hpw in larvae treated as in D. N = 24 larvae per condition from three replicates. Unless otherwise indicated, scale bars = 20 µm. *p<0.05, **p<0.01, ns = not significant.
-
Figure 6—source data 1
Numerical data for Figure 6B.
- https://cdn.elifesciences.org/articles/94995/elife-94995-fig6-data1-v1.xlsx
-
Figure 6—source data 2
Numerical data for Figure 6D.
- https://cdn.elifesciences.org/articles/94995/elife-94995-fig6-data2-v1.xlsx
-
Figure 6—source data 3
Numerical data for Figure 6E.
- https://cdn.elifesciences.org/articles/94995/elife-94995-fig6-data3-v1.xlsx
-
Figure 6—source data 4
Numerical data for Figure 6H.
- https://cdn.elifesciences.org/articles/94995/elife-94995-fig6-data4-v1.xlsx
-
Figure 6—source data 5
Numerical data for Figure 6J.
- https://cdn.elifesciences.org/articles/94995/elife-94995-fig6-data5-v1.xlsx
-
Figure 6—source data 6
Numerical data for Figure 6K.
- https://cdn.elifesciences.org/articles/94995/elife-94995-fig6-data6-v1.xlsx
Figure 6—figure supplement 1
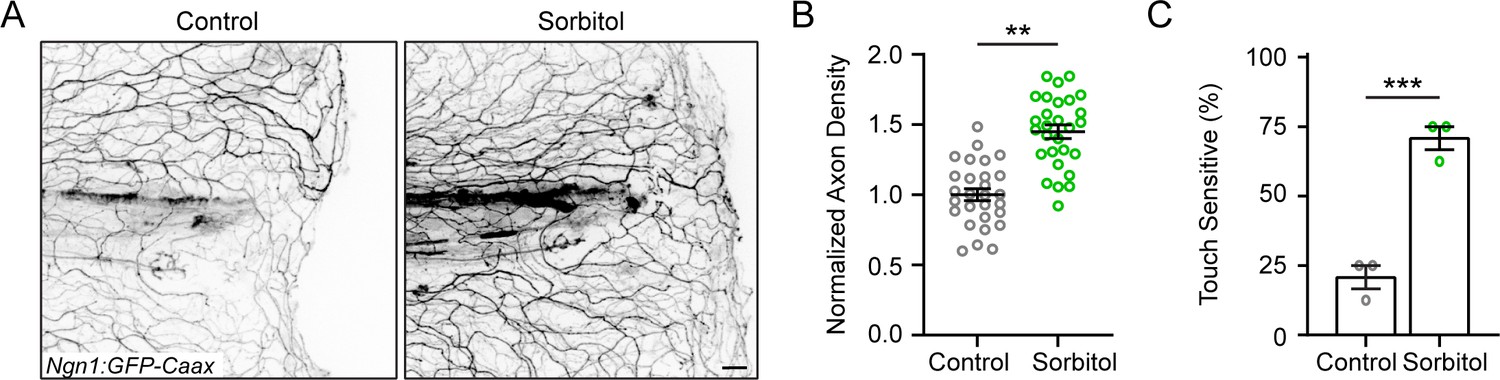
Keratinocyte movement after injury and effect of D-Sorbitol on sensory axon regeneration.
(A) Representative max-projected confocal images of sensory axons in control and isotonic D-Sorbitol-treated larvae 24 hr post-wound (hpw). (B) Quantification of axon density in wounded tissue 24 hpw. N = 28 larvae each from four replicates. (C) Quantification of sensory perception 24 hpw. N = 24 larvae each collected from four replicates. Scale bar = 20 µm. **p<0.01, ***p<0.001,.
-
Figure 6—figure supplement 1—source data 1
Numerical data for Figure 6—figure supplement 1B.
- https://cdn.elifesciences.org/articles/94995/elife-94995-fig6-figsupp1-data1-v1.xlsx
-
Figure 6—figure supplement 1—source data 2
Numerical data for Figure 6—figure supplement 1C.
- https://cdn.elifesciences.org/articles/94995/elife-94995-fig6-figsupp1-data2-v1.xlsx
Appendix 1—figure 1
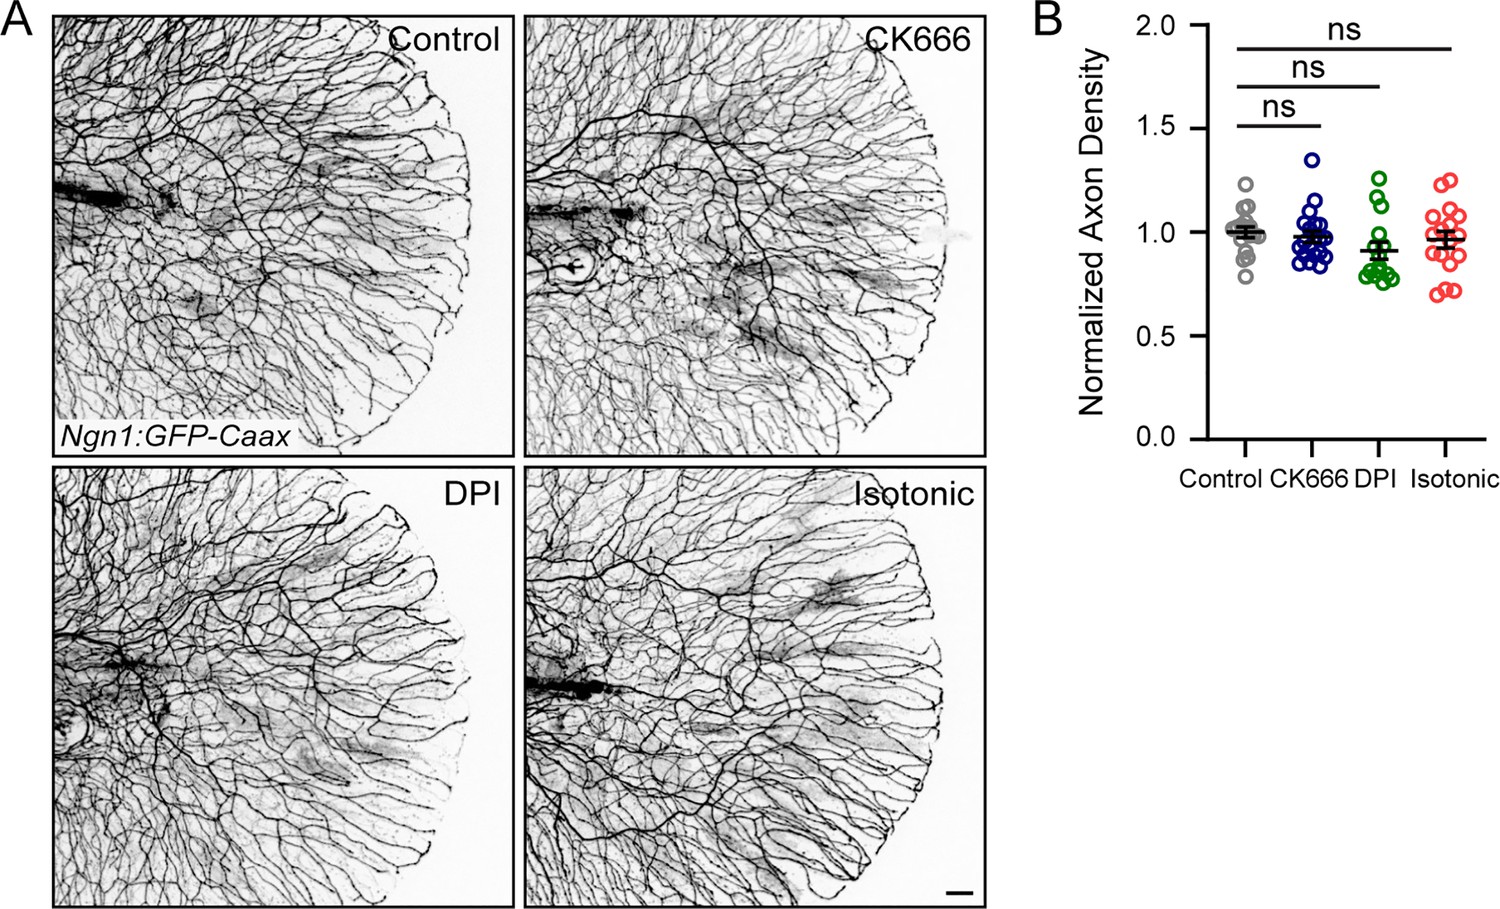
Drug treatments do not affect axon density in unwounded larvae.
(A) Representative max-projected confocal images of sensory axons in unwounded, drug-treated 4 dpf larvae. (B) Quantification of axon density in larvae treated as stated in E. N>15 larvae each from 3 replicates. Scale bar = 20 µm. ns = not significant.
-
Appendix 1—figure 1—source data 1
Numerical data for Appendix 1—figure 1.
- https://cdn.elifesciences.org/articles/94995/elife-94995-app1-fig1-data1-v1.xlsx
-
Appendix 1—figure 1—source data 2
Numerical data for Appendix 1—figure 1.
- https://cdn.elifesciences.org/articles/94995/elife-94995-app1-fig1-data2-v1.xlsx
Author response image 1

Author response image 2

Videos
Video 1
Burn injury induces keratinocyte movement.
Tg(Krt4:UtrCH-GFP) larvae were injured either by tailfin transection (left) or burn (right). While minimal keratinocyte movement is observed following transection, burn injury results in keratinocyte movement toward the wound edge for approximately 1 hr post-wound. Yellow pseudocolored cells indicate representative keratinocyte movement. Images were collected at 2 frames/min. Scale bar = 20 µm.
Video 2
Sensory axons move with associated keratinocytes following injury.
Basal keratinocyte (magenta), Tg(Krtt1c19e:Lifeact-Ruby), and sensory axon (cyan), Tg(Ngn1:GFP-Caax), movement was tracked following burn injury. Arrows highlight regions where keratinocyte and sensory axon movement is spatially coincident. Images were collected at 3 frames/min. Scale bar = 10 µm.
Video 3
Tissue movement is associated with axonal damage following burn injury.
Tg(Elavl3:GCaMP5) larva was burn wounded to track axonal damage, indicated by elevated intracellular calcium (black dots). Damage present at time 0 min is due to the burn wound itself, while new axonal damage coincides with keratinocyte movement. Images collected at 2 frames/min. Scale bar = 20 µm.
Video 4
Wounding in isotonic medium prevents burn-induced keratinocyte movement.
Basal keratinocyte, Tg(Krtt1c19e:acGFP), movement was tracked in control (left) and isotonic-treated (right) larvae following burn injury. Wounding in the presence of isotonic medium prevents keratinocyte movement associated with burn wounding. Yellow pseudocolored cells indicate representative keratinocyte movement. Images were collected at 2 frames/min. Scale bar = 20 µm.
Tables
Key resources table
| Reagent type (species) or resource | Designation | Source or reference | Identifiers | Additional information |
|---|---|---|---|---|
| Strain background (D. rerio) | WT (AB) | ZIRC | ZL1 | https://zebrafish.org/home/guide.php |
| Strain background (D. rerio) | Tg(Ngn1:GFP-Caax) | Blader et al., 2003 | ||
| Strain background (D. rerio) | Tg(Krt4:LifeAct-mRuby) | Lam et al., 2015 | ||
| Strain background (D. rerio) | Tg(Krt4:UtrCH-GFP) | Lam et al., 2015 | ||
| Strain background (D. rerio) | Tg(Krt4:TdTomato) | Huttenlocher lab | ||
| Strain background (D. rerio) | TgBac(Lamc1:Lamc1-sfGFP) | Yamaguchi et al., 2022 | ||
| Strain background (D. rerio) | Tg(ElavI3:GCaMP5) | Akerboom et al., 2012 | Received from Jan Huisken lab | |
| Strain background (D. rerio) | Tg(Krtt1c19e:LifeAct-mRuby) | This paper | ||
| Strain background (D. rerio) | Tg(Krtt1c19e:acGFP) | Lee et al., 2014 | Received from Alvaro Sagasti lab | |
| Chemical compound, drug | FM 1-43 dye | Life Technologies | ||
| Chemical compound, drug | NaCl | Fisher Scientific | CAS 7647-14-5 | |
| Chemical compound, drug | D-Sorbitol | Sigma-Aldrich | CAS 50-70-4 | |
| Chemical compound, drug | CK666 (Arp2/3 inhibitor) | Sigma-Aldrich | CAS 442633-00-3 | |
| Chemical compound, drug | Sodium Azide | Fisher Scientific | CAS 26628-22-8 | |
| Chemical compound, drug | Pentafluorobenzenesulfonyl fluorescein | Santa Cruz | CAS 728912-45-6 | |
| Other | Cautery pen, fine tip | Bovie | AA01 | https://www.delasco.com/geiger/ |
| Other | Surgical blade No. 10 | Feather | 2976 | |
| Software, algorithm | GraphPad Prism | RRID:SCR_002798 | https://www.graphpad.com/scientific-software/prism/ | |
| Software, algorithm | Fuji, ImageJ | Schneider et al., 2012 | RRID:SCR_002285 | https://fiji.sc/ |
Additional files
-
MDAR checklist
- https://cdn.elifesciences.org/articles/94995/elife-94995-mdarchecklist1-v1.docx
-
Source data 1
Primer source data.
- https://cdn.elifesciences.org/articles/94995/elife-94995-data1-v1.xlsx
-
Appendix 1—figure 1—source data 1
Numerical data for Appendix 1—figure 1.
- https://cdn.elifesciences.org/articles/94995/elife-94995-app1-fig1-data1-v1.xlsx
-
Appendix 1—figure 1—source data 2
Numerical data for Appendix 1—figure 1.
- https://cdn.elifesciences.org/articles/94995/elife-94995-app1-fig1-data2-v1.xlsx
Download links
A two-part list of links to download the article, or parts of the article, in various formats.
Downloads (link to download the article as PDF)
Open citations (links to open the citations from this article in various online reference manager services)
Cite this article (links to download the citations from this article in formats compatible with various reference manager tools)
Damage-induced basal epithelial cell migration modulates the spatial organization of redox signaling and sensory neuron regeneration
eLife 13:RP94995.
https://doi.org/10.7554/eLife.94995.3


