Unraveling the power of NAP-CNB’s machine learning-enhanced tumor neoantigen prediction
- Centro Nacional de Biotecnología, Consejo Superior de Investigaciones Científicas, Spain
- Departamento de Bioingenieria, Universidad Carlos III de Madrid, Leganés, Spain
- University of Oxford, Department of Statistics & XChem, United Kingdom
- Catalan Institute of Oncology (ICO), Oncobell Program, Bellvitge Biomedical Research Institute (IDIBELL), L'Hospitalet de Llobregat, Spain
- University Hospital Lozano Blesa, Aragon Health Research Institute (IISA), ARAID Foundation, Aragon Government, Spain
- Procure Program, Institut Català d'Oncologia-Oncobell Program, Catalan Institute of Oncology (ICO), Oncobell Program, Bellvitge Biomedical Research Institute (IDIBELL), L'Hospitalet de Llobregat, Spain
Figures
Figure 1
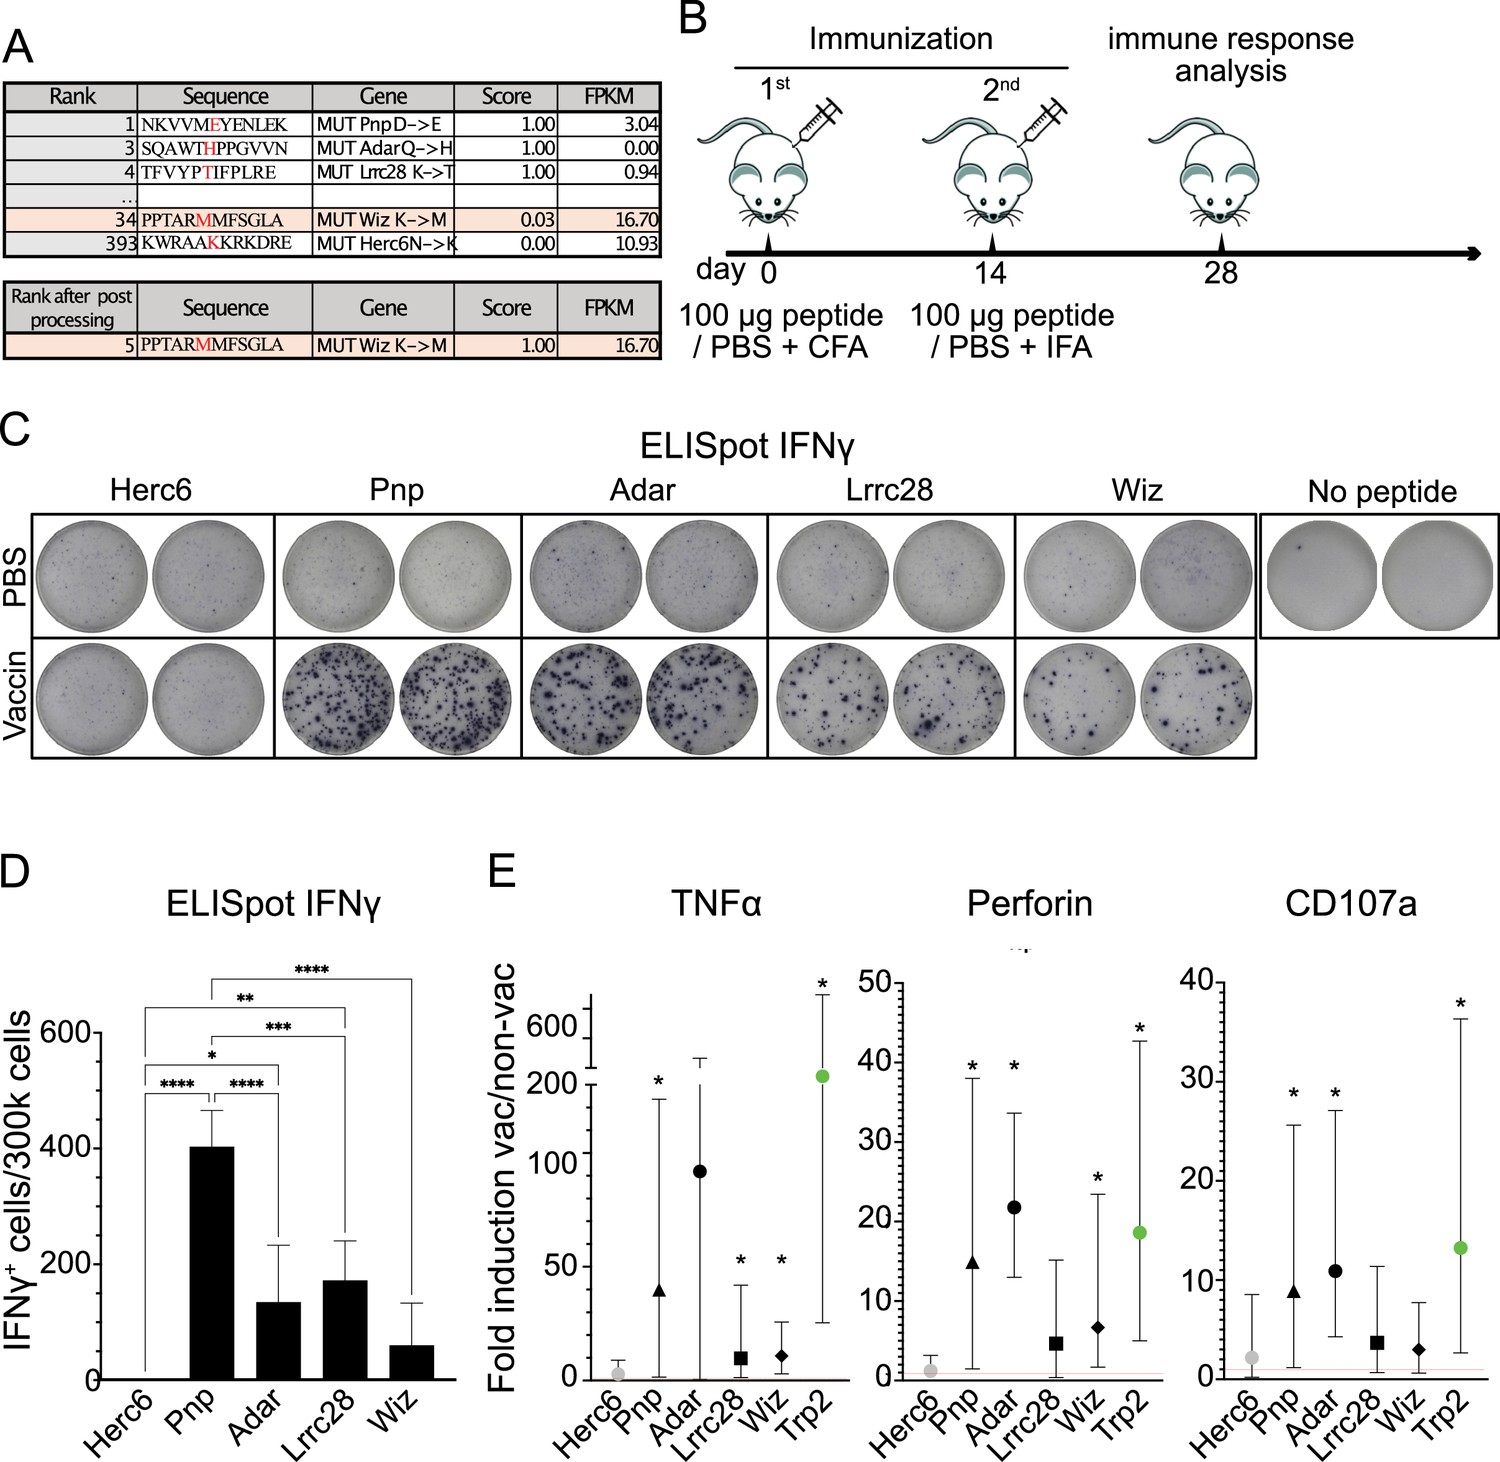
Vaccination-induced immune responses.
(A) Putative B16 tumor neoantigen (TNA) identified by using the NAP-CNB platform ranked by scores of peptide sequences for a complete 12mer sequence. The TNA sequence, the mutation exclusive to tumor cells (in red), and gene name are shown. The gene expression is quantified as fragments per kilobase million (FPKM). The TNA score is also indicated. (B) Scheme of immunization. Two doses of peptides emulsified in Freund’s adjuvant were subcutaneously (s.c.) injected, separated by 14 days. 14 days after the last dose the efficacy of the vaccine was analyzed by enzyme-linked immunosorbent spot (ELISpot) and intracellular cytokine staining (ICS) assays. (C) ELISpot analysis of interferon-gamma (IFNγ)-producing T-cell effectors from mice vaccinated with the indicated mutated peptides. The upper images show the response of non-vaccinated (phosphate-buffered saline [PBS]) animals after stimulation with the indicated peptides, the bottom images show the response of the animals vaccinated (vaccin) with the indicated peptides after restimulation with the same peptides. It is shown duplicates from representative animals. (D) As in C but showing the mean and sd of 5 mice/group. Asterisks indicate statistically significant differences analyzed by one-way ANOVA (* represent p<0.05, **p<0.005, ***p<0.0005). (E) ICS analysis of CD8+ T-cells expressing tumor necrosis factor alpha (TNFα), perforin, or CD107a from mice vaccinated with the indicated mutated peptides: *Pnp (black triangle), *Adar (black circle), *Lrrc28 (black square), *Wiz (black rhombus), *Herc6 (gray circle), and Trp2 (green circle). The mean of the ratio of vaccinated divided by unvaccinated is shown, as the 95% confidence intervals. Intervals that do not include 1 and are therefore statistically significant are marked with *. 5 mice/group were used.
-
Figure 1—source data 1
Original data of Figure 1C-E.
- https://cdn.elifesciences.org/articles/95010/elife-95010-fig1-data1-v1.zip
Figure 2
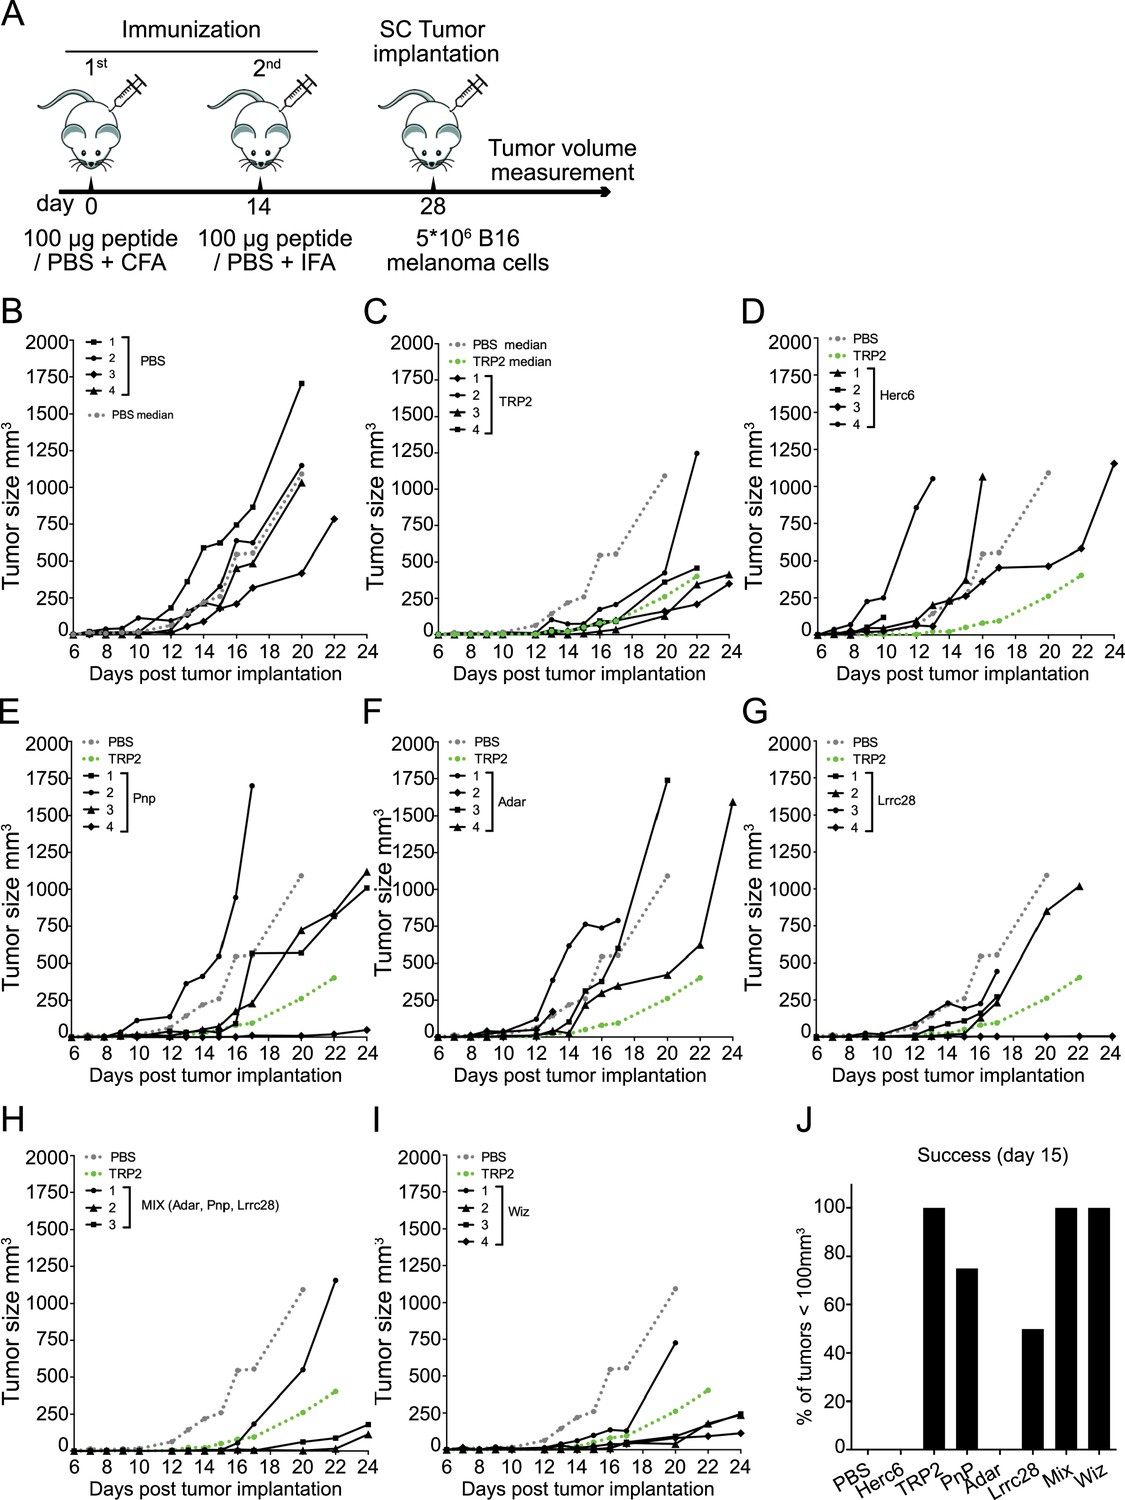
Antitumor activity of vaccination with predicted tumor neoantigen (TNA).
(A) Scheme of immunization. Two doses of peptides emulsified in Freund’s adjuvant were subcutaneously (s.c.) injected, separated by 14 days. 14 days after the last dose the B16 F10 melanoma cells were injected s.c. in the mid-right flank of C57BL/6J host mice and the tumor size over time was analyzed using a dial caliper. (B–I) Tumor growth on non-vaccinated (B) or vaccinated mice with the indicated peptide (C–I) (or peptide mix (H)), monitored every 1–3 days. Each line corresponds to the tumor size in one animal. The median of the tumors in non-vaccinated (phosphate-buffered saline [PBS]) and vaccinated with Trp2 (positive control) are shown as dashed lines in gray and green color, respectively. Mice with tumors≥900 mm3 were sacrificed. Following the rules of our ethical committee, animals presenting ulcers were also sacrificed. (J) Percentage of animals showing tumors with a volume≤100 mm3 15 days after implantation. 4 mice/group were used.
-
Figure 2—source data 1
Original data of Figure 2B-J.
- https://cdn.elifesciences.org/articles/95010/elife-95010-fig2-data1-v1.zip
Figure 3
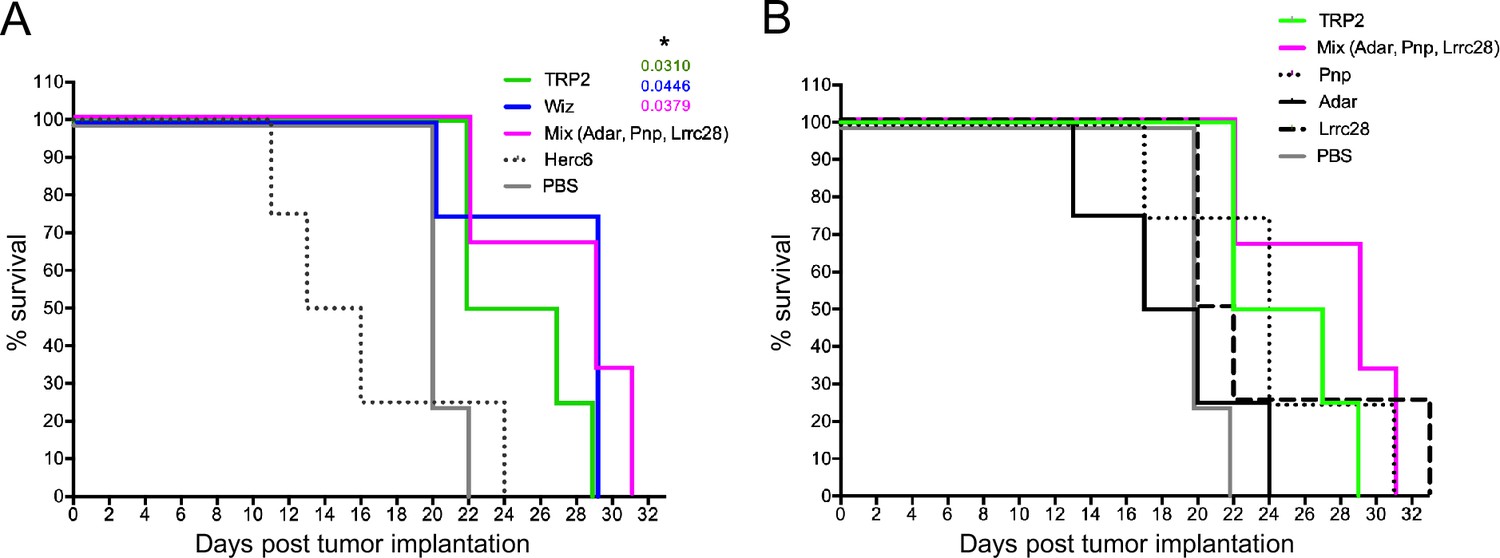
Survival curves of vaccinated mice.
(A, B) Kaplan-Meier survival curves of mice vaccinated with the indicated tumor neoantigen (TNA) peptides and challenged with B16 F10 melanoma.
Comparison of survival curves has been performed using the log-rank (Mantel-Cox) test. The significant p values comparing the control (phosphate-buffered saline [PBS]) group with each other group are indicated and * represents p<0.05. 4 mice/group were used.
-
Figure 3—source data 1
Original data of Figure 3.
- https://cdn.elifesciences.org/articles/95010/elife-95010-fig3-data1-v1.zip
Author response image 1

Post-processing pipeline to increase the number of putative neoantigens.
Sequences can either be predicted using the forward method, for which a raw score is produced, or it can be introduced to a majority-vote prediction of the ensemble prediction of similar protein sequences.
Tables
Author response table 1
Sequence symbol gene prediction fragments per kilobase million (FPKM).
| PPTARMMFSGLA Wiz | ENSMUSG000000024050 1 | 16,7001 |
|---|---|---|
| NKVVMEYENLEK Pnp | ENSMUSG00000115338 1 | 3,03912 |
| TFVYPTIFPLRE Lrrc28 | ENSMUSG00000030556 1 | 0,941842 |
| SQAWTHPPGVVN Adar | ENSMUSG00000027951 1 | 0 |
| KASGFRYNVLSC Nr1h2 | ENSMUSG00000060601 1 | 0 |
| FVPGPSFWGLVN Car11 | ENSMUSG00000003273 1 | 0 |
Additional files
Download links
A two-part list of links to download the article, or parts of the article, in various formats.
Downloads (link to download the article as PDF)
Open citations (links to open the citations from this article in various online reference manager services)
Cite this article (links to download the citations from this article in formats compatible with various reference manager tools)
Unraveling the power of NAP-CNB’s machine learning-enhanced tumor neoantigen prediction
eLife 13:RP95010.
https://doi.org/10.7554/eLife.95010.3


