Rapid and inducible mislocalization of endogenous TDP43 in a novel human model of amyotrophic lateral sclerosis
- Living Systems Institute, University of Exeter, United Kingdom
- Biosciences, University of Exeter, United Kingdom
- Clinical and Biomedical Sciences, University of Exeter, United Kingdom
Figures
Figure 1 with 2 supplements
A human induced pluripotent stem cell (iPSC)-based model of TDP43 proteinopathy in Mns.
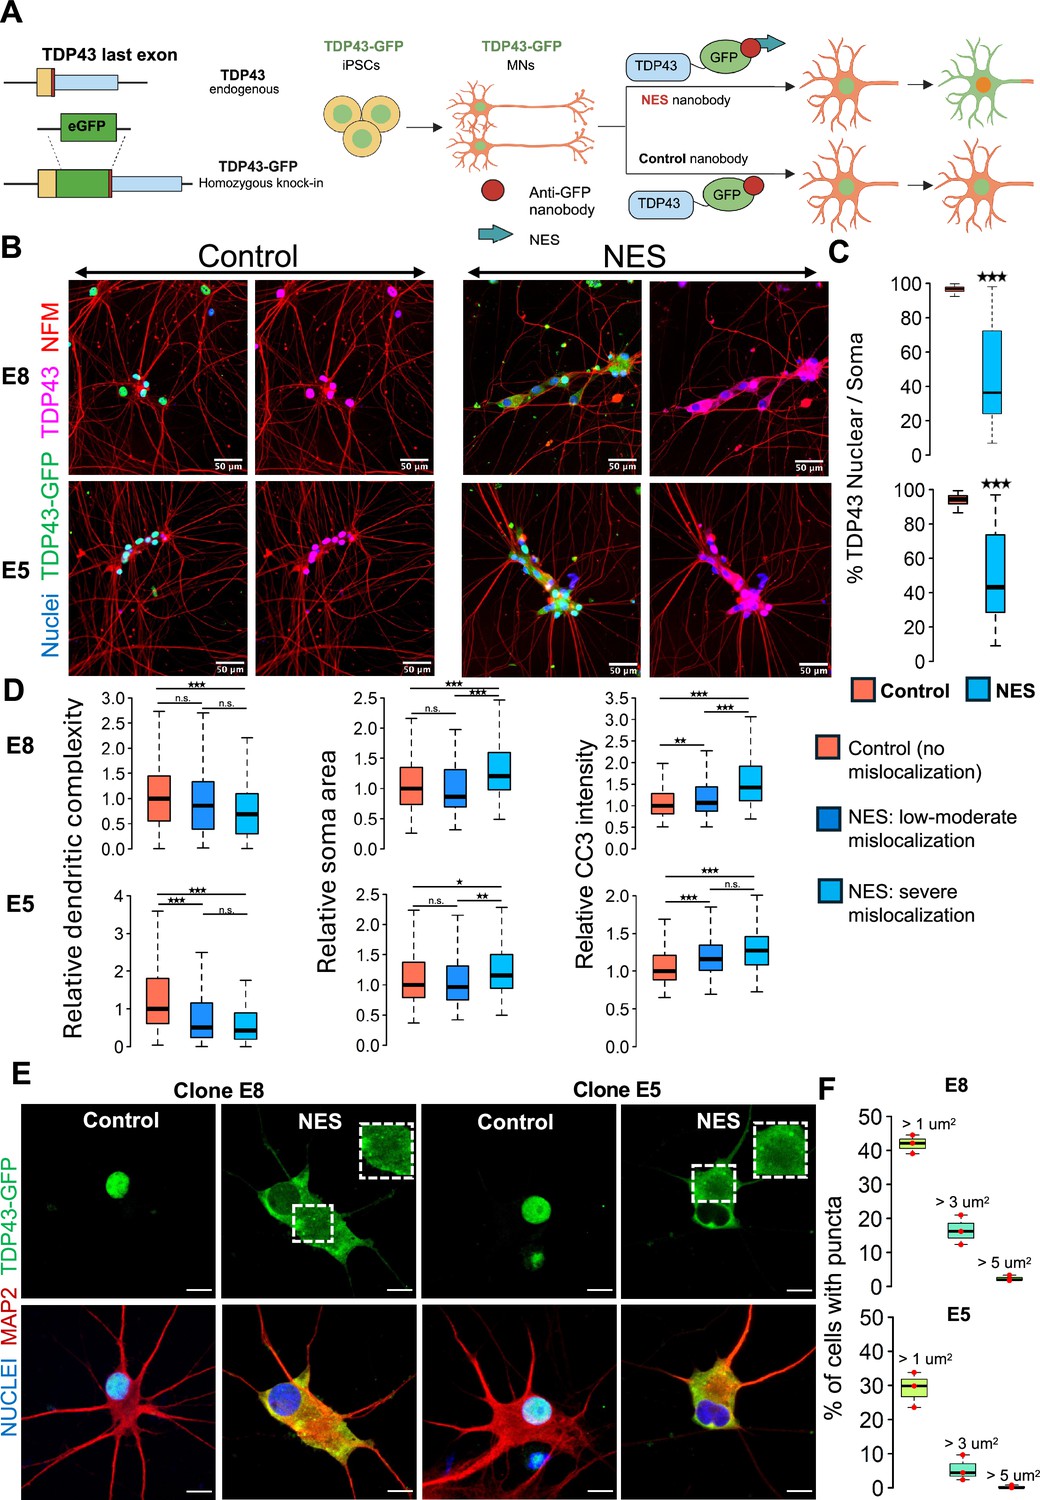
(A) Schematic depicting genome editing of healthy iPSCs to knock-in GFP into the C-terminus of endogenous TARDBP, encoding TDP43. Yellow rectangle indicates the TDP43 last exon. Red vertical line indicates the STOP codon. Blue rectangle indicates the TDP43 3’UTR. The resulting TDP43-GFP iPSCs are differentiated into motor neurons (MNs) and transduced with adeno-associated viruses (AAVs) encoding anti-GFP nanobodies. The ‘nuclear export signal (NES)’ nanobody includes a sequence for a strong nuclear export signal, which transports nuclear TDP43-GFP into the cytoplasm. The control nanobody (lacking NES) has no effect on TDP43-GFP localization. Panel created in BioRender. (B) Representative images depicting TDP43 localization in two homozygous TDP43-GFP lines (E8, E5). MNs were transduced at day 20 of the differentiation process and fixed at day 40 for the immunostaining. TDP43 is expressed in the nucleus in the presence of the control nanobody and relocates to the cytoplasm in the presence of the NES nanobody. TDP43-GFP indicates signal from the anti-GFP antibody while TDP43 indicates signal from the anti-TDP43 antibody. Neurons were also stained with neurofilament-M (red) and Hoechst 33342 (blue nuclear stain). Scale bar = 50 µm. (C) Quantification of the % of nuclear TDP43 intensity over total TDP43 intensity in the nucleus + soma in individual neurons transduced with control or NES nanobodies. (D) Quantification of morphological defects and cleaved caspase 3 (CC3) levels in NES nanobody-treated MNs versus control. Mislocalized TDP43 (NES) causes a reduction in dendritic complexity (D), soma swelling, and elevation of CC3 levels, compared to neurons expressing nuclear TDP43 (control). Low-to-moderate mislocalization indicates neurons with >40% nuclear TDP43. Severe mislocalization indicates neurons with <40% nuclear TDP43. Measurements were normalized to data from the control nanobody condition. Panels C and D display data for the two homozygous TDP43-GFP lines (E8 and E5), transduced with nanobodies at day 20 and fixed for staining at day 40. N=3 independent differentiations per clone. At least 100 neurons were included per condition. (E) Representative images showing cytoplasmic TDP43 puncta at day 40 in homozygous TDP43-GFP MNs transduced with the NES nanobody at day 18. Scale bar = 15 µm. Images were captured with the Zeiss LSM880 Airyscan. (F) Quantification of the percentage of NES-expressing neurons displaying TDP43 puncta. The largest punctum per neuron was used for the analysis. Upper panel shows data for E8 neurons, while lower panel displays data for E5 neurons. N=3 independent differentiations per clone. At least 100 neurons were included per clone for the analysis. * indicates p<0.01, ** indicates p<0.001, *** indicates p<0.0001.
-
Figure 1—source code 1
R script to analyse CC3 intensities for clone E5 motor neuron (MN).
- https://cdn.elifesciences.org/articles/95062/elife-95062-fig1-code1-v1.zip
-
Figure 1—source code 2
R script to analyse CC3 intensities for clone E8 motor neuron (MN).
- https://cdn.elifesciences.org/articles/95062/elife-95062-fig1-code2-v1.zip
-
Figure 1—source code 3
R script to analyse dendritic complexity for clone E5 motor neuron (MN).
- https://cdn.elifesciences.org/articles/95062/elife-95062-fig1-code3-v1.zip
-
Figure 1—source code 4
R script to analyse dendritic complexity for clone E8 motor neuron (MN).
- https://cdn.elifesciences.org/articles/95062/elife-95062-fig1-code4-v1.zip
Figure 1—figure supplement 1
Validation of the TDP43-GFP iPSCs.
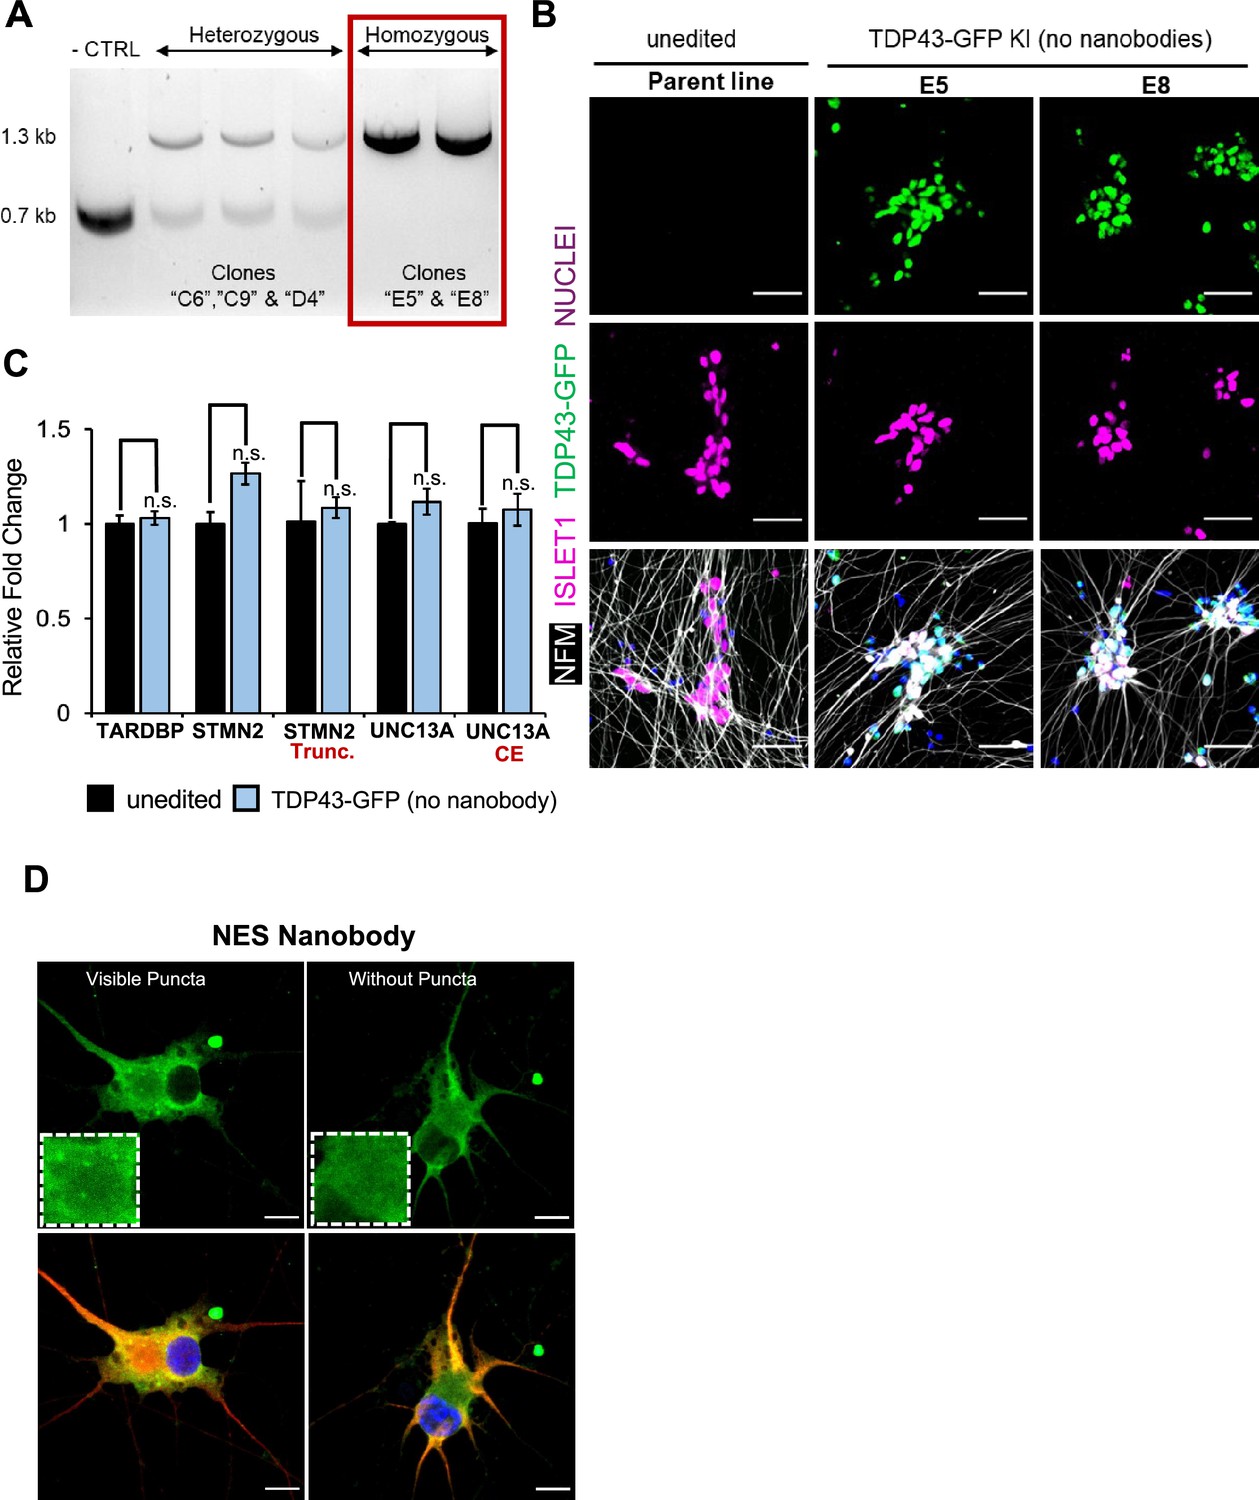
(A) Confirmation of three heterozygous and two homozygous TDP43-GFP knock-in clones using PCR-gel electrophoresis. The unedited parent healthy induced pluripotent stem cells (iPSCs) served as a control. Homozygous ‘E5’ and ‘E8’ clones were selected. (B) Representative images of the unedited parent line and untransduced TDP43-GFP homozygous clones E8 and E5. Neurons were stained for MN markers neurofilament-M (NFM) and ISLET1 (ISL1) at day 20. Nuclei were stained with Hoechst 33342. Scale bar = 50 µm. (C) RT-qPCR of unedited (parent) iPSC-motor neurons (MNs) and untransduced homozygous TDP43-GFP knock-in MNs at day 30, suggesting no adverse effects of GFP knock-in on TDP43 expression or alternative splicing. N=3 independent differentiations for each of the unedited and TDP43-GFP (two of E5, one of E8) lines. P-values were calculated using a one-tailed Student’s t-test. Error bars show SEM. None of the differences were significant. n.s.=not significant. (D) Representative images of the E5 homozygous TDP43-GFP line showing a cell with and without cytoplasmic puncta. Cells were fixed and stained at D40, 22 days post-transduction. Scale bar = 15 µm.
-
Figure 1—figure supplement 1—source data 1
screen for TDP43-GFP KI clones shown in Figure 1—figure supplement 1A.
- https://cdn.elifesciences.org/articles/95062/elife-95062-fig1-figsupp1-data1-v1.zip
-
Figure 1—figure supplement 1—source data 2
Original gel files for PCR screen shown in Figure 1—figure supplement 1A.
- https://cdn.elifesciences.org/articles/95062/elife-95062-fig1-figsupp1-data2-v1.zip
Figure 1—figure supplement 2
Phenotypic validation of the model.
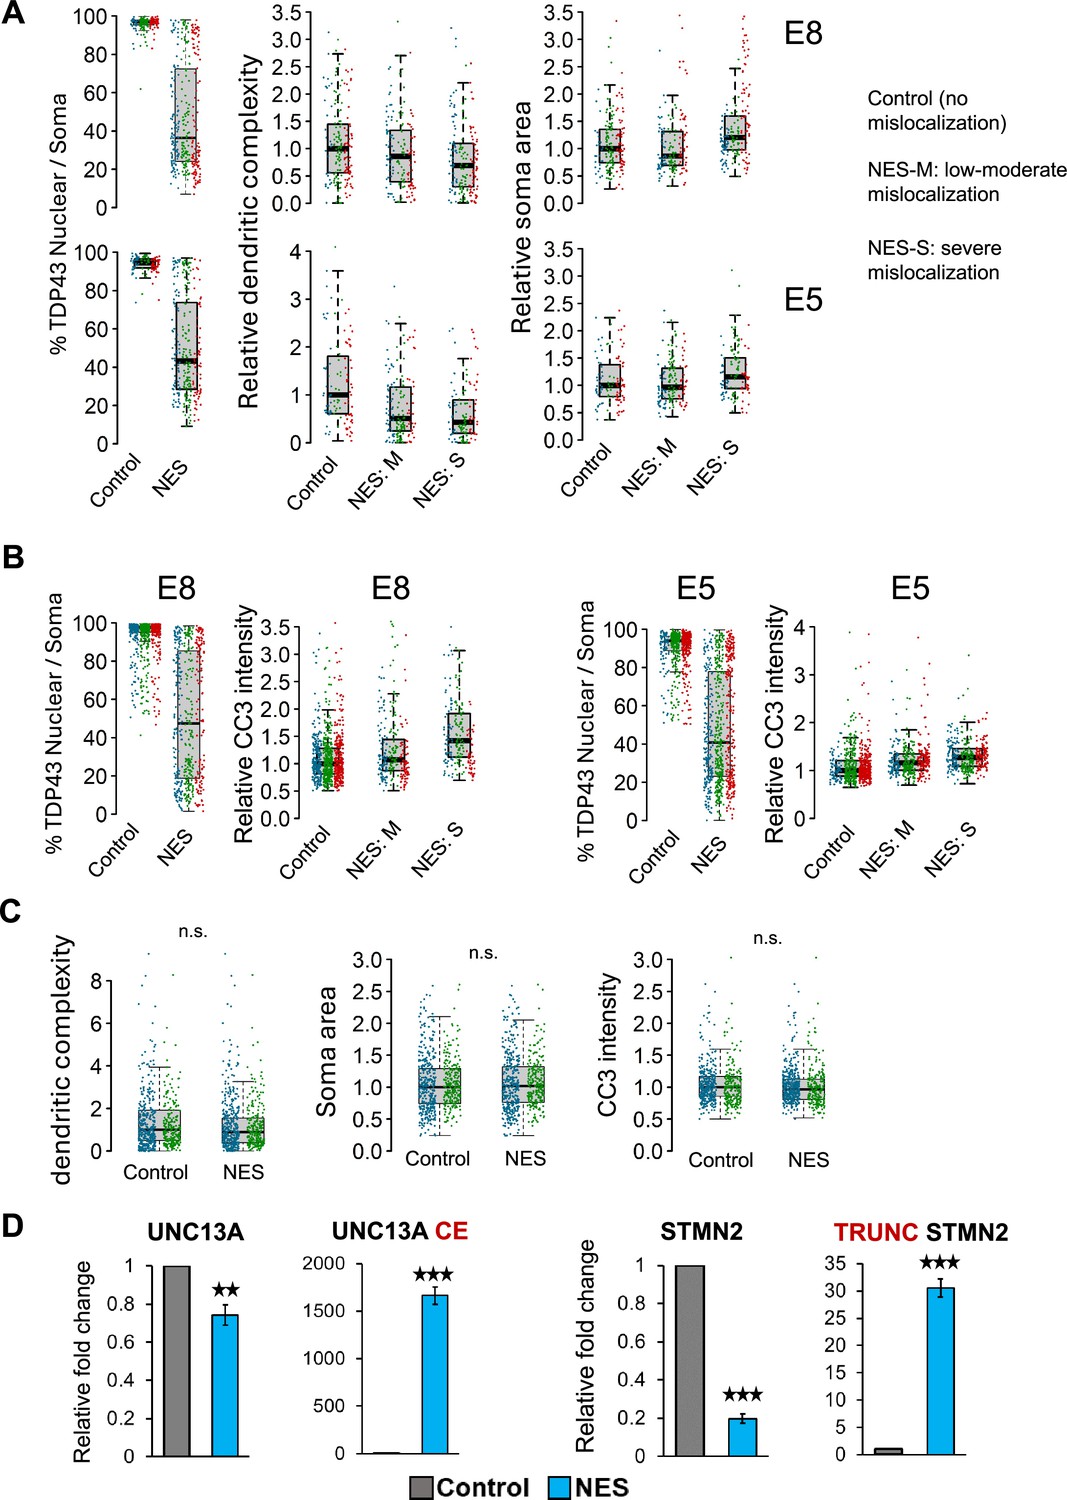
(A) Related to main Figure 1C and D. Quantification of morphological defects in nuclear export signal (NES) nanobody-treated motor neuron s (MNs) versus control. Mislocalized TDP43 (NES) causes a reduction in dendritic complexity (D) and soma swelling, compared to neurons expressing nuclear TDP43 (control). (B) Related to main Figure 1D. Quantification of caspase 3 (CC3) levels in NES nanobody-treated MNs versus control. Mislocalized TDP43 (NES) causes elevation of CC3 levels, compared to neurons expressing nuclear TDP43 (control). For A and B, each replicate is indicated by a different colour. Control: control nanobody, NES: NES nanobody, NES-M: Low to moderate levels of mislocalization, defined as neurons with >60% nuclear TDP43. NES-S: Severe mislocalization is defined as neurons with <60% nuclear TDP43. (C) Morphological analysis in unedited (parent) induced pluripotent stem cell (iPSC) MNs treated with control or NES nanobodies. No significant effect is observed on dendrite morphology, soma swelling, or apoptosis (CC3 intensity) at a p-value threshold of 0.01. N=2 independent differentiations. At least 150 neurons were analysed per condition. CC3=cleaved caspase-3. Each replicate is indicated by a different colour. (D) RT-qPCR showing abnormal splicing of UNC13A and STMN2 in day 40 homozygous TDP43-GFP MNs, 20 days post-transduction with NES or control nanobodies. N=6 replicates of NES and CTRL each (three of E5, three of E8). Error bars show SEM. CE = cryptic exon, TRUNC = truncated. n.s.=not significant, ** indicates p<0.01, *** indicates p<0.001.
-
Figure 1—figure supplement 2—source data 1
CC3 intensities per soma for clone E5 MN.
- https://cdn.elifesciences.org/articles/95062/elife-95062-fig1-figsupp2-data1-v1.txt
-
Figure 1—figure supplement 2—source data 2
Neurite complexity per soma for clone E5 MN.
- https://cdn.elifesciences.org/articles/95062/elife-95062-fig1-figsupp2-data2-v1.txt
-
Figure 1—figure supplement 2—source data 3
CC3 intensities per soma for clone E8 MN.
- https://cdn.elifesciences.org/articles/95062/elife-95062-fig1-figsupp2-data3-v1.txt
-
Figure 1—figure supplement 2—source data 4
Neurite complexity per soma for clone E5 MN.
- https://cdn.elifesciences.org/articles/95062/elife-95062-fig1-figsupp2-data4-v1.txt
Figure 2 with 4 supplements
Transcriptional consequences of TDP43 mislocalization.
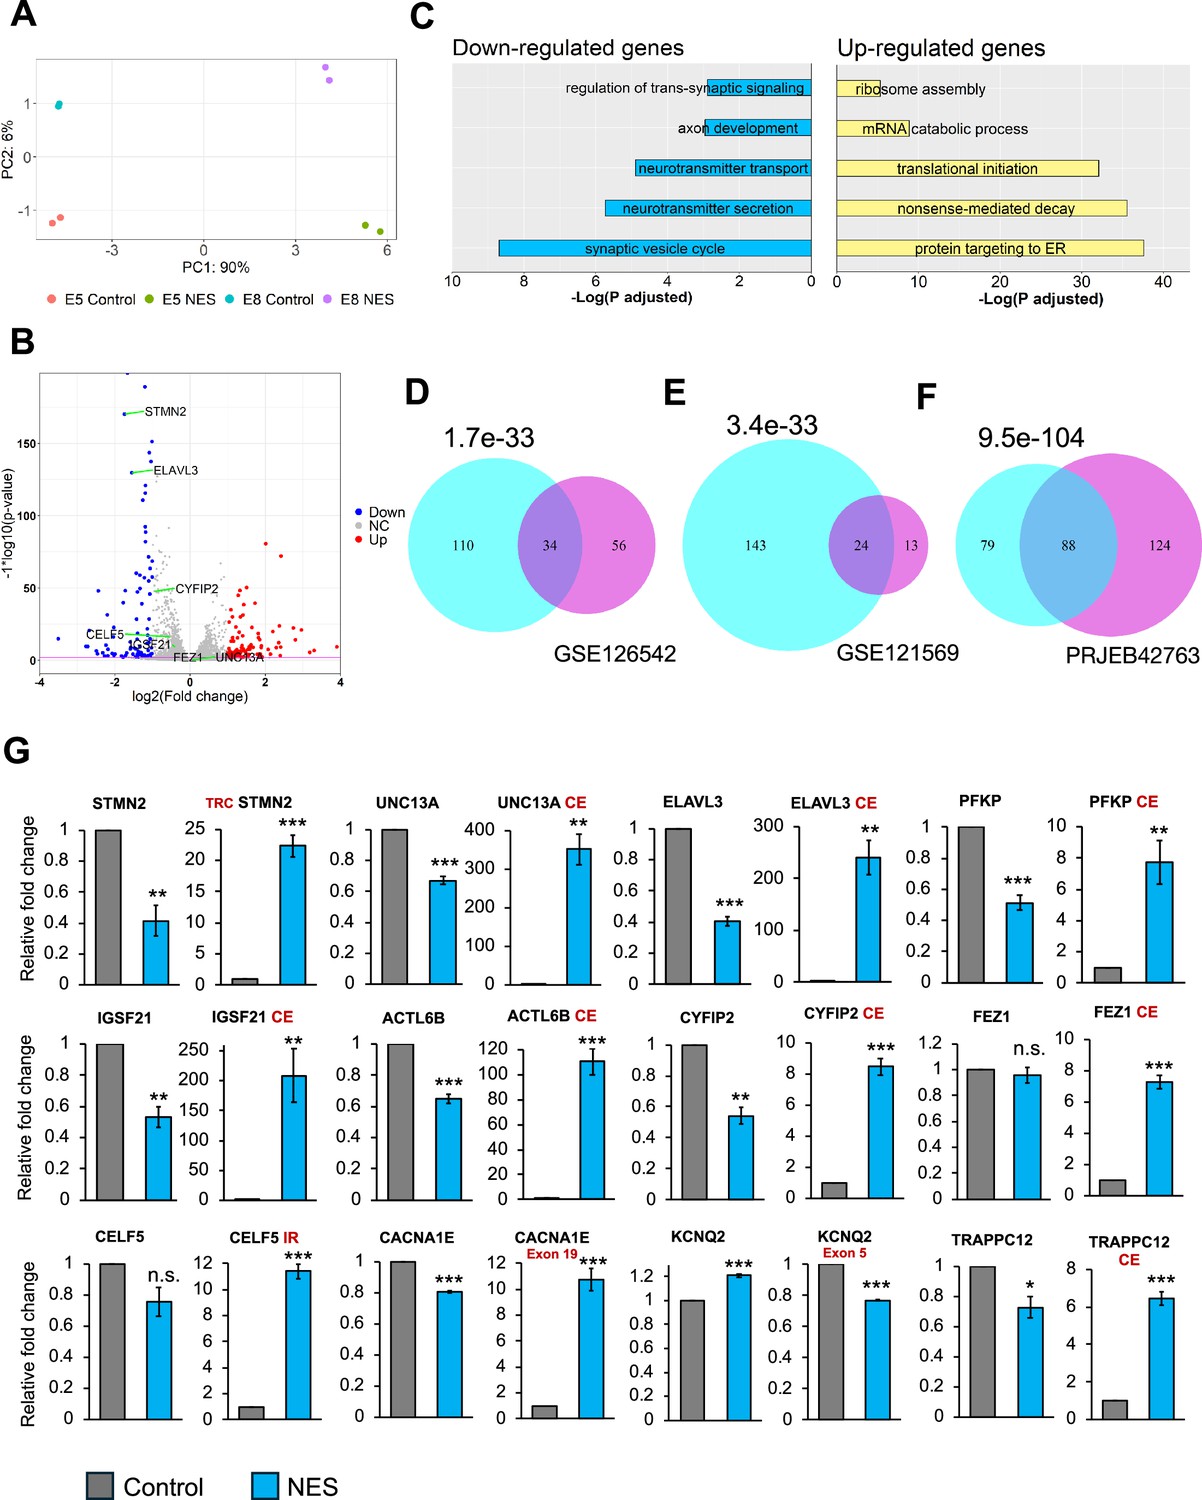
(A) Principal component analysis of gene counts for E8 and E5 iPSC-MNs. (B) Volcano plot displaying genes differentially expressed due to TDP43 mislocalization. Red: upregulated genes, Blue: downregulated genes, NC: No Change. Horizontal line denotes a p-value threshold of 0.01. (C) Gene ontology enrichment analysis on the differentially expressed genes in the TDP43 model. The top five enriched pathways in upregulated and downregulated genes have been displayed. (D, E, F) Venn diagram displaying the overlap between mis-spliced genes identified due to TDP43 mislocalization in the TDP43-GFP induced pluripotent stem cell (iPSC) MNs (cyan circles) with publicly available transcriptomic datasets; D: Cortical neuronal nuclei displaying TDP43 depletion obtained from Amyotrophic Lateral Sclerosis (ALS)/frontotemporal dementia (FTD) patient tissue (GSE126542), E: TDP43 knockdown using siRNAs in healthy iPSC-MNs (GSE121569), F: TDP43 knockdown using CRISPRi in healthy iPSC-iNs (PRJEB42763). P-values were estimated using a hypergeometric distribution. Only genes with detectable expression in both datasets were used for splicing analysis. (G) RT-qPCR validating alternative splicing changes resulting from TDP43-GFP mislocalization in iPSC-MNs. MN samples were lysed at day 30, 12 days post-transduction with AAVs. Replicates were three independent differentiations of homozygous TDP43-GFP knock-in lines, (two of E5, one of E8). CE = cryptic exon, TRC = truncated, IR = intron retention. CACNA1E and KCNQ2 displayed alternate exon usage. The exons that were included in the NES samples have been indicated. ** indicates p<0.01. *** indicates p<0.001.
-
Figure 2—source data 1
DESeq2 output related to Figure 2.
- https://cdn.elifesciences.org/articles/95062/elife-95062-fig2-data1-v1.txt
-
Figure 2—source data 2
Leafcutter analysis to analyse splicing changes due to TDP43 mislocalisation.
- https://cdn.elifesciences.org/articles/95062/elife-95062-fig2-data2-v1.txt
-
Figure 2—source code 1
R script to analyse differential gene expression data for Figure 2.
- https://cdn.elifesciences.org/articles/95062/elife-95062-fig2-code1-v1.zip
Figure 2—figure supplement 1
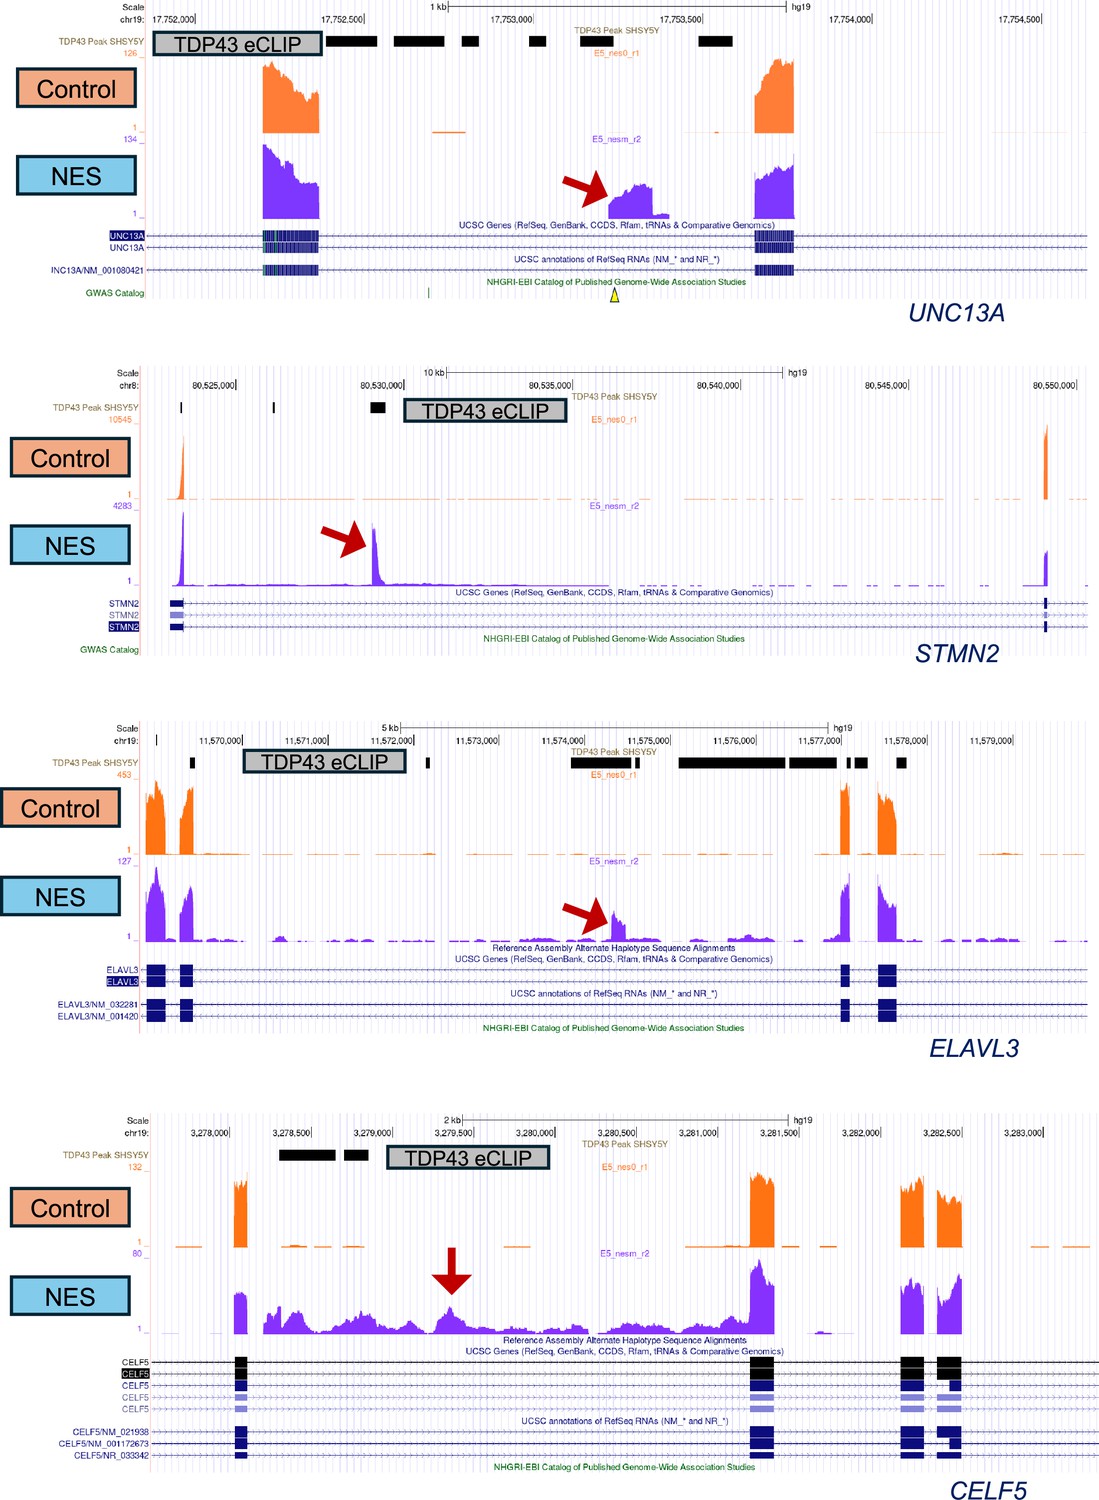
UCSC Genome browser screen shots depicting cryptic exon inclusion (UNC13A, STMN2, ELAVL3) and intron retention (CELF5) resulting from TDP43 mislocalization.
In all cases, there is at least one TDP43 binding site, identified by SH-SY5Y eCLIP data (GSE122648) shown as a horizontal black bar. Screenshots are from the homozygous E5 TDP43-GFP clone, at MN day 40, 20 days post-transduction with adeno-associated viruses (AAVs). Red arrows indicate the alternative splice event.
Figure 2—figure supplement 2
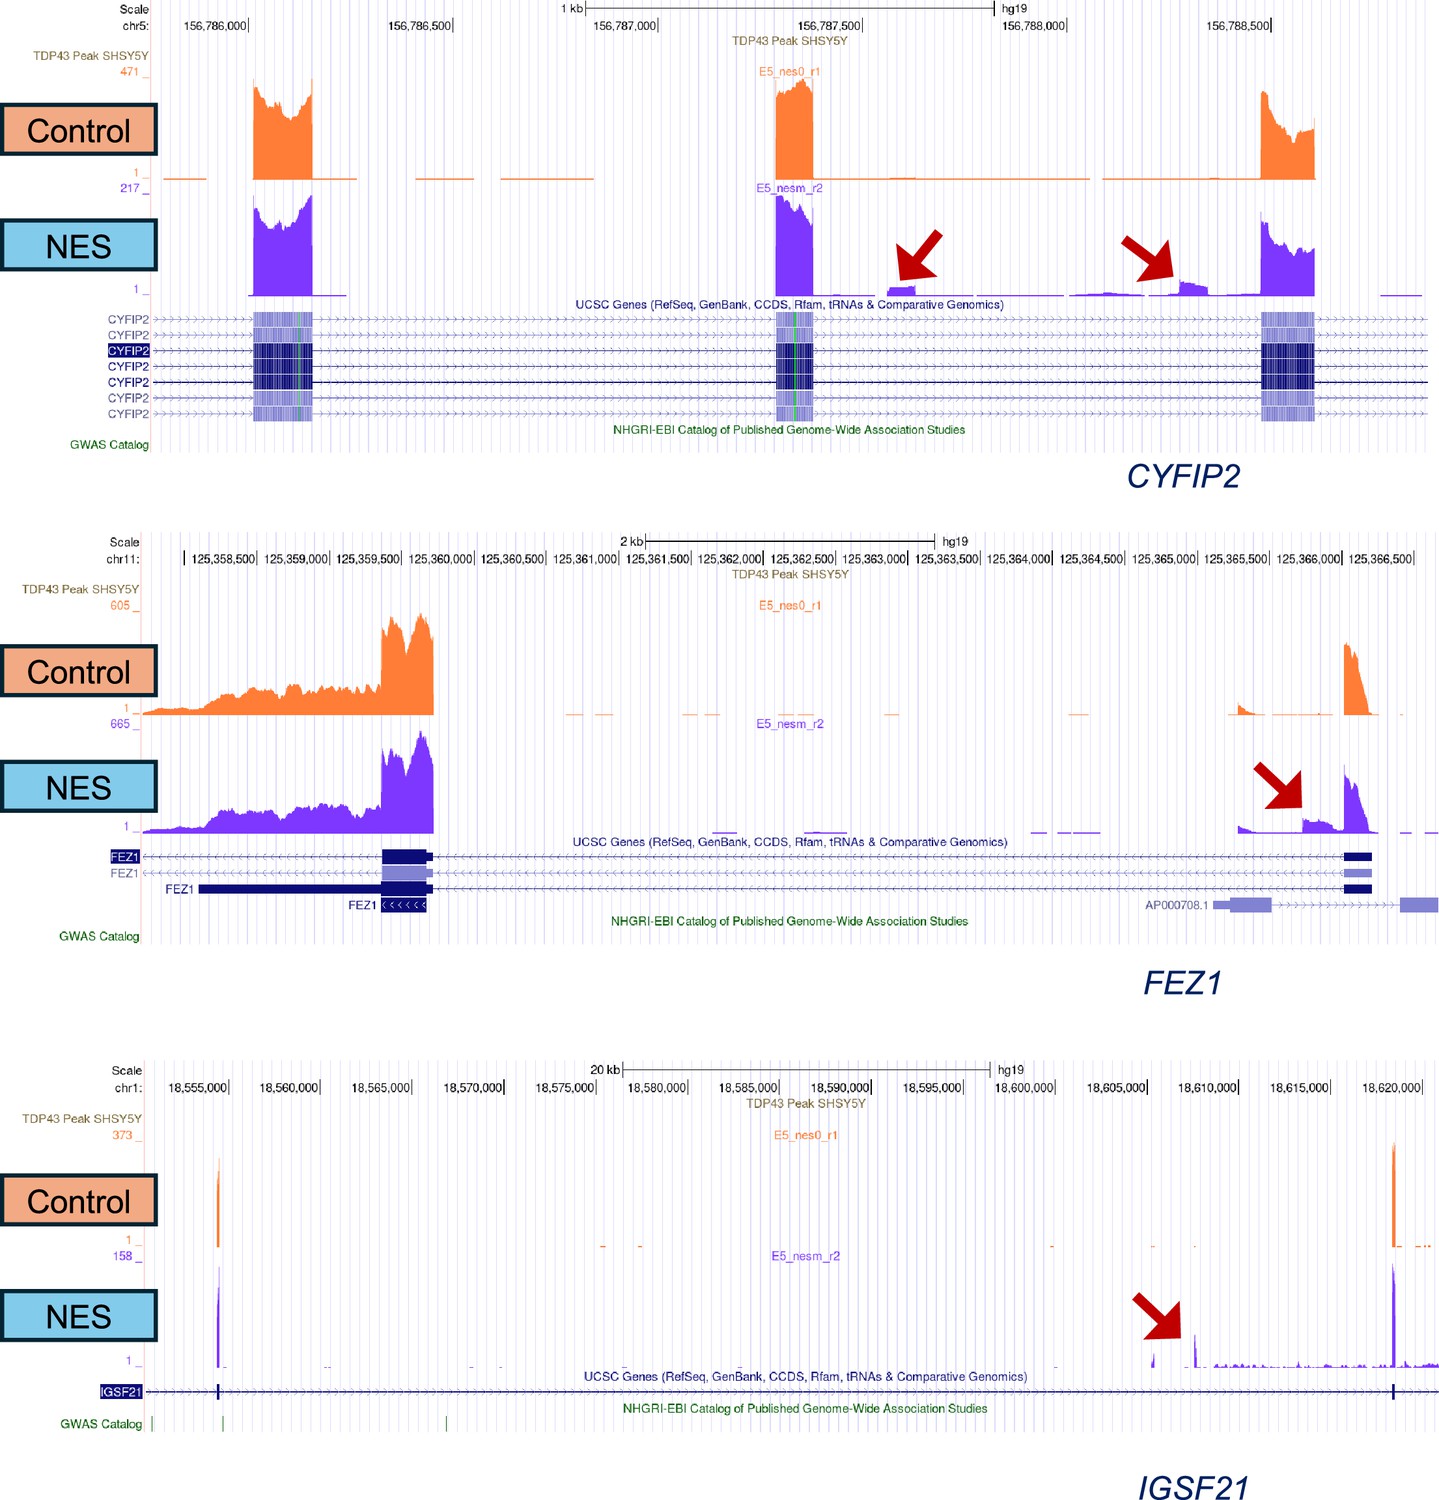
UCSC Genome browser shots depicting cryptic exon inclusion in CYFIP2, FEZ1, and IGSF21 resulting from TDP43 mislocalization.
There are no TDP43 binding sites identified by SH-SY5Y eCLIP data (GSE122648). Screenshots are from the homozygous E5 TDP43-GFP clone, at motor neuron (MN) day 40, 20 days post-transduction with adeno-associated viruses (AAVs). Red arrows indicate the alternative splice event.
Figure 2—figure supplement 3
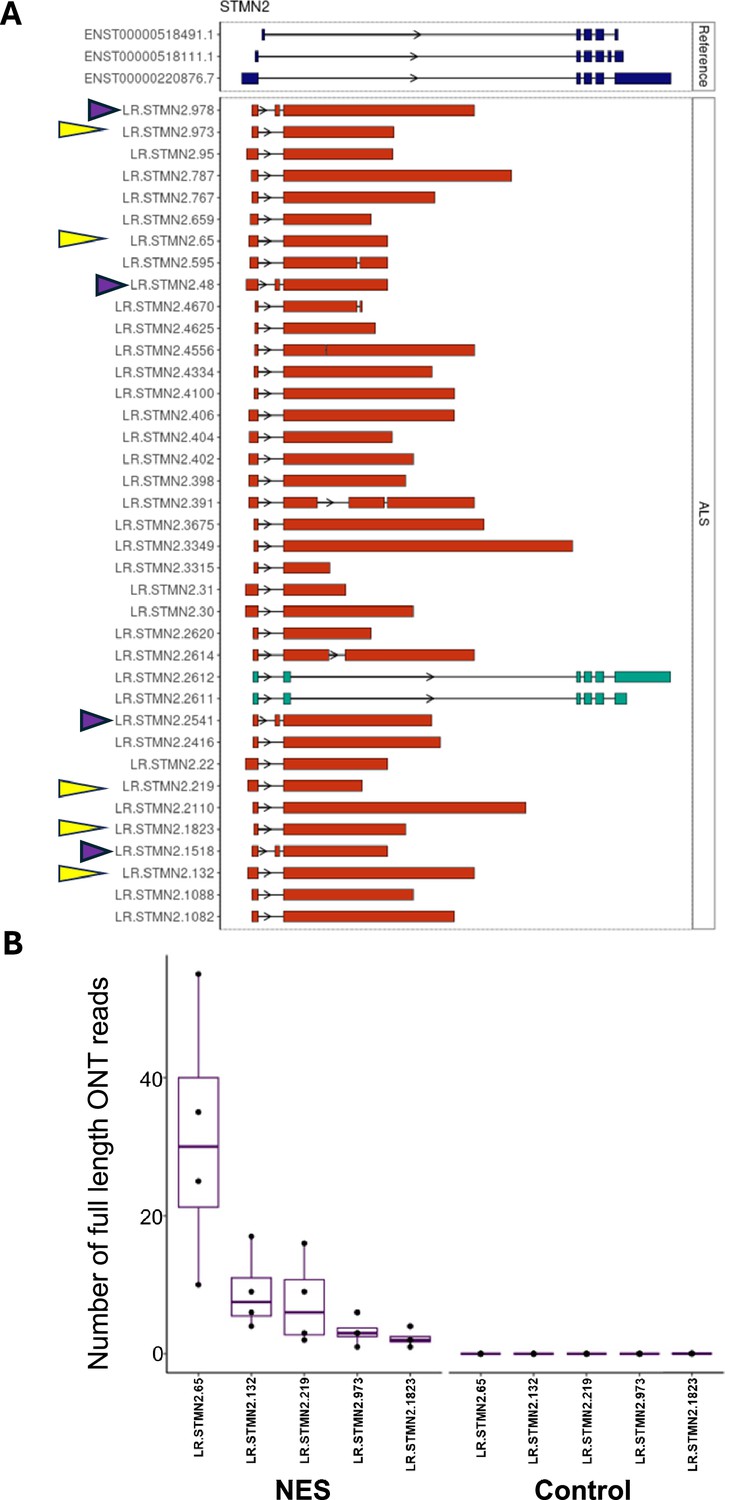
Quantification of variation in the STMN2 CE.
(A) STMN2 transcripts containing the cryptic exo (CE) in the TDP43-GFP motor neurons (MNs) expressing the nuclear export signal (NES) nanobody (isoforms containing the variable length CE are shown in red, reference isoforms are shown in dark blue at the top). Each isoform was assigned a unique number. Top five most abundant isoforms are marked by yellow arrows. Isoforms containing the extra 114 bp exon upstream of the CE are marked by purple arrows. (B) Quantification of the top five most abundant STMN2 isoforms in TDP43-GFP MNs expressing control or NES nanobody. Each dot represents data from an independent replicate. N=4.
Figure 2—figure supplement 4
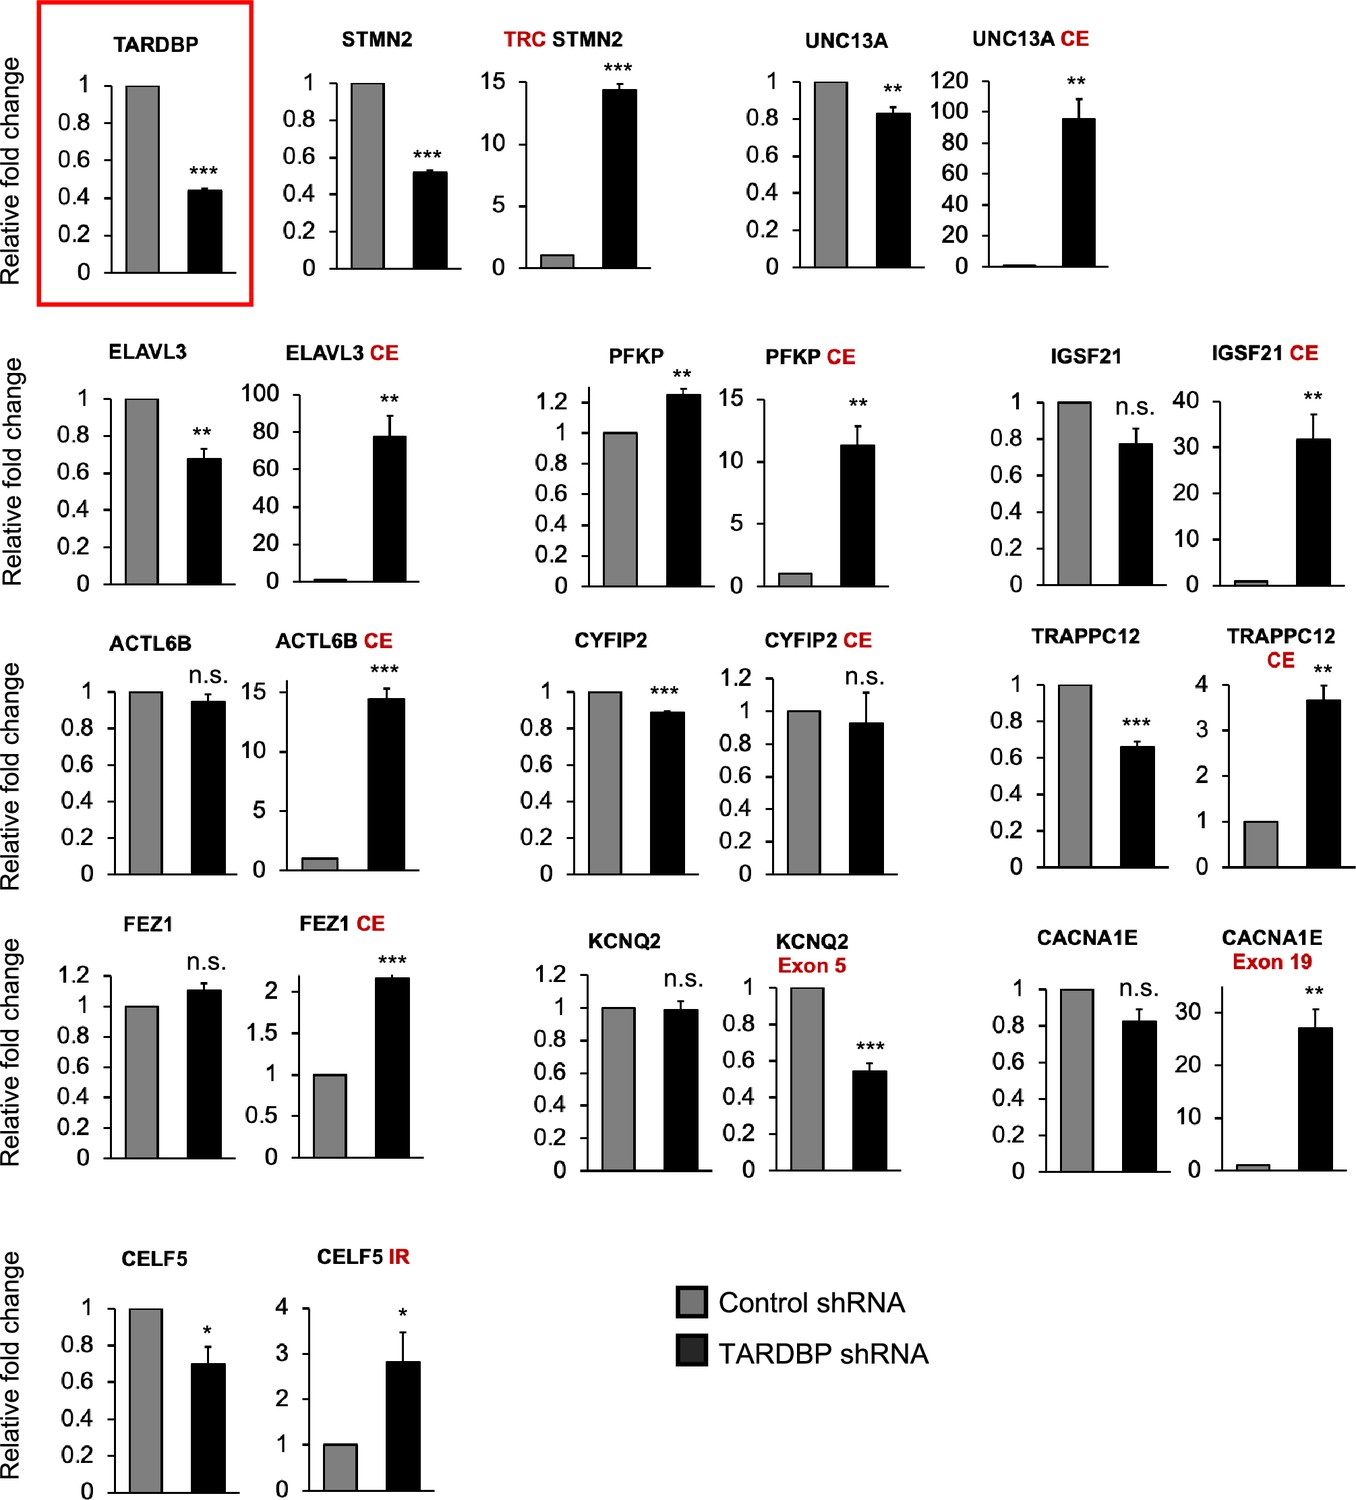
RT-qPCR showing alternative splicing errors in unedited induced pluripotent stem cell (iPSC) motor neurons (MNs), 10 days post-addition of shRNAs targeting TDP43, or controls.
The chart showing successful TDP43 knockdown is highlighted in red. Error bars show SEM.
CE = cryptic exon, TRC = truncated, IR = intron retention. N=3 independent differentiations. * indicates p<0.05, ** indicates p<0.01, *** indicates p<0.001.
Figure 3 with 4 supplements
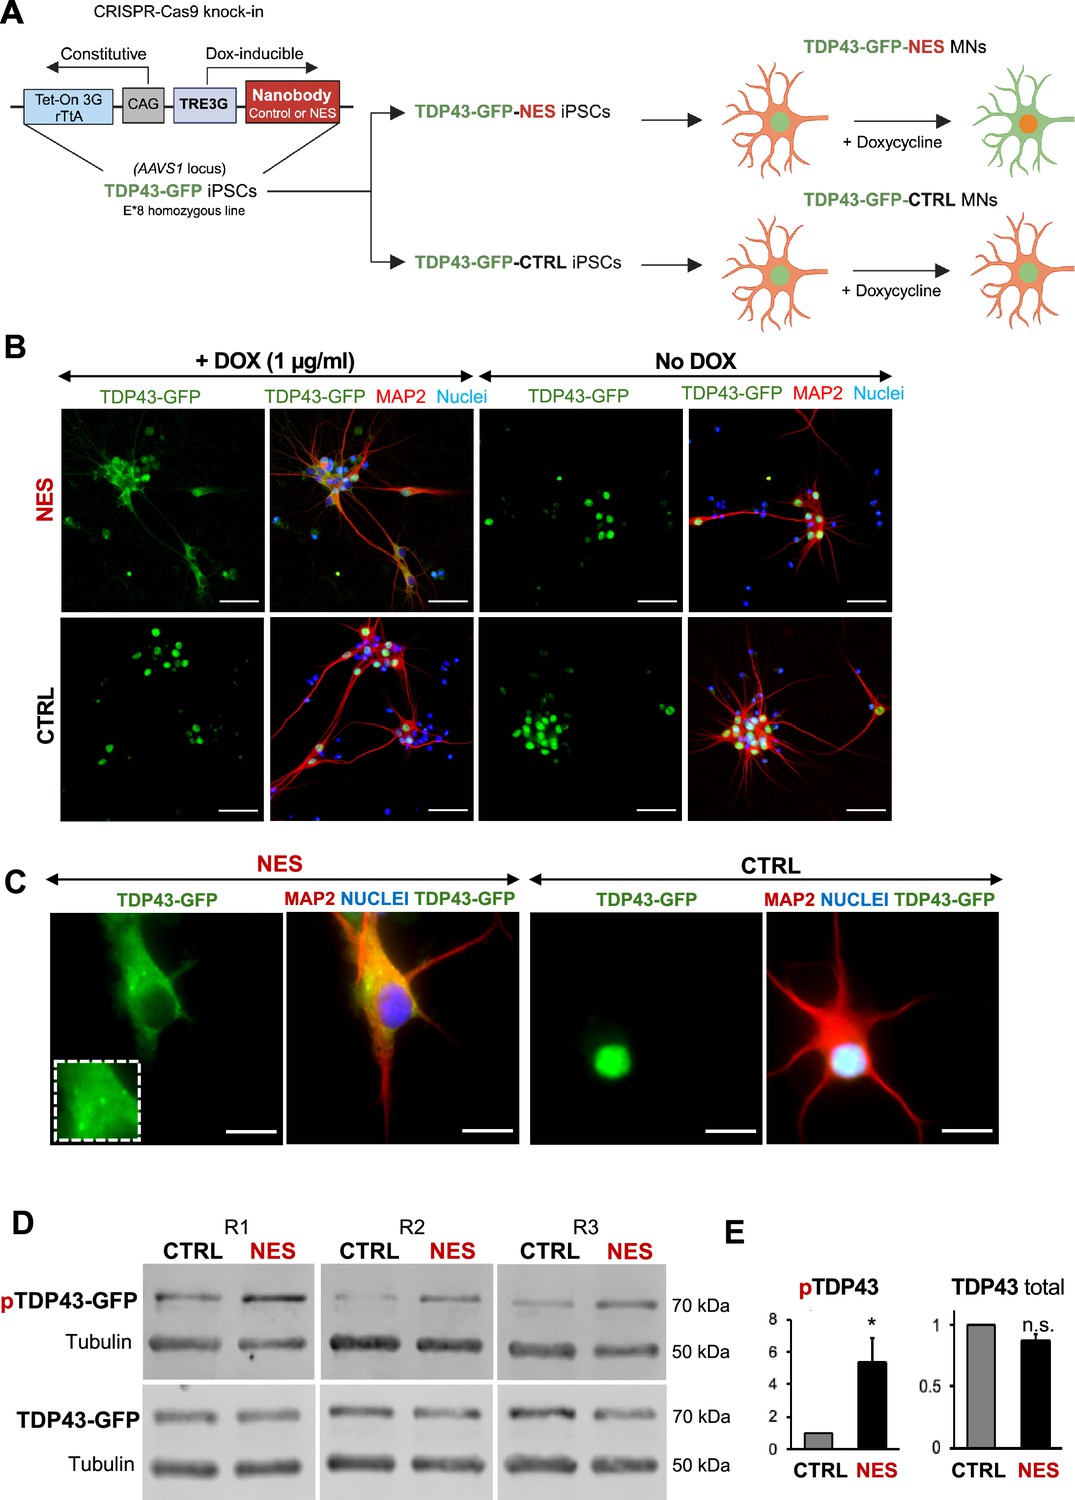
An inducible model of TDP43 mislocalization.
(A) Schematic depicting the knock-in of the nanobody (control or nuclear export signal , NES) into the human AAVS1 safe harbour locus of our E8 homozygous TDP43-GFP cell line. Nanobody expression was under the control of a doxycycline (Dox)-inducible promoter. Addition of Dox is expected to induce TDP43 mislocalization in the TDP43-GFP-NES motor neurons (MNs) but not in the TDP43-GFP-Control (TDP43-GFP-CTRL) MNs. Panel created in BioRender. (B) Immunofluorescent staining showing TDP43 localization in our TDP43-GFP-CTRL or TDP43-GFP-NES line in response to Dox. Mislocalization only occurs in the TDP43-GFP-NES line with Dox treatment, while all other conditions maintain nuclear TDP43. MNs were fixed and stained at day 35, 15 days post-Dox addition. Scale bar = 50 µm. (C) TDP43 localization in the TDP43-GFP-NES or –CTRL cell lines at day 40, 20 days post-Dox addition. The box highlights cytoplasmic TDP43 puncta in the NES line. Scale bar = 20 µm. (D) Western blots of total and phosphorylated TDP43 in TDP43-GFP-NES or –CTRL cell lines at day 40, 20 days post-Dox addition. Alpha-tubulin was used as a loading control. (E) Quantification of total and phosphorylated TDP43-GFP from Figure D. Total TDP43-GFP remains stable, while there is a significant increase in phosphorylated TDP43-GFP in the NES lines. Each sample was normalized to alpha-tubulin, pTDP43 samples were also normalized to total TDP43 levels. Replicates are three independent differentiations of TDP43-GFP-NES or –CTRL. pTDP43-GFP=phosphorylated TDP43-GFP. * indicates p<0.05. Error bars indicate SEM.
-
Figure 3—source data 1
PDF of labelled uncropped western blots shown in Figure 3D.
- https://cdn.elifesciences.org/articles/95062/elife-95062-fig3-data1-v1.zip
-
Figure 3—source data 2
unedited original files for western blots shown in Figure 3D.
- https://cdn.elifesciences.org/articles/95062/elife-95062-fig3-data2-v1.zip
Figure 3—figure supplement 1
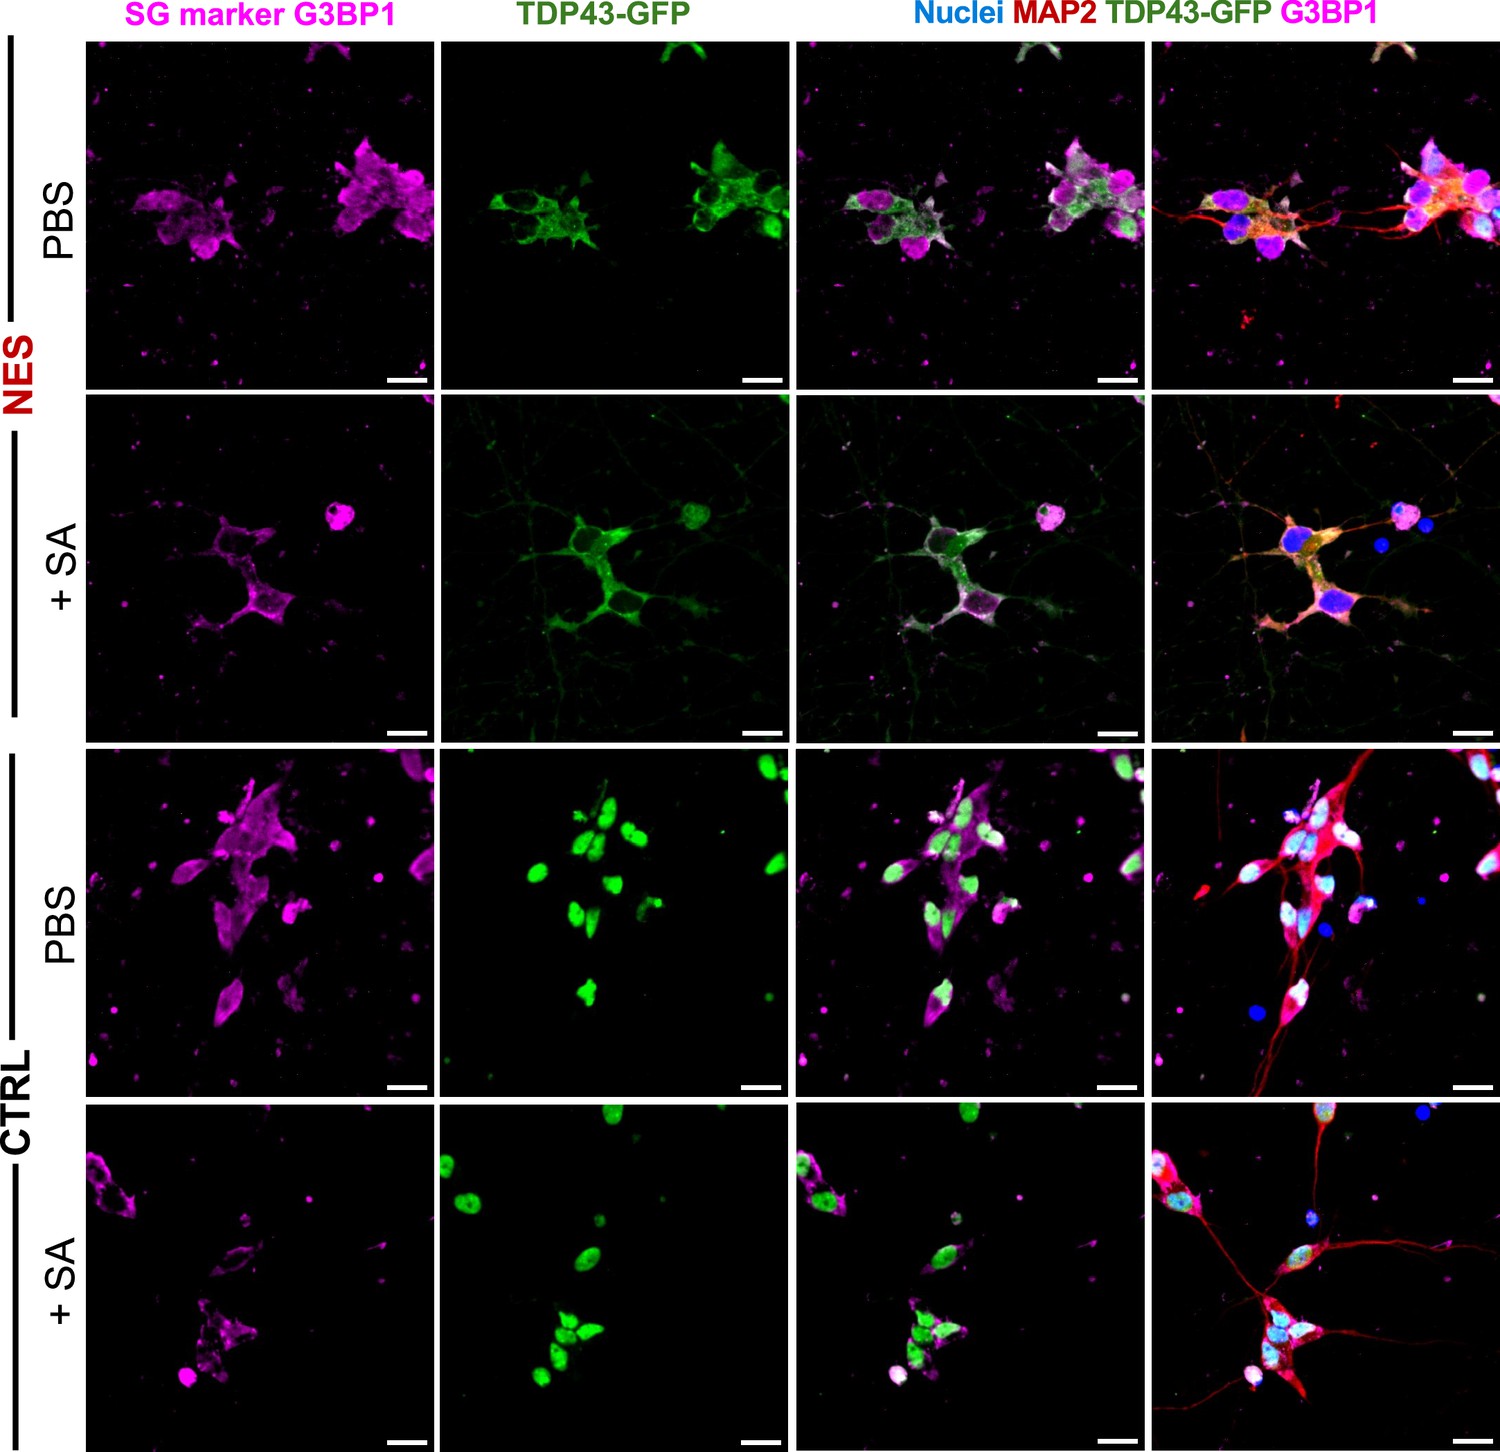
Representative images of TDP43-GFP-NES or –CRTL lines with and without SA exposure (500 µM for 60 min), 3 days in Dox (1 µg/mL).
G3BP1+stress granules were observed only with SA treatment. Cytoplasmic TDP43-GFP puncta in the nuclear export signal (NES) line do not fully co-localize with stress granules. Cells were fixed and stained at day 23. Scale bar = 20 µm.
Figure 3—figure supplement 2
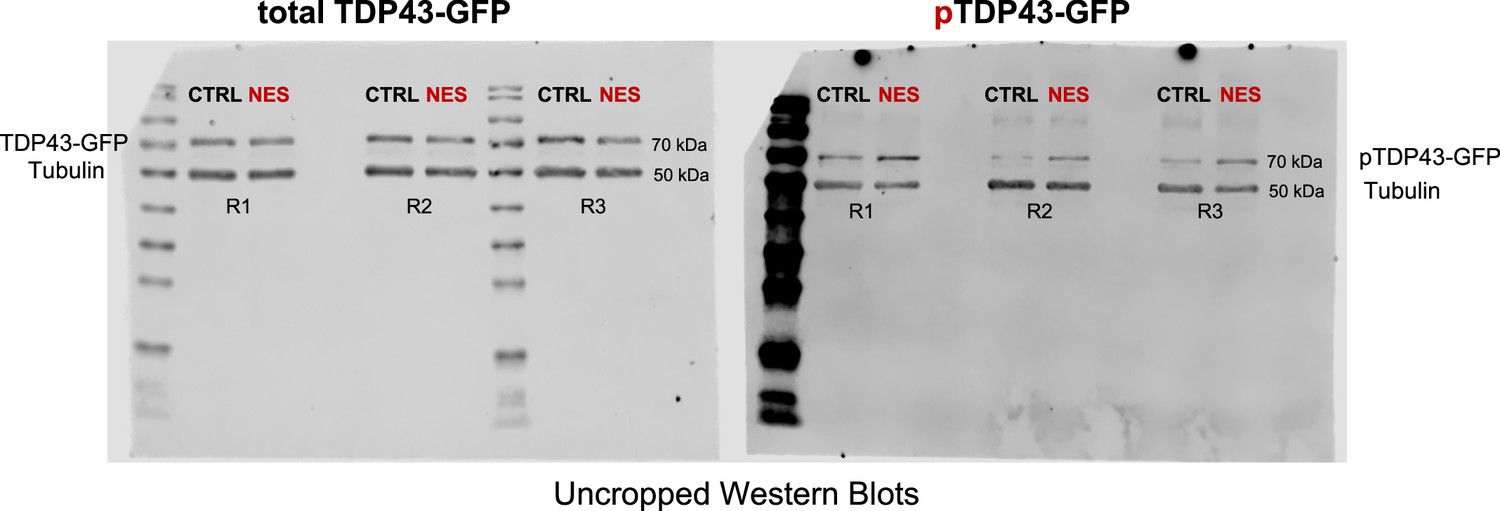
Uncropped western blot from Figure 3D.
Protein from TDP43-GFP-CTRL or –nuclear export signal (NES) motor neurons (MNs) was collected on day 40 (20 days post-Dox, 1 ug/mL) and stained for total TDP43 and phosphorylated TDP43 (pTDP43-GFP). Alpha-tubulin was used as a loading control. Three replicates from independent differentiations are shown.
Figure 3—figure supplement 3
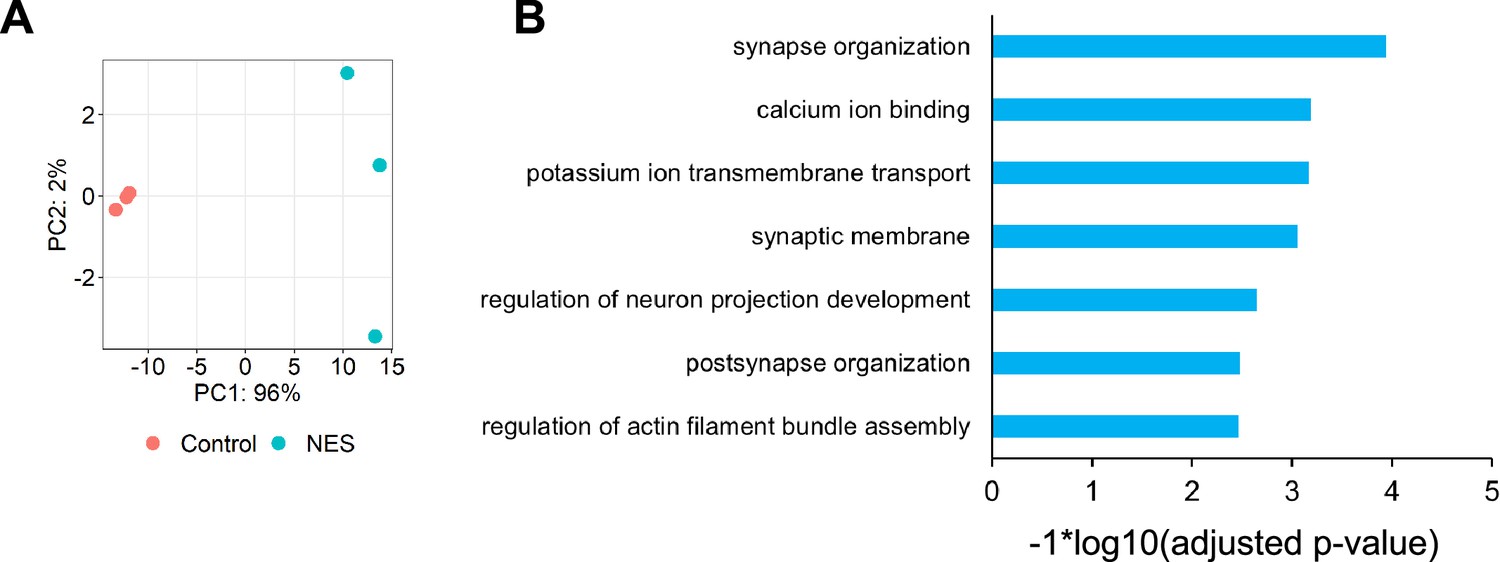
RNA-seq analysis of MNs displaying TDP43 mislocalisation at day 40.
(A) Principal component analysis (PCA) plot using the top 500 most variable genes. Control: motor neurons (MNs) expressing the control nanobody, nuclear export signal (NES): MNs expressing the NES nanobody. (B) GO enrichment analysis of 494 genes mis-spliced in the NES MNs compared to Control MNs. Splicing changes were detected using leafcutter at an adjusted p-value <0.01 and delta-Psi >0.1.
-
Figure 3—figure supplement 3—source code 1
R script to analyse differential gene expression data for Figure 3—figure supplement 3.
- https://cdn.elifesciences.org/articles/95062/elife-95062-fig3-figsupp3-code1-v1.zip
-
Figure 3—figure supplement 3—source code 2
R script to analyse splicing changes for Figure 3—figure supplement 3.
- https://cdn.elifesciences.org/articles/95062/elife-95062-fig3-figsupp3-code2-v1.zip
-
Figure 3—figure supplement 3—source data 1
Leafcutter analysis to analyse splicing changes due to TDP43 mislocalisation related to Figure 3—figure supplement 3.
- https://cdn.elifesciences.org/articles/95062/elife-95062-fig3-figsupp3-data1-v1.txt
-
Figure 3—figure supplement 3—source data 2
Leafcutter analysis to analyse splicing changes due to TDP43 mislocalisation related to Figure 3—figure supplement 3.
- https://cdn.elifesciences.org/articles/95062/elife-95062-fig3-figsupp3-data2-v1.txt
-
Figure 3—figure supplement 3—source data 3
DESeq2 output related to Figure 3—figure supplement 3.
- https://cdn.elifesciences.org/articles/95062/elife-95062-fig3-figsupp3-data3-v1.txt
-
Figure 3—figure supplement 3—source data 4
Sample details related to RNA-seq analysis shown in Figure 3—figure supplement 3.
- https://cdn.elifesciences.org/articles/95062/elife-95062-fig3-figsupp3-data4-v1.txt
Figure 3—figure supplement 4
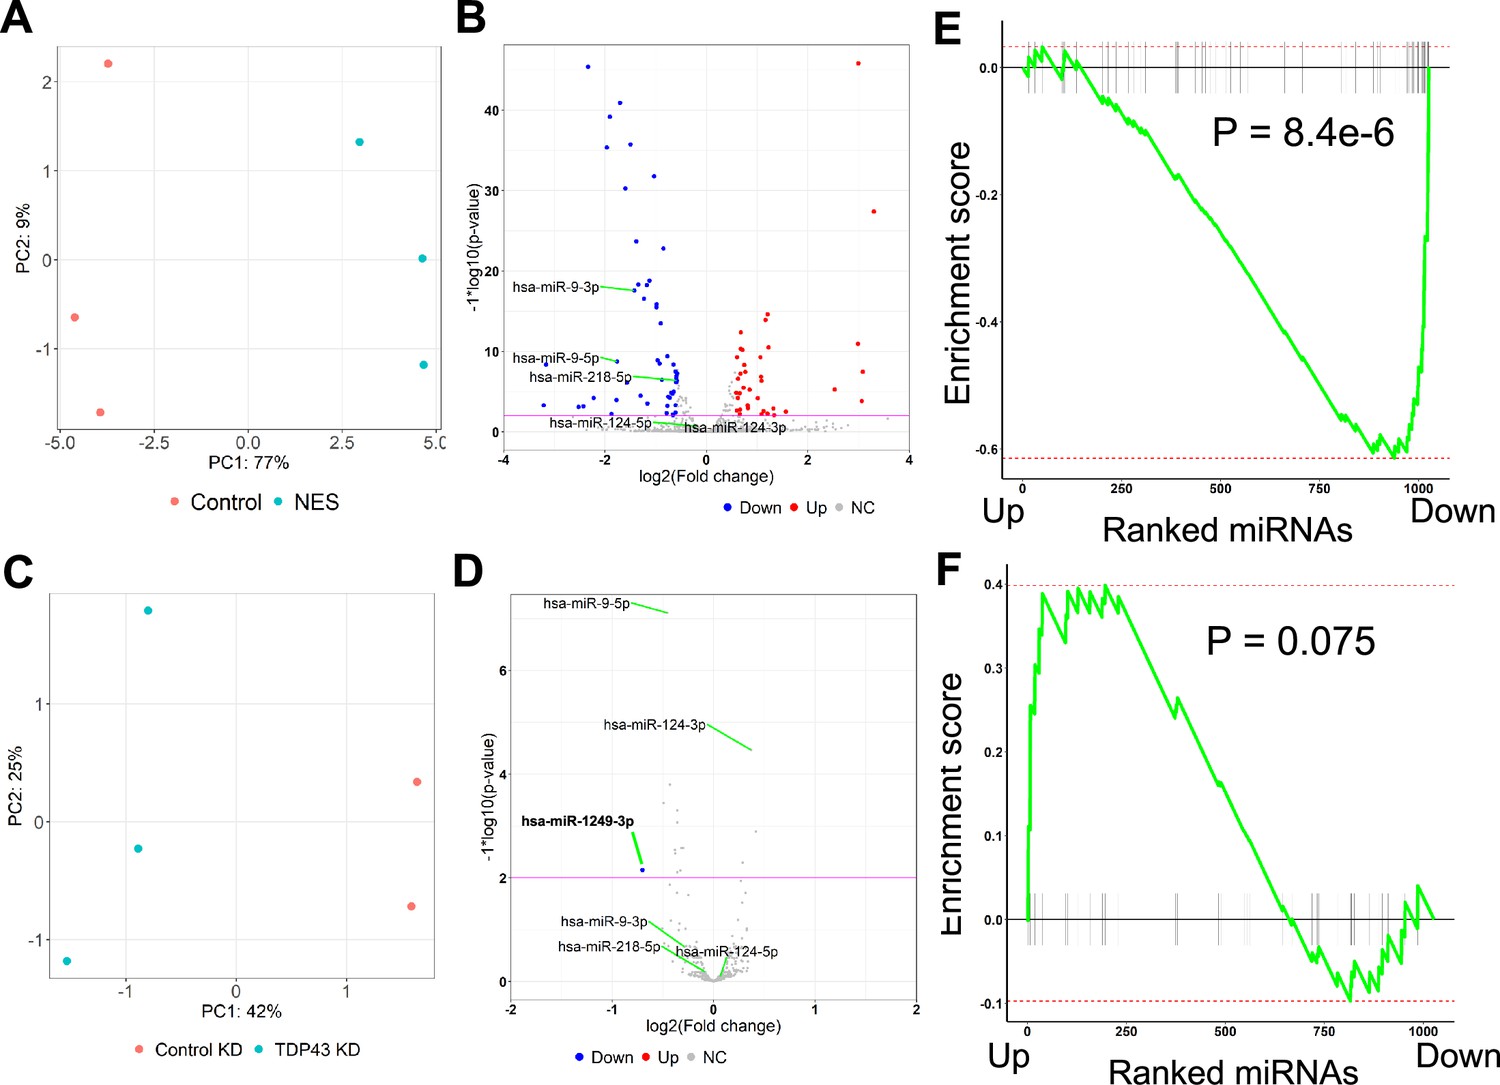
Differential expression analysis of microRNAs.
(A) Principal component analysis of microRNA (miR) counts for the TDP43-GFP-Control and TDP43-GFP-NES motor neurons (MNs). (B) Volcano plot displaying miRs differentially expressed due to TDP43 mislocalization. Red: upregulated miRs, Blue: downregulated miRs, NC: No Change. Horizontal line denotes a p-value threshold of 0.01. (C) Principal component analysis of miR counts for unedited healthy induced pluripotent stem cell (iPSC) MNs transduced with TDP43 or control shRNAs. (D) Volcano plot displaying miRs differentially expressed due to TDP43 knockdown. Blue: downregulated miRs, NC: No Change. Horizontal line denotes a p-value threshold of 0.01. Only miR-1249–3 p was deemed differentially regulated at the thresholds used. (E, F) Gene-set enrichment analysis plots displaying overlap of differentially expressed miRs due to TDP43 mislocalization or knockdown. miRs differentially expressed in the TDP43 knockdown samples were ranked from most upregulated to the most downregulated. (E) Gene set used for the gene set enrichment analysis (GSEA) includes microRNAs (miRs) downregulated due to TDP43 mislocalization, (F) Gene set used for the GSEA includes miRs upregulated due to TDP43 mislocalization.
-
Figure 3—figure supplement 4—source data 1
Raw counts for microRNA expression analysis comparing healthy MN to those displaying TDP43 mislocalization.
- https://cdn.elifesciences.org/articles/95062/elife-95062-fig3-figsupp4-data1-v1.txt
-
Figure 3—figure supplement 4—source data 2
DESeq2 output for differential microRNA analysis comparing healthy MN to those displaying TDP43 mislocalization.
- https://cdn.elifesciences.org/articles/95062/elife-95062-fig3-figsupp4-data2-v1.txt
-
Figure 3—figure supplement 4—source data 3
Raw counts for microRNA expression analysis comparing healthy MN to those displaying TDP43 knockdown.
- https://cdn.elifesciences.org/articles/95062/elife-95062-fig3-figsupp4-data3-v1.txt
-
Figure 3—figure supplement 4—source data 4
DESEq2 output for microRNA expression analysis comparing healthy MN to those displaying TDP43 knockdown.
- https://cdn.elifesciences.org/articles/95062/elife-95062-fig3-figsupp4-data4-v1.txt
-
Figure 3—figure supplement 4—source data 5
Sample details related to RNA-seq analysis shown in Figure 3—figure supplement 4.
- https://cdn.elifesciences.org/articles/95062/elife-95062-fig3-figsupp4-data5-v1.txt
Figure 4
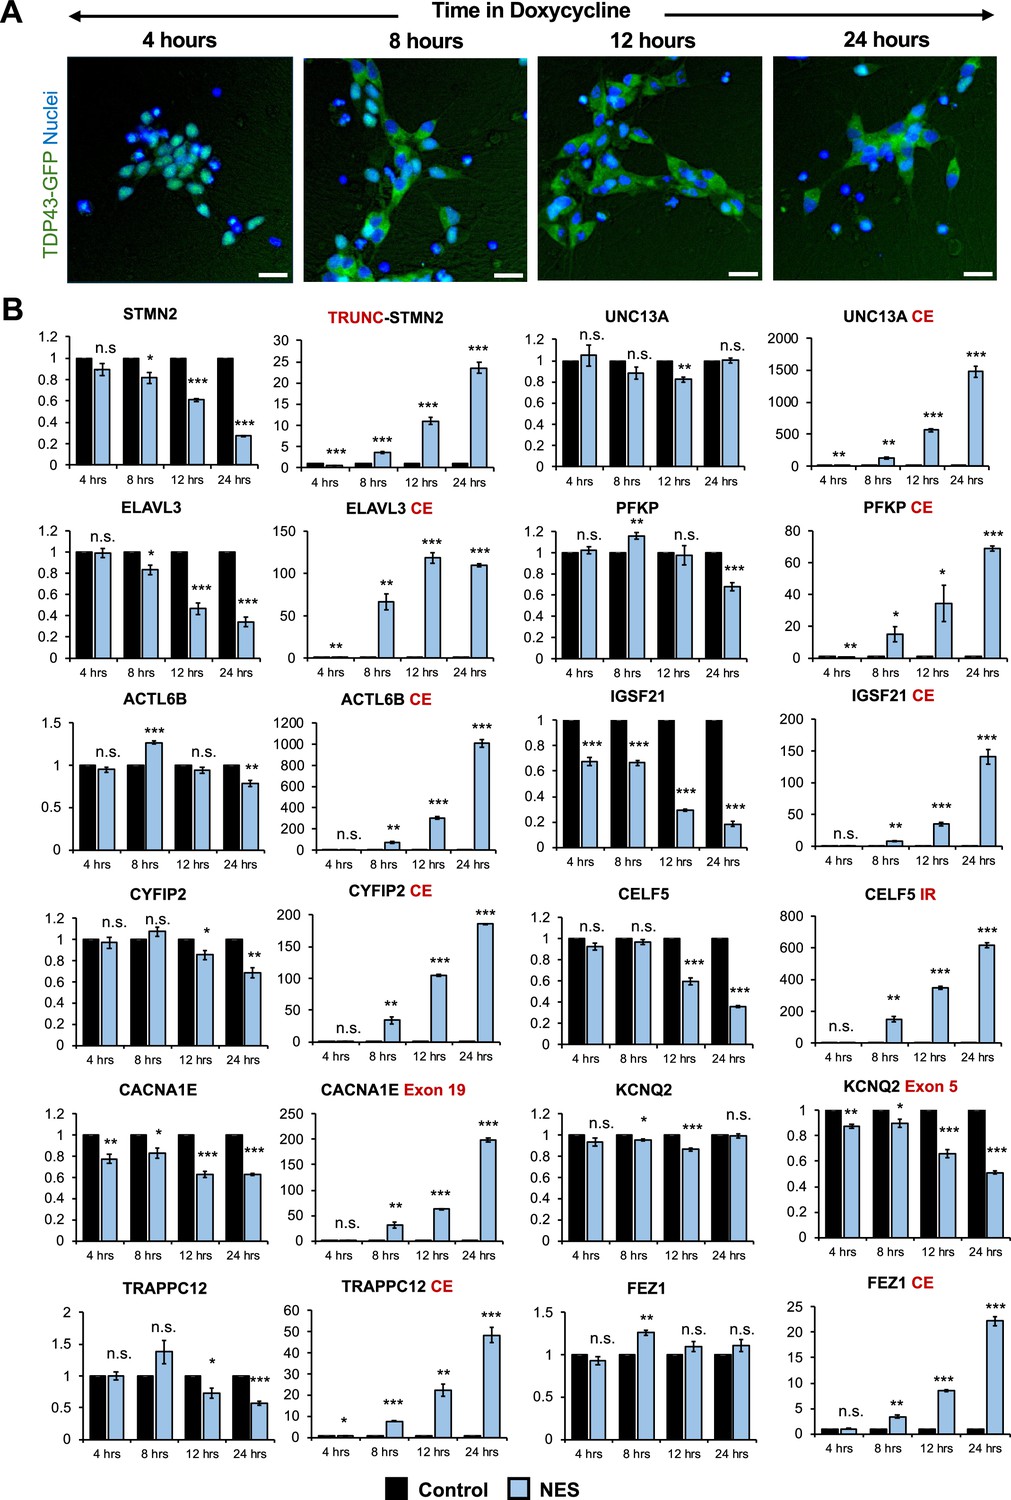
Splicing defects are one of the earliest changes downstream of TDP43 mislocalization.
(A) Immunocytochemical staining of TDP43-GFP-NES MNs at 4, 8, 12, and 24 hr following 1 μg/ml doxycycline addition. TDP43 mislocalization is observed within 8 hr. Dox was added to motor neuron (MN) day 20. Scale bar = 25 μm. (B) RT-qPCR of alternative splicing changes at 4, 8, 12, and 24 hr following 1 μg/ml doxycycline addition. Significant cryptic transcript expression in all genes is detected at 8 hr. Error bars show SEM. N=3 independent differentiations of the TDP43-GFP-CTRL/-NES lines. CE = cryptic exon, TRC = truncated, IR = intron retention. CACNA1E and KCNQ2 displayed alternate exon usage. The exons that were included in the nuclear export signal (NES) samples have been indicated. * indicates p<0.05, ** indicates p<0.01, *** indicates p<0.001.
Figure 5
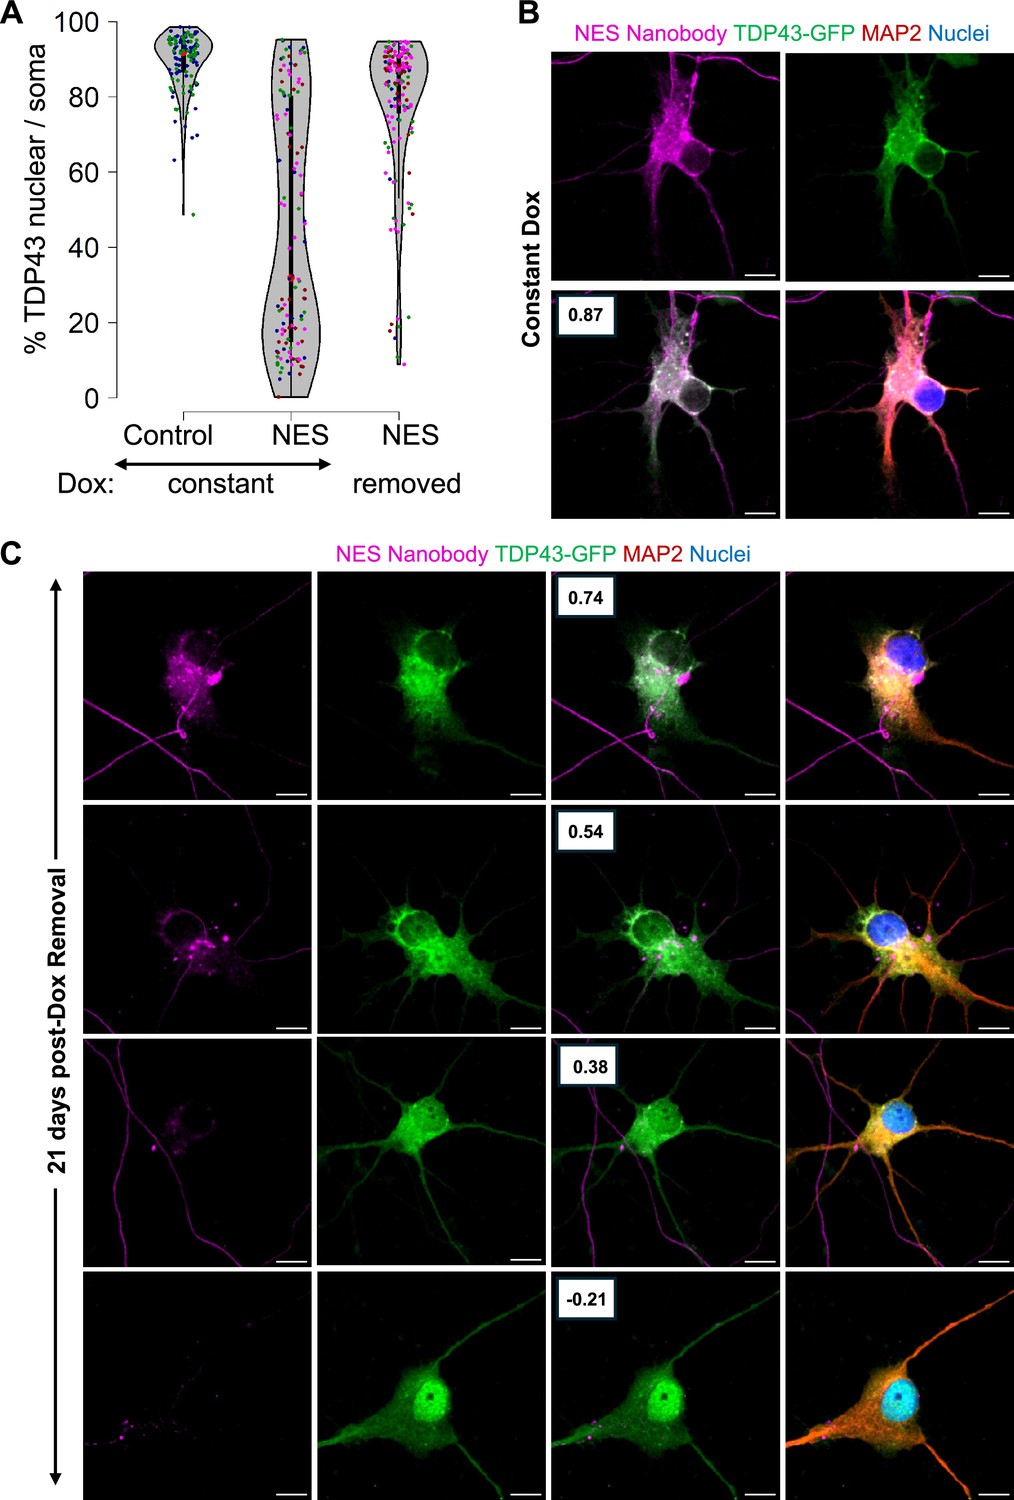
Persistent mislocalization of TDP43 in neurons post-Dox withdrawal.
(A) TDP43 localization in the E8 TDP43-GFP motor neurons (MNs) expressing Dox-inducible V5-tagged nanobodies. Control: control-V5 nanobody. NES: NES-V5 nanobody. Constant: neurons were treated with Dox continuously. Removed: Dox was withdrawn five days after its addition. N=2 for the constant +control condition. N=4 for the nuclear export signal (NES) conditions. Each replicate is indicated by a coloured dot. (B, C) Representative images of the TDP43-GFP MNs expressing NES-V5 nanobody under constant Dox treatment (B) and 21 days post-Dox withdrawal (C). Boxes indicate the Pearson correlation coefficient between the TDP43-GFP and V5-nanobody signals across individual pixels within the soma. A higher coefficient indicates higher co-localization. Scale bar = 10 µm. Images were captured with the Zeiss LSM880 Airyscan.
Tables
Key resources table
| Reagent type (species) or resource | Designation | Source or reference | Identifiers | Additional information |
|---|---|---|---|---|
| Cell line (human iPSCs, female) | ‘parent’ Healthy adult donor iPSC line | Coriell Institute for Medical Research | GM23280A | |
| Cell line (human iPSCs, female) | TDP43-GFP (E5 or E8) | This paper | GFP Knock-in iPSC lines generated from healthy ‘parent’ line. Maintained in A. Bhinge Lab. | |
| Cell line (human iPSCs, female) | TDP43-GFP-NES or TDP43-GFP-CTRL | This paper | Nanobody (CTRL or NES) AAVS1 knock-in line generated from TDP43-GFP E8 line. Maintained in A. Bhinge Lab. | |
| Cell line (human) | AAVpro 293T | Takara | #6322773 | For AAV generation |
| Cell line (human) | Lenti-X 293T | Takara | #632180 | For lentiviral generation |
| Antibody | Anti-GFP (goat polyclonal) | Novus/ Bio-Techne | #NB100-1770 | IF (1:1000) |
| Antibody | Anti-human MAP2 (chicken polyclonal) | GeneTex | #GTX82661 | IF (1:10,000) |
| antibody | Anti-human TDP-43 (rabbit polyclonal) | Proteintech | #10782–2-AP | IF (1:800) WB (1:1000) |
| Antibody | Anti-human Cleaved caspase-3 (rabbit monoclonal) | Cell Signalling | #9664 L | IF (1:400) |
| Antibody | Anti-human Neurofilament-M (mouse monoclonal) | Merck | #Mab1621 | IF (1:1000) |
| Antibody | Anti-human ISLET-1 (rabbit monoclonal) | Abcam | #Ab109517 | IF (1:500) |
| Antibody | Anti V5 tag (mouse monoclonal) | Invitrogen | #MA5-15253 | IF (1:1000) |
| Antibody | Anti-human G3BP1 (rabbit polyclonal) | Proteintech | #13057–2-AP | IF (1:1000) |
| Antibody | Anti-human phospho-TDP43 (mouse monoclonal) | Cosmo Bio | #TIP-PTD-M01A | WB (1:1000) |
| Antibody | Anti-human alpha-tubulin (mouse monoclonal) | Abcam | #AB7291 | WB (1:1000) |
| Antibody | Anti-human alpha-tubulin (rabbit polyclonal) | Abcam | #AB4074 | WB (1:1000) |
| Antibody | IRDye 680RD anti-mouse (goat polyclonal) | Li-Cor | #926–68070 | WB (1:5000) |
| Antibody | IRDye 800CW anti-rabbit (goat polyclonal) | Li-Cor | #926–32211 | WB (1:5000) |
| Recombinant DNA reagent | Addgene plasmid 52343 | Addgene. Su-Chun Zhang; Qian et al., 2014 | Donor plasmid for AAVS1 nanobody knock-in | |
| Recombinant DNA reagent | RRID:Addgene 126582 | Addgene. Michael Guertin Sathyan et al., 2019. | sgRNA targeting the human AAVS1 locus | |
| Sequence-based reagent | Nanobody sequence | Addgene plasmid 136619; Farrants et al., 2020 | Kai Johnsson; | |
| Sequence-based reagent | NES nanobody | This paper | NES nanobody sequence | MNLVDLQKKLEELELDEQQ |
| Sequence-based reagent | NES nanobody | This paper | NES nanobody sequence | IDEAAKELPDANA |
| Sequence-based reagent | TDP-43 C-terminus sgRNA | This paper | sgRNA | GAATGTAGACAGTGGGGTTG |
| Sequence-based reagent | shRNA targeting TARDBP | Broad Institute GPP portal | GCAATAGACAGTTAGAAAGAA | |
| Sequence-based reagent | Control shRNA | Broad Institute GPP portal | TAGGAATTATAATGCTTATCTA | |
| Commercial assay or kit | miRNeasy Micro Kit | Qiagen | #217084 | RNA extraction |
| Commercial assay or kit | High-capacity cDNA kit | Thermo Fisher | #4368814 | Reverse transcription reaction |
| Commercial assay or kit | GoTaq qPCR Master Mix | Promega | #A6001 | qPCR |
| Commercial assay or kit | NEB Monarch total RNA Miniprep kit | New England Biolabs | #T2010S | RNA extraction |
| Commercial assay or kit | NEBNext rRNA depletion kit | New England Biolabs | #E7405L | |
| Commercial assay or kit | NEBNext Ultra II RNA library kit | New England Biolabs | #E7770S | |
| Commercial assay or kit | AAVpro Extraction Solution (Takara) | Takara | #6235 | AAV Purification |
| Commercial assay or kit | Calcium phosphate transfection kit | Takara | #631312 | Transfection for AAV and lentiviral generation |
| Chemical compound, drug | Doxycycline | Merck | #324385 | (1 µg/mL) |
| Software, algorithm | Cell Profiler | Cell Profiler; Stirling et al., 2021 | ||
| Other | Hoechst 33342 | Thermo Fisher Scientific | 62249 | IF (1:1000) |
Table 1
Primer sequences used for RT-qPCR.
| Target | AS event | AS event loc. | Forward sequence | Reverse sequence |
|---|---|---|---|---|
| UNC13A | canonical transcript | GGACGTGTGGTACAACCTGG | GTGTACTGGACATGGTACGGG | |
| UNC13A-CE | cryptic exon | intron 19 | TGGATGGAGAGATGGAACCT | GGGCTGTCTCATCGTAGTAAAC |
| STMN2 | canonical transcript | AGCTGTCCATGCTGTCACTG | GGTGGCTTCAAGATCAGCTC | |
| STMN2 trunc | Cryptic exon | intron 1 | GGACTCGGCAGAAGACCTTC | GCAGGCTGTCTGTCTCTCTC |
| ELAVL3 | canonical transcript | TGCAGACAAAGCCATCAACACCC | GCTGACGTACAGGTTAGCATCC | |
| ELAVL3-CE | cryptic exon | intron 3 | CCTGCTCTGAGGGATTGAGT | GTACAGGTTAGCATCCCGGA |
| PFKP | canonical transcript | AGGCAGTCATCGCCTTGCTAGA | ATCGCCTTCTGCACATCCTGAG | |
| PFKP-CE | cryptic exon | intron 3 | CTACCAGGGCATGGTGGA | GGAGAGTGTCTCCAGCATCC |
| ACTL6B | canonical transcript | CTTCCACATCGACACCAATGCC | CAGGTTTGGCTCAGACTTGACG | |
| ACTL6B-CE | cryptic exon | intron 4 | CCTGGATCACACCTACAGCA | ACCCAGGAGTTCGAAACTAGC |
| IGSF21 | canonical transcript | GTCTGGAGGAAAACCAGCAC | TCTTGGTGTCATCCAGGTCA | |
| IGSF21-CE | cryptic exon | intron 2 | GCCTGCAGGAGGTGTTTATG | CTCTCGCTTGCGGTAGTTCT |
| CYFIP2 | canonical transcript | ATGCCCTGGATTCTAACGGACC | CTTGGTCAGAGCATAGTAGGCG | |
| CYFIP2-CE | cryptic exon | intron 25 | CTCCAAGGAACCATTCTCCA | TGAGATTTCTTTCAGGGCTCA |
| FEZ1 | canonical transcript | CCACTGGTGAGTCTGGATGA | TGGATCCCTCCAGTCTTCTG | |
| FEZ1-CE | cryptic exon | intron 1 | TGGAGATGTGGGATGATGG | AGGGTCGAAGGTCCTCAAAC |
| CELF5 | canonical transcript | CACCTACTGTGCCAGGGATT | ACTGTCCGCAGGCTTCAC | |
| CELF5-IR | intron retention | intron 5 | CGTGAAGTTCTCCTCCCACA | CATCTGCACACACTCACACG |
| CACNA1E | canonical transcript | CCATTGTCCATCACAACCAG | CCATGCCATACATCTTCAGG | |
| CACNA1E-E19 | exon 15 inclusion | exon 19 | GAGGCCTTCAACCAGAAACA | CGACATGTGGTGTCTTCTCC |
| KCNQ2 | canonical transcript | AGTACCCCCAGACCTGGAAC | TTCCGCCTCTTCTCAAAGTG | |
| KCNQ2-E5 | exon 5 exclusion | exon 5 | ACGTCTTTGCCACATCTGC | CCCCTTCTCTGCCAAGTACA |
| TRAPPC12 | canonical transcript | TCGTGGACAAGGAGAACCTCAC | GGACTTGTCTCTTTGCTGCAGC | |
| TRAPPC12-CE | cryptic exon | intron 7 | ATGTGCAGCCCAAGTCAAG | TTGCCATGGAGTACATCACC |
Additional files
-
Supplementary file 1
Excel file of per-replicate data points of RT-qPCR and WB data shown throughout the article.
- https://cdn.elifesciences.org/articles/95062/elife-95062-supp1-v1.xlsx
-
MDAR checklist
- https://cdn.elifesciences.org/articles/95062/elife-95062-mdarchecklist1-v1.docx
Download links
A two-part list of links to download the article, or parts of the article, in various formats.
Downloads (link to download the article as PDF)
Open citations (links to open the citations from this article in various online reference manager services)
Cite this article (links to download the citations from this article in formats compatible with various reference manager tools)
Rapid and inducible mislocalization of endogenous TDP43 in a novel human model of amyotrophic lateral sclerosis
eLife 13:RP95062.
https://doi.org/10.7554/eLife.95062.3


