Emerging role of oncogenic ß-catenin in exosome biogenesis as a driver of immune escape in hepatocellular carcinoma
- Université de Bordeaux, INSERM, U1312, BRIC, France
- Université de Limoges, INSERM, U1308, CAPTuR, France
- Plateforme OncoProt, Université de Bordeaux, CNRS, INSERM, TBM-Core, US5, UAR3457, France
- Plateforme Protéome, Université de Bordeaux, Bordeaux Proteome, France
- Bordeaux Imaging Center, Université de Bordeaux, CNRS, INSERM, BIC, France
- Université de Bordeaux, CNRS, Interdisciplinary Institute for Neuroscience, IINS, Bordeaux, France
- Plateforme d'histologie, Université de Bordeaux, CNRS, INSERM, TBM-Core, US5, UAR3457, France
Figures
Figure 1
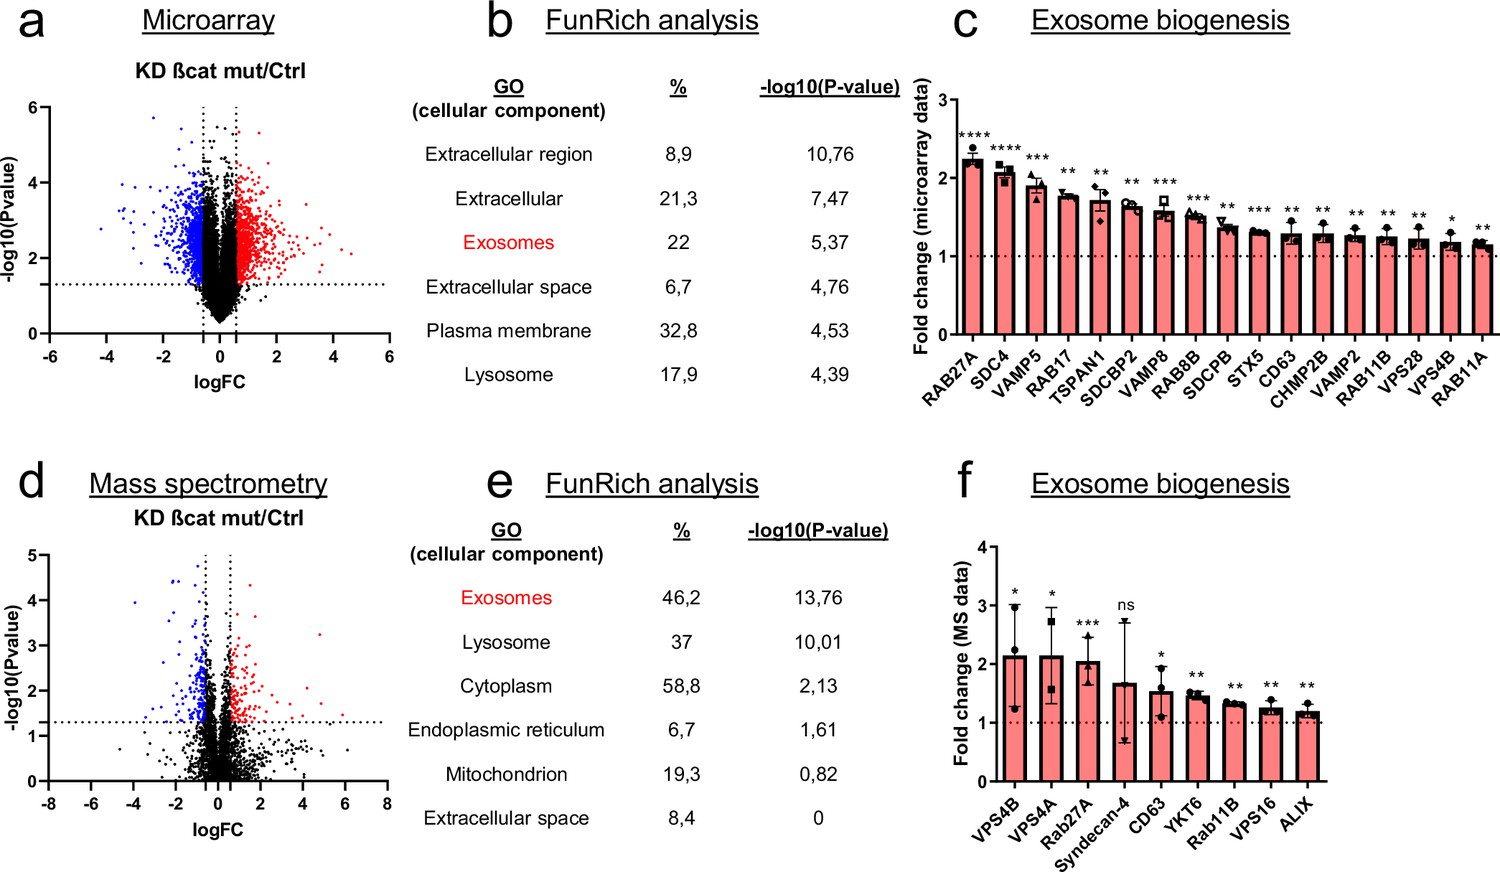
Mutated ß-catenin regulates exosome biogenesis gene expression in HepG2 cells.
(a–f) HepG2 cells were transfected with siRNAs targeting mutated ß-catenin or control siRNAs. (a) Volcano plot of deregulated genes identified by microarray based-transcriptomic analysis. Red and blue dots indicated respectively significantly up- and down-regulated genes. (b) Upregulation of cellular component genes using FunRich software. (c) Upregulated genes associated with exosome biogenesis pathway. The graph indicates the fold change (FC) when comparing the mutated ß-catenin silencing condition with the control condition. (d) Volcano plot of deregulated proteins identified by mass spectrometry. Red and blue dots indicated respectively significantly up- and down-regulated proteins. (e) Upregulation of cellular component proteins identified using FunRich software. (f) Upregulated proteins associated with exosome biogenesis pathway. The graph indicates the fold change when comparing the mutated ß-catenin silencing condition with the control condition. Results are expressed as Mean ± SEM, two-tailed Student’s t-test analysis. *p<0.05; **p<0.01; ***p<0.001; ****p<0.0001; ns, non-significant.
Figure 2 with 5 supplements
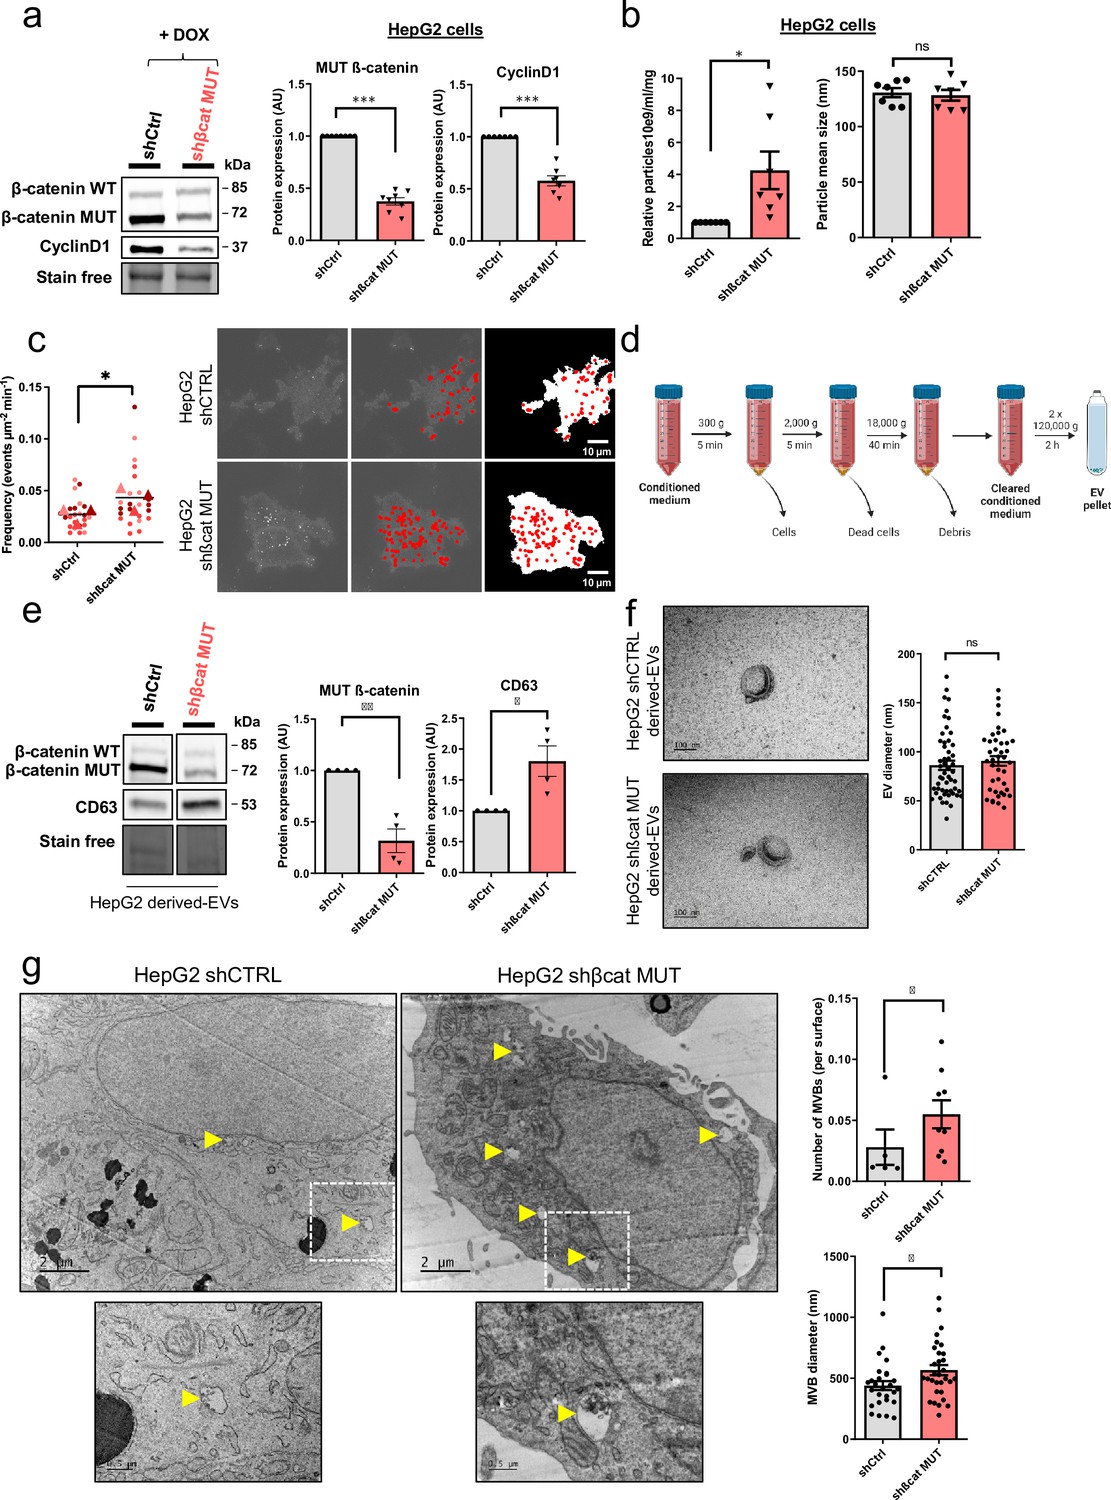
Mutated ß-catenin controls exosome secretion in HepG2 cells.
(a–g) HepG2-shßCat MUT and HepG2-shCtrl cells were treated with doxycycline (DOX) to silence or not mutated ß-catenin. (a) Analysis of ß-catenin and CyclinD1 expression by western-blot. Stain-free was used as a loading control. Graphs show the quantification of seven independent experiments. (b) Nanoparticle tracking analysis of supernatant. Graphs show the quantification of seven independent experiments. (c) Quantification of CD63-pHluorin MVB–PM fusion events visualized by live total internal reflection fluorescence (TIRF) microscopy. Depicted data are representative of three independent experiments, each dot represents one cell. Images represent the cell mask (white) and red dots corresponding to fusion events. Scale bar: 10 µm. (d) Extracellular vesicles (EVs) isolation protocol. Created with BioRender.com, and published using a CC BY-NC-ND license with permission (e) Analysis of ß-catenin and CD63 expression in HepG2-derived EVs. Stain-free was used as a loading control. Graphs show the quantification of four independent experiments. (f) Transmission electron microscopy images of HepG2-derived EVs by close-up. Scale bar: 100 nm. The graph shows the diameter quantification of EVs (n=93). (g) Electron microscopy images of HepG2 shCtrl and shßcat MUT cells showing multivesicular bodies (MVBs) (yellow arrowheads). Scale bar: 2 µm (zoom: 500 nm). The graphs show the quantification of the number of multivesicular bodys (MVBs) per cell and the MVB diameter. (a–g) Results are expressed as Mean ± SEM, two-tailed Student’s t-test analysis. *p<0.05; **p<0.01; ***p<0.001; ns, non-significant.
© 2024, BioRender Inc. Figure 2 was created using BioRender, and is published under a CC BY-NC-ND 4.0. Further reproductions must adhere to the terms of this license
-
Figure 2—source data 1
Original file for the Western blot analysis in Figure 2a (anti-ß-catenin).
- https://cdn.elifesciences.org/articles/95191/elife-95191-fig2-data1-v1.zip
-
Figure 2—source data 2
Original file for the Western blot analysis in Figure 2a (anti-cyclin D1).
- https://cdn.elifesciences.org/articles/95191/elife-95191-fig2-data2-v1.zip
-
Figure 2—source data 3
Original file for the Western blot analysis in Figure 2a (stain-free).
- https://cdn.elifesciences.org/articles/95191/elife-95191-fig2-data3-v1.zip
-
Figure 2—source data 4
PDF containing Figure 2a and original scans of the relevant Western blot analysis (anti-ß-catenin, anti-cyclin D1, and stain-free) with highlighted bands and sample labels.
- https://cdn.elifesciences.org/articles/95191/elife-95191-fig2-data4-v1.pdf
-
Figure 2—source data 5
Original file for the Western blot analysis in Figure 2e (anti-ß-catenin).
- https://cdn.elifesciences.org/articles/95191/elife-95191-fig2-data5-v1.zip
-
Figure 2—source data 6
Original file for the Western blot analysis in Figure 2e (anti-CD63).
- https://cdn.elifesciences.org/articles/95191/elife-95191-fig2-data6-v1.zip
-
Figure 2—source data 7
Original file for the Western blot analysis in Figure 2e (stain-free).
- https://cdn.elifesciences.org/articles/95191/elife-95191-fig2-data7-v1.zip
-
Figure 2—source data 8
PDF containing Figure 2e and original scans of the relevant Western blot analysis (anti-ß-catenin, anti-CD63, and stain- free) with highlighted bands and sample labels.
- https://cdn.elifesciences.org/articles/95191/elife-95191-fig2-data8-v1.pdf
Figure 2—figure supplement 1

Analysis of ß-catenin targets.
Analysis of CCND1, AXIN2, and ARG1 mRNA expression by RT-qPCR. HepG2 cells were treated with doxycycline to express either a control shRNA (shCtrl) or a shRNA targeting mutated ß-catenin (shßcat MUT). The graph shows the quantification of six independent experiments. Results are expressed as Mean ± SEM, two-tailed Student’s t-test analysis. **p<0.01; ***p<0.001.
Figure 2—figure supplement 2
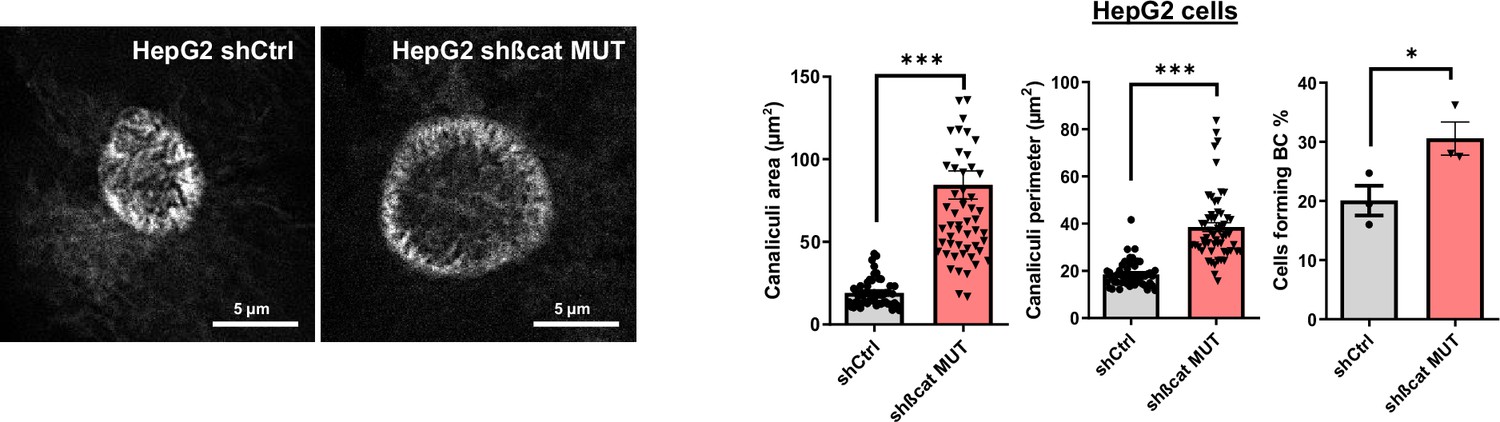
Bile canaliculi in HepG2 cells treated with doxycycline to express either a control shRNA (shCtrl) or a shRNA targeting mutated ß-catenin (shßcat MUT).
(left panel) Cells were stained using fluorescent phalloidin and imaged by confocal microscopy. Images are showing bile canaliculi (BC). Scale bar: 5 µm. (right panel) Quantification of BC area, perimeter, and percentage of cells forming BC. Depicted data are representative of three independent experiments with twenty BC per experiment, each dot represents one BC. Results are expressed as Mean ± SEM, two-tailed Student’s t-test analysis. *p<0.05; ***p<0.001.
Figure 2—figure supplement 3

Nanoparticle tracking analysis of supernatant from HepG2 cell transfected with control (siCtrl) or mutated ß-catenin targeting (sißcat MUT) siRNA.
The graphs show the quantification of the number of particles (left panel) and of the particle size (right panel) of seven independent experiments. Results are expressed as Mean ± SEM, two-tailed Student’s t-test analysis. *p<0.05; ns, non-significant.
Figure 2—figure supplement 4

Study of CD63-pHluorin MVB–PM fusion events.
CD63-pHluorin MVB–PM fusion events were visualized by live TIRF microscopy in HepG2 cells treated with doxycycline to express a shRNA targeting mutated ß-catenin (shßcat MUT). Scale bar: 1 µm.
Figure 2—figure supplement 5
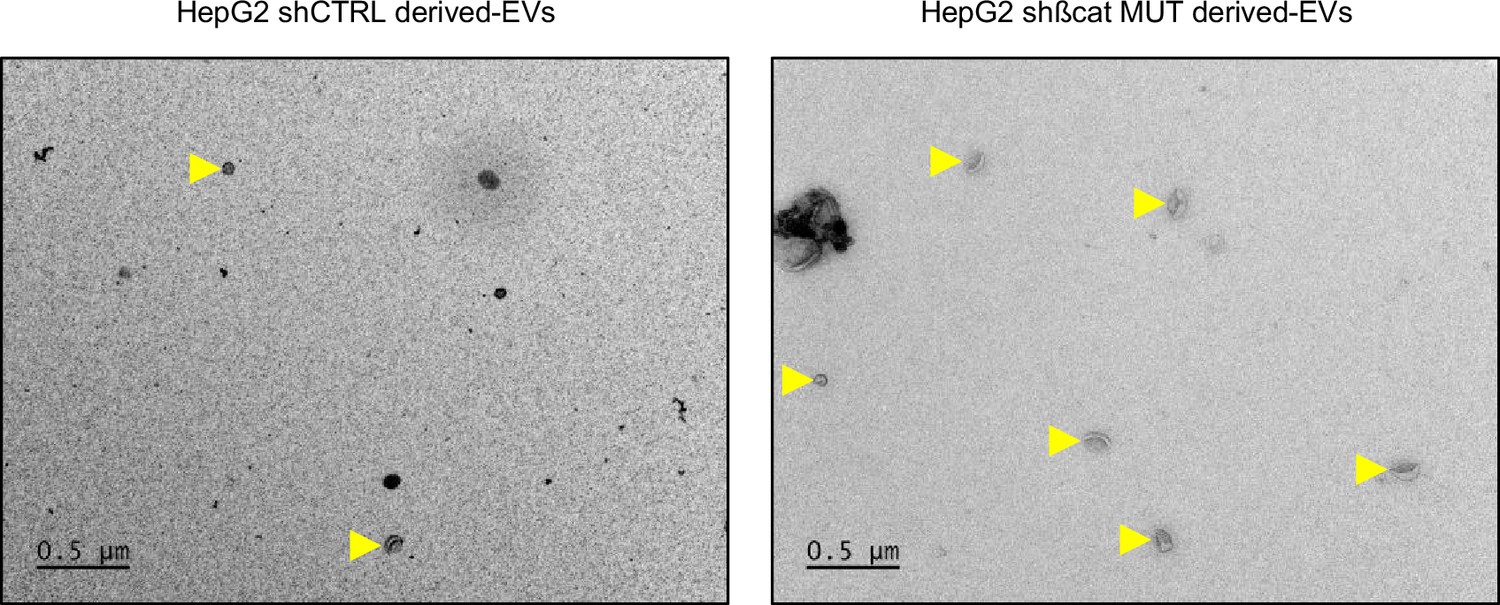
Transmission electron microscopy of extracellular vesicles (EVs).
Transmission electron microscopy images of HepG2-derived EVs by wide-field (yellow arrowheads). HepG2 cells were treated with doxycycline to express either a control shRNA (shCtrl) or a shRNA targeting mutated ß-catenin (shßcat MUT). Scale bar: 500 nm.
Figure 3 with 6 supplements
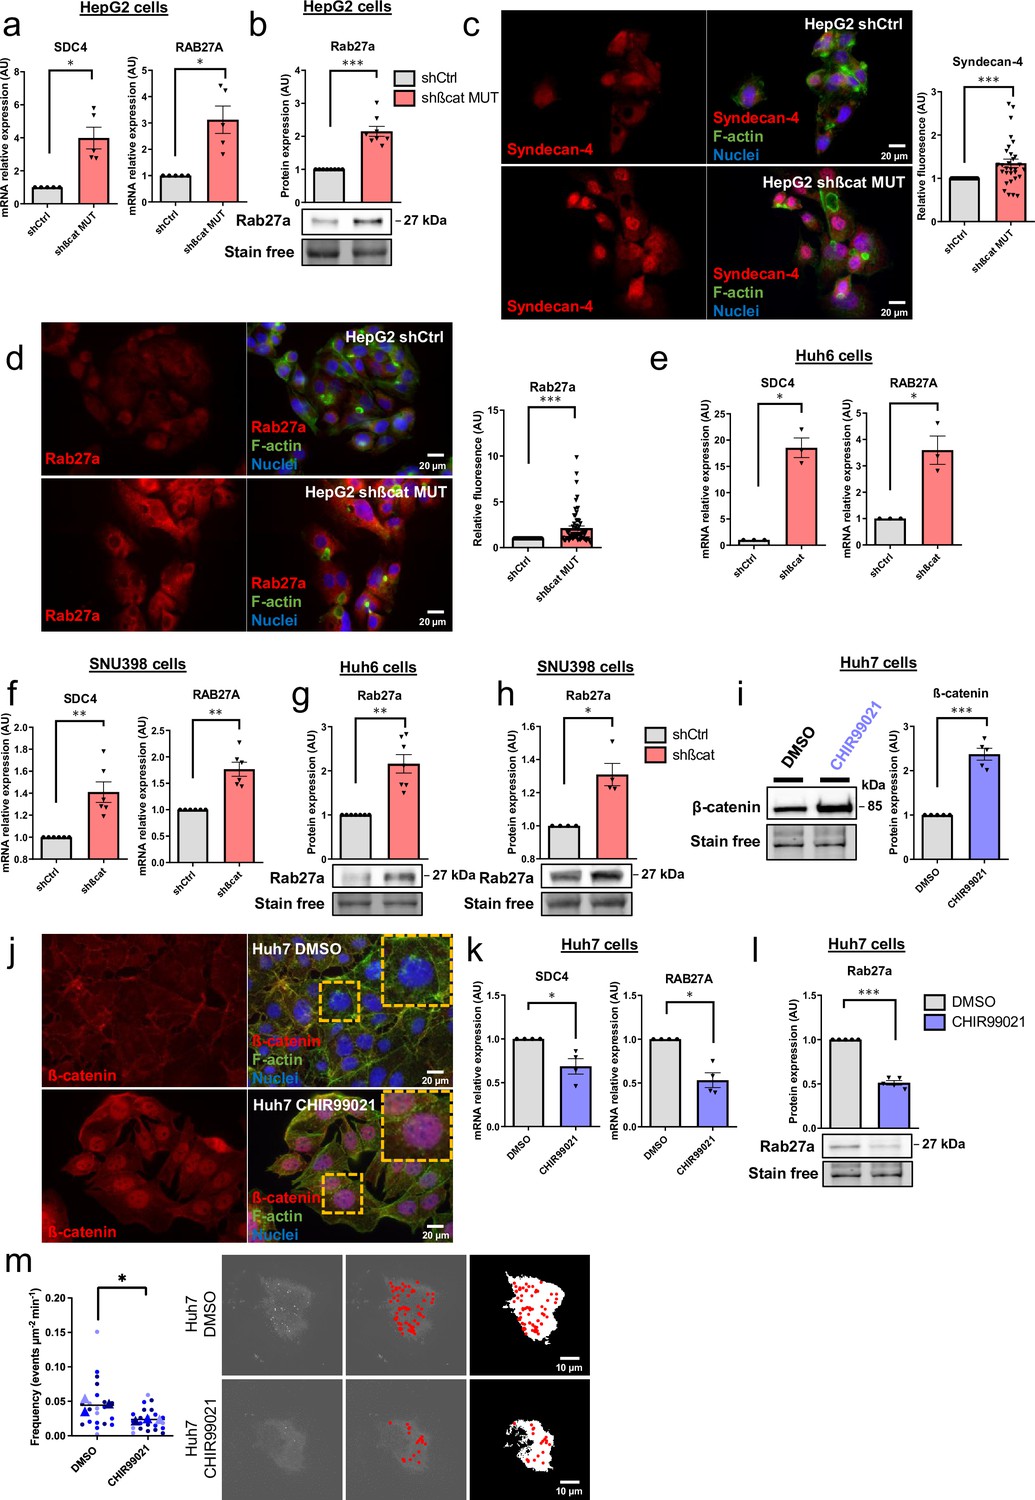
Activated ß-catenin represses SDC4 and RAB27A expression in liver cancer cells.
(a–d) HepG2 cells were treated with doxycycline (DOX) to express either a control shRNA (shCtrl) or a shRNA targeting mutated ß-catenin (shßcat MUT). (a) Analysis of SDC4 and RAB27A mRNA expression by qRT-PCR. Graphs show the quantification. (b) Analysis of Rab27a protein expression by western-blot. Stain-free was used as a loading control. The graph shows the quantification. (c–d) Epifluorescence images of HepG2 shCtrl and shßcat MUT cells stained with Syndecan-4 and Rab27a antibodies (red), Phalloidin (green), Hoechst (blue). Scale bar: 20 µm. Graphs show the quantification of the fluorescence intensity per image and divided per nuclei. Depicted data are representative of three independent experiments, each dot represents one image. (e) Analysis of SDC4 and RAB27A mRNA expression in Huh6 cells expressing either a control shRNA (shCtrl) or a shRNA targeting ß-catenin (shßcat) treated with DOX. The graph shows the quantification. (f) Analysis of SDC4 and RAB27A mRNA expression in SNU398 cells expressing either a control shRNA (shCtrl) or a shRNA targeting ß-catenin (shßcat) treated with DOX. The graph shows the quantification. (g–h) Analysis of Rab27a protein expression in Huh6 (g) or SNU398 (h) cells expressing either a control shRNA (shCtrl) or a shRNA targeting ß-catenin (shßcat). Stain-free was used as a loading control. The graphs show the quantification. (i–m) Huh7 cells treated with DMSO or CHIR99021 (3 µM) for 48 hr. (i) Analysis of ß-catenin expression by western blot. The graph shows the quantification. (j) Epifluorescence images of cells stained with ß-catenin antibody (red), Phalloidin (green), Hoechst (blue). Scale bar: 20 µm. (k) Analysis of SDC4 and RAB27A mRNA expression by qRT-PCR. The graphs show the quantification. (l) Analysis of Rab27a protein expression by western-blot. The graph shows the quantification. (m) Quantification of CD63-pHluorin MVB–PM fusion events visualized by live total internal reflection fluorescence (TIRF) microscopy. Depicted data are representative of three independent experiments; each dot represents one cell. Images represent the cell mask (white) and red dots corresponding to fusion events. (a–m) All graphs show the quantification of at least three independent experiments. Results are expressed as Mean ± SEM, two-tailed Student’s t-test analysis. *p<0.05; **p<0.01; ***p<0.001.
-
Figure 3—source data 1
Original file for the Western blot analysis in Figure 3b (anti-Rab27a).
- https://cdn.elifesciences.org/articles/95191/elife-95191-fig3-data1-v1.zip
-
Figure 3—source data 2
Original file for the Western blot analysis in Figure 3b (stain-free).
- https://cdn.elifesciences.org/articles/95191/elife-95191-fig3-data2-v1.zip
-
Figure 3—source data 3
PDF containing Figure 3b and original scans of the relevant Western blot analysis (anti-Rab27a and stain-free) with highlighted bands and sample labels.
- https://cdn.elifesciences.org/articles/95191/elife-95191-fig3-data3-v1.pdf
-
Figure 3—source data 4
Original file for the Western blot analysis in Figure 3g (anti-Rab27a).
- https://cdn.elifesciences.org/articles/95191/elife-95191-fig3-data4-v1.zip
-
Figure 3—source data 5
Original file for the Western blot analysis in Figure 3g (stain-free).
- https://cdn.elifesciences.org/articles/95191/elife-95191-fig3-data5-v1.zip
-
Figure 3—source data 6
PDF containing Figure 3g and original scans of the relevant Western blot analysis (anti-Rab27a and stain-free) with highlighted bands and sample labels.
- https://cdn.elifesciences.org/articles/95191/elife-95191-fig3-data6-v1.pdf
-
Figure 3—source data 7
Original file for the Western blot analysis in Figure 3h (anti-Rab27a).
- https://cdn.elifesciences.org/articles/95191/elife-95191-fig3-data7-v1.zip
-
Figure 3—source data 8
Original file for the Western blot analysis in Figure 3h (stain- free).
- https://cdn.elifesciences.org/articles/95191/elife-95191-fig3-data8-v1.zip
-
Figure 3—source data 9
PDF containing Figure 3h and original scans of the relevant Western blot analysis (anti-Rab27a and stain-free) with highlighted bands and sample labels.
- https://cdn.elifesciences.org/articles/95191/elife-95191-fig3-data9-v1.pdf
-
Figure 3—source data 10
Original file for the Western blot analysis in Figure 3i (anti-ß-catenin).
- https://cdn.elifesciences.org/articles/95191/elife-95191-fig3-data10-v1.zip
-
Figure 3—source data 11
Original file for the Western blot analysis in Figure 3i (stain- free).
- https://cdn.elifesciences.org/articles/95191/elife-95191-fig3-data11-v1.zip
-
Figure 3—source data 12
PDF containing Figure 3i and original scans of the relevant Western blot analysis (anti-ß-catenin and stain-free) with highlighted bands and sample labels.
- https://cdn.elifesciences.org/articles/95191/elife-95191-fig3-data12-v1.pdf
-
Figure 3—source data 13
Original file for the Western blot analysis in Figure 3l (anti-Rab27a).
- https://cdn.elifesciences.org/articles/95191/elife-95191-fig3-data13-v1.zip
-
Figure 3—source data 14
Original file for the Western blot analysis in Figure 3l (stain-free).
- https://cdn.elifesciences.org/articles/95191/elife-95191-fig3-data14-v1.zip
-
Figure 3—source data 15
PDF containing Figure 3l and original scans of the relevant Western blot analysis (anti-Rab27a and stain-free) with highlighted bands and sample labels.
- https://cdn.elifesciences.org/articles/95191/elife-95191-fig3-data15-v1.pdf
Figure 3—figure supplement 1

Study of SDC4 and Rab27a expression.
Analysis of SDC4 and RAB27A mRNA expression by qRT-PCR (left panel) and of ß-catenin and Rab27a protein expression by Western blot (right panel) in HepG2 cells transfected with control (siCtrl) or mutated ß-catenin targeting (sißcat MUT) siRNA. The graphs show the quantification of at least four independent experiments. Results are expressed as Mean ± SEM, one or two-tailed Student’s t-test analysis. *p<0.05; **p<0.01.
-
Figure 3—figure supplement 1—source data 1
Original file for the Western blot analysis in Figure 3—figure supplement 1 (anti-ß-catenin).
- https://cdn.elifesciences.org/articles/95191/elife-95191-fig3-figsupp1-data1-v1.zip
-
Figure 3—figure supplement 1—source data 2
Original file for the Western blot analysis in Figure 3—figure supplement 1 (anti-Rab27a).
- https://cdn.elifesciences.org/articles/95191/elife-95191-fig3-figsupp1-data2-v1.zip
-
Figure 3—figure supplement 1—source data 3
Original file for the Western blot analysis in Figure 3—figure supplement 1 (stain-free).
- https://cdn.elifesciences.org/articles/95191/elife-95191-fig3-figsupp1-data3-v1.zip
-
Figure 3—figure supplement 1—source data 4
PDF containing Figure 3—figure supplement 1 and original scans of the relevant Western blot analysis (anti-ß-catenin, anti-Rab27a, and stain-free) with highlighted bands and sample labels.
- https://cdn.elifesciences.org/articles/95191/elife-95191-fig3-figsupp1-data4-v1.pdf
Figure 3—figure supplement 2
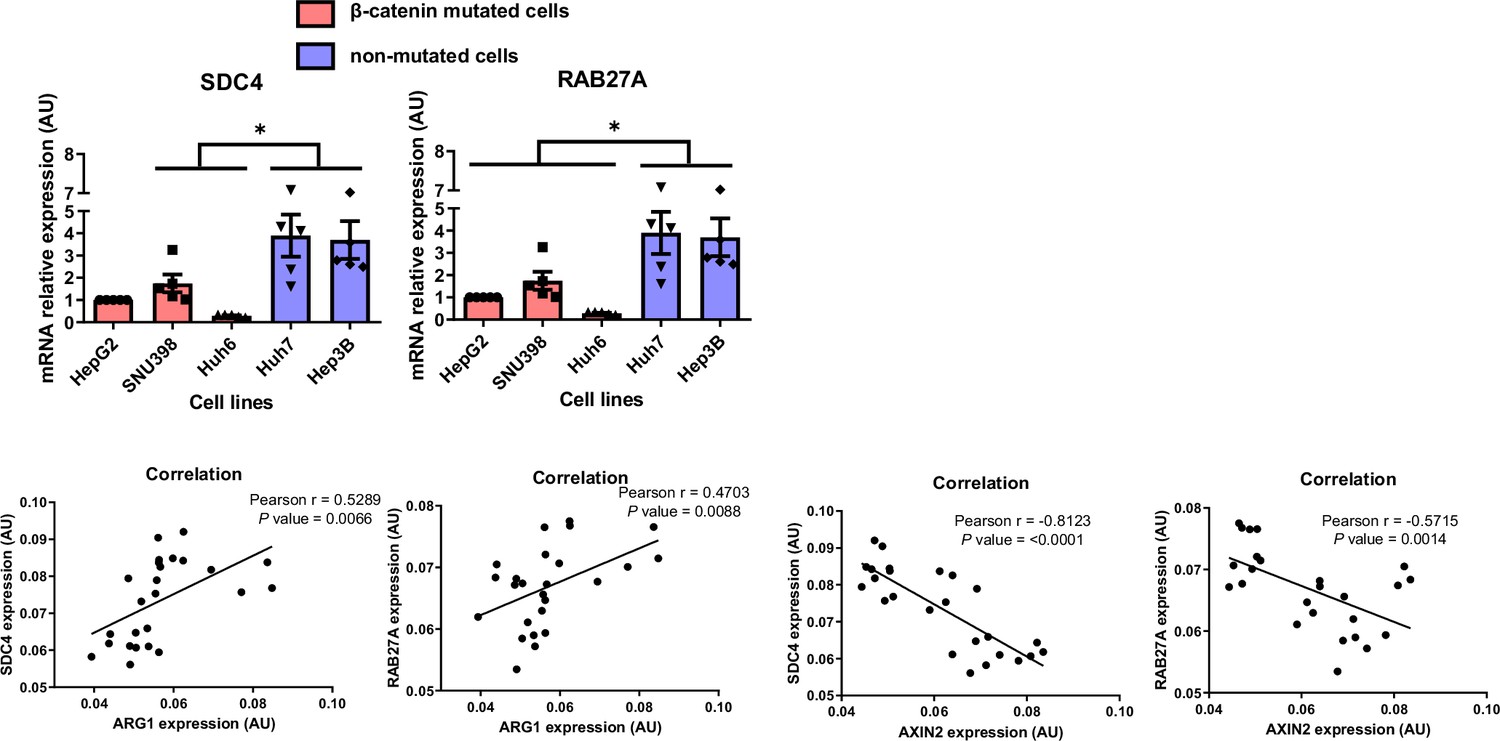
Correlation of expression of SDC4 and RAB27A with ß-catenin targets in liver cancer cell lines mutated (HepG2, SNU398, Huh6) or not (Huh7, Hep3B) for ß-catenin.
(Upper panel) Analyses of SDC4 and RAB27A basal mRNA expression by qRT-PCR. The graphs show the quantification of five independent experiments. Results are expressed as Mean ± SEM, one or two-tailed Student’s t-test analysis. *p<0.05. (Lower panel) Pearson’s correlation analyses of SDC4 and RAB27A with ARG1 or AXIN2 basal mRNA expression in HepG2, SNU398, Huh6, Huh7, and Hep3B cell lines.
Figure 3—figure supplement 3
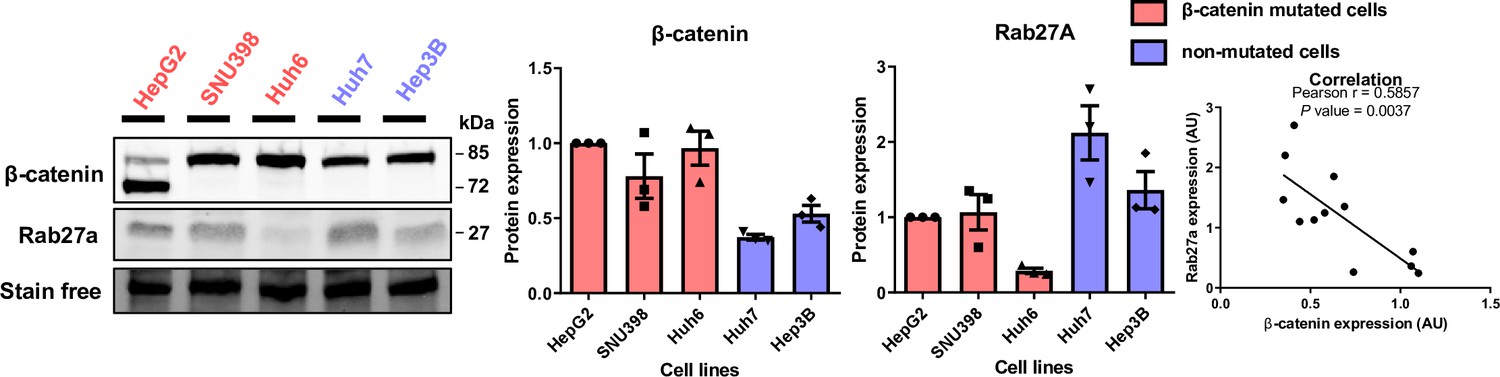
Basal expression of ß-catenin and Rab27a in liver cancer cell lines mutated (HepG2, SNU398, Huh6) or not (Huh7, Hep3B) for ß-catenin.
Analysis of ß-catenin and Rab27a expression by western blot. Stain-free was used as a loading control. Graphs show the quantification of three independent experiments. On the right-hand graph, protein expression was subjected to Pearson’s correlation coefficient analysis.
-
Figure 3—figure supplement 3—source data 1
Original file for the Western blot analysis in Figure 3—figure supplement 3 (anti-ß-catenin).
- https://cdn.elifesciences.org/articles/95191/elife-95191-fig3-figsupp3-data1-v1.zip
-
Figure 3—figure supplement 3—source data 2
Original file for the Western blot analysis in Figure 3—figure supplement 3 (anti-Rab27a).
- https://cdn.elifesciences.org/articles/95191/elife-95191-fig3-figsupp3-data2-v1.zip
-
Figure 3—figure supplement 3—source data 3
Original file for the Western blot analysis in Figure 3—figure supplement 3 (stain-free).
- https://cdn.elifesciences.org/articles/95191/elife-95191-fig3-figsupp3-data3-v1.zip
-
Figure 3—figure supplement 3—source data 4
PDF containing Figure 3—figure supplement 3 and original scans of the relevant Western blot analysis (anti-ß-catenin, anti-Rab27a, and stain- free) with highlighted bands and sample labels.
- https://cdn.elifesciences.org/articles/95191/elife-95191-fig3-figsupp3-data4-v1.pdf
Figure 3—figure supplement 4
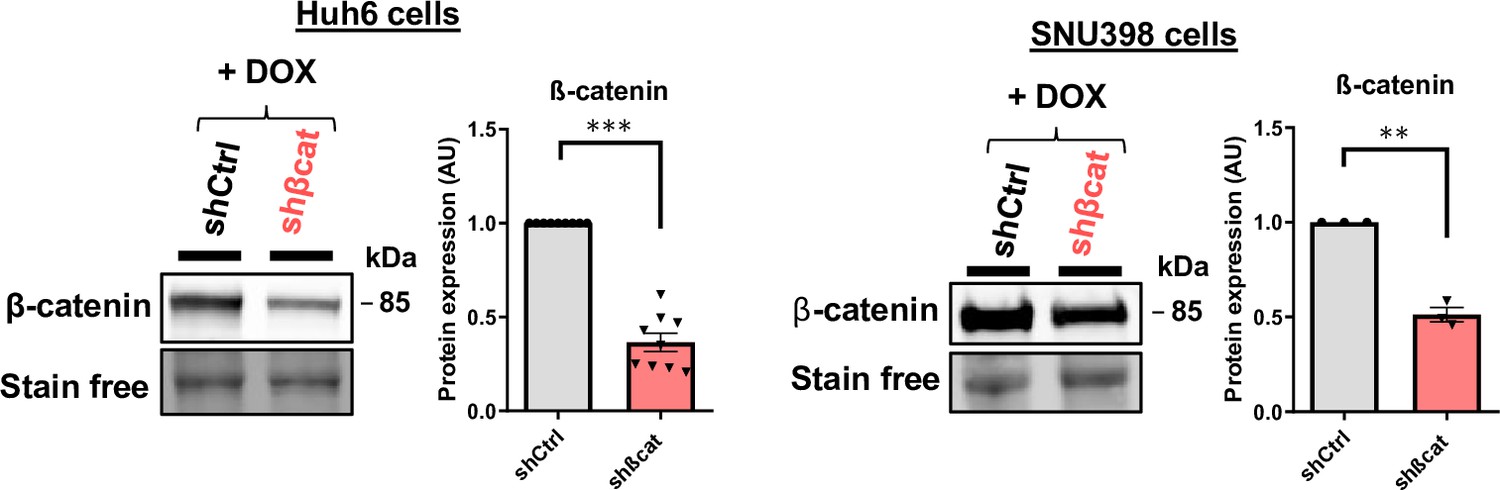
Huh6 and SNU398 model validation.
Analysis of ß-catenin protein expression in Huh6 and SNU398 cells expressing either a control shRNA (shCtrl) or a shRNA targeting ß-catenin (shßcat) treated with doxycycline (DOX). The graphs show the quantification of nine (Huh6 cells) and three (SNU398 cells) independent experiments. Results are expressed as Mean ± SEM, two-tailed Student’s t-test analysis. **p<0.01; ***p<0.001.
-
Figure 3—figure supplement 4—source data 1
Original file for the Western blot analysis in Figure 3—figure supplement 4 (anti-ß-catenin) for Huh6 cells.
- https://cdn.elifesciences.org/articles/95191/elife-95191-fig3-figsupp4-data1-v1.zip
-
Figure 3—figure supplement 4—source data 2
Original file for the Western blot analysis in Figure 3—figure supplement 4 (stain-free) for Huh6 cells.
- https://cdn.elifesciences.org/articles/95191/elife-95191-fig3-figsupp4-data2-v1.zip
-
Figure 3—figure supplement 4—source data 3
PDF containing Figure 3—figure supplement 4 and original scans of the relevant Western blot analysis (anti-ß-catenin and stain- free) with highlighted bands and sample labels for Huh6 cells.
- https://cdn.elifesciences.org/articles/95191/elife-95191-fig3-figsupp4-data3-v1.pdf
-
Figure 3—figure supplement 4—source data 4
Original file for the Western blot analysis in Figure 3—figure supplement 4 (anti-ß-catenin) for SNU398 cells.
- https://cdn.elifesciences.org/articles/95191/elife-95191-fig3-figsupp4-data4-v1.zip
-
Figure 3—figure supplement 4—source data 5
Original file for the Western blot analysis in Figure 3—figure supplement 4 (stain-free) for SNU398 cells.
- https://cdn.elifesciences.org/articles/95191/elife-95191-fig3-figsupp4-data5-v1.zip
-
Figure 3—figure supplement 4—source data 6
PDF containing Figure 3—figure supplement 4 and original scans of the relevant Western blot analysis (anti-ß-catenin and stain-free) with highlighted bands and sample labels for SNU398 cells.
- https://cdn.elifesciences.org/articles/95191/elife-95191-fig3-figsupp4-data6-v1.pdf
Figure 3—figure supplement 5
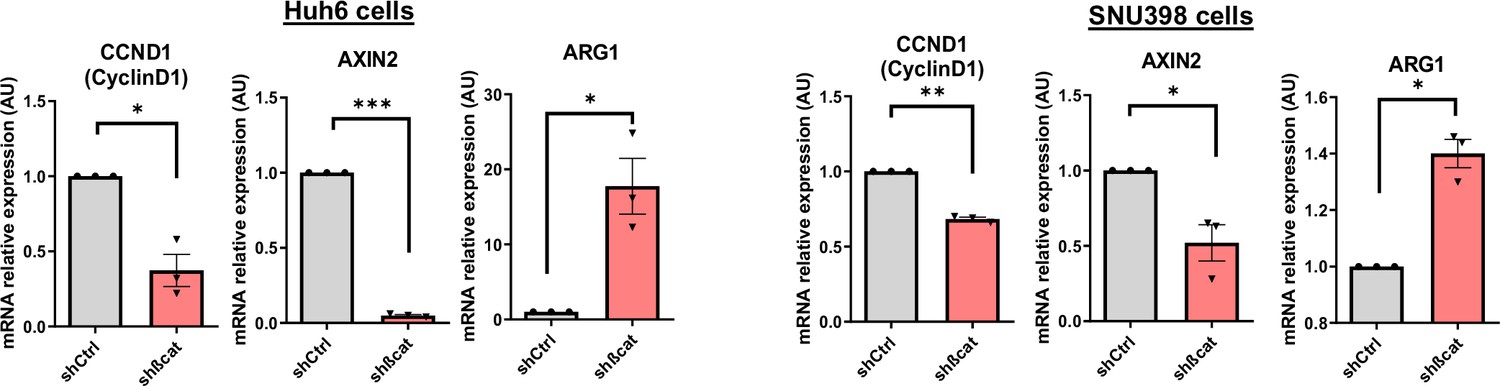
Huh6 and SNU398 model validation.
Analysis of CCND1, AXIN2, and ARG1 mRNA expression in Huh6 and SNU398 shCtrl and shßcat cells treated with doxycycline (DOX). The graph shows the quantification of three independent experiments. Results are expressed as Mean ± SEM, two-tailed Student’s t-test analysis. *p<0.05; **p<0.01; ***p<0.001.
Figure 3—figure supplement 6

Huh7 model validation.
Analysis of AXIN2 and ARG1 mRNA expression in Huh7 cells treated with DMSO or CHIR99021 (3 µM). The graphs show the quantification of four independent experiments. Results are expressed as Mean ± SEM, one or two-tailed Student’s t-test analysis. **p<0.01.
Figure 4 with 3 supplements
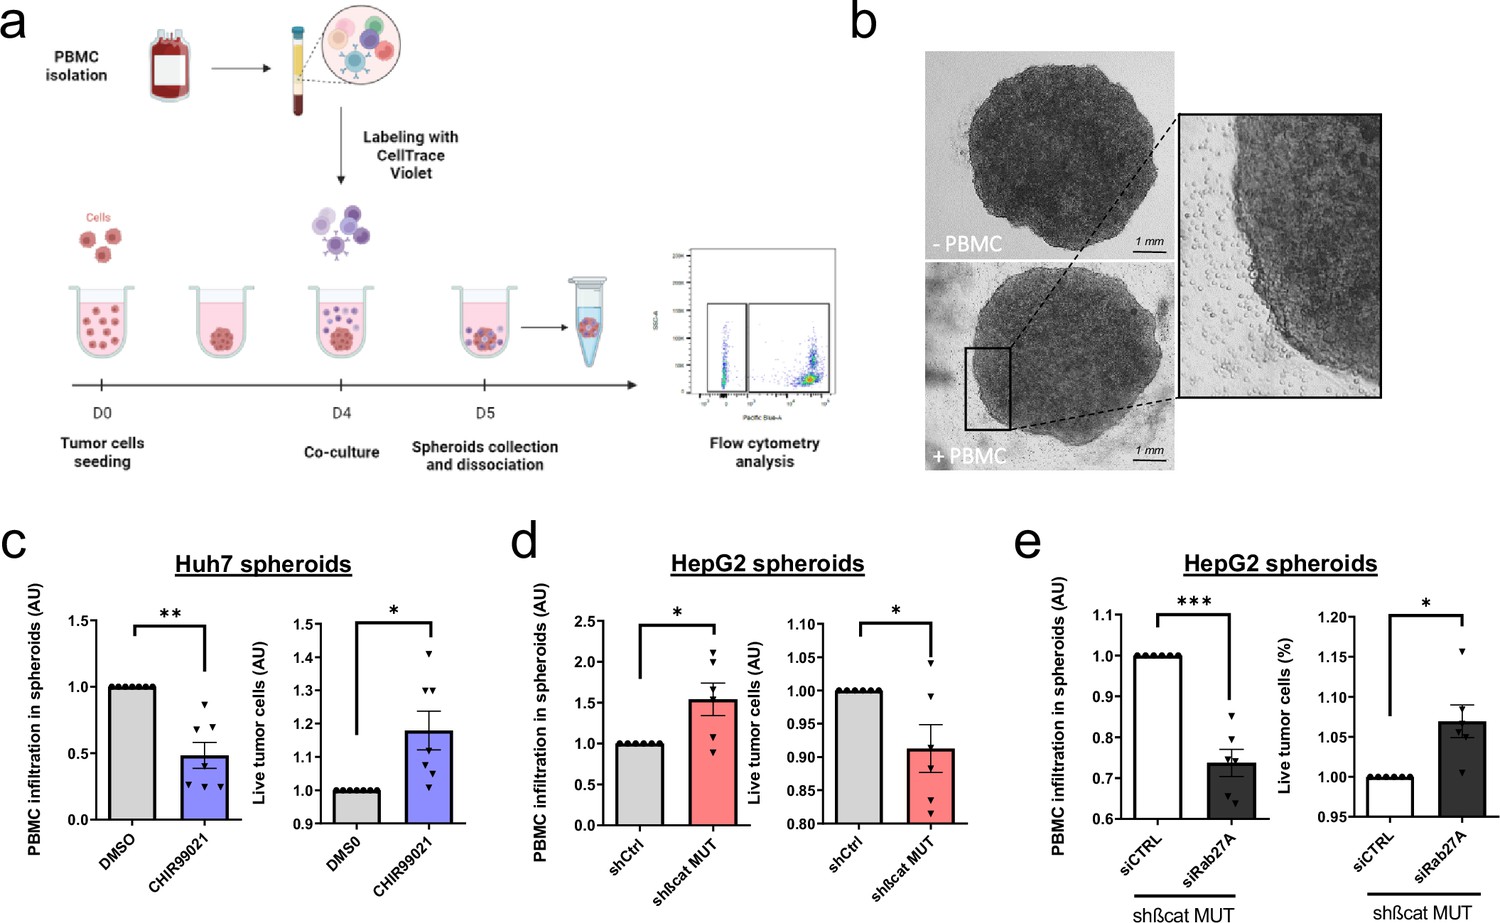
Activated ß-catenin represses immune infiltration in liver cancer spheroids through exosomes.
(a) Peripheral blood mononuclear cells (PBMC) infiltration analysis protocol. Created with BioRender.com, and published using a CC BY-NC-ND license with permission. (b) Images of HepG2 spheroids expressing a control shRNA incubated or not with PBMC for 24 hr. (c) Analysis of PBMC infiltration and tumor cell survival in Huh7 spheroids treated with DMSO or CHIR99021. (d) Analysis of PBMC infiltration and tumor cell survival in HepG2 spheroids expressing control shRNA (shCtrl) or shRNA targeting mutated ß-catenin (shßcat MUT). (e) Analysis of PBMC infiltration and tumor cell survival in HepG2 spheroids co-expressing shRNA targeting mutated ß-catenin (shßcat MUT) and control siRNA (siCtrl) or siRNA targeting Rab27A (siRab27A). (c–e) Graphs show the quantification of six independent experiments. Results are expressed as Mean ± SEM, one or two-tailed Student’s t-test analysis. *p<0.05; **p<0.01; ***p<0.001.
© 2024, BioRender Inc. Figure 4 was created using BioRender, and is published under a CC BY-NC-ND 4.0. Further reproductions must adhere to the terms of this license
Figure 4—figure supplement 1
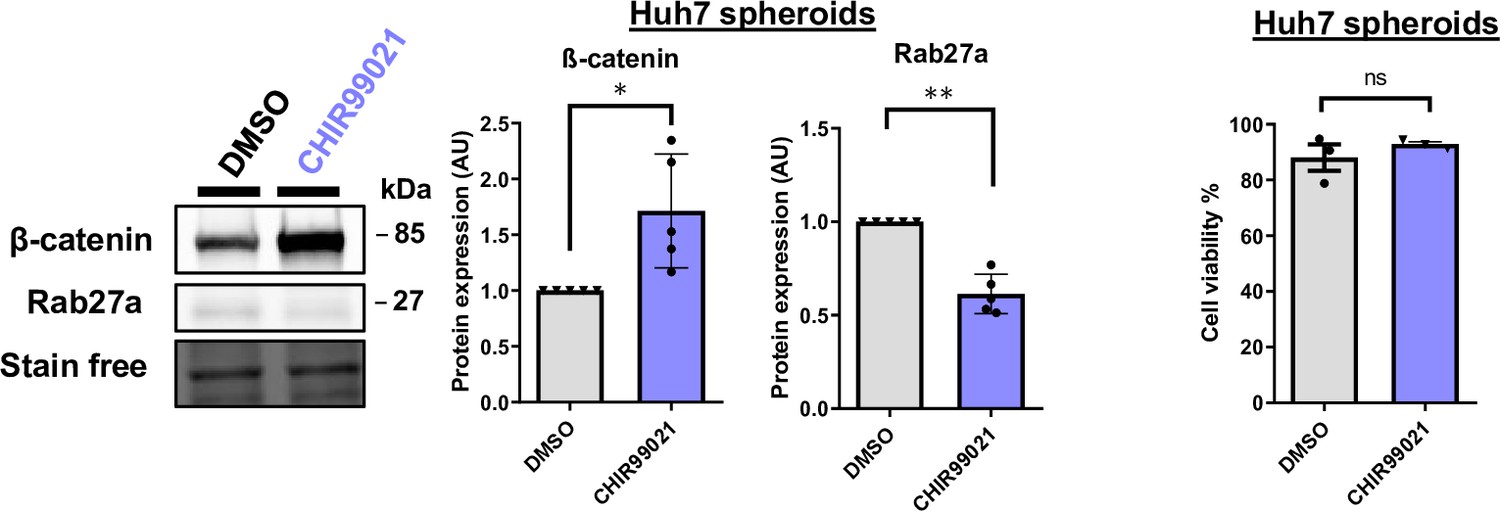
Huh7 3D model validation.
(Right panel) ß-catenin and Rab27a expressions were analyzed by western-blot in Huh7 spheroids treated with DMSO or CHIR99021 (3 µM). (Left panel) Cell viability of Huh7 spheroids (DMSO and CHIR99021). All graphs show the quantification of at least three independent experiments. Results are expressed as Mean ± SEM, one or two-tailed Student’s t-test analysis. *p<0.05; **p<0.01; ns, non-significant.
-
Figure 4—figure supplement 1—source data 1
Original file for the Western blot analysis in Figure 4—figure supplement 1 (anti-ß-catenin).
- https://cdn.elifesciences.org/articles/95191/elife-95191-fig4-figsupp1-data1-v1.zip
-
Figure 4—figure supplement 1—source data 2
Original file for the Western blot analysis in Figure 4-figure supplement 1 (anti Rab27a).
- https://cdn.elifesciences.org/articles/95191/elife-95191-fig4-figsupp1-data2-v1.zip
-
Figure 4—figure supplement 1—source data 3
Original file for the Western blot analysis in Figure 4-figure supplement 1 (stain-free).
- https://cdn.elifesciences.org/articles/95191/elife-95191-fig4-figsupp1-data3-v1.zip
-
Figure 4—figure supplement 1—source data 4
PDF containing Figure 4—figure supplement 1 and original scans of the relevant Western blot analysis (anti-ß-catenin, anti-Rab27a, and stain-free) with highlighted bands and sample labels.
- https://cdn.elifesciences.org/articles/95191/elife-95191-fig4-figsupp1-data4-v1.pdf
Figure 4—figure supplement 2
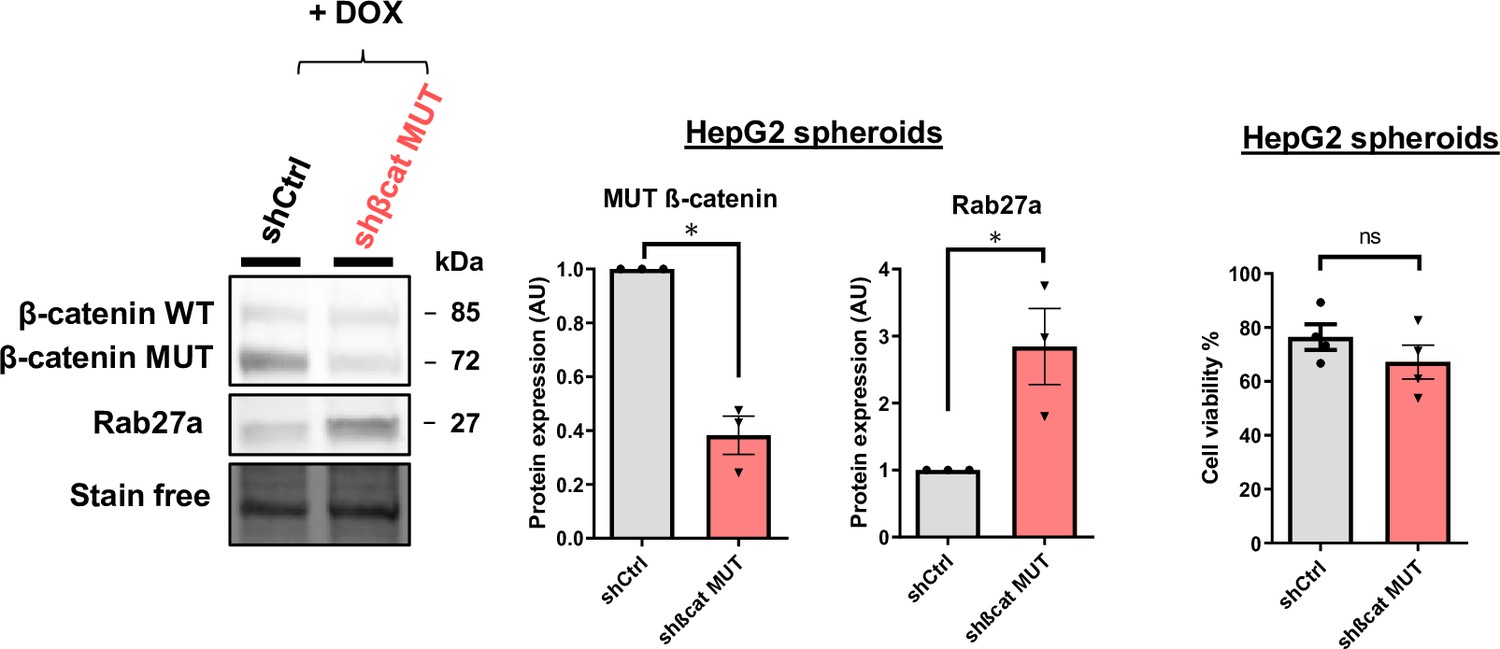
HepG2 3D model validation.
HepG2 cells were treated with doxycycline (DOX) to express either a control shRNA (shCtrl) or a shRNA targeting mutated ß-catenin (shßcat MUT) and grown in spheroids. (left panel) ß-catenin and Rab27a expressions were analyzed by western-blot. (right panel) Cell viability of HepG2 shCtrl and shßcat MUT spheroids. Graphs show the quantification of at least three independent experiments. Results are expressed as Mean ± SEM, one or two-tailed Student’s t-test analysis. *p<0.05; ns, non-significant.
-
Figure 4—figure supplement 2—source data 1
Original file for the Western blot analysis in Figure 4—figure supplement 2 (anti-ß-catenin).
- https://cdn.elifesciences.org/articles/95191/elife-95191-fig4-figsupp2-data1-v1.zip
-
Figure 4—figure supplement 2—source data 2
Original file for the Western blot analysis in Figure 4—figure supplement 2 (anti-Rab27a).
- https://cdn.elifesciences.org/articles/95191/elife-95191-fig4-figsupp2-data2-v1.zip
-
Figure 4—figure supplement 2—source data 3
Original file for the Western blot analysis in Figure 4—figure supplement 2 (stain-free).
- https://cdn.elifesciences.org/articles/95191/elife-95191-fig4-figsupp2-data3-v1.zip
-
Figure 4—figure supplement 2—source data 4
PDF containing Figure 4—figure supplement 2 and original scans of the relevant Western blot analysis (anti-ß-catenin, anti-Rab27a, and stain-free) with highlighted bands and sample labels.
- https://cdn.elifesciences.org/articles/95191/elife-95191-fig4-figsupp2-data4-v1.pdf
Figure 4—figure supplement 3
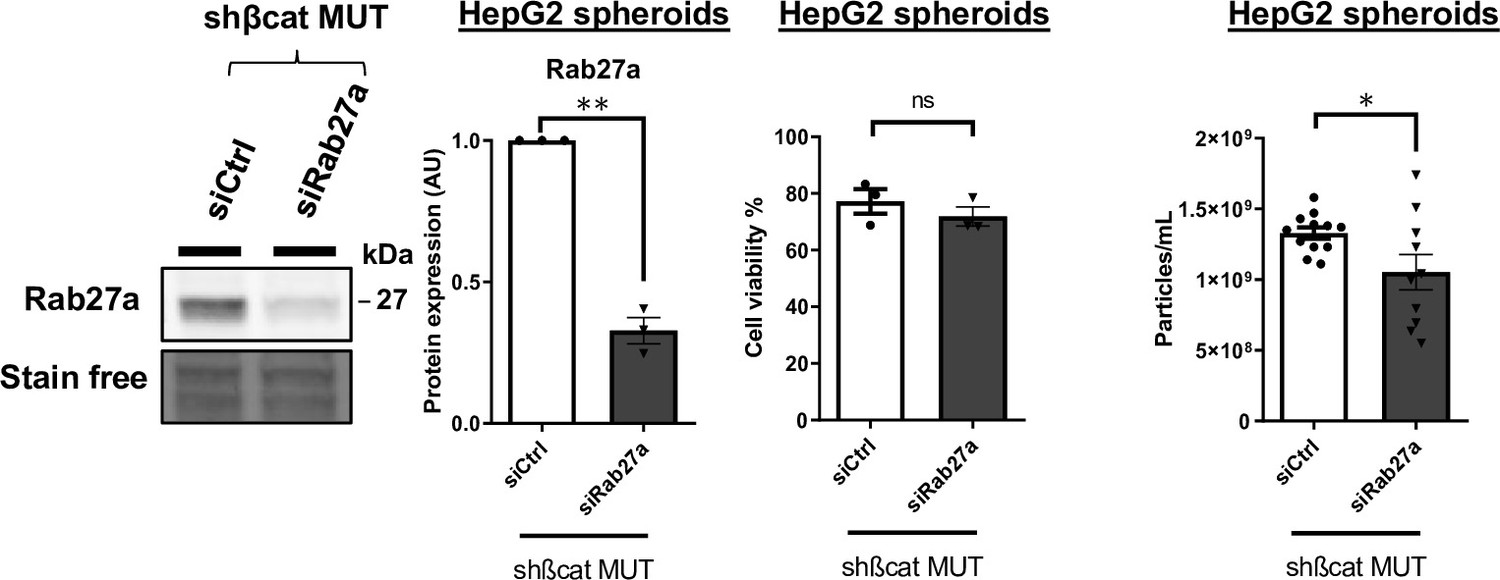
Silencing of Rab27A in HepG2 3D model.
Analysis of Rab27a expression in HepG2 spheroids co-expressing shßcat MUT and control siRNA (siCtrl) or siRNA targeting Rab27A (siRab27A) (left panel). Cell viability of HepG2 shßcat MUT spheroids treated with siCtrl or siRab27a (middle panel). Nanoparticle tracking analysis of supernatant from HepG2 shßcat MUT spheroids treated with siCtrl or siRab27a (right panel). All graphs show the quantification of at least three independent experiments. Results are expressed as Mean ± SEM, one or two-tailed Student’s t-test analysis. *p<0.05; **p<0.01; ns, non-significant.
-
Figure 4—figure supplement 3—source data 1
Original file for the Western blot analysis in Figure 4—figure supplement 3 (anti-Rab27a).
- https://cdn.elifesciences.org/articles/95191/elife-95191-fig4-figsupp3-data1-v1.zip
-
Figure 4—figure supplement 3—source data 2
Original file for the Western blot analysis in Figure 4—figure supplement 3 (stain-free).
- https://cdn.elifesciences.org/articles/95191/elife-95191-fig4-figsupp3-data2-v1.zip
-
Figure 4—figure supplement 3—source data 3
PDF containing Figure 4—figure supplement 3 and original scans of the relevant Western blot analysis (anti-Rab27a and stain-free) with highlighted bands and sample labels.
- https://cdn.elifesciences.org/articles/95191/elife-95191-fig4-figsupp3-data3-v1.pdf
Figure 5 with 2 supplements
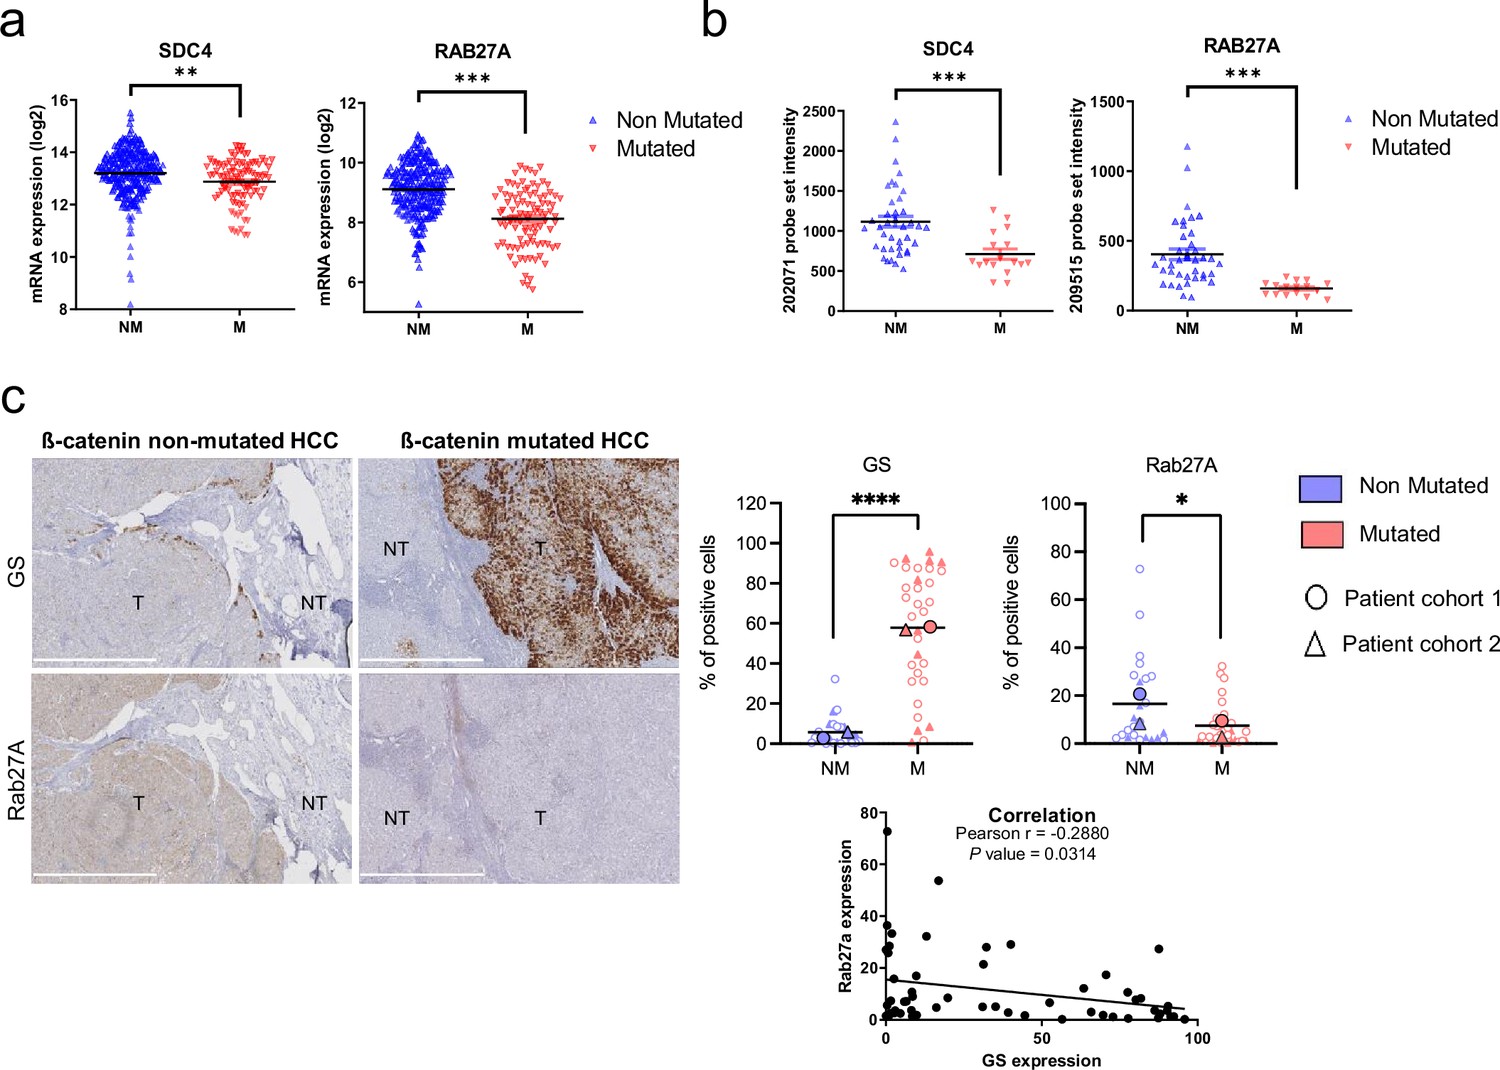
Downregulation of SDC4 and RAB27A in human hepatocellular carcinoma (HCC) samples with CTNNB1 mutations.
(a) Analysis of SDC4 and RAB27A mRNA expression in ß-catenin mutated (red) and non-mutated (blue) HCC (Cbioportal cohort, n=366). (b) Analysis of SDC4 and RAB27A mRNA expression in ß-catenin mutated (red) and non-mutated (blue) HCC (Boyault et al. cohort, n=56). (c) Immunohistochemistry (IHC) analysis of glutamine synthetase (GS) and Rab27a in HCC samples presenting or not ß-catenin mutations. Scale bar: 1 mm. (T: tumoral, NT: non tumoral). The upper graphs show the quantification of the percentage of cells positive for GS or Rab27A. The analysis was split into two cohorts (circle and triangle). The lower graph shows the Pearson correlation between Rab27a and GS protein expression (n=56). Results are expressed as Mean ± SEM, two-tailed Student’s t-test analysis, or Pearson correlation test. *p<0.05; **p<0.01; ***p<0.001; ****p<0.0001.
Figure 5—figure supplement 1
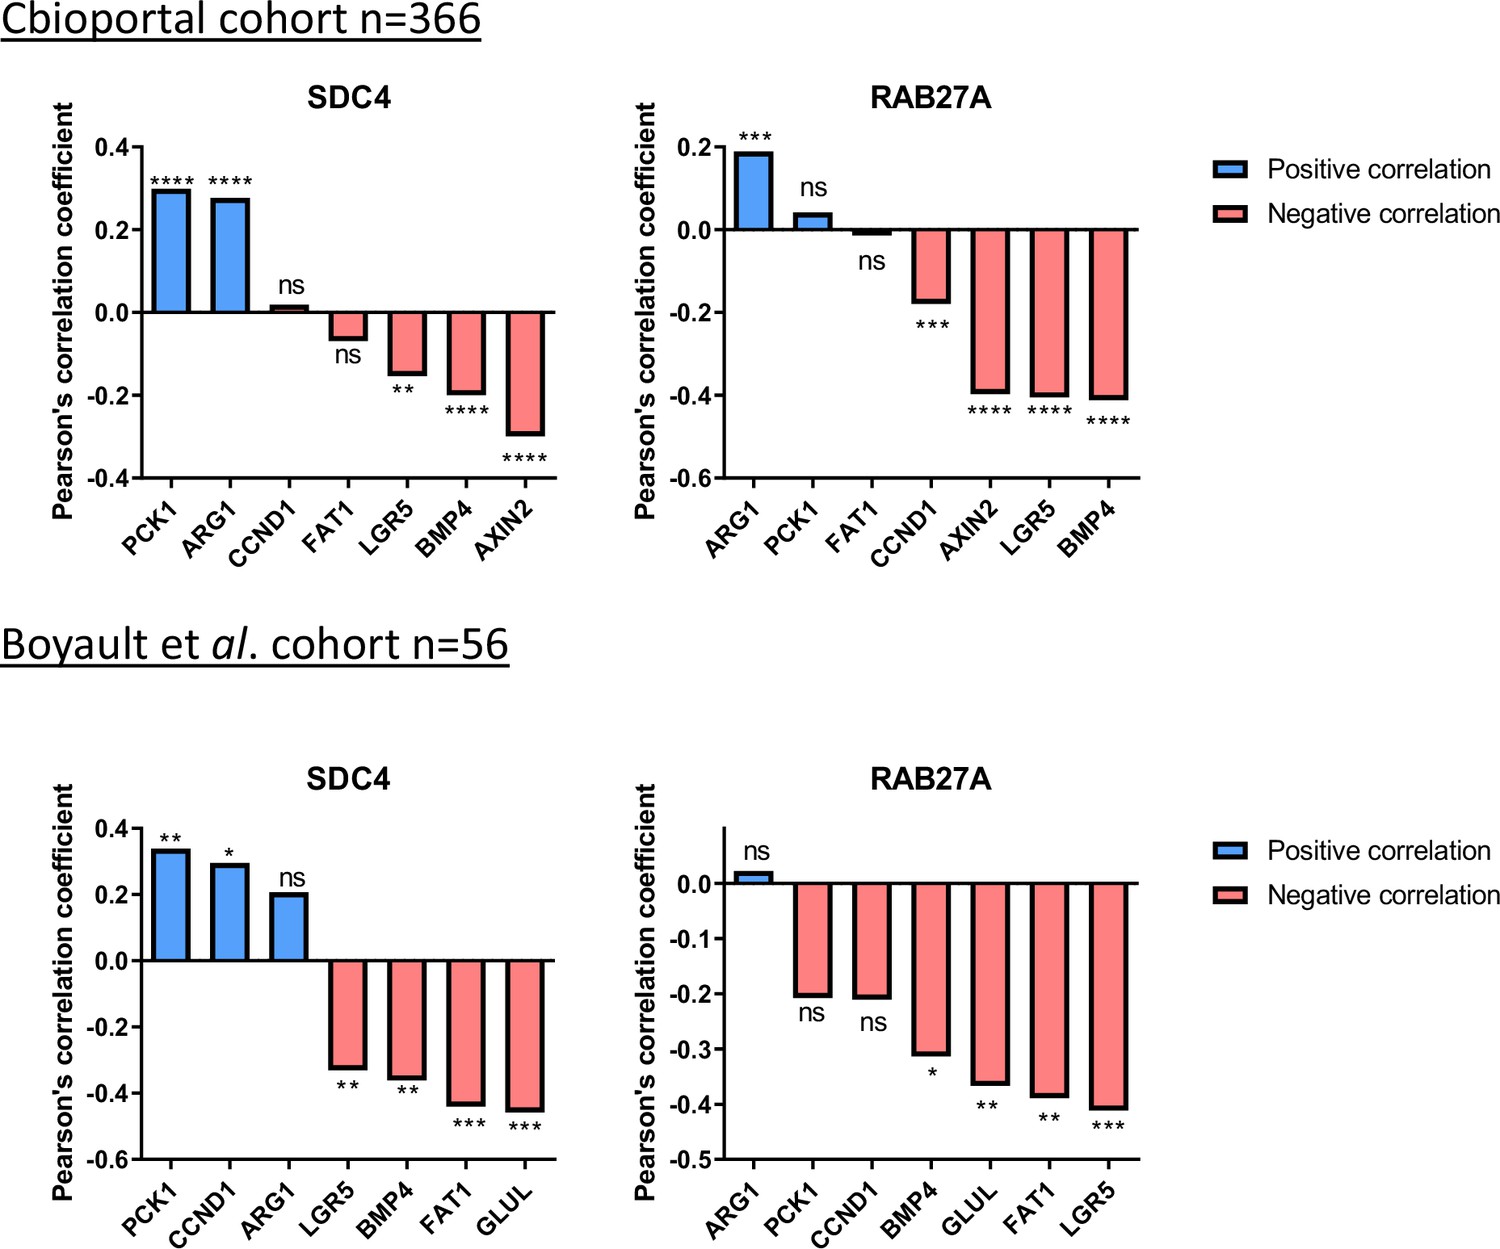
Correlation of expression of SDC4 and RAB27A with various ß-catenin targets in human hepatocellular carcinoma (HCC) samples with CTNNB1 mutations.
(Upper panel) Analysis of SDC4 and RAB27A mRNA expression in ß-catenin-mutated (red) and non-mutated (blue) HCC (Cbioportal cohort n=366). (Lower panel) Analysis of SDC4 and RAB27A mRNA expression in ß-catenin mutated (red) and non-mutated (blue) HCC (Boyault et al. cohort n=56). Results are expressed as Pearson correlation test. *p<0.05; **p<0.01; ***p<0.001; ****p<0.0001; ns, non-significant.
Figure 5—figure supplement 2
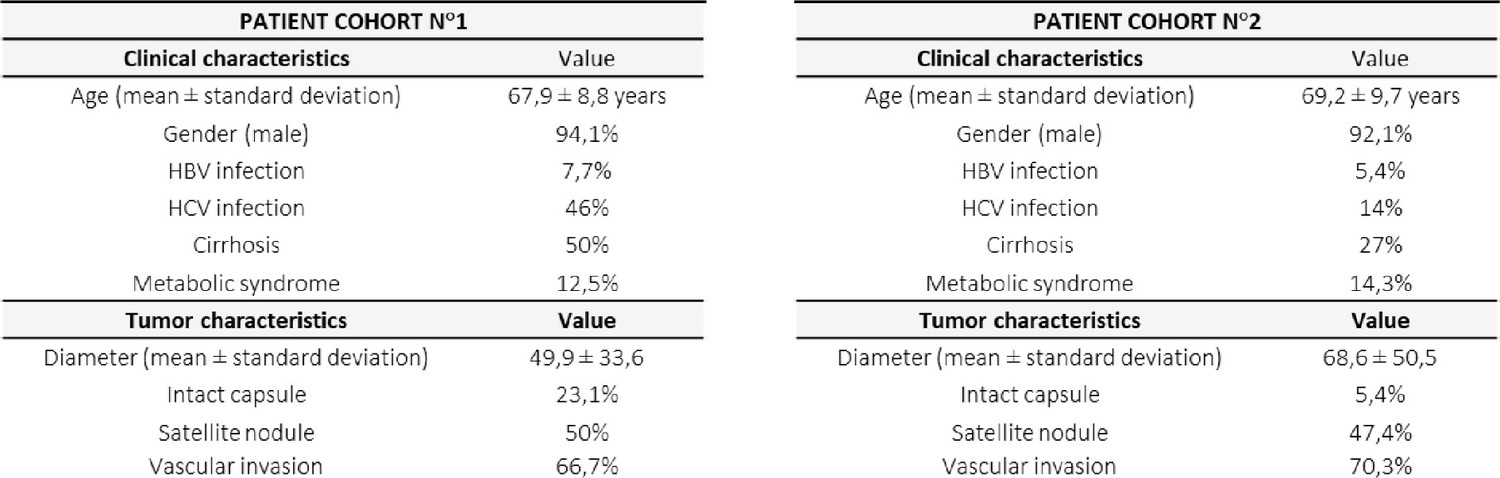
Description of patient cohorts used for the immunohistochemical analysis.
Author response image 1

Impact of a GSK inhibitor (CHIR99021) on Rab27a and syndecan-4 (SDC4) expressions in HepG2 cells.
HepG2 cells were treated by 3 µM CHIR990221 or DMSO as control for 48h. (A) Western-blot (upper panel) and quantification (lower panel) of wild-type (WT) and mutated (MUT) β-catenin proteins in HepG2 cells treated with DMSO (control) or with CHIR990221. (B) qRT-PCR analysis of Rab27a and SDC4 expression in HepG2 cells treated with DMSO (control) or with CHIR990221. (C) Western-blot (left panel) and quantification (right panel) of Rab27a protein in HepG2 cells treated with DMSO (control) or with CHIR990221. *P<0.05
Videos
Video 1
HepG2-shCtrl.
Cells were recorded under TIRF illumination on a microscope (IX83; Olympus) for 2 min. Videos show exocytic events (suddenly appearing fluorescent dots) corresponding to MVB-PM fusion.
Video 2
HepG2-shßCat MUT.
Cells were recorded under TIRF illumination on a microscope (IX83; Olympus) for 2 min. Videos show exocytic events (suddenly appearing fluorescent dots) corresponding to MVB-PM fusion.
Video 3
Huh7 treated with DMSO.
Cells were recorded under total internal reflection fluorescence (TIRF) illumination on a microscope (IX83; Olympus) for 2 min. Videos show exocytic events (suddenly appearing fluorescent dots) corresponding to MVB-PM fusion.
Video 4
CHIR99021 cells were transfected with CD63-pHluorin corresponding to Figures 2c and 3m.
Cells were recorded under total internal reflection fluorescence (TIRF) illumination on a microscope (IX83; Olympus) for 2 min. Videos show exocytic events (suddenly appearing fluorescent dots) corresponding to MVB-PM fusion.
Tables
Key resources table
| Reagent type (species) or resource | Designation | Source or reference | Identifiers | Additional information |
|---|---|---|---|---|
| Cell line (Homo sapiens) | Hepatocellular carcinoma | ATCC | HepG2 | |
| Cell line (Homo sapiens) | Hepatocellular carcinoma | ATCC | Huh7 | |
| Cell line (Homo sapiens) | Hepatocellular carcinoma | ATCC | SNU398 | |
| Cell line (Homo sapiens) | Hepatoblastoma | Perret (Paris, France) | Huh6 | |
| Transfected construct (human) | AllStars negative-control siRNA | Qiagen | SI03650318 | |
| Transfected construct (human) | siRNA to ß-catenin | Eurofins Genomics Gest et al., 2023 | ||
| Transfected construct (human) | siRNA to Rab27A | Sigma | MISSION EHU091501 | |
| Transfected construct (human) | pCMV-Sport6-CD36-pHluorin | Addgene | Plasmid# 130901 | TIRF experiment |
| Transfected construct (human) | Tet-pLKO-puro lentivirus vector | Addgene | plasmid# 21915 | Lentiviral construct to transfect and express the shRNA. |
| Peptide, recombinant protein | pLKO-Tet-On-shRNA-Control | Addgene | plasmid# 398398 | |
| Chemical compound, drug | GSK3 inhibitor CHIR99021 | Sigma | SML1046 | 3 µM |
| Biological sample (Homo sapiens) | PBMC | EFS | Freshly isolated from human blood | |
| Other | CellTrace Violet | Life Technologies | 5 µM, FACS experiment to detect immune cells | |
| Other | Propidium Iodide | Sigma | P4170 | 1/500 dilution, FACS experiment to detect dead cells |
| Sequence-based reagent | CCND1_F | Gest et al., 2023 | PCR primers | CATCAAGTGTGACCCGGACTG |
| Sequence-based reagent | CCND1_R | Gest et al., 2023 | PCR primers | CCTCCTCCTCAGTGGCCTTG |
| Sequence-based reagent | AXIN2_F | Gest et al., 2023 | PCR primers | TGCTCTGTTTTGTCTTAAAGGTCTTGA |
| Sequence-based reagent | AXIN2_R | Gest et al., 2023 | PCR primers | ACAGATCATCCCATCCAACACA |
| Sequence-based reagent | ARG1_F | Gest et al., 2023 | PCR primers | GTGGACAGACTAGGAATTGGC |
| Sequence-based reagent | ARG1_R | Gest et al., 2023 | PCR primers | TCCAGTCCGTCAACATCAAAAC |
| Sequence-based reagent | RAB27A_F | This paper | PCR primers | GAAGCCATAGCACTCGCAGAG |
| Sequence-based reagent | RAB27A_R | This paper | PCR primers | ATGACCATTTGATCGCACCA |
| Sequence-based reagent | SDC4_F | This paper | PCR primers | CGATGAGGATGTAGTGGGGC |
| Sequence-based reagent | SDC4_R | This paper | PCR primers | GACAACTTCAGGGCCGATCA |
| Sequence-based reagent | 18 S_F | Gest et al., 2023 | PCR primers | GTAACCCGTTGAACCCCATT |
| Sequence-based reagent | 18 S _R | Gest et al., 2023 | PCR primers | CCATCCAATCGGTAGTAGCG |
| Antibody | Anti-ß-catenin (mouse monoclonal) | BD Biosciences | 610154 | WB: 1/2000, IF: 1/400 |
| Antibody | Anti-Cyclin D1 (mouse monoclonal) | Santa Cruz | sc-20044 | WB: 1/1000 |
| Antibody | Anti-Rab27a (rabbit monoclonal) | Cell signaling | 69295 | WB: 1/1000, IF: 1/800, IHC: 1/100 pH6 |
| Antibody | Anti-CD63 (rabbit polyclonal) | Sigma | SAB4301607 | WB: 1/500 |
| Antibody | Anti-SDC4 (rabbit polyclonal) | Cell signaling | 12236 | IF: 1/200 |
| Other | Hoechst | Sigma | 34580 | IF: 1/1000, to detect nucleus |
| Other | 488 phalloidin | Interchim | YE5180 | IF: 1/200, to detect F-actin |
| Antibody | Anti-Glutamine synthetase (mouse monoclonal) | BD Biosciences | 610517 | IHC: 1/400 pH6 |
Table 1
qPCR primers.
| Primer | Forward | Reverse |
|---|---|---|
| CCND1 | CATCAAGTGTGACCCGGACTG | CCTCCTCCTCAGTGGCCTTG |
| AXIN2 | TGCTCTGTTTTGTCTTAAAGGTCTTGA | ACAGATCATCCCATCCAACACA |
| ARG1 | GTGGACAGACTAGGAATTGGC | TCCAGTCCGTCAACATCAAAAC |
| RAB27A | GAAGCCATAGCACTCGCAGAG | ATGACCATTTGATCGCACCA |
| SDC4 | CGATGAGGATGTAGTGGGGC | GACAACTTCAGGGCCGATCA |
| 18 S | GTAACCCGTTGAACCCCATT | CCATCCAATCGGTAGTAGCG |
Additional files
Download links
A two-part list of links to download the article, or parts of the article, in various formats.
Downloads (link to download the article as PDF)
Open citations (links to open the citations from this article in various online reference manager services)
Cite this article (links to download the citations from this article in formats compatible with various reference manager tools)
Emerging role of oncogenic ß-catenin in exosome biogenesis as a driver of immune escape in hepatocellular carcinoma
eLife 13:RP95191.
https://doi.org/10.7554/eLife.95191.3


