A microRNA that controls the emergence of embryonic movement
- Department of Neuroscience, Sussex Neuroscience, School of Life Sciences, University of Sussex, United Kingdom
Figures
Figure 1
A novel approach for the quantification of embryonic movement.
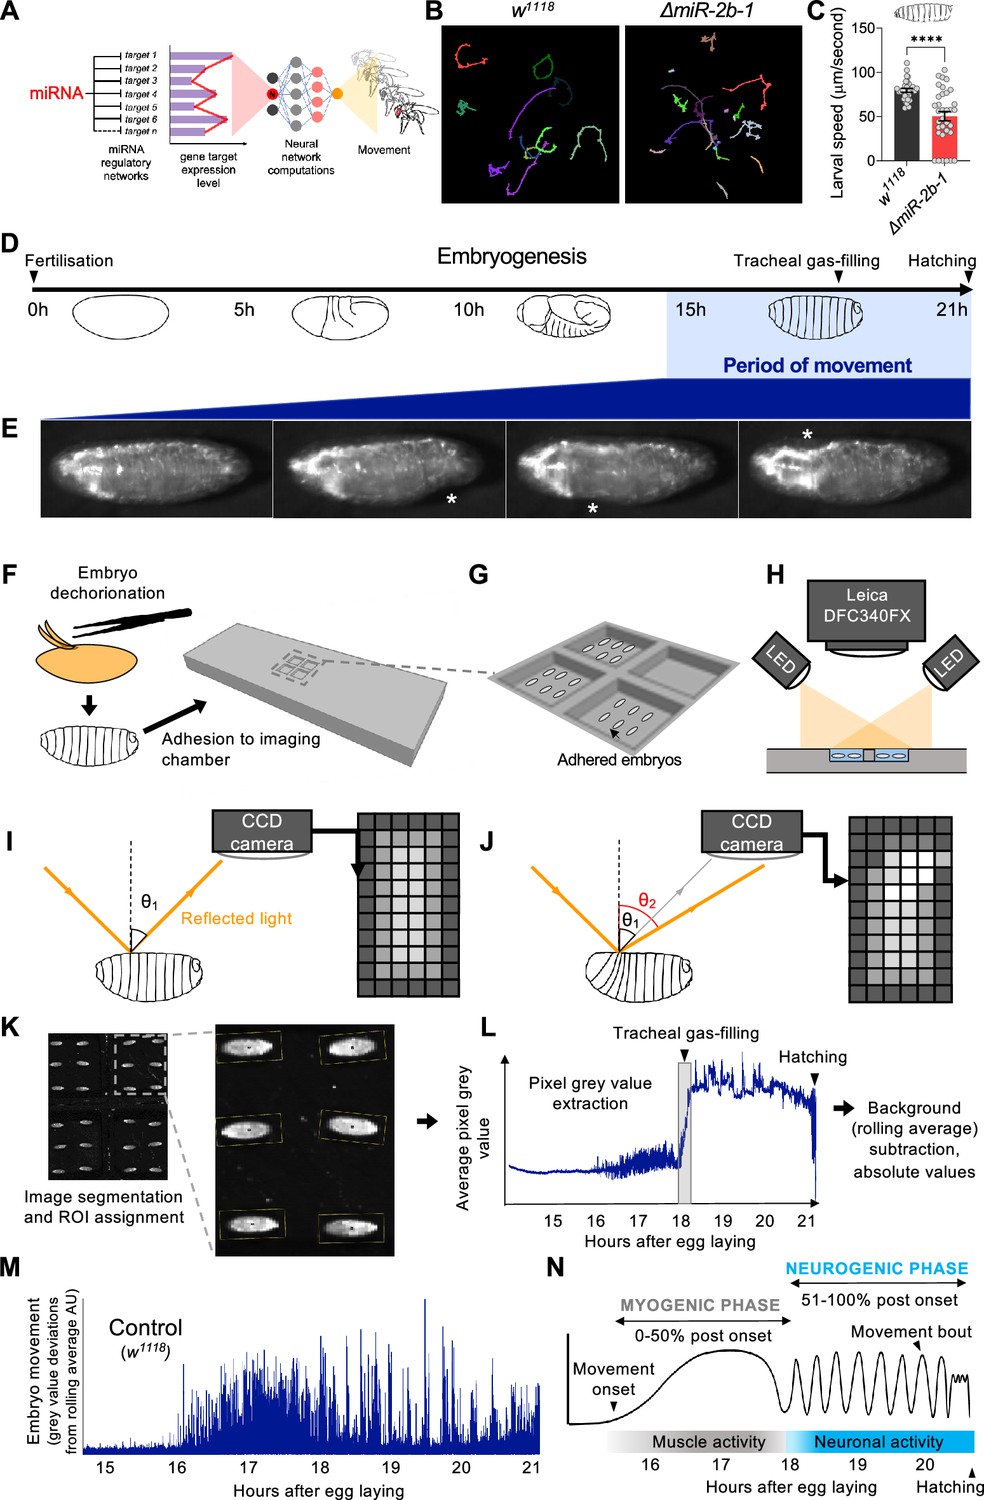
(A) Diagram illustrating the point of action of miRNAs in the neural networks controlling behaviour. (B) Larval movement tracks for w1118 (left) and ΔmiR-2b-1 (right) larvae obtained using the frustrated total internal reflection based imaging system (FIM). (C) Quantification of average larval speed for w1118 and ΔmiR-2b-1 larvae using the FIM system. (D) Schematic describing the timeline of Drosophila embryonic development with the period of movement highlighted in blue. (E) Microscope images of a Drosophila embryo performing characteristic early movements, highlighted with asterisks. (F–H) Experimental pipeline for recording embryo movements. (F) Eggshell removal (dechorionation) and adhesion to the imaging chamber, (G) imaging chamber design and (H) imaging set up under incident LED illumination. (I–J) Schematic describing the basis for movement detection: light is reflected from the embryo surface and internal structures and detected by a CCD sensor to generate a pixel map of the embryo (I). Embryonic movement changes the angle of reflected light, resulting in a different pixel map (J). (K–N) Pipeline for the quantification of embryonic movement. (K) Representative image of the embryo movement chamber showing the assignment of regions of interest (ROIs) to individual embryos; (L) extraction of the mean grey value (MGV) for each frame (done in parallel for each ROI) allows the generation of raw movement traces for each individual embryo. Key developmental events that impact MGV (tracheal gas-filling, hatching) are indicated by arrowheads. (M) Subtraction of the trace background calculated by rolling average removes slow changes in MGV that result from developmental events, allowing accurate quantification of deviations in MGV from baseline which represent movement over time (absolute values); (N) schematic of an idealised wild-type (w1118) movement trace with putative phases indicated. The statistical test shown in panel C is a Welch's t test, ****=p<0.0001, n=29 to 34.
-
Figure 1—source data 1
Larval speed in w1118 vs miR-2b-1 mutant genotypes.
- https://cdn.elifesciences.org/articles/95209/elife-95209-fig1-data1-v1.xlsx
Figure 2 with 1 supplement
miR-2b-1 controls movements during the neurogenic phase of embryonic movement.
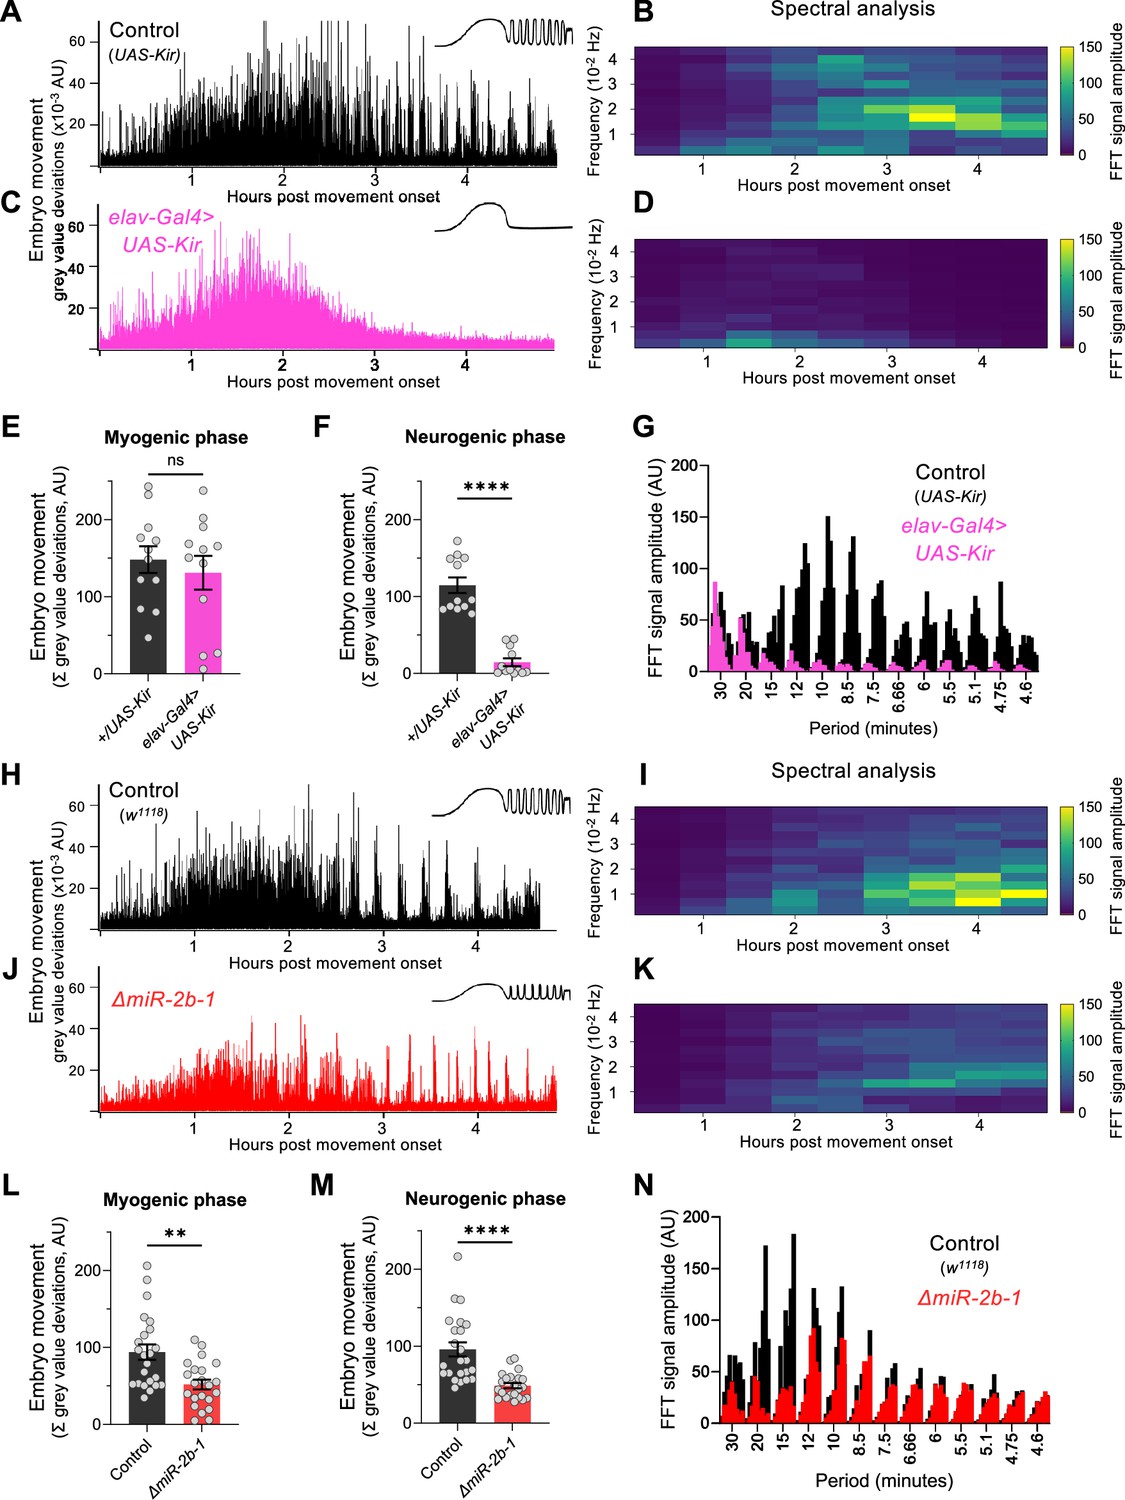
(A) Representative movement trace for control (UAS-Kir) animals. A concept diagram that summarises the pattern is shown in the top right. (B) Heat map showing the average frequency spectrogram for movements of control (UAS-Kir) animals, determined by fast fourier transform (FFT) analysis (1 hr sliding window with a discrete 30 min step size) from onset of embryonic movement to hatching. Brighter colours indicate a stronger amplitude of movement at a given frequency. (C) Representative movement trace for experimental (Elav-Gal4 >UAS Kir) animals. (D) Average frequency spectrogram for Elav-Gal4 >UAS Kir animals. (E) Summation of MGV deviations during the myogenic phase in control (UAS-Kir, black) and experimental (Elav-Gal4 >UAS Kir, pink) animals. (F) Summation of MGV deviations during the neurogenic phase in control (UAS-Kir, black) and experimental (Elav-Gal4 >UAS Kir, pink) animals. (G) Distribution of signal amplitudes across different movement periods (p) derived from the FFT frequency analysis shown in panels B and D. A higher signal amplitude is produced when more movement occurs with a particular periodicity. Bars of different height at each period sampled show data from individual embryos. (H) Representative movement trace for control (w1118) animals. (I) Heat map showing the average frequency spectrogram for movements of w1118 control embryos. (J) Representative movement trace for experimental (ΔmiR-2b-1) animals. (K) Heat map showing the average frequency spectrogram for movements of ΔmiR-2b-1 embryos. (L) Summation of MGV deviations during the myogenic phase in control (w1118, black) and experimental (ΔmiR-2b-1, red) animals. (M) Summation of MGV deviations during the neurogenic phase in control (w1118, black) and experimental (ΔmiR-2b-1, red) embryos. (N) Distribution of signal amplitudes across different movement periods derived from the FFT frequency analysis shown in panels I and K. The statistical tests shown in panels E, F, L and M are multiple Mann-Whitney tests with a Bonferroni-Dunn correction, **=p<0.01, ****=p<0.0001, n=12 in panels E and F, n=22 to 23 in panels L and M.
-
Figure 2—source data 1
FFT analysis of the +/UAS-Kir genotype.
- https://cdn.elifesciences.org/articles/95209/elife-95209-fig2-data1-v1.xlsx
-
Figure 2—source data 2
FFT analysis of the elav-Gal4 >UAS Kir genotype.
- https://cdn.elifesciences.org/articles/95209/elife-95209-fig2-data2-v1.xlsx
-
Figure 2—source data 3
Embryonic movement analysis of +/UAS-Kir vs elav-Gal4 >UAS Kir genotypes.
- https://cdn.elifesciences.org/articles/95209/elife-95209-fig2-data3-v1.xlsx
-
Figure 2—source data 4
FFT analysis of the w1118 genotype.
- https://cdn.elifesciences.org/articles/95209/elife-95209-fig2-data4-v1.xlsx
-
Figure 2—source data 5
FFT analysis of the miR-2b-1 mutant genotype.
- https://cdn.elifesciences.org/articles/95209/elife-95209-fig2-data5-v1.xlsx
-
Figure 2—source data 6
Embryonic movement analysis of the w1118 vs miR-2b-1 mutant genotypes.
- https://cdn.elifesciences.org/articles/95209/elife-95209-fig2-data6-v1.xlsx
Figure 2—figure supplement 1
miR-2b-1 decreases movement burst duration during the neurogenic phase.
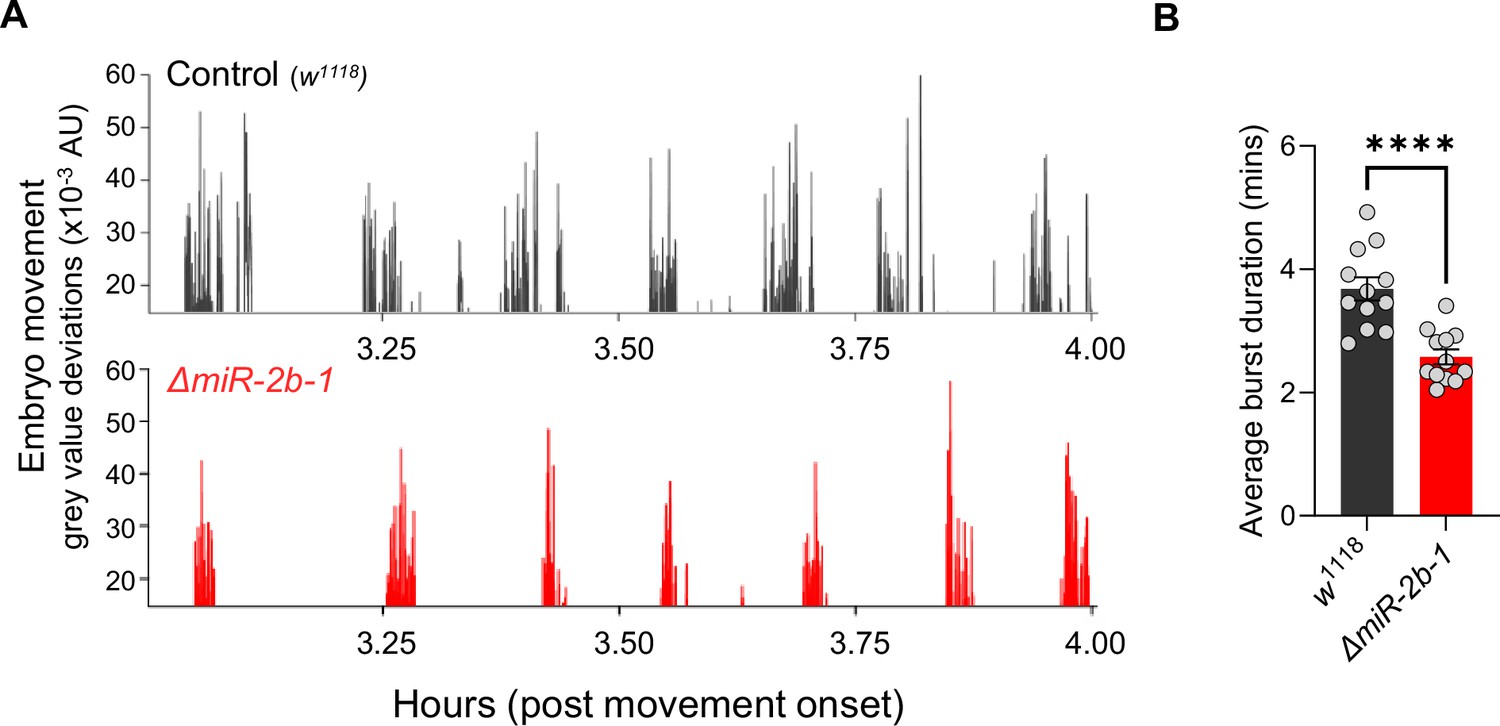
(A) Representative movement bursts from control (w1118, top) and ΔmiR-2b-1 (bottom) embryos. (B) Quantification of average burst length (minutes) during the neurogenic phase of movement in control (w1118, black) and ΔmiR-2b-1 (red) animals. The statistical test shown in panel B is a Welch's t test, ****=p<0.0001, n=12.
-
Figure 2—figure supplement 1—source data 1
Embryonic movement average movement burst duration.
- https://cdn.elifesciences.org/articles/95209/elife-95209-fig2-figsupp1-data1-v1.xlsx
Figure 3 with 2 supplements
miR-2b-1 acts within neurons to regulate embryonic and larval movement.
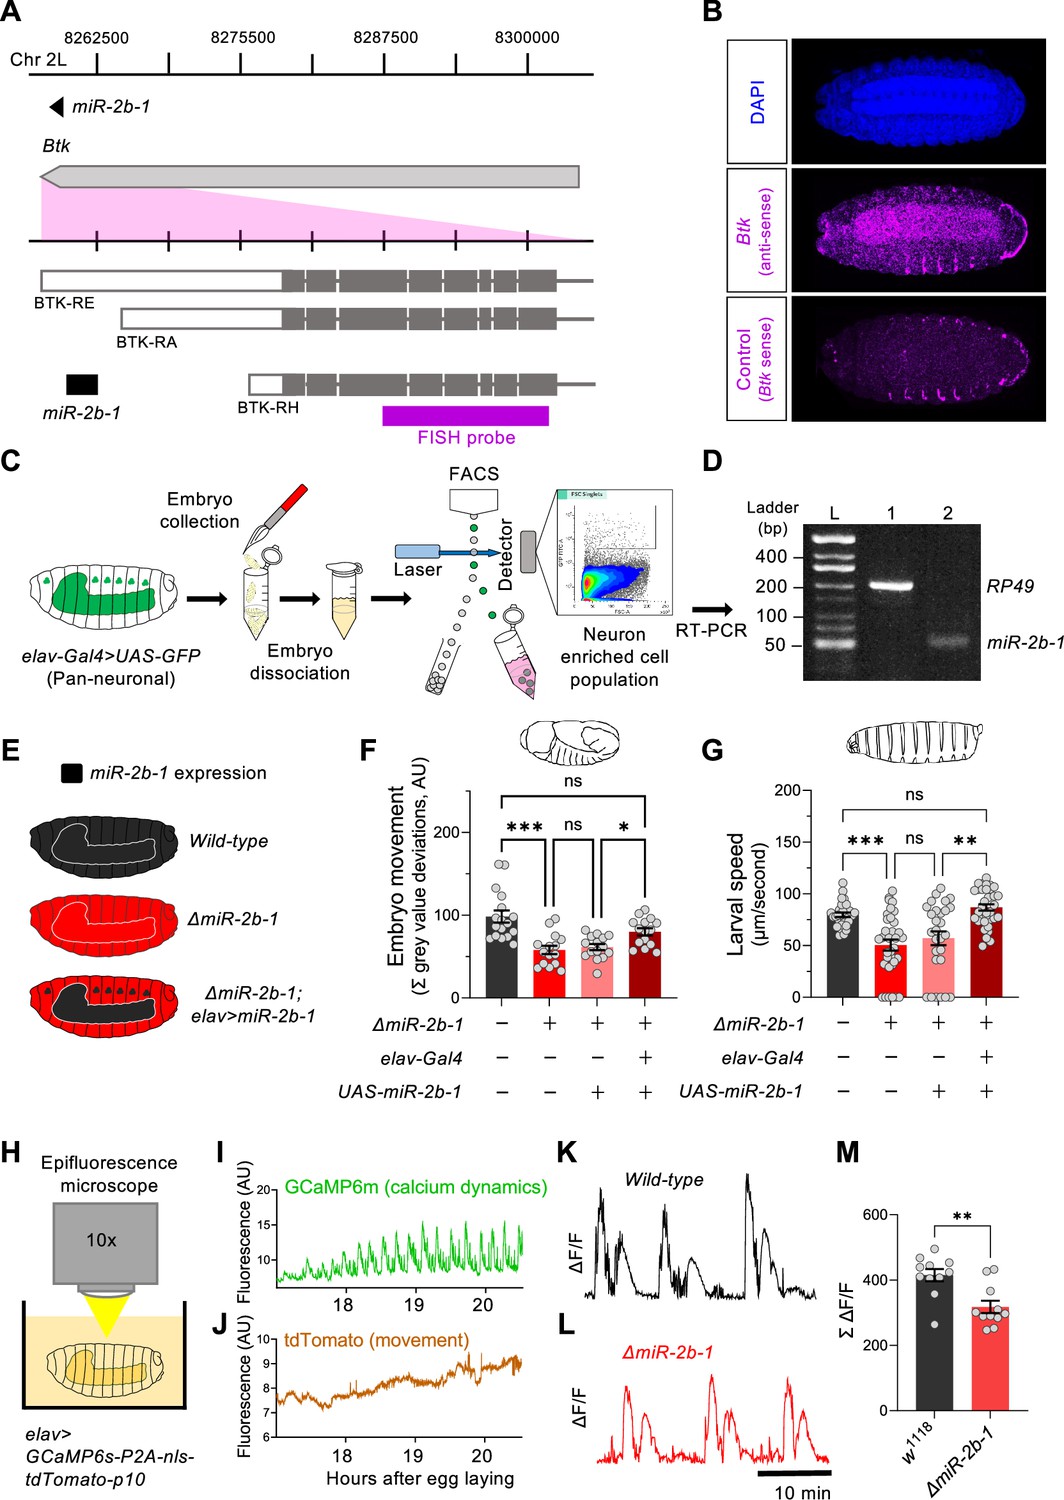
(A) Gene diagram describing the miR-2b-1 locus including the host gene Btk and its RNA transcripts. A fluorescence in situ hybridisation (FISH) probe for Btk is indicated by the magenta bar. (B) FISH experiment on control w1118 embryos showing expression of the miRNA host Btk transcripts (antisense probe, middle panel) [DAPI stain in blue (upper image); Btk sense probe in magenta (lower image)]. (C) Experimental workflow for a fluorescence activated cell sorting (FACS) experiment. Neurons were labelled by elav-Gal4 >UAS GFP (left), followed by enzymatic and mechanical separation and isolation of GFP +neurons. (D) RT-PCR analysis showing expression of mature miR-2b-1 (right) detected in neurons at the onset of the neurogenic phase (RP49 signal (left) shown as control). (E) Movement patterns were assessed in embryos with normal miR-2b-1 expression (wild-type, black), null miR-2b-1 mutants (red) and in mutant embryos in which miR-2b-1 expression was restored (reconstituted) specifically in neurons (red and black). (F) Summation of MGV deviations during the neurogenic phase of embryonic movement in control w1118 embryos (black bar); ΔmiR-2b-1 mutant embryos (bright red bar); ΔmiR-2b-, UAS-miR-2b-1 parental control embryos (faded red bar); ΔmiR-2b-1, Elav-Gal4 >UAS-miR-2b-1 embryos (black and red lined bar). (G) Average L1 larval speed for the same genotypes used in the embryonic genetic reconstitution experiment. (H) Schematic describing the experimental setup for fluorescence imaging of elav >GCaMP6s-P2A-nls-tdTomato-p10 embryos under an epifluorescence microscope. This design allows simultaneous detection of calcium dynamics (GCaMP6s) and movement (tdTomato). (I) Representative GCaMP6s trace (green) from control w1118 embryos over the neurogenic phase of embryonic movement. (J) Representative tdTomato trace from the same embryo as in panel I, acting as a passive fluorescence reporter used to subtract changes in GCaMP6s signal induced by embryonic movement. (K) Representative ΔF/F trace for w1118 embryos. (L) Representative ΔF/F trace for ΔmiR-2b-1 mutant embryos. (M) Summation of ΔF/F signal during embryogenesis in control w1118 embryos (black bar) and ΔmiR-2b-1 mutant embryos (red bar). The statistical test shown in panel F is a Brown-Forsythe and Welch ANOVA with multiple comparisons, *=p<0.05, ***=p<0.001, n=15 to 17. The statistical test shown in panel G is a Kruskal-Wallis test with multiple comparisons, **=p<0.01, ***=p<0.001, n=28 to 34. The statistical test shown in panel M is a Mann-Whitney test, **=p<0.01, n=11.
-
Figure 3—source data 1
miR-2b-1 transcript (5 p and 3 p respectively, left to right) expression in neurons via end-point PCR.
3 p transcript is non-specific due to amplification of other identical miR-2 family 3 p transcripts.
- https://cdn.elifesciences.org/articles/95209/elife-95209-fig3-data1-v1.pdf
-
Figure 3—source data 2
Embryo movement, genetic reconstitution of miR-2b-1 in all neurons.
- https://cdn.elifesciences.org/articles/95209/elife-95209-fig3-data2-v1.xlsx
-
Figure 3—source data 3
Larval speed, genetic reconstitution of miR-2b-1 in all neurons.
- https://cdn.elifesciences.org/articles/95209/elife-95209-fig3-data3-v1.xlsx
-
Figure 3—source data 4
Quantified calcium dynamics at embryonic stage.
- https://cdn.elifesciences.org/articles/95209/elife-95209-fig3-data4-v1.xlsx
Figure 3—figure supplement 1
Additional controls for miR-2b-1 genetic reconstitution in neurons; structural analysis in ΔmiR-2b-1 embryos.
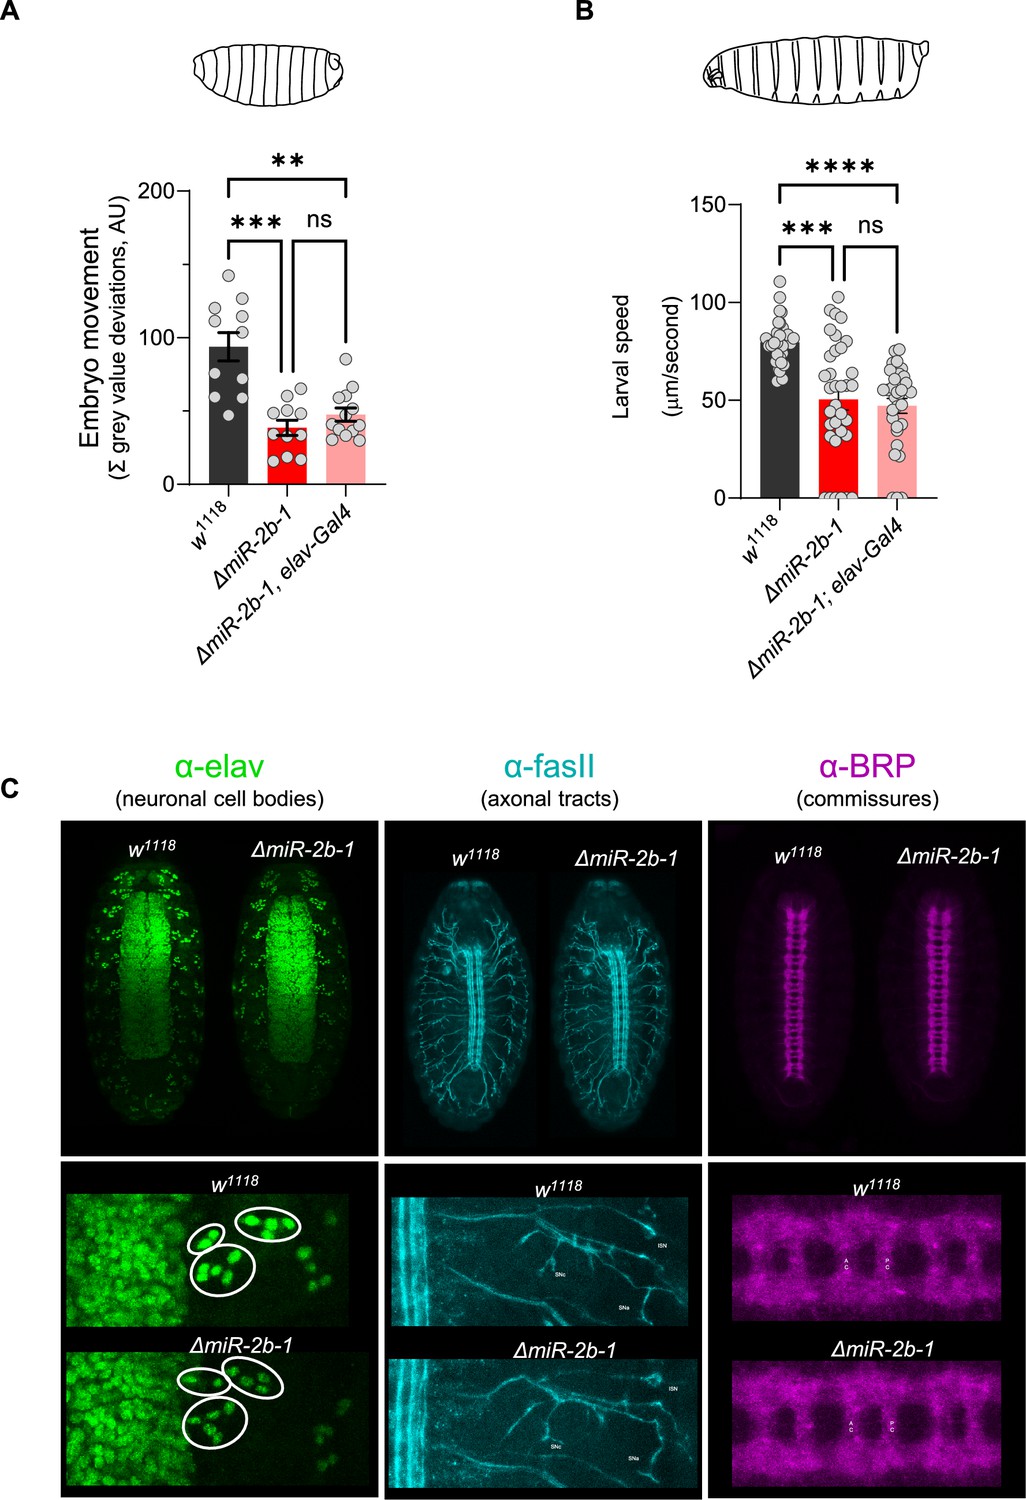
(A) Summation of MGV deviations during the neurogenic phase of embryonic movement in control w1118 embryos (black bar); ΔmiR-2b-1 mutant embryos (bright red bar); ΔmiR-2b-, elav-Gal4 pan-neuronal parental control embryos (faded red bar). (B) Average L1 larval speed for the same genotypes used in the embryonic genetic reconstitution experiment shown in panel (A). (C) Immunohistochemical analyses of w1118 and ΔmiR-2b-1 embryonic nervous system structures. Zoomed in images for one hemisegment are shown in the lower panels. The statistical test shown in panel A is a Brown-Forsythe and Welch ANOVA with multiple comparisons, **=p<0.01, ***=p<0.001, n=11 to 13. The statistical test shown in panel B is a Kruskal-Wallis test with multiple comparisons, ***=p<0.001, ****=p<0.0001, n=28 to 34.
-
Figure 3—figure supplement 1—source data 1
Embryonic movement, parental control for genetic reconstitution of miR-2b-1 in all neurons.
- https://cdn.elifesciences.org/articles/95209/elife-95209-fig3-figsupp1-data1-v1.xlsx
-
Figure 3—figure supplement 1—source data 2
Larval speed, parental control for genetic reconstitution of miR-2b-1 in all neurons.
- https://cdn.elifesciences.org/articles/95209/elife-95209-fig3-figsupp1-data2-v1.xlsx
Figure 3—figure supplement 2
Inhibiting neural activity during embryogenesis reduces larval locomotor speed.
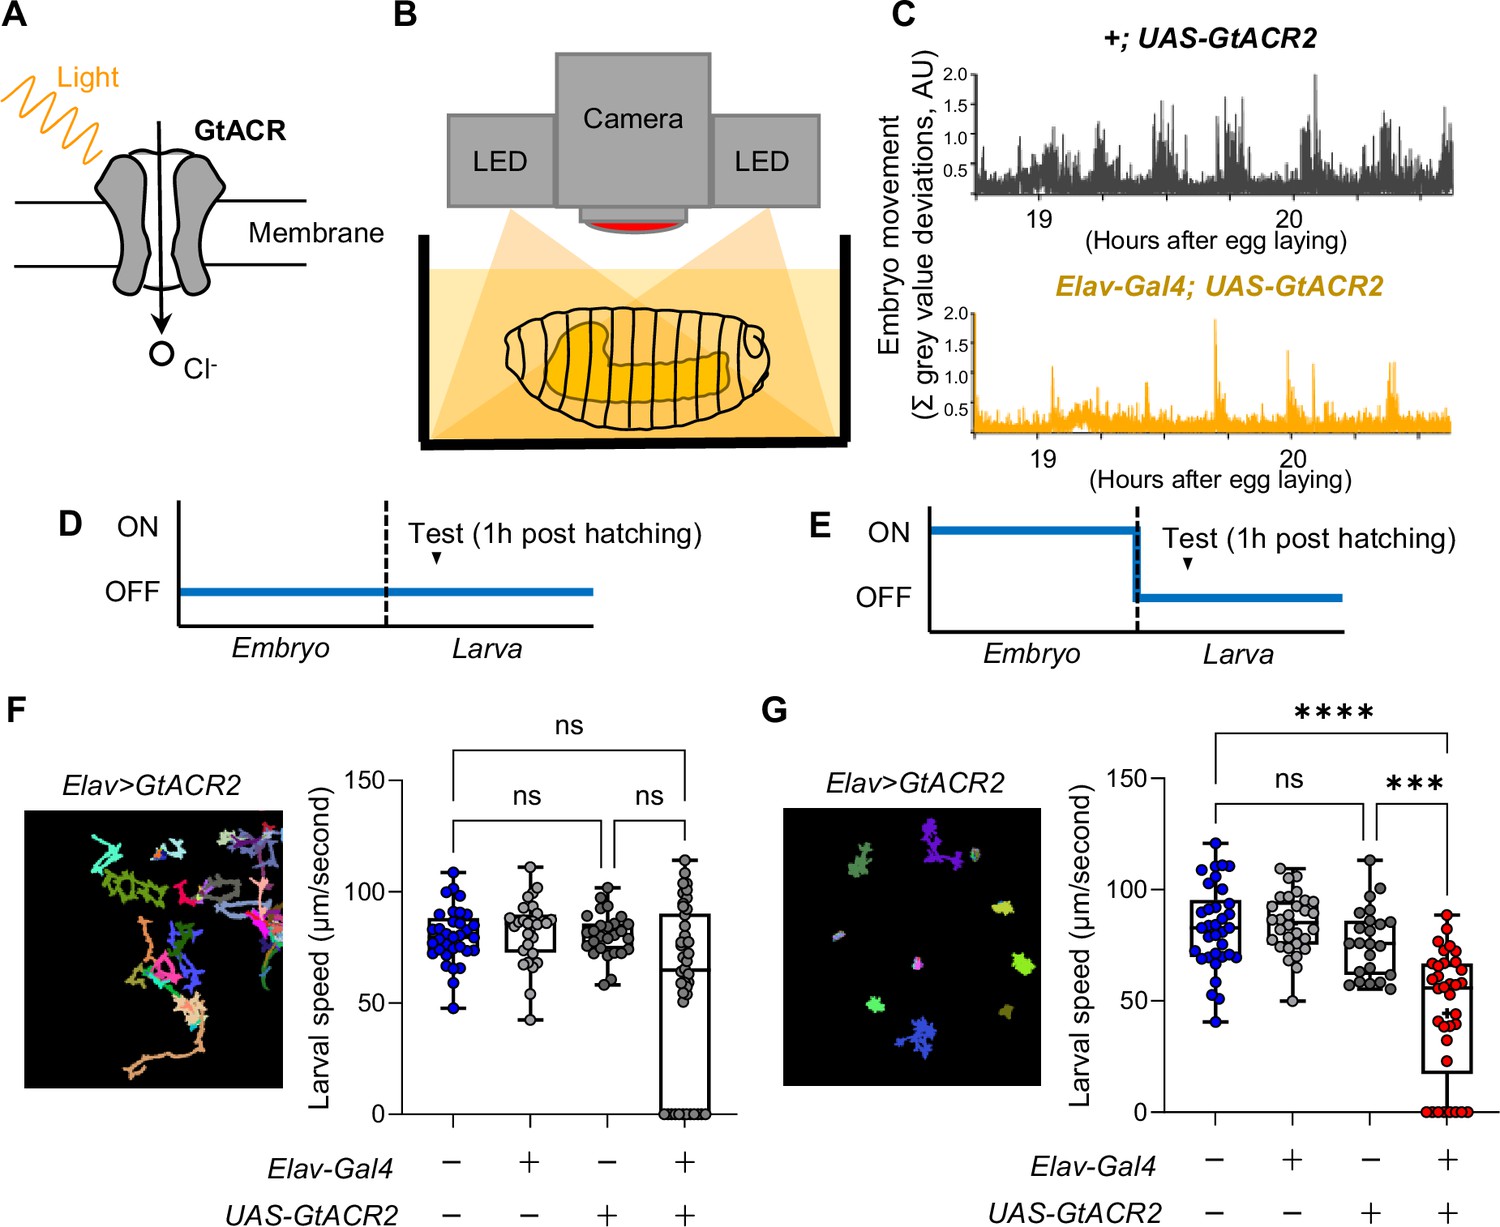
(A) Graphic showing GtACR2 channel gating chloride ions across the cell membrane in response to photon stimulation. (B) Graphic showing experimental setup, with embryos illuminated by red light throughout embryogenesis and (C) embryo movement over time traces for the control +;UAS-GtACR2 and experimental Elav-Gal4; UAS-GtACR2 genotypes in response to red light stimulation of GtACR2. (D–E) Schematics showing when red light stimulation is on (ON) leading to activation of GtACR2 and repression of neural activity, or when red light stimulation is off (OFF) leading to inactivation of GtACR2 and therefore no repression of neural activity. (D) Is for the negative control experiment and (E) for the repression experiment. Developmental time is shown on the x axis. (F) (Left) Movement trace of Elav-Gal4 >UAS-GtACR2 genotype in the negative control (no repression) experiment and (right) box plots showing the quantification of larval locomotor speed in each genotype. Genotypes are indicated in the grid beneath, with a plus icon indicating expression of the relevant gene construct on the left and a minus icon indicating no expression of the relevant gene construct. (G) Same as panel F, but for the repression experiment. The statistical tests shown in panels F and G are Kruskal-Wallis tests with multiple comparisons, ***=p<0.001, ****=p<0.0001, n=22 to 34.
-
Figure 3—figure supplement 2—source data 1
Larval speed, no light treatment controls.
- https://cdn.elifesciences.org/articles/95209/elife-95209-fig3-figsupp2-data1-v1.xlsx
-
Figure 3—figure supplement 2—source data 2
Larval speed, experimental light treatment.
- https://cdn.elifesciences.org/articles/95209/elife-95209-fig3-figsupp2-data2-v1.xlsx
Figure 4 with 1 supplement
The genetic and cellular mechanisms that link miR-2b-1 to embryonic movement.
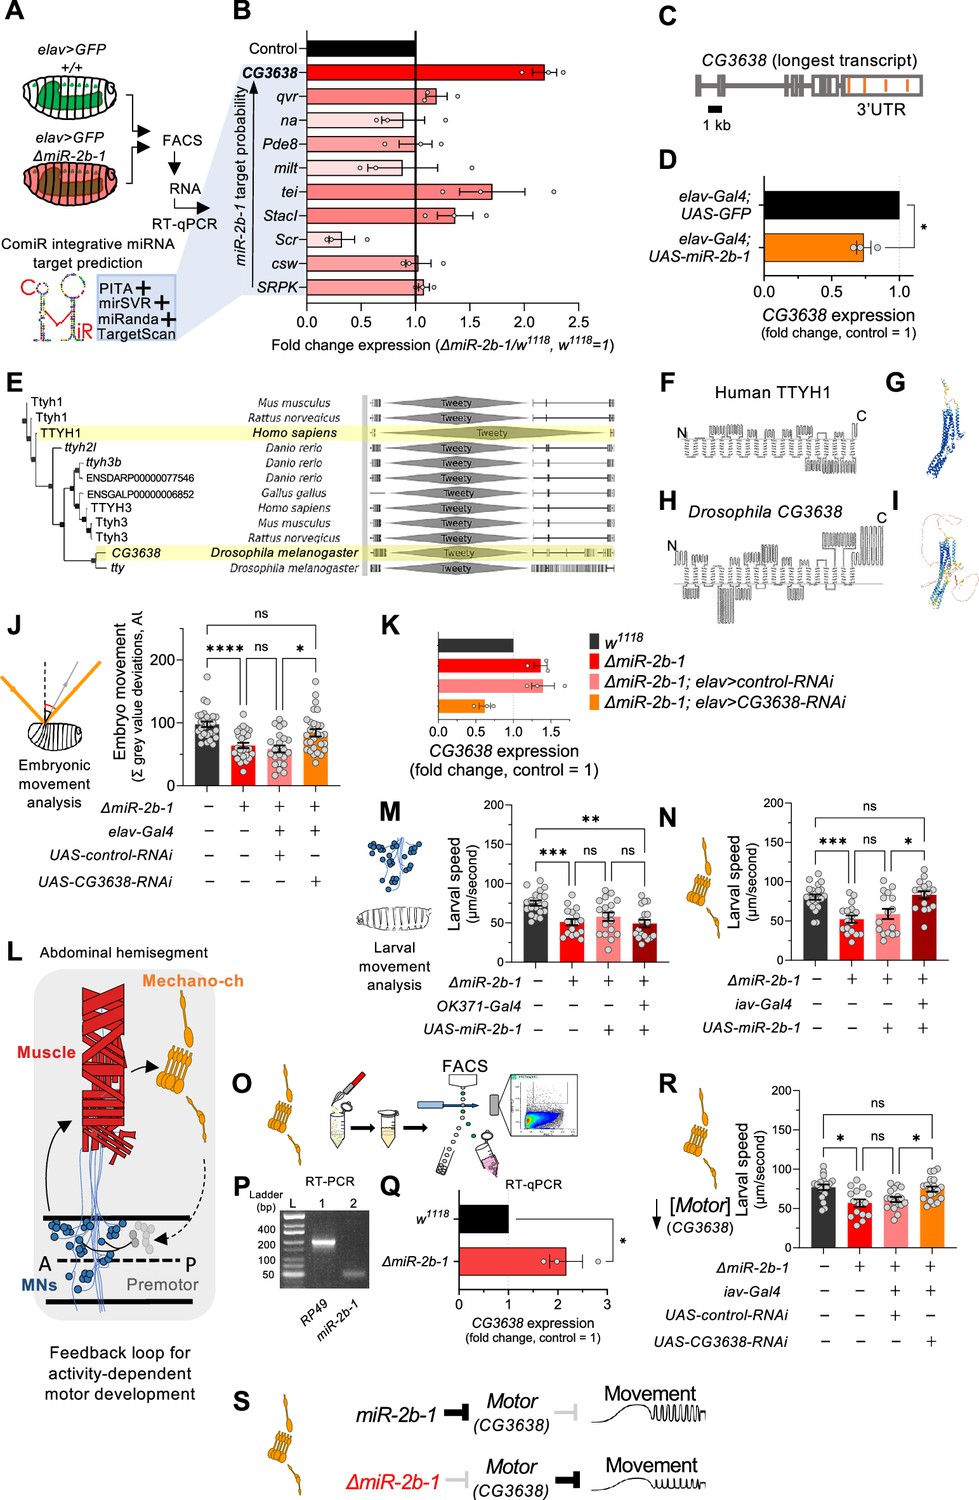
(A) Workflow for the FACS and RT-qPCR experiments shown in panel B and schematic describing the ComiR miRNA target prediction tool used to generate the list of candidate miR-2b-1 targets. (B) Expression analysis (qPCR) of 10 predicted miR-2b-1 target genes shown as fold change between ΔmiR-2b-1 mutant and control w1118 embryos (three biological replicates). Targets are listed from top to bottom by descending probability score. [The black control bar, set to 1, represents expression of each gene in control w1118 embryos]. Note that upregulation of CG3638 is statistically significant (p=0.0169). (C) Schematic of the CG3638 transcript with miR-2b-1 target sites indicated (orange lines). (D) Whole embryo qPCR experiment showing a reduction of CG3638 expression in elav-Gal4 >UAS-miR-2b-1 embryos (orange bar), relative to control elav-Gal4 >UAS GFP embryos (black bar). (E) Evolutionary conservation of the CG3638 protein across a wide range of invertebrate and vertebrate species (left), as determined with PhylomeDB 5 software (Huerta-Cepas et al., 2014) [Homo sapiens and Drosophila melanogaster highlighted in yellow]. Gene schematics highlighting the conserved Tweety domain are shown on the right. (F–I) Transmembrane domain structure (left) and AlphaFold structural predictions (right) for Human TTYH1 (F–G) and Drosophila CG3638 (H–I). (J) Embryonic movement quantification (summation of MGV deviations) of ΔmiR-2b-1, elav >CG3638 RNAi embryos (orange bar) during the neurogenic phase compared to control w1118 (black bar), ΔmiR-2b-1 mutant (bright red bar) and control ΔmiR-2b-1, elav >control RNAi embryos (faded red bar). (K) qPCR expression profiling of CG3638 in whole embryos of the genotypes tested in panel J. (L) Diagram describing key cell types that form a feedback loop for activity-dependent motor development. Motor neurons (MNs, blue) induce muscle (red) movements which are in turn detected by proprioceptive chordotonal organs (Mechano-ch, orange) and feed-back into the CNS to regulate activity patterns. (M–N) Reconstitution experiments that restore miR-2b-1 expression in specific cellular elements related to embryonic movement circuitry. (M) Quantification of larval speed in control w1118 (black); ΔmiR-2b-1 mutant (red); ΔmiR-2b-1, UAS-miR-2b-1 parental control (pink) and ΔmiR-2b-1, OK371-Gal4>UAS-miR-2b-1 experimental embryos (brown). (N) Quantification of larval speed in ΔmiR-2b-1, iav-Gal4 >UAS-miR-2b-1 (brown) and control genotypes as in panel M. (O) Schematic describing FACS isolation of embryonic chordotonal organs. (P) Mature miR-2b-1 (right) is expressed in chordotonal organs isolated during the neurogenic phase (RP49 expression shown on left). (Q) Chordotonal specific qPCR expression profiling of CG3638 in ΔmiR-2b-1 mutant and control w1118 embryos. (R) Average larval speed of ΔmiR-2b-1, elav >CG3638 RNAi (orange) compared to control w1118 (black), ΔmiR-2b-1 mutant (red) and control ΔmiR-2b-1, UAS-control-RNAi (pink). (S) Model for the mechanism by which miR-2b-1 acts to control embryonic movement in chordotonal organs. Under normal (control) conditions (top), miR-2b-1 inhibits the expression of CG3638 and thereby enables normal movement. In ΔmiR-2b-1 mutants (bottom), de-repression of CG3638 expression leads to a reduction in embryonic movement. The statistical tests shown in panels D and Q are Welch's t tests, *=p<0.05, n>10 embryos per biological replicate. The statistical tests shown in panels J, M, N and R are Brown-Forsythe and Welch ANOVA tests with multiple comparisons, *=p<0.05, **=p<0.01, ***=p<0.001, ****=p<0.0001, n=16 to 28.
-
Figure 4—source data 1
Embryo movement, RNAi knockdown of CG3638 in all neurons.
- https://cdn.elifesciences.org/articles/95209/elife-95209-fig4-data1-v1.xlsx
-
Figure 4—source data 2
Larval speed, genetic reconstitution of miR-2b-1 in motor neurons.
- https://cdn.elifesciences.org/articles/95209/elife-95209-fig4-data2-v1.xlsx
-
Figure 4—source data 3
Larval speed, genetic reconstitution of miR-2b-1 in chordotonal organs.
- https://cdn.elifesciences.org/articles/95209/elife-95209-fig4-data3-v1.xlsx
-
Figure 4—source data 4
miR-2b-1 transcript (5 p and 3 p respectively, left to right) expression in chordotonal organs via end-point PCR.
3 p transcript is non-specific due to amplification of other identical miR-2 family 3 p transcripts.
- https://cdn.elifesciences.org/articles/95209/elife-95209-fig4-data4-v1.pdf
-
Figure 4—source data 5
Larval speed, RNAi knock down of CG3638 in chordotonal organs.
- https://cdn.elifesciences.org/articles/95209/elife-95209-fig4-data5-v1.xlsx
Figure 4—figure supplement 1

Additional controls for genetic reconstitutions in motor neurons and chordotonal organs.
(A) Average larval speed of control w1118 larvae (black bar); ΔmiR-2b-1 mutant larvae (bright red bar); ΔmiR-2b-, OK371-Gal4 motor neuron parental control larvae (faded red bar). (B) Average larval speed of control w1118 larvae (black bar); ΔmiR-2b-1 mutant larvae (bright red bar); ΔmiR-2b-, iav-Gal4 chordotonal organ parental control larvae (faded red bar). The statistical tests shown in panels A and B are Brown-Forsythe and Welch ANOVA tests with multiple comparisons, **=p<0.01, ***=p<0.001, ****=p<0.0001, n=16 to 22.
-
Figure 4—figure supplement 1—source data 1
Larval speed, parental control for genetic reconstitution of miR-2b-1 in motor neurons.
- https://cdn.elifesciences.org/articles/95209/elife-95209-fig4-figsupp1-data1-v1.xlsx
-
Figure 4—figure supplement 1—source data 2
Larval speed, parental control for genetic reconstitution of miR-2b-1 in chordotonal organs.
- https://cdn.elifesciences.org/articles/95209/elife-95209-fig4-figsupp1-data2-v1.xlsx
Videos
Video 1
Patterns of movement during Drosophila embryogenesis.
Movement from a control w1118 embryo recorded across the movement period from 16 to 21 hr after egg laying, 300 X speed.
Tables
Key resources table
| Reagent type (species) or resource | Designation | Source or reference | Identifiers | Additional information |
|---|---|---|---|---|
| Genetic reagent (D. melanogaster) | w[1118] | Bloomington Drosophila Stock Center | BDSC:5905 | Flybase ID: FBst0005905 |
| Genetic reagent (D. melanogaster) | w[1118]; TI{w[+mW.hs]=TI} mir-2b-1[KO] | Bloomington Drosophila Stock Center | BDSC:58915 | Flybase ID: FBst0058915 |
| Genetic reagent (D. melanogaster) | w[1118]; P{w[+mC]=GAL4 elav.L}3 | Bloomington Drosophila Stock Center | BDSC:458 | Flybase ID: FBst0000458 |
| Genetic reagent (D. melanogaster) | w[1118]; P{w[+mW.hs]=GawB}VGlut[OK371] | Bloomington Drosophila Stock Center | BDSC:26160 | Flybase ID: FBst0026160 |
| Genetic reagent (D. melanogaster) | w[*]; P{w[+mC]=iav-GAL4.K}3 | Bloomington Drosophila Stock Center | BDSC:52273 | Flybase ID: FBst0052273 |
| Genetic reagent (D. melanogaster) | UAS-Kir | Bate Lab, Cambridge Baines et al., 2001 | N/A | |
| Genetic reagent (D. melanogaster) | w[1118]; P{y[+t7.7] w[+mC]=10XUAS-IVS-myr::GFP}attP2 | Bloomington Drosophila Stock Center | BDSC:32197 | Flybase ID: FBst0032197 |
| Genetic reagent (D. melanogaster) | w[1118]; P{y[+t7.7] w[+mC]=UAS-LUC-mir-2b-1.T}attP2 | Bloomington Drosophila Stock Center | BDSC:41128 | Flybase ID: FBst0041128 |
| Genetic reagent (D. melanogaster) | w[1118]; UAS-IVS-Syn21-GCaMP6s-P2A-nls-tdTomato-p10 (JK66B) | Zlatic Lab, Cambridge | N/A | |
| Genetic reagent (D. melanogaster) | UAS 40D RNAi-KK | Vienna Drosophila Resource Centre | VDRC: 60101 | Flybase ID: FBst0060101 |
| Genetic reagent (D. melanogaster) | CG3638 RNAi-KK | Vienna Drosophila Resource Centre | VDRC: 102444 | Flybase ID: FBst0474313 |
| Genetic reagent (D. melanogaster) | UAS-GtACR2 | Bloomington Drosophila Stock Center | BDSC:92984 | Flybase ID: FBst0092984 |
| Antibody | anti-Elav (mouse monoclonal) | Developmental Studies Hybridoma Bank | DSHB: 9F8A9 | IF(1:100) |
| Antibody | anti-Fasciclin II (mouse monoclonal) | Developmental Studies Hybridoma Bank | DSHB: 1D4 | IF(1:100) |
| Antibody | anti-BP102 (mouse monoclonal) | Developmental Studies Hybridoma Bank | DSHB: BP102 | IF(1:100) |
| Antibody | anti-DIG-POD (Fab fragments from sheep) | Roche | 11207733910 | IF(1:500) |
| Antibody | anti-mouse Alexa Fluor 488 (goat) | Invitrogen | A-11001 | IF(1:1000) |
| Antibody | anti-mouse Alexa Fluor 555 (goat) | Invitrogen | A-21426 | IF(1:1000) |
| Sequence-based reagent | Btk | Sigma-Aldrich | In-situ hybridisation control sense probe F | ATTTAGGTGACACTATAGAGAATTCAACGCGCAGCATC |
| Sequence-based reagent | Btk | Sigma-Aldrich | In-situ hybridisation control sense probe R | ACACCAAACTGTCCCGATCC |
| Sequence-based reagent | Btk | Sigma-Aldrich | In-situ hybridisation experimental anti-sense probe F | AGAATTCAACGCGCAGCATC |
| Sequence-based reagent | Btk | Sigma-Aldrich | In-situ hybridisation experimental anti-sense probe R | ATTTAGGTGACACTATAGACACCAAACTGTCCCGATCC |
| Sequence-based reagent | Reverse transcription primer | Sigma-Aldrich | miRNA PCR RT mix primer 1 | CAGGTCCAGTTTTTTTTTTTTTTTVN, where V is A, C and G and N is A, C, G and T. |
| Sequence-based reagent | RP49 (RpL32) | Sigma-Aldrich | PCR primer F | CCAGTCGGATCGATATGCTAA |
| Sequence-based reagent | RP49 (RpL32) | Sigma-Aldrich | PCR primer R | TCTGCATGAGCAGGACCTC |
| Sequence-based reagent | miR-2b-1–5 p | Sigma-Aldrich | PCR primer F | GGTCTTCAAAGTGGCAGTG |
| Sequence-based reagent | miR-2b-1–5 p | Sigma-Aldrich | PCR primer R | GTCCAGTTTTTTTTTTTTTTTCATGTC |
| Sequence-based reagent | CG3638 | Sigma-Aldrich; FlyPrimerBank | PCR primer F; FPB: PP20655 | TCCTTGGTCATCATTACGCTGA |
| Sequence-based reagent | CG3638 | Sigma-Aldrich; FlyPrimerBank | PCR primer R; FPB: PP20655 | CCATTATGGAAATCATCGTTGCC |
| Sequence-based reagent | qvr | Sigma-Aldrich; FlyPrimerBank | PCR primer F; FPB: PP25844 | CCTTTCAACTATACAGCCCTGC |
| Sequence-based reagent | qvr | Sigma-Aldrich; FlyPrimerBank | PCR primer R; FPB: PP25844 | TGTAACTGTGACGTACACATGC |
| Sequence-based reagent | na | Sigma-Aldrich; FlyPrimerBank | PCR primer F; FPB: PP34188 | ACCTTTCCTCGCGGATTACG |
| Sequence-based reagent | na | Sigma-Aldrich; FlyPrimerBank | PCR primer R; FPB: PP34188 | CCACAGCTTGTTCACCCAC |
| Sequence-based reagent | Pde8 | Sigma-Aldrich; FlyPrimerBank | PCR primer F; FPB: PP11165 | CCGAGAAAATCCGTCCAGC |
| Sequence-based reagent | Pde8 | Sigma-Aldrich; FlyPrimerBank | PCR primer R; FPB: PP11165 | CAGCGGTCTTGGTCTTTCATTA |
| Sequence-based reagent | milt | Sigma-Aldrich; FlyPrimerBank | PCR primer F; FPB: PP21284 | GCAGACGATGGCACAGATACT |
| Sequence-based reagent | milt | Sigma-Aldrich; FlyPrimerBank | PCR primer R; FPB: PP21284 | CGTCGAGCAGGGAGTTGAC |
| Sequence-based reagent | CG17716 | Sigma-Aldrich; FlyPrimerBank | PCR primer F; FPB: PP26416 | GTCCGTGGTCTATGCGGAG |
| Sequence-based reagent | CG17716 | Sigma-Aldrich; FlyPrimerBank | PCR primer R; FPB: PP26416 | ATGAAGCGATAGTCGGTGACG |
| Sequence-based reagent | Stacl | Sigma-Aldrich; FlyPrimerBank | PCR primer F; FPB: PP10900 | GCTGCGTCCCAATCTGGAT |
| Sequence-based reagent | Stacl | Sigma-Aldrich; FlyPrimerBank | PCR primer R; FPB: PP10900 | CGTGTGTGCCCTCTCAGAAT |
| Sequence-based reagent | Scr | Sigma-Aldrich; FlyPrimerBank | PCR primer F; FPB: PP19886 | GGCGGCCTATACGCCTAAC |
| Sequence-based reagent | Scr | Sigma-Aldrich; FlyPrimerBank | PCR primer R; FPB: PP19886 | CGGCTGTAGCTGCGTGTAG |
| Sequence-based reagent | csw | Sigma-Aldrich; FlyPrimerBank | PCR primer F; FPB: PP8739 | TTTGGCACCTTGTCGGAACT |
| Sequence-based reagent | csw | Sigma-Aldrich; FlyPrimerBank | PCR primer R; FPB: PP8739 | CCAGAAACCTCCCTTGACCAG |
| Sequence-based reagent | SRPK | Sigma-Aldrich; FlyPrimerBank | PCR primer F; FPB: PA60244 | ATCCGCTGACTGAGGGCACTG |
| Sequence-based reagent | SRPK | Sigma-Aldrich; FlyPrimerBank | PCR primer R; FPB: PA60244 | GTAGAGTTTTCCAGTTGTGG |
Additional files
Download links
A two-part list of links to download the article, or parts of the article, in various formats.
Downloads (link to download the article as PDF)
Open citations (links to open the citations from this article in various online reference manager services)
Cite this article (links to download the citations from this article in formats compatible with various reference manager tools)
A microRNA that controls the emergence of embryonic movement
eLife 13:RP95209.
https://doi.org/10.7554/eLife.95209.3


