Distinct catecholaminergic pathways projecting to hippocampal CA1 transmit contrasting signals during navigation in familiar and novel environments
- The Department of Neurobiology, The University of Chicago, United States
Figures
Figure 1 with 3 supplements
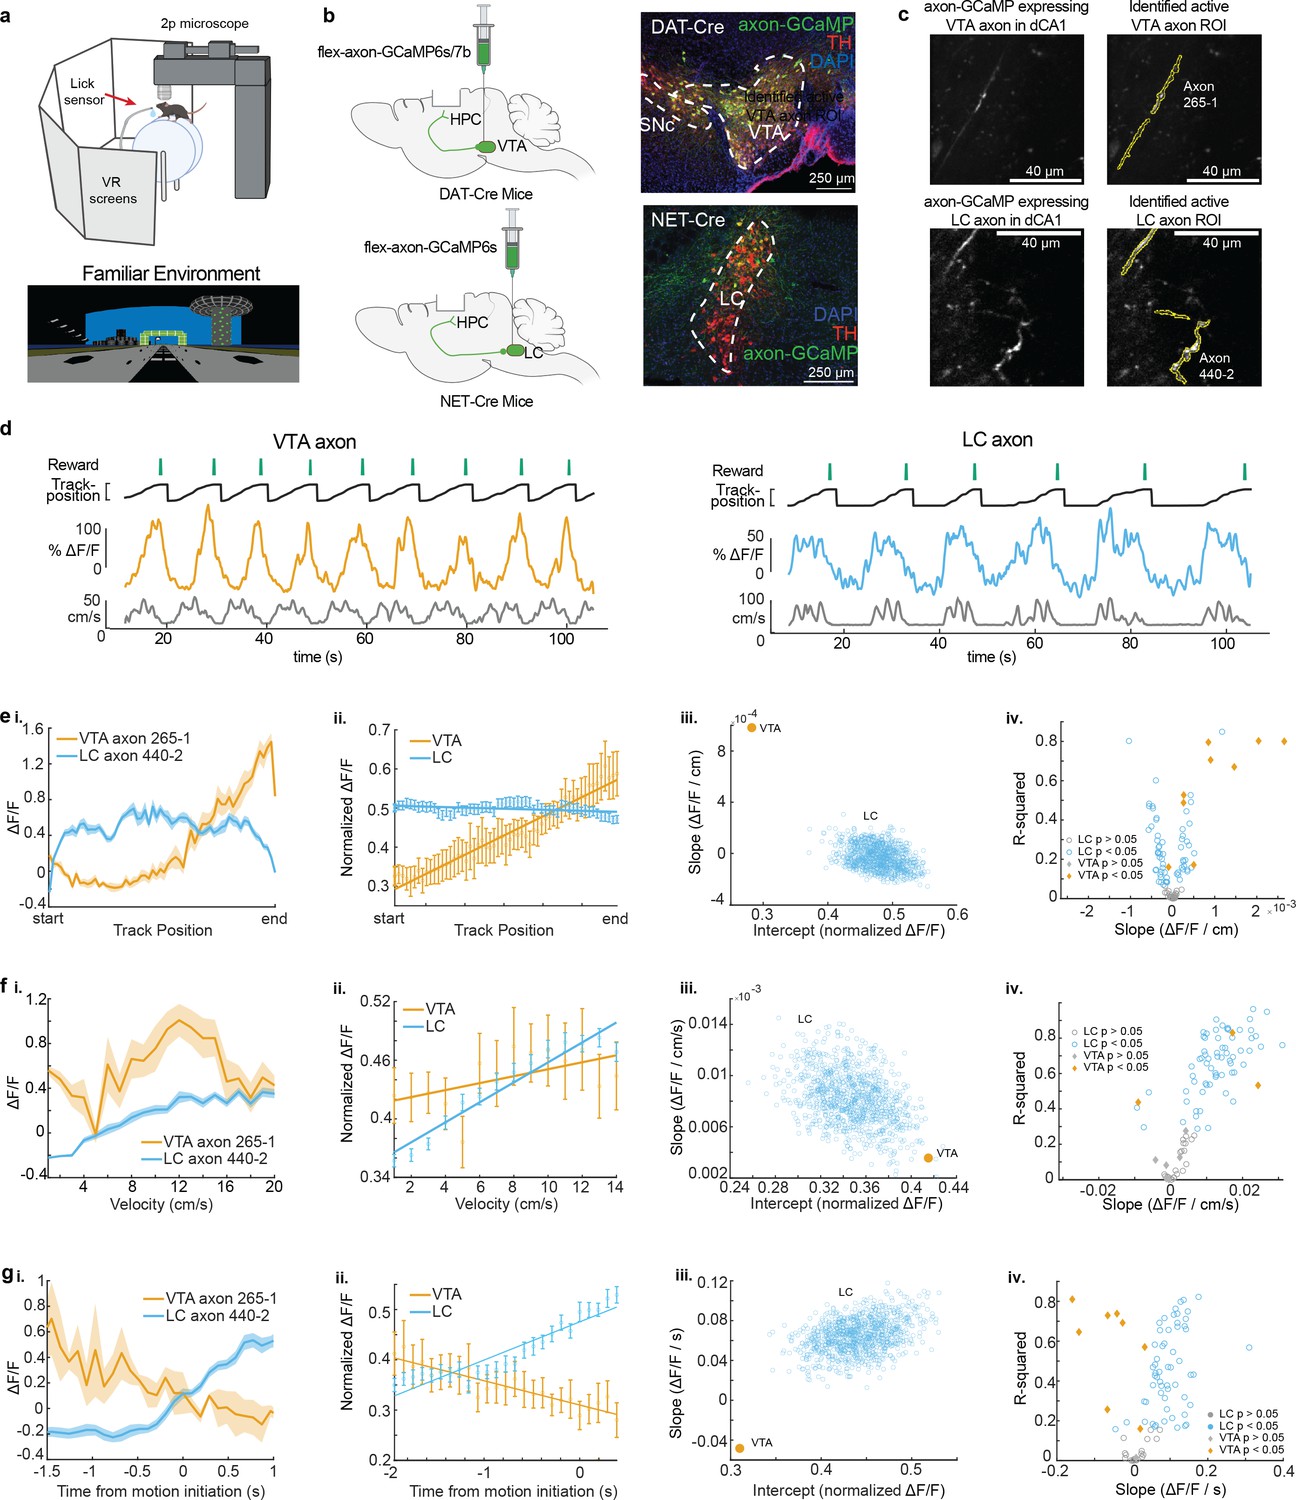
Distinct activity dynamics in ventral tegmental area (VTA) and locus coeruleus (LC) axons during navigation of familiar environments.
(a) Experimental setup (top), created with BioRender.com. Example virtual reality environment. (b) Schematic representation of injection procedure (left). Representative coronal brain sections immunostained for tyrosine hydroxolase (TH) from a DAT-Cre mouse showing overlapping expression of axon-GCaMP (green) and TH (red) in VTA neurons (top) and from a NET-Cre mouse showing overlapping expression of axon-GCaMP (green) and TH (red) in LC neurons (bottom). (c) Example CA1 field of view of VTA axons (top) and LC axons (bottom). Extracted regions of interest (ROIs) used for example VTA and LC activity throughout the figure. (d) Example DAT-Cre mouse (left) and NET-Cre mouse (right) with aligned reward delivery (top, green), mouse track position (black), from example ROI (VTA – orange, LC – blue), and mouse velocity (bottom, gray). (e, i) Position binned s.e.m in example VTA (orange) and LC (blue) ROIs during navigation of the familiar rewarded environment. (ii) Population average position binned s.e.m. in VTA ROIs (orange, n = 9 ROIs from 8 mice) and LC ROIs (blue, n = 87 ROIs from 27 sessions in 17 mice) . Linear regression analysis (on all data points, not means) shows that the population of VTA ROIs increase activity during approach of the end of the track while the population of LC ROIs have consistent activity throughout all positions. Linear regression, F test, VTA, , LC, . (iii) The LC dataset was resampled 1000× using n = 9 ROIs to match the number of VTA ROIs and the slope and intercept of the regression line were measured each time (blue dots). The VTA slope is steeper than all LC slopes indicating a stronger positive relationship between position and activity for VTA axons. (iv) Linear regression of position binned activity of individual VTA (orange diamonds) and LC (blue, circles) ROIs. The majority (8/9) of VTA ROIs show a significant positive relationship with position while LC ROIs show both a positive (25/87) and negative (37/87) relationship. (F, i) Same example ROIs as (d) binned by velocity. (ii) Same data as (d, ii,) binned by velocity. Linear regression shows that the population of VTA and LC ROIs have a significant relationship with velocity. Linear regression, F test, VTA, , LC, . (iii) Resampling shows the VTA slope and intercept is within the resampled LC slopes and intercepts indicating similar relationships with velocity. (iv) Linear regression of individual VTA and LC axons shows the majority (63/87) of LC ROIs have a significant positive relationship with velocity while only two VTA ROIs show this relationship. (g, i) Same example ROIs as (d) aligned to motion onset. (ii) Same data as (d, ii) aligned to motion onset. Linear regression shows that the population of VTA axons have a negative slope prior to motion onset while LC axons have positive slope. Linear regression, F test, VTA, , LC, . (iii) Resampling shows the VTA slope is negative while all resampled LC slopes are positive. (iv) Linear regression of individual VTA and LC ROIs shows the majority (56/87) of LC ROIs have a significant positive slope prior to motion onset while the majority (6/9) of VTA ROIs have a negative slope.
-
Figure 1—source data 1
Fluorescence data of ventral tegmental area (VTA) and locus coeruleus (LC) axons in familiar virtual reality (VR) environments.
- https://cdn.elifesciences.org/articles/95213/elife-95213-fig1-data1-v1.xlsx
Figure 1—figure supplement 1
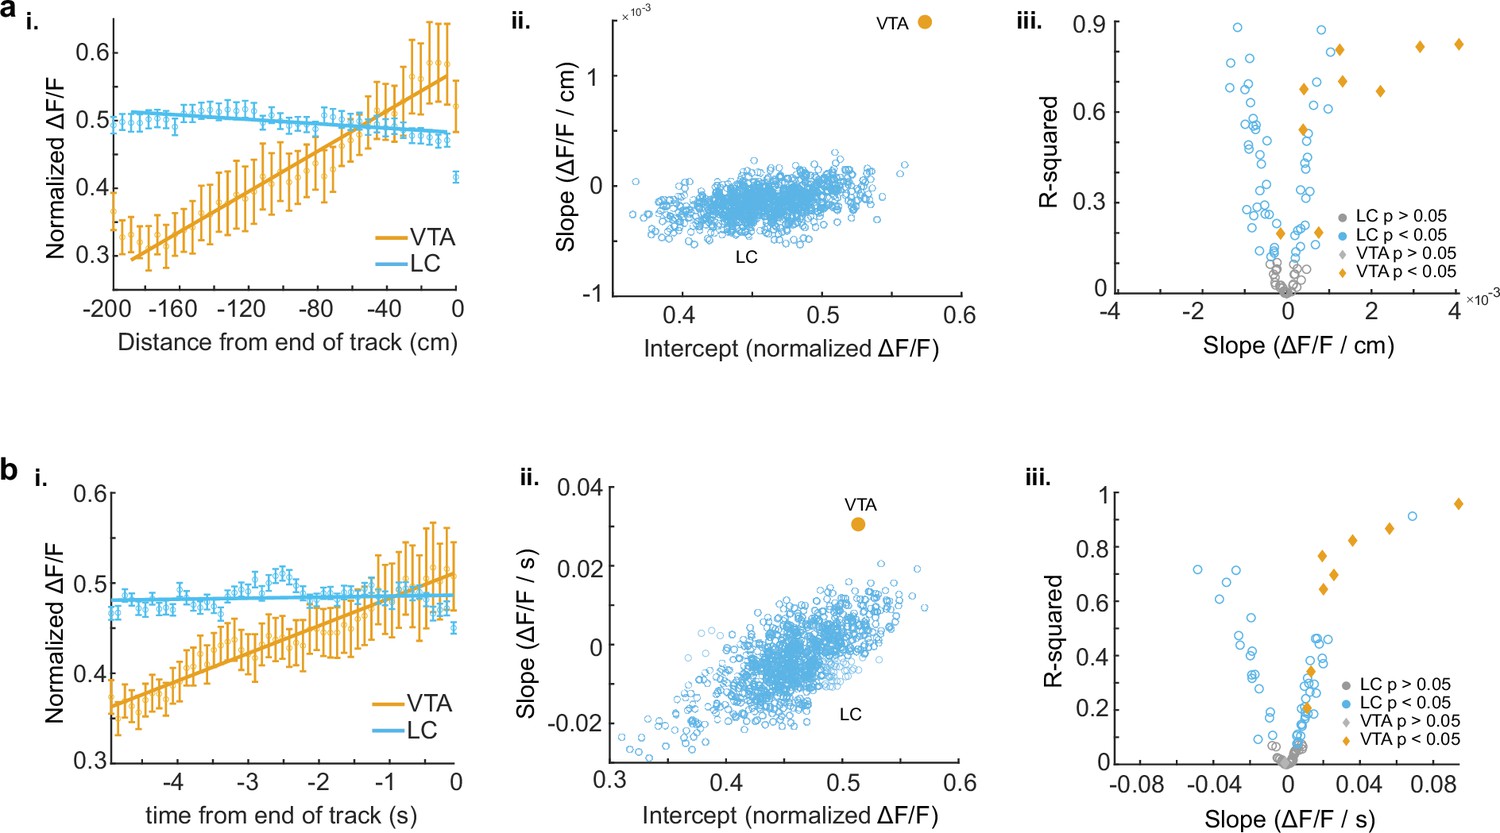
LC and VTA axon activity as a function of time and distance to reward.
(a, i) Population activity s.e.m. binned by the virtual distance to reward for ventral tegmental area (VTA) regions of interest (ROIs) (orange, 200 m track n = 9 ROIs form 8 sessions in 8 mice) and locus coeruleus (LC) ROIs (blue, 300 m track, n = 87 ROIs from 27 sessions in 17 mice) in the familiar environment. Linear regression, F test, VTA, , LC, . (ii) The LC dataset was resampled 1000× using n = 9 axons to match the number of VTA ROIs and the slope and intercept of the regression line were measured each time (blue dots). The VTA slope is steeper than all LC slopes indicating a stronger positive relationship between position and activity for VTA inputs. (iii) Linear regression of position binned activity of individual VTA (orange diamonds) and LC (blue, circles) axons. The majority (8/9) of VTA axons show a significant positive relationship with position while LC axons show both a positive (21/87 axons from 9 sessions in 8 mice) and negative (32/87 axons from 15 sessions in 9 mice) relationship. (b, i) Same data as (a, i) averaged by time to reward. Linear regression shows that the population of VTA axons has a significant positive relationship with time to reward. Linear regression, F test, VTA, , LC, . (ii) Resampling shows the VTA slope is above the resampled LC slopes indicating VTA ROIs have a stronger positive relationship with time to reward. (iii) Linear regression of individual VTA and LC axons shows the majority (8/9) of VTA axons have a significant positive relationship with time to reward while LC axons show both a significant positive (31/87 axons from 14 sessions in 11 mice) and negative (17/87 axons from 7 sessions in 4 mice) relationship.
-
Figure 1—figure supplement 1—source data 1
Fluorescence data for ventral tegmental area (VTA) and locus coeruleus (LC) axons aligned by time and distance to reward.
- https://cdn.elifesciences.org/articles/95213/elife-95213-fig1-figsupp1-data1-v1.xlsx
Figure 1—figure supplement 2
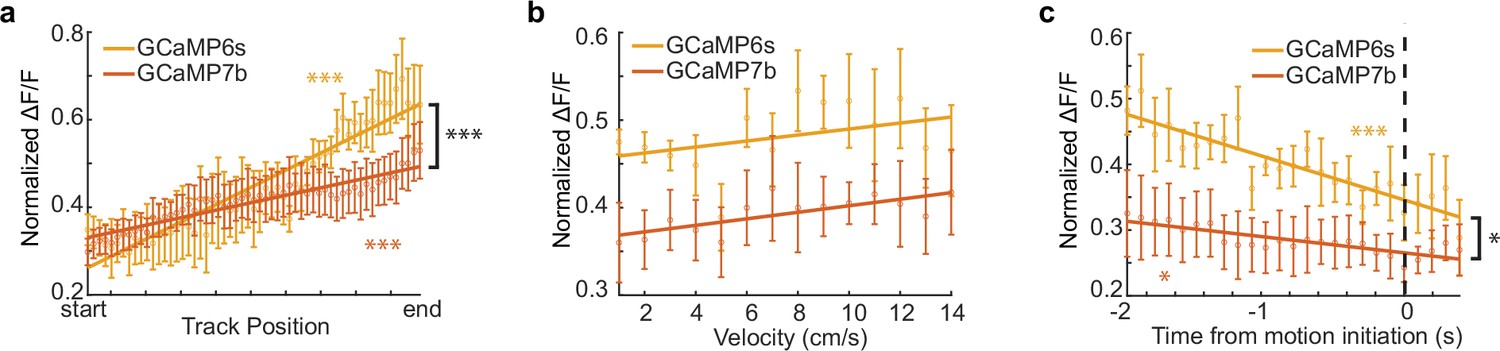
VTA DA axons expressing axon-GCaMP6s or axon-GCaMP7b show the same trends as a function of behavioral variables.
(a) Population average position binned of ventral tegmental area (VTA) GCaMP6s regions of interest (ROIs) (orange, n = 5 ROIs in 4 mice) and VTA GCaMP7b ROIs (dark orange, n = 4 ROIs, in 4 mice) in the familiar environment. Linear regression, F test, GCaMP6s, , GCaMP7b, . (b) Same data as (a) binned by velocity. Linear regression, F test, GCaMP6s, , GCaMP7b, . (c) Same data as (a) aligned to motion onset. Linear regression, F test, GCaMP6s, , GCaMP7b, . The slopes for the two GCaMP variants were compared using a one-way ANCOVA with Tukey HSD post hoc test * , ***.
-
Figure 1—figure supplement 2—source data 1
Fluorescence data of GCaMP6s and GCaMP7b ventral tegmental area (VTA) axons.
- https://cdn.elifesciences.org/articles/95213/elife-95213-fig1-figsupp2-data1-v1.xlsx
Figure 1—figure supplement 3
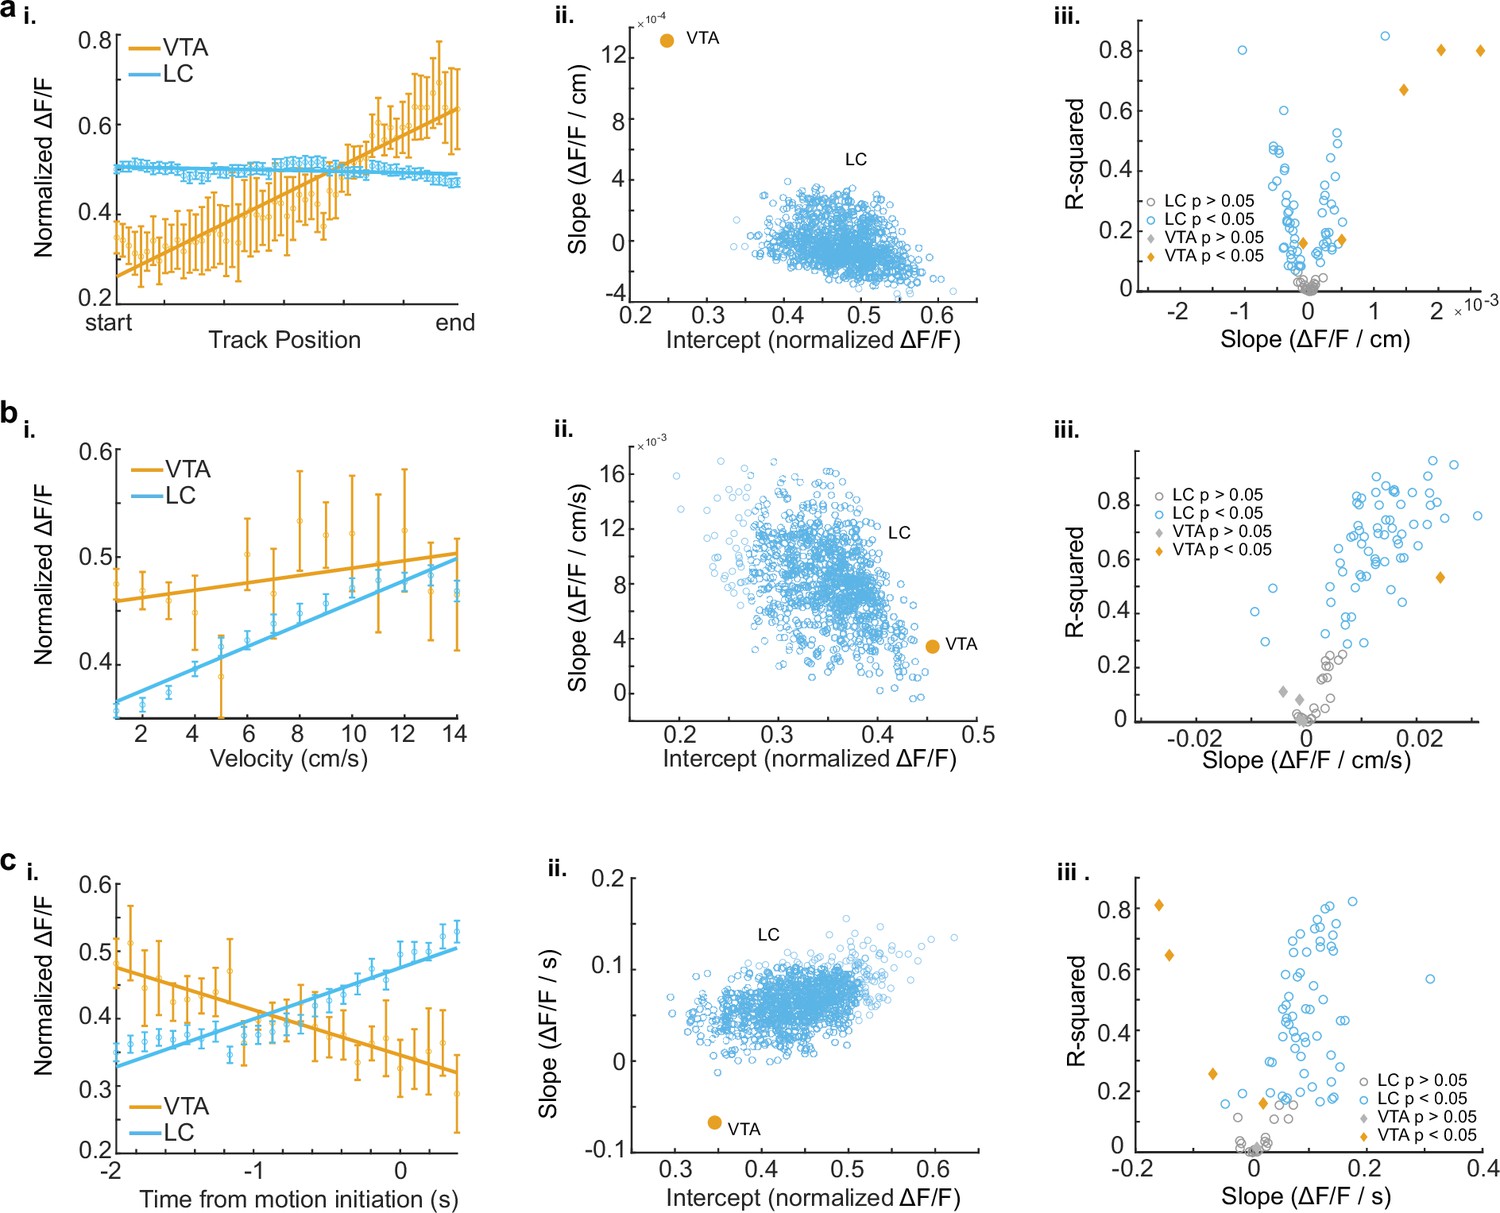
Distinct activity dynamics in VTA DA axons expressing axon-GCaMP6s and LC axons expressing axon-GCaMP6 during navigation of familiar environments.
(a, i) Population average position binned s.e.m. in axon-GCaMP6s expressing ventral tegmental area (VTA) regions of interest (ROIs) (orange, n = 5 ROIs in 4 mice) and locus coeruleus (LC) ROIs (blue, n = 87 ROIs from 27 sessions in 17 mice) . Linear regression analysis (on all data points, not means) shows that the population of VTA ROIs increase activity during approach of the end of the track while the population of LC ROIs have consistent activity throughout all positions. Linear regression, F test, VTA, , LC, . (ii) The LC dataset was resampled 1000× using n = 5 axons to match the number of VTA ROIs and the slope and intercept of the regression line were measured each time (blue dots). The VTA slope is steeper than all LC slopes indicating a stronger positive relationship between position and activity for VTA inputs. (iii) Linear regression of position binned activity of individual VTA (orange diamonds) and LC (blue, circles) axons. The majority (4/5) of VTA axons show a significant positive relationship with position while LC axons show both a positive (25/87) and negative (37/87) relationship. (b, i) Same data as (a, i) binned by velocity. Linear regression shows that the population of LC ROIs have a significant relationship with velocity. Linear regression, F test, VTA, , LC,. (ii) Resampling shows the VTA slope is within the resampled LC slopes indicating similar relationships with velocity. (iii) Linear regression of individual VTA and LC axons shows the majority (63/87) of LC axons have a significant positive relationship with velocity while only one VTA axon shows this relationship. (c, i) Same data as (a, i) aligned to motion onset. Linear regression shows that the population of VTA axons have a negative slope prior to motion onset while LC axons have positive slope. Linear regression, F test, VTA, , LC, . (ii) Resampling shows the VTA slope is negative while all resampled LC slopes are positive. (iii) Linear regression of individual VTA and LC axons shows the majority (56/87) of LC axons have a significant positive slope prior to motion onset while the majority (3/5) of VTA axons have a negative slope.
-
Figure 1—figure supplement 3—source data 1
Fluorescence data of GCaMP6s ventral tegmental area (VTA) and locus coeruleus (LC) axons in familiar virtual reality (VR) environments.
- https://cdn.elifesciences.org/articles/95213/elife-95213-fig1-figsupp3-data1-v1.xlsx
Figure 2
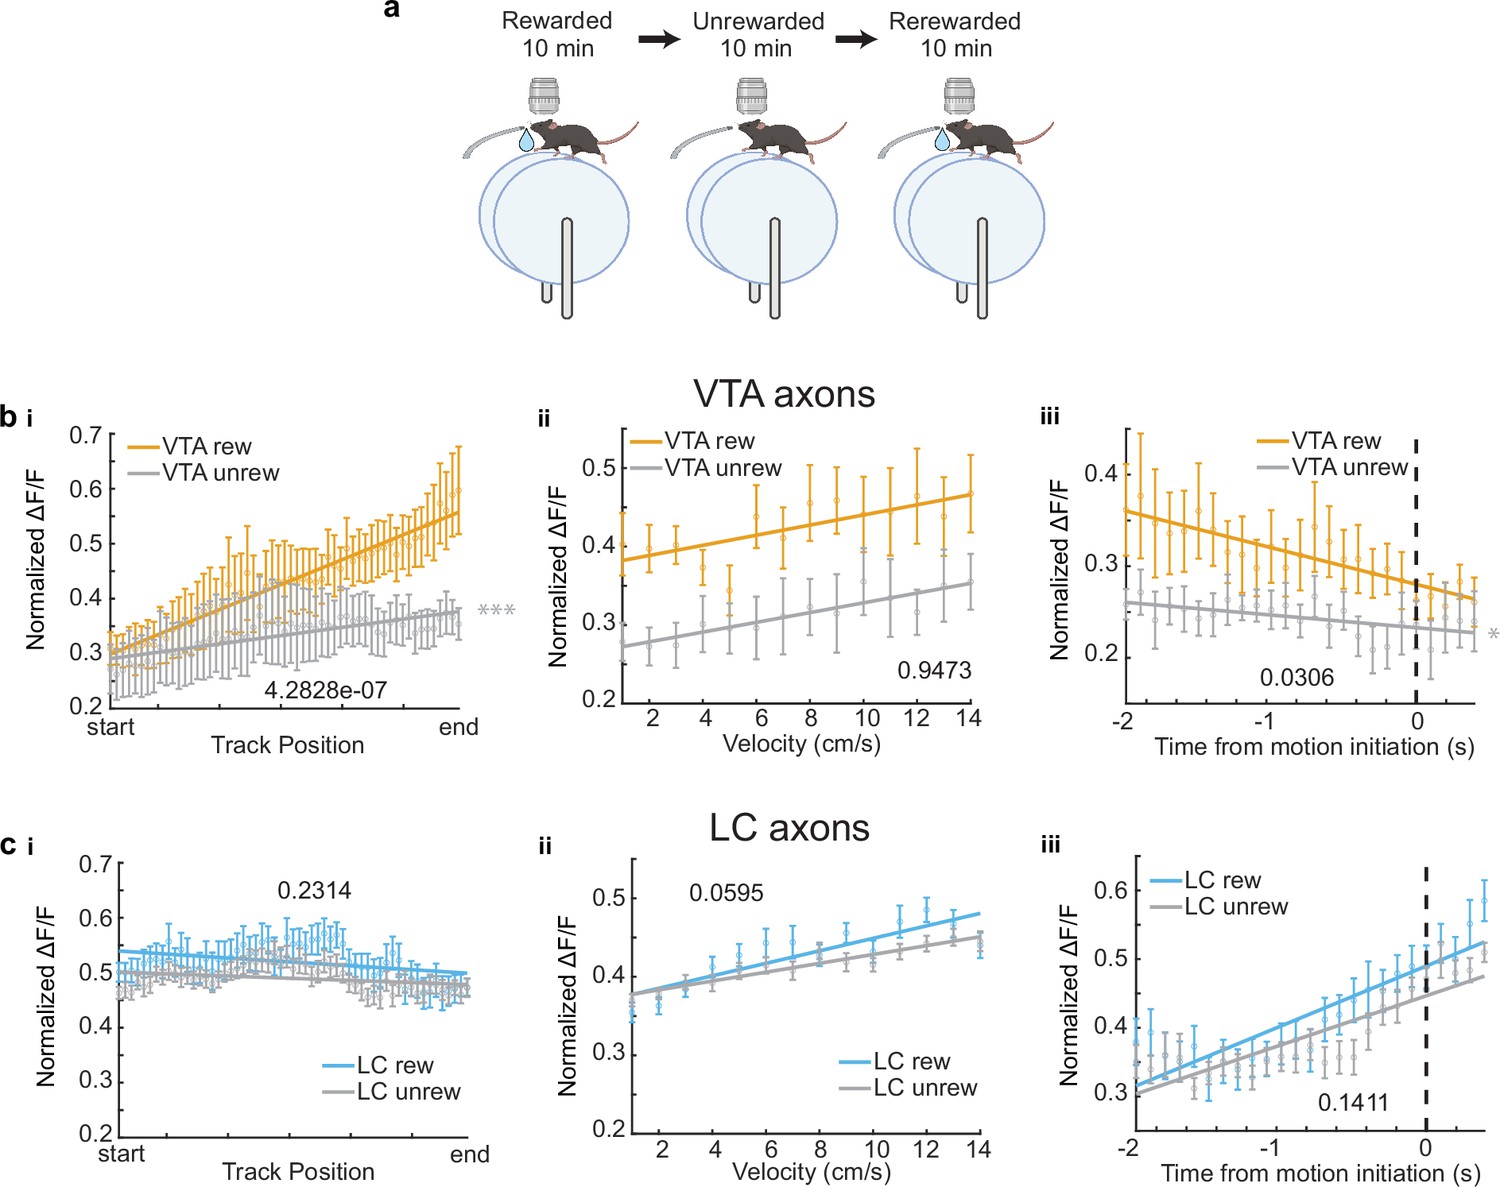
Removal of reward restructures ventral tegmental area (VTA) but not locus coeruleus (LC) input activity during spatial navigation.
(a) Experimental paradigm. (b, i) Population average position binned of VTA regions of interest (ROIs) (n = 6 ROIs in 6 mice) in the rewarded (VTA rew, orange) and unrewarded conditions (VTA unrew, gray). Linear regression, F test, Rewarded, , Unrewarded, . (ii) Same data as (b, i) binned by velocity. Linear regression, F test, Rewarded, , Unrewarded, . (iii) Same data as (b, i) aligned to motion onset. Linear regression, F test, Rewarded, , Unrewarded, . (c, i) Population average position binned s.e.m. of LC ROIs (n = 26 ROIs in 7 sessions in 4 mice) in the rewarded (LC rew, blue) and unrewarded conditions (LC unrew, gray). Linear regression, F test, Rewarded, , Unrewarded, . (ii), Same data as (c, i) binned by velocity. Linear regression, F test, Rewarded, , Unrewarded, . (iii) Same data as (c, i) aligned to motion onset. Linear regression, F test, Rewarded, , Unrewarded, . The slope of each unrewarded measure was compared to the familiar laps using a one-way ANCOVA with Tukey HSD post hoc test. *, ***. This figure was created with BioRender.com.
-
Figure 2—source data 1
Fluorescence data of ventral tegmental area (VTA) and locus coeruleus (LC) axons in rewarded and unrewarded virtual reality (VR) environments.
- https://cdn.elifesciences.org/articles/95213/elife-95213-fig2-data1-v1.xlsx
Figure 3 with 2 supplements
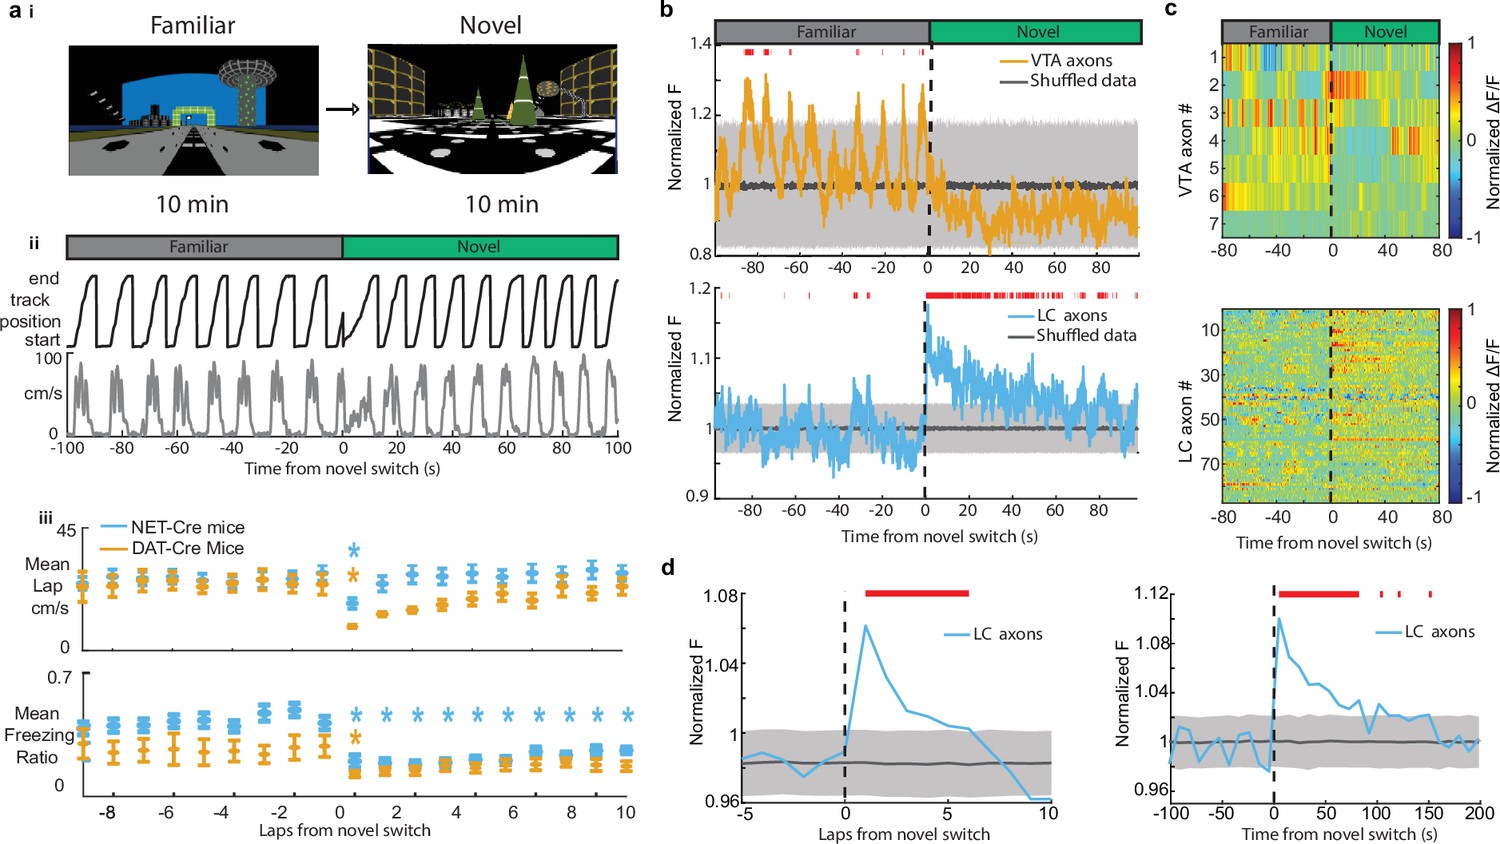
Exposure to a novel environment causes an abrupt and sustained increase in activity in locus coeruleus (LC) but not ventral tegmental area (VTA) inputs to dCA1.
(a, i) Experimental paradigm. (ii) Behavior from example mouse during the transition from the familiar virtual reality (VR) environment to a novel VR environment showing the animals track position (top, black) and velocity (bottom, gray). (iii) The average running velocity ± s.e.m. of all mice (n = 7 DAT-Cre mice; n = 17 NET-Cre mice) during the transition to a novel VR environment (top). The average freezing ratio of all mice ± s.e.m. calculated as the time spent immobile (velocity <5 cm/s) divided by the total lap time. Each lap was compared to the final lap in the familiar environment using a one-way ANOVA with Tukey HSD post hoc test (Blue *, NET-Cre mice ; Orange *, DAT-Cre mice ). (b) Mean normalized fluorescence of all VTA regions of interest (ROIs) (top, n = 7 sessions in 7 mice) and LC ROIs (bottom, n = 27 sessions in 17 mice) aligned to the switch to the novel environment. To define a baseline and 95% CI (gray shaded region), 1000 shuffles were created from the calcium traces and down-sampled to match the sample size and averaged. This was repeated 1000 times and the mean and 95% CI of this shuffled data were determined for each frame. Red lines indicate periods where two or more consecutive frames passed above the %CI of the shuffled baseline. (c) Normalized activity of all VTA ROIs (top) and LC ROIs (bottom) aligned to the switch to the novel VR environment. (d) The normalized fluorescence of all LC ROIs binned by lap (left) or into 50 frame bins (right). The baseline and 95% CI (gray shaded region) were defined using the same method as in (b) Red lines indicate bins above the baseline 95% CI.
-
Figure 3—source data 1
Fluorescence data of ventral tegmental area (VTA) and locus coeruleus (LC) axons in novel virtual reality (VR) environments.
- https://cdn.elifesciences.org/articles/95213/elife-95213-fig3-data1-v1.xlsx
Figure 3—figure supplement 1
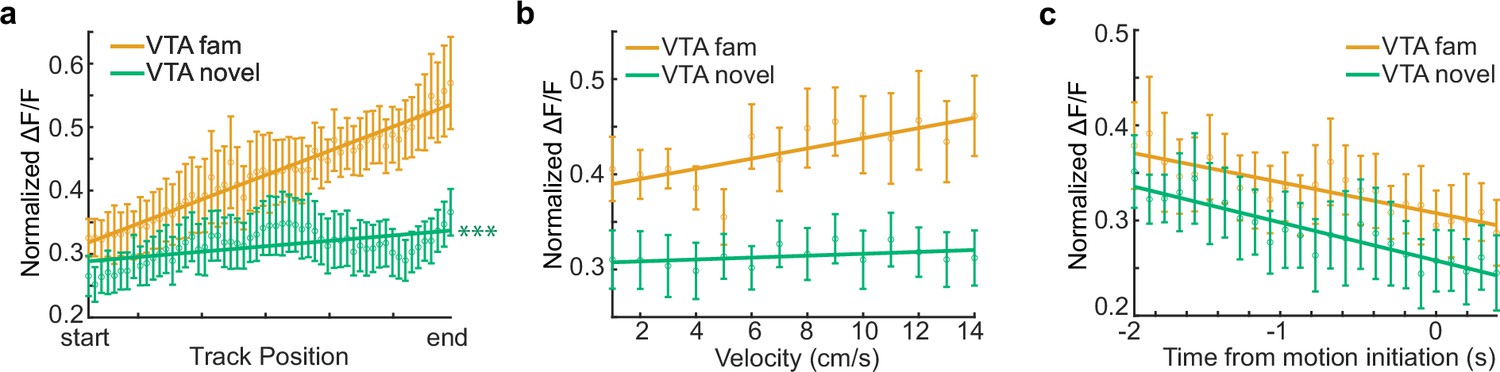
Reward related activity in VTA DA axons is diminished in a novel environment.
(a) Population average position binned of ventral tegmental area (VTA) regions of interest (ROIs) (n = 7 ROIs in 7 mice) in the familiar (orange) and novel (green) rewarded environments. Linear regression, F test, Rewarded, , Unrewarded, . (b) Same data as (a) binned by velocity. Linear regression, F test, Rewarded, , Unrewarded, . (c) Same data as (a) aligned to motion onset. Linear regression, F test, Rewarded, , Unrewarded, . The slope of each novel measure was compared to the familiar laps using a one-way ANCOVA with Tukey HSD post hoc test. ***.
Figure 3—figure supplement 2
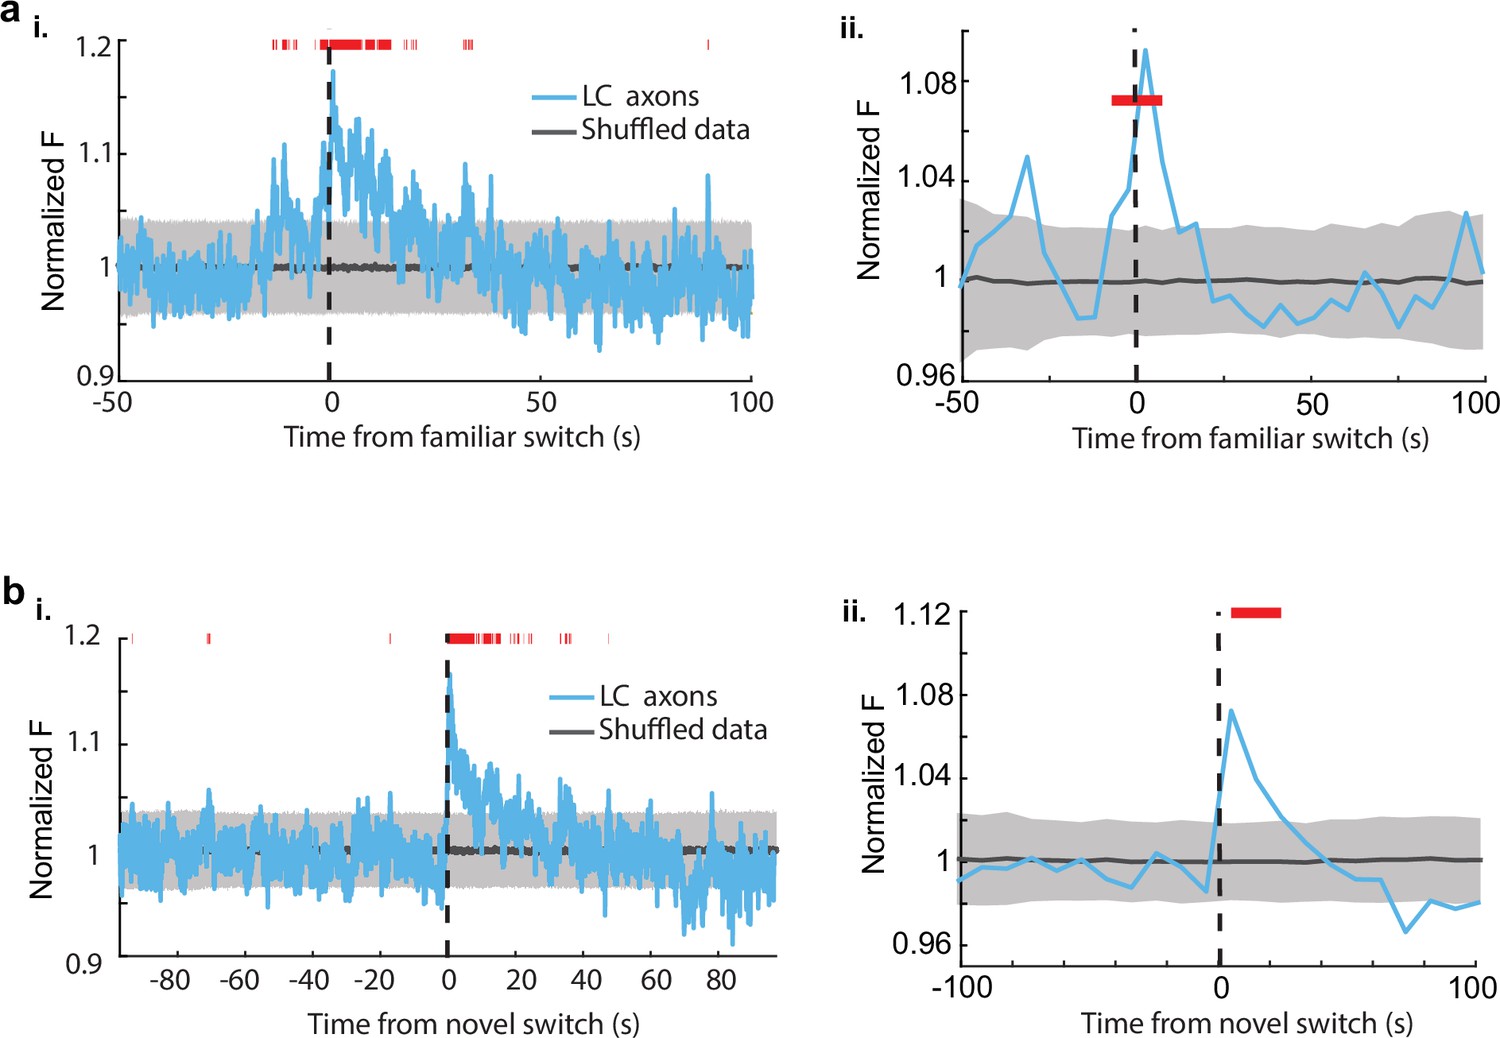
Increased LC axon activity following exposure to a familiar environment and during immobile periods in a novel environment.
(a, i) Mean normalized fluorescence of locus coeruleus (LC) regions of interest (ROIs) (n = 50, 11 sessions in 9 mice) aligned to the switch from dark to the familiar environment. To define a baseline and 95% CI (gray shaded region), 1000 shuffles were created from the calcium traces and down-sampled to match the sample size and averaged. This was repeated 1000 times and the mean and 95% CI of this shuffled data were determined for each frame. Red lines indicate periods where two or more consecutive frames passed above the %CI of the shuffled baseline. (a, ii) The normalized fluorescence of all LC binned into 50 frame bins. The baseline and 95% CI (gray shaded region) were defined using the same method as in (a). Red lines indicate two or more consecutive bins above the baseline 95% CI. (b, i) Mean normalized fluorescence of LC ROIs (n = 87 ROIs from 27 sessions in 17 mice) during immobile periods aligned to the switch from the familiar to the novel environment. The baseline and 95% CI (gray shaded region) were defined using the same method as in (a). Red lines indicate two or more consecutive bins above the baseline 95% CI. (b, ii) The normalized fluorescence of LC axons during immobile periods binned into 50 frame bins. The baseline and 95% CI (gray shaded region) were defined using the same method as in (a). Red lines indicate two or more consecutive bins above the baseline 95% CI.
Figure 4
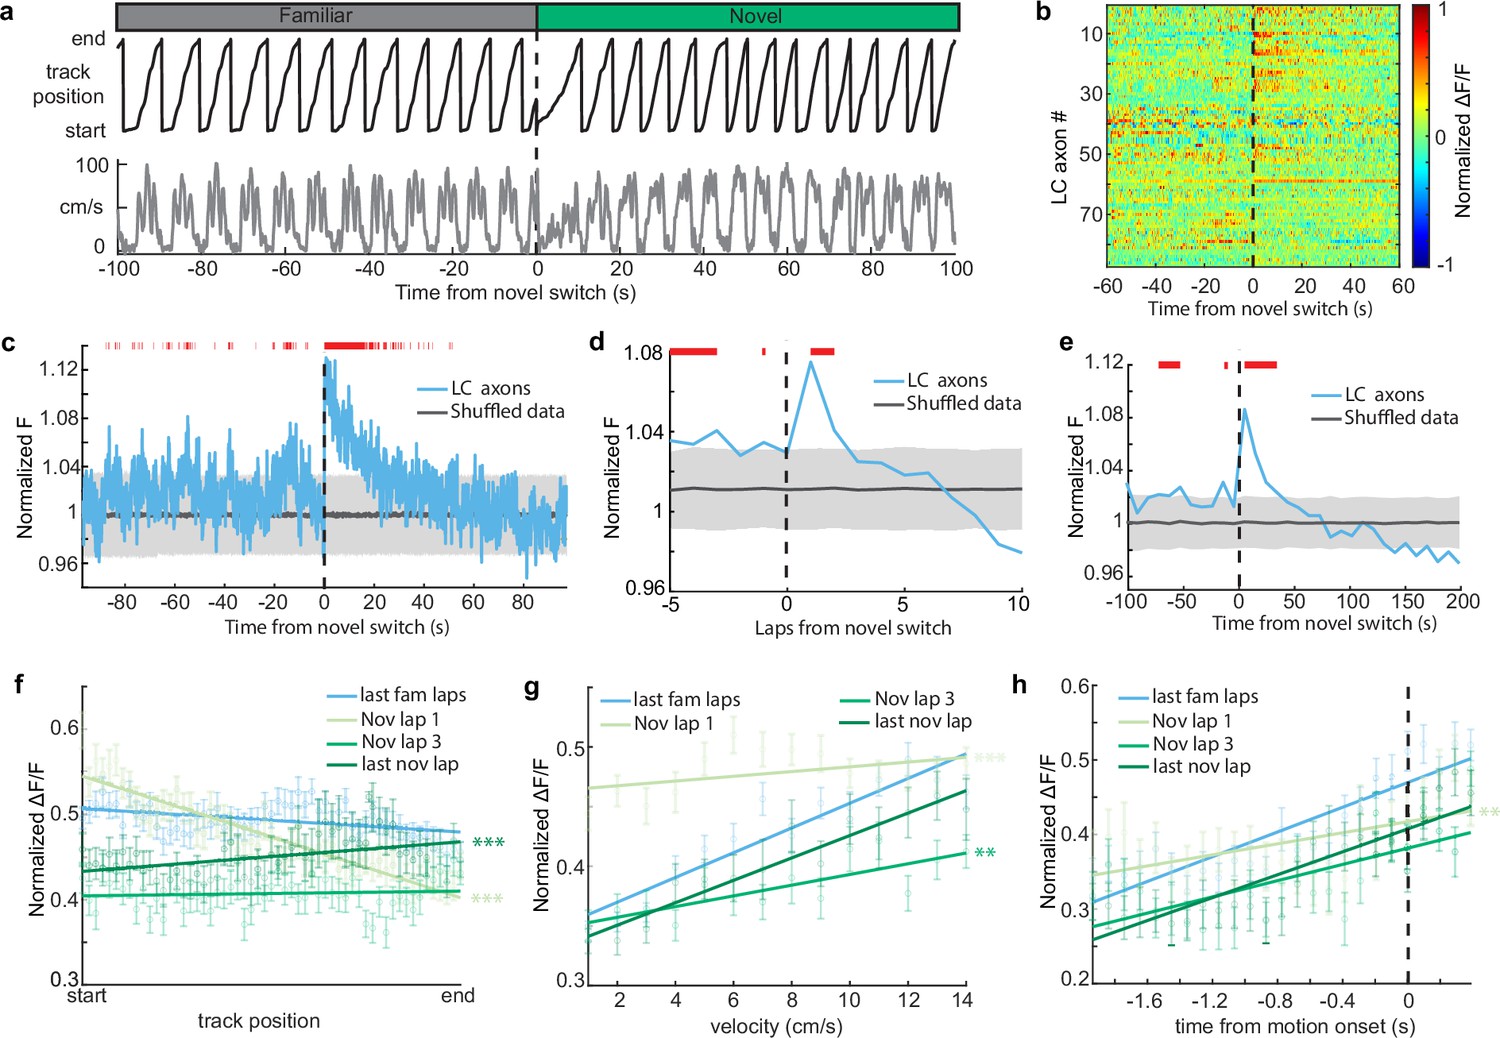
Novelty-induced changes in behavior explain the late but not early increases in locus coeruleus (LC) activity.
(a) Good behavior from example mouse following removal of freezing periods (velocity <0.2 cm/s) during the transition from the familiar to a novel virtual reality (VR) environment showing the animals track position (top, black) and velocity (bottom, gray). (b) Normalized activity of all LC regions of interest (ROIs) aligned to the switch to the novel VR environment following removal of freezing periods (n = 87 ROIs from 27 sessions in 17 mice). (c) Mean normalized F of all LC ROIs (bottom, n = 87) aligned to the switch to the novel environment. To define a baseline and 95% CI (gray shaded region), 1000 shuffles were created from the calcium traces and down-sampled to match the sample size and averaged. This was repeated 1000 times and the mean and 95% CI of this shuffled data were determined for each frame. Red lines indicate periods where two or more consecutive frames passed above the 95% CI of the shuffled baseline. The normalized F of all LC ROIs binned by lap (d) or into 50 frame bins (e). The baseline and 95% CI (gray shaded region) were defined using the same method as in (c). Red lines indicate bins above the baseline 95% CI. Population average position binned (f), velocity binned (g), and motion onset aligned (h) s.e.m. in LC ROIs (n = 87) in the final laps of the familiar environment (light blue), and the first (orange), third (dark blue), and final laps (green) of the novel environment. Linear regression, F test, position binned (f) fam last, , nov 1, , nov 3, , nov last, ; velocity binned (g) fam last, , nov 1, , nov 3, , nov last, ; motion onset aligned (h) fam last, , nov 1, , nov 3, , nov last, . The slope of each lap was compared to the final familiar laps using a one-way ANCOVA with Tukey HSD post hoc test. **, ***.
-
Figure 4—source data 1
Fluorescence data of locus coeruleus (LC) axons during good behavior in novel virtual reality (VR) environments.
- https://cdn.elifesciences.org/articles/95213/elife-95213-fig4-data1-v1.xlsx
Additional files
Download links
A two-part list of links to download the article, or parts of the article, in various formats.
Downloads (link to download the article as PDF)
Open citations (links to open the citations from this article in various online reference manager services)
Cite this article (links to download the citations from this article in formats compatible with various reference manager tools)
Distinct catecholaminergic pathways projecting to hippocampal CA1 transmit contrasting signals during navigation in familiar and novel environments
eLife 13:RP95213.
https://doi.org/10.7554/eLife.95213.4


