Limited column formation in the embryonic growth plate implies divergent growth mechanisms during pre- and postnatal bone development
- Department of Molecular Genetics, Weizmann Institute of Science, Israel
- Würzburg Institute of Systems Immunology, Julius‐Maximilians‐Universität Würzburg, Germany
- Department of Biologic and Materials & Prosthodontics, University of Michigan School of Dentistry, United States
- Aix Marseille Univ, INSERM, MMG, UMR1251, Turing Center for Living Systems, France
- School of Mathematical Sciences, Queen Mary University of London, United Kingdom
Figures
Figure 1 with 13 supplements
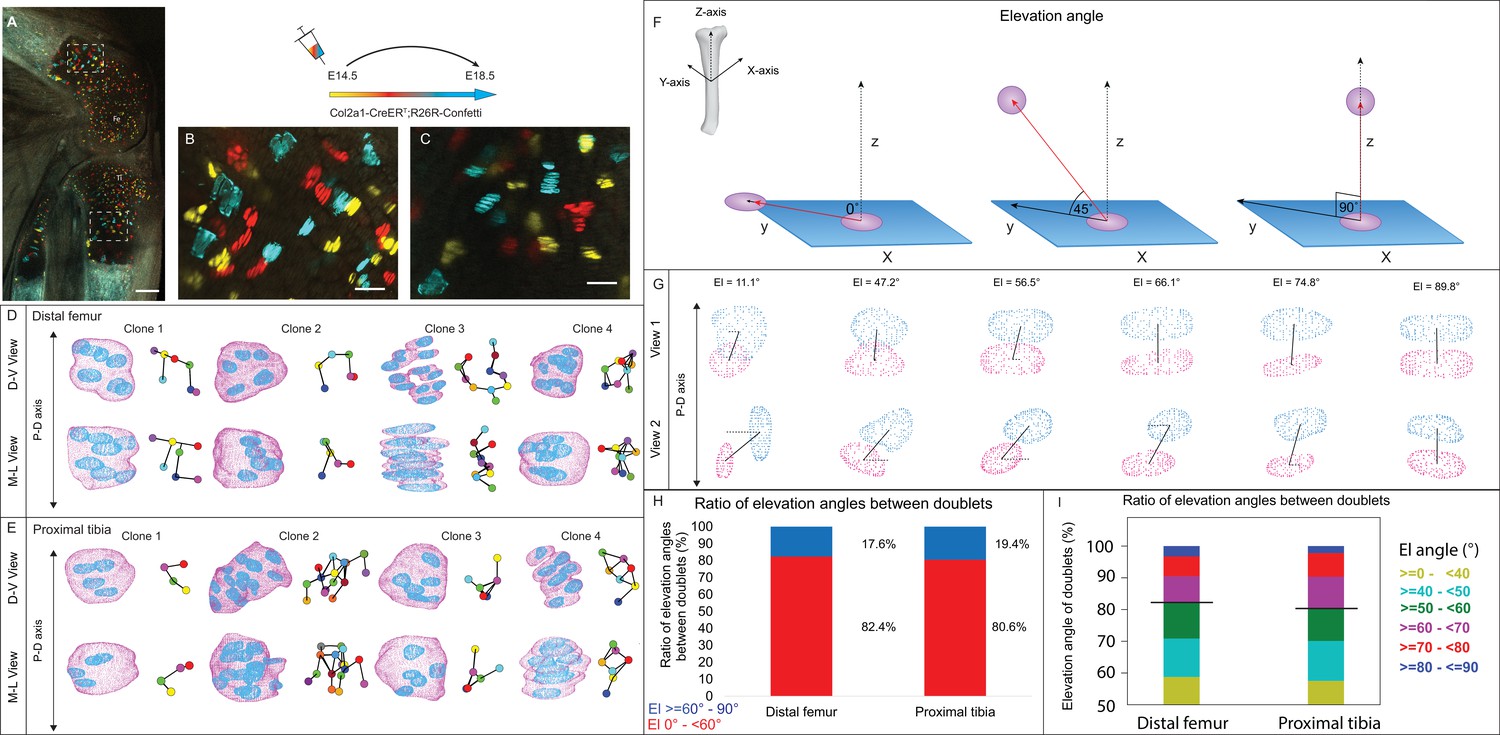
3D imaging of clones in the embryonic growth plate reveals complex morphologies.
Chondrocyte clones in the proximal tibia and distal femur growth plates of Col2a1-CreERT2:R26R-Confetti heterozygous mice were pulsed by tamoxifen administration at E14.5 and imaged at E18.5. (A–C) An image of chondrocyte clones in the knee was captured with a combination of multiphoton and confocal imaging using a Leica TCS SP8 confocal laser-scanning/MP microscope. Sparse labeling is observed throughout the growth plate. Scale bar: 250 µm. Magnified optical section of distal femur (B) and proximal tibia (C) highlight clones in the proliferative, prehypertrophic and hypertrophic zones, which appear to form columns. Scale bars: 50 µm. (D, E) 3D rendering of representative clones along the D-V and M-L axes from the distal femur (D) and proximal tibia (E) growth plates. Clone surface is in magenta and nuclear surface in blue. Skeletonized illustrations on the right highlight the complexity of clonal morphologies. Nuclear centroids are depicted as randomly colored circles; lines connect between nearest neighbor nuclei. (F) Illustration of various elevation angles between the centroids of two cells. An elevation angle of 0° indicates that the two cells are in the same equatorial plane (XY), whereas an elevation angle of 90° indicates that the cells are directly above the equatorial plane in the same XZ plane (perpendicular to the XY plane). The Z axis represents the P-D bone axis. The equatorial plane XY is perpendicular to the Z axis. The red line is the projection of the cell. (G) Representative images of nuclei at different elevation angles in two orthogonal viewing angles. Solid black lines represent the shortest distance between nuclear centroids. Elevation angle is the angle between the dashed black line and solid black line. (H, I) Stacked histograms show quantification of elevation angles between doublet cells in distal femur (n = 1044) and proximal tibia clones (n = 805). (H) Proportion of complete rotations (i.e., elevation angles of 60–90°, in blue) vs incomplete rotations (under 60°, in red). (I) Distribution of elevation angles (°) is color-coded as indicated. Black line marks the 60° cutoff. Three biologically independent samples were examined in nine independent experiments.
Figure 1—figure supplement 1
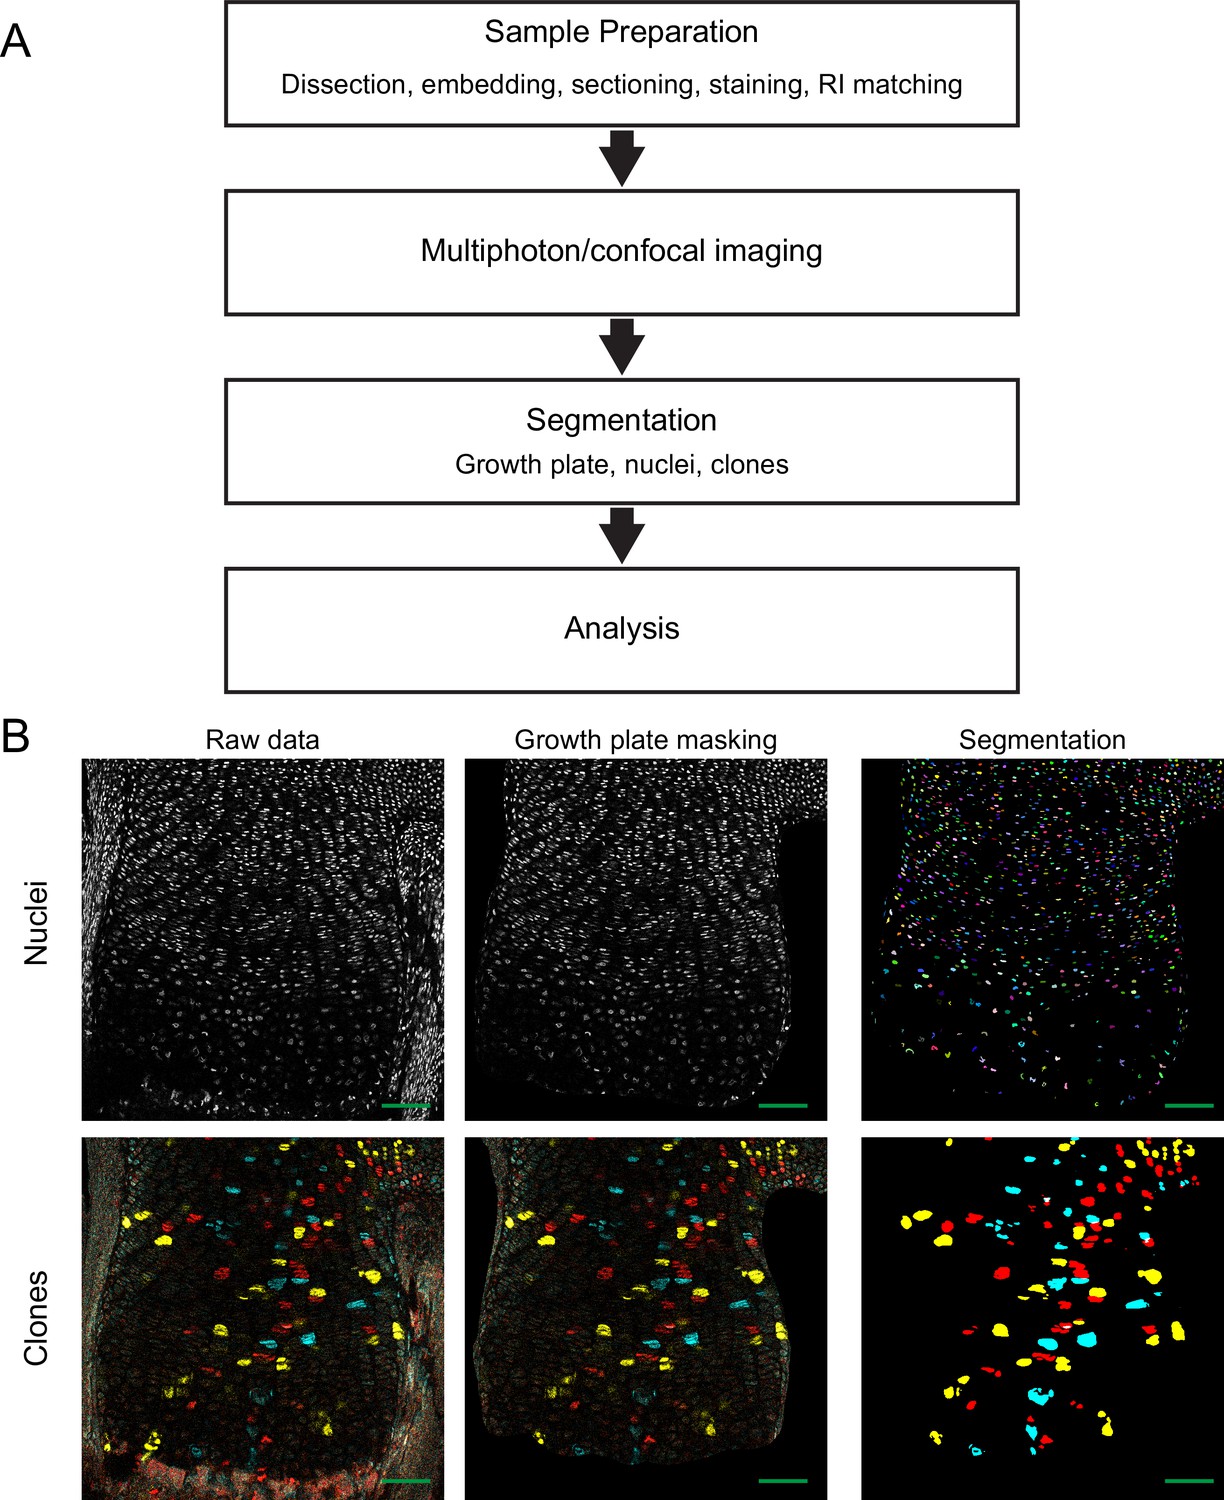
Schematic of experimental workflow and segmentation.
(A) Scheme highlighting the different stages of the modified 3D MAPs pipeline. (B) For semi-automatic segmentation of clones and nuclei, the raw 3D image is masked in Microscopy Image Browser (MIB) to remove clones and nuclei not belonging to the growth plate. Then, the masked nucleus image undergoes automatic segmentation in XPIWIT to produce a randomly color-coded 3D image, where each color represents a single nucleus. The masked clone image undergoes semi-automatic segmentation in Imaris and Fiji, where each clone is colored according to its Confetti fluorophore (yellow, YFP; red, RFP; cyan, CFP). Scale bars: 100 µm.
Figure 1—figure supplement 2
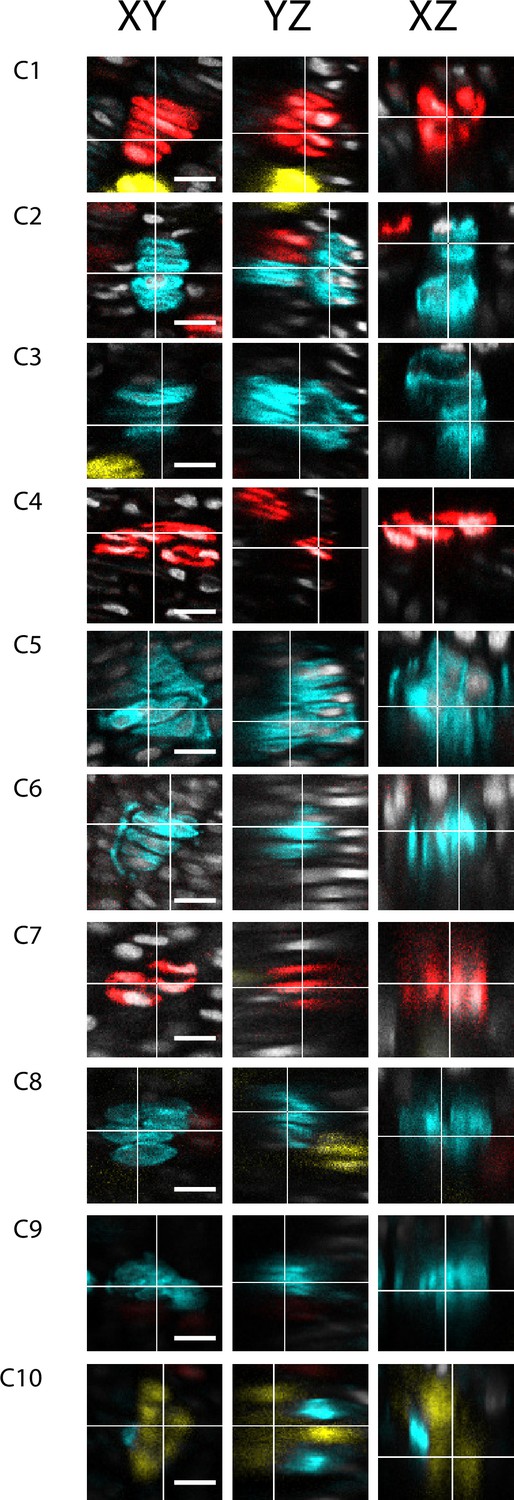
Orthogonal viewing angles of raw imaging data.
Images from raw data of eight embryonic clones from three orthogonal viewing angles, XY, XZ, and YZ. In each image the Y axis represents the P-D bone axis. The expectation of a column is to see a longitudinal stack of cells which appears oriented along the XY, and YZ axis (P-D axis), while the XZ axis should show one or two cells, as it represents a transverse cross section through a presumptive column. Each clone shows that in one viewing angle the clone appears column-like, while other viewing angles shows they expand along the Z axis, suggesting they are cluster-like. Scale bars: 25 µm.
Figure 1—video 1
Volumetric rendering of embryonic clone in the proximal tibia growth plate.
Clone surface is in magenta and nuclear surface in blue.
Figure 1—video 2
Volumetric rendering of embryonic clone in the proximal tibia growth plate.
Clone surface is in magenta and nuclear surface in blue.
Figure 1—video 3
Volumetric rendering of embryonic clone in the proximal tibia growth plate.
Clone surface is in magenta and nuclear surface in blue.
Figure 1—video 4
Volumetric rendering of embryonic clone in the distal femur growth plate.
Clone surface is in magenta and nuclear surface in blue.
Figure 1—video 5
Volumetric rendering of embryonic clone in the distal femur growth plate.
Clone surface is in magenta and nuclear surface in blue.
Figure 1—video 6
Volumetric rendering of embryonic clone in the distal femur growth plate.
Clone surface is in magenta and nuclear surface in blue.
Figure 1—video 7
Volumetric rendering of embryonic clone in the distal femur growth plate.
Clone surface is in magenta and nuclear surface in blue.
Figure 1—video 8
Volumetric rendering of embryonic clone in the distal femur growth plate.
Clone surface is in magenta and nuclear surface in blue.
Figure 1—video 9
Volumetric rendering of embryonic clone in the distal femur growth plate.
Clone surface is in magenta and nuclear surface in blue.
Figure 1—video 10
Volumetric rendering of embryonic clone in the distal femur growth plate.
Clone surface is in magenta and nuclear surface in blue.
Figure 1—video 11
Volumetric rendering of embryonic clone in the distal femur growth plate.
Clone surface is in magenta and nuclear surface in blue.
Figure 2 with 2 supplements
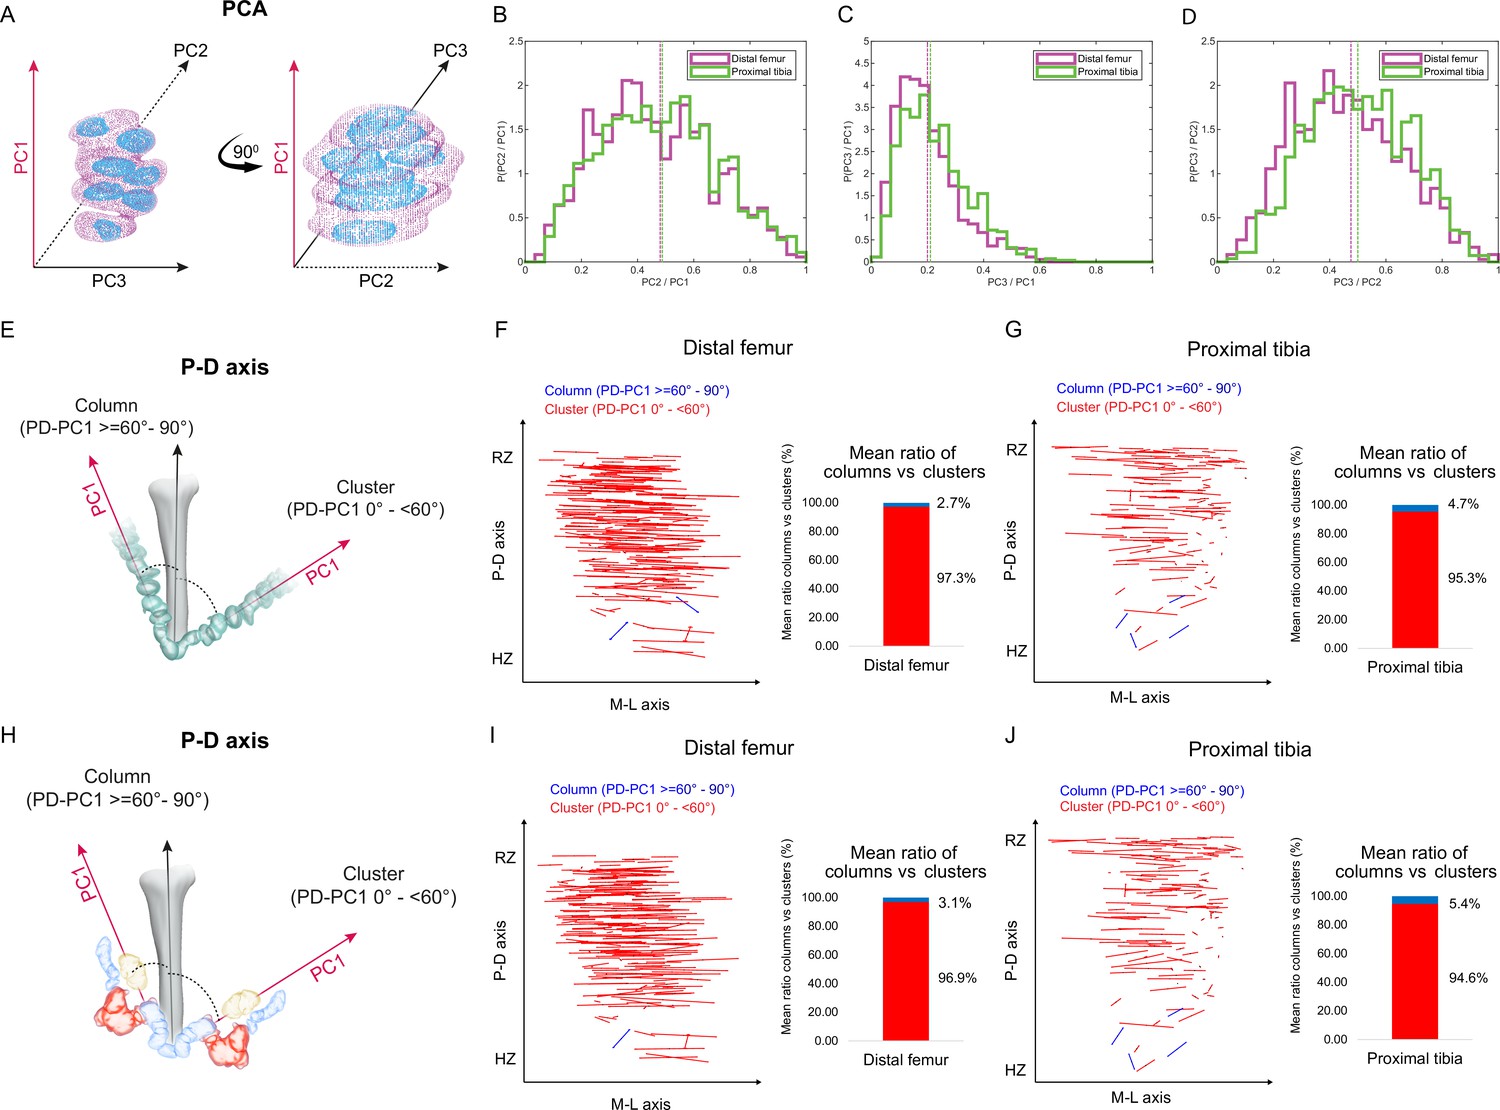
Columns are rare in the embryonic growth plate.
Clone morphology was extracted by calculating the three orthogonal axes of each clone using principal component analysis (PCA). PC1 (pink arrow). represents the long axis of the clone, PC2 (dashed black arrow) the medium axis, and PC3 (solid black arrow) the short axis. (A) A schematic drawing of the same clone from two orthogonal viewing angles with principal components labeled. (B–D) Histograms of clone PC ratios in E18.5 distal femur (DF) and proximal tibia (PT) growth plates reveal that clonal morphology is either oblate or prolate ellipsoid. In half of the clones, the long axis was at least twice the size of the medium axis (PC2/PC1: DF mean ± SD, 0.464 ± 0.197; PT, 0.469 ± 0.201; B), the long axis was at least five times the size of the short axis (PC3/PC1: DF, 0.201 ± 0.109; PT, 0.226 ± 0.119; C), and the medium axis was at least twice the size of the short axis (PC3/PC2: DF, 0.456 ± 0.189; PT, 0.504 ± 0.182; D). Dashed lines show the mean between samples. (E) Scheme illustrating the threshold between uniclones considered as columns (i.e., angle between long axis of the clone and P-D axis of the bone is 60–90°) or clusters (i.e., angle is below 60°). (F, G) Orientation maps along the P-D and M-L axes and quantification of mean ratio of columns (in blue) vs clusters (in red) per sample for clones in the DF (n = 1044; F) and PT (n = 805; G) growth plates. Each line in the map represents the orientation of the long axis of an individual clone, whereas the length of the line is proportional to that of the clonal long axis (PC1). RZ refers to the middle of the resting zone; HZ refers to the end of the hypertrophic zone. (H) Scheme illustrating the threshold between multiclones considered as columns or clusters. (I, J) Orientation maps and quantification of mean ratio of multiclonal columns vs clusters per sample for the DF (n = 816; I) and PT (n = 619; J) growth plates.
Figure 2—figure supplement 1
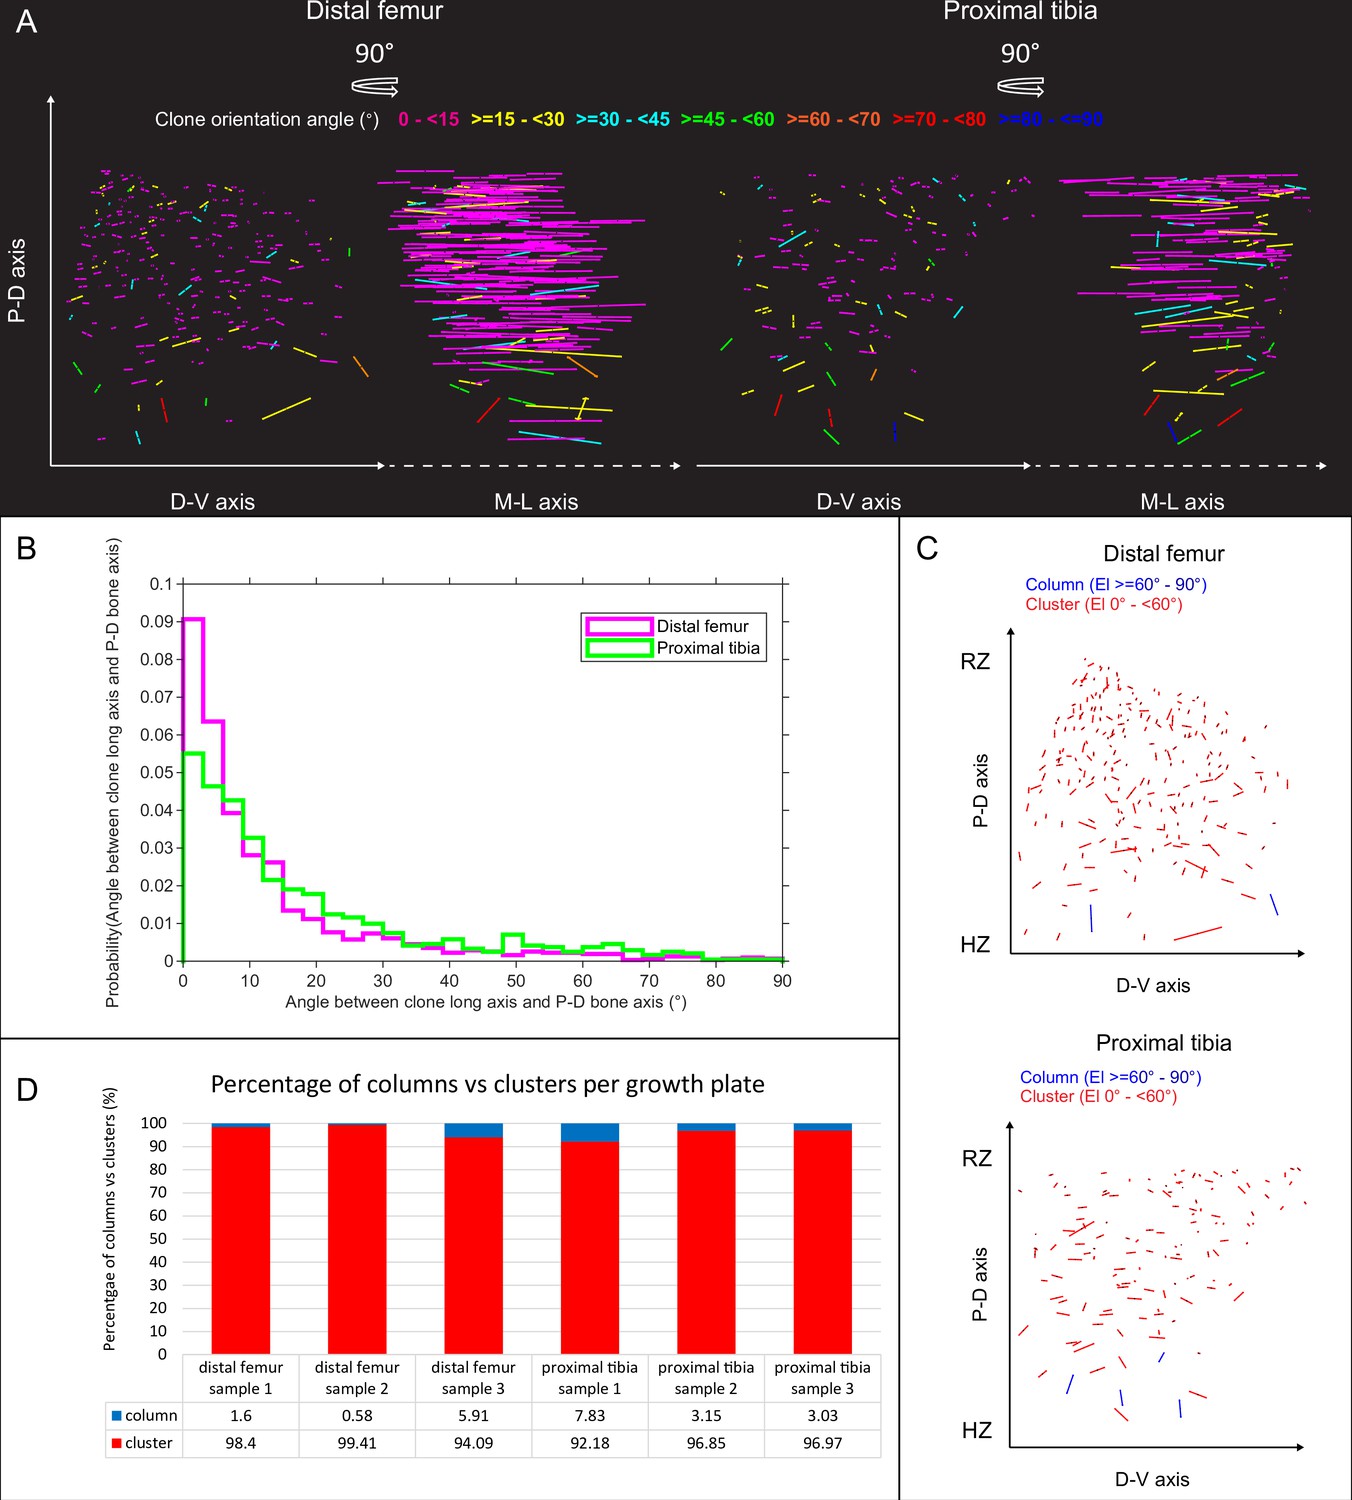
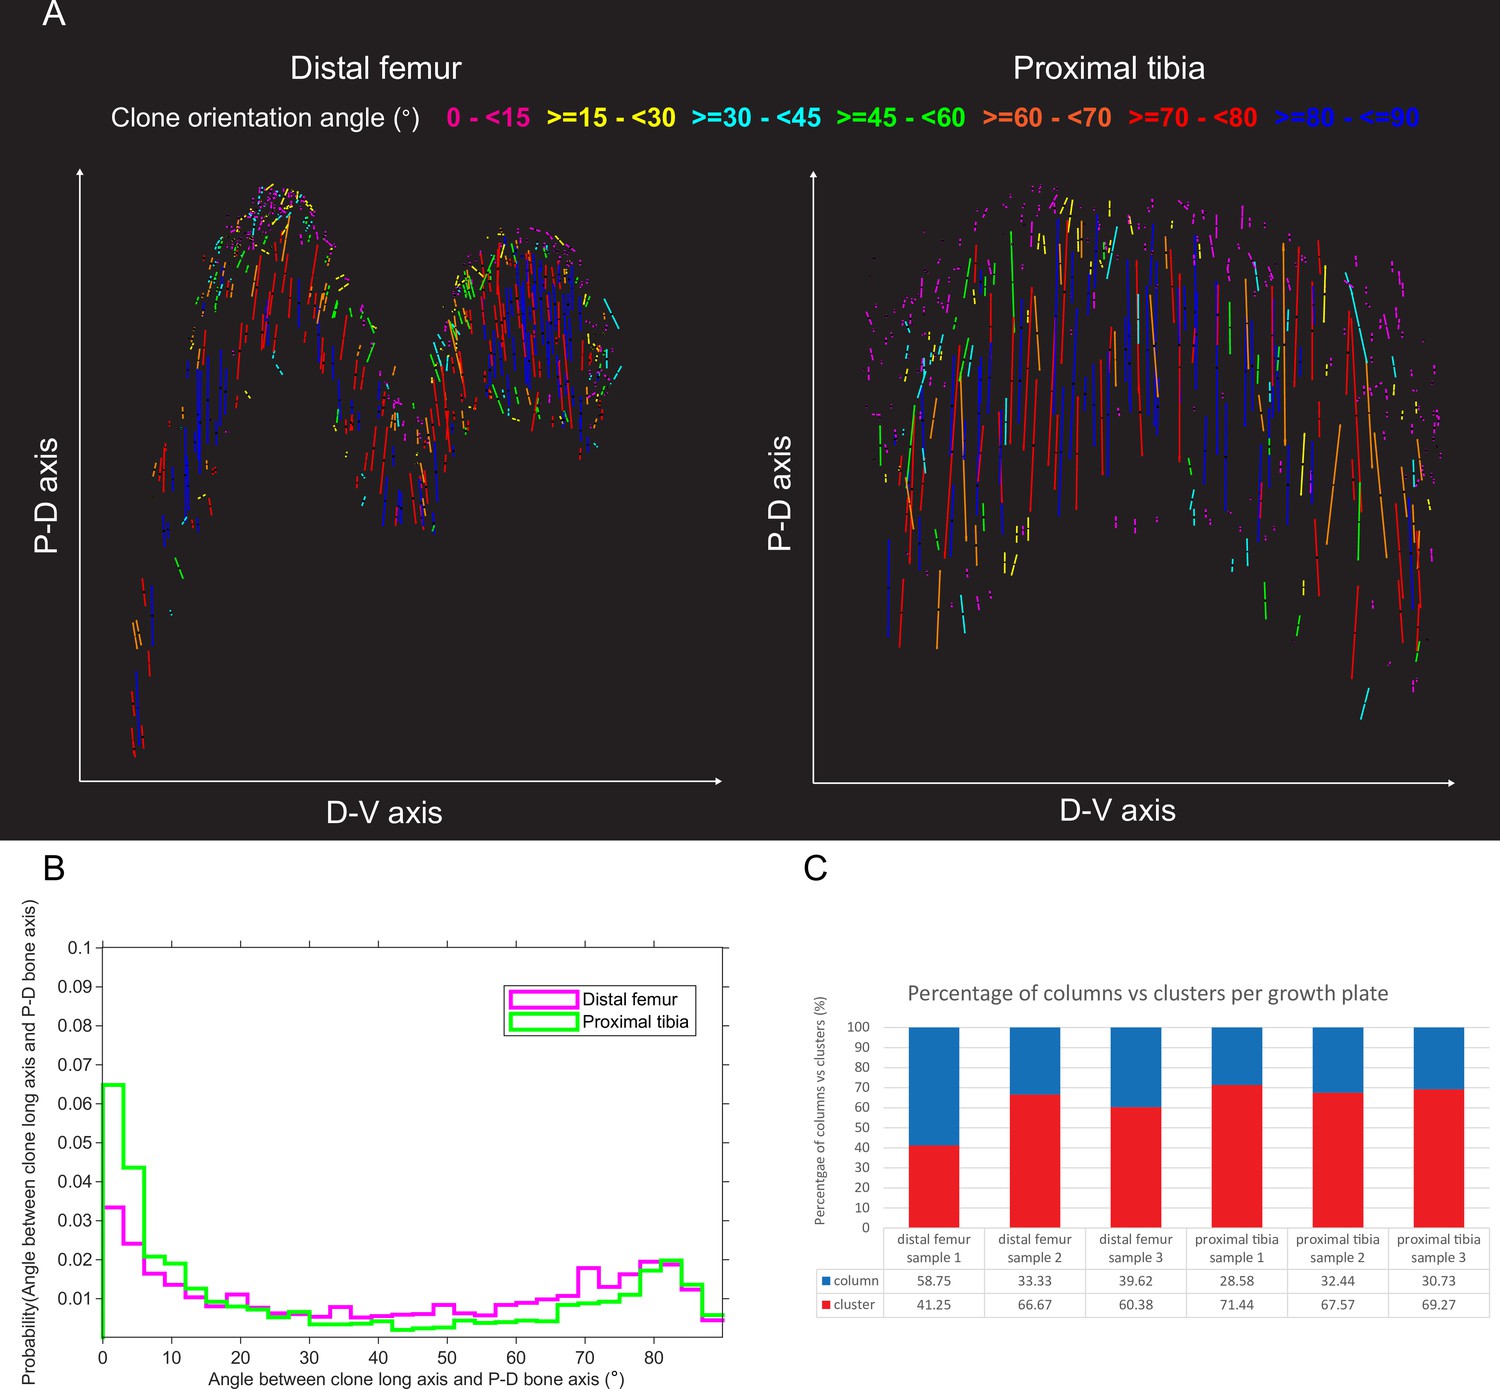
Orientation maps and distribution of uniclones in embryonic growth plates.
(A) Orientation maps of uniclones from E18.5 distal femur (DF) and proximal tibia (PT) growth plates from two orthogonal viewing angles. Each line in the map represents the orientation of the long axis of an individual clone, whereas line length is proportional to that of the clone long axis (PC1). Clones whose long axis is parallel to the P-D bone axis are in dark blue, whereas and represents orthogonal clones are in magenta. Elevation angles (°) are color-coded as indicated. (B) Graph showing distribution of elevation angles between the long axis of uniclones and P-D bone axis. (C) Orientation maps along the P-D and D-V axes of uniclonal columns (in blue) and clusters (in red) in the DF and PT growth plates. Each line represents the long axis of an individual uniclone, with its length proportional to that of the clonal long axis (PC1). RZ refers to the middles of the resting zone. HZ refers to the end of the hypertrophic zone. (D) Quantification of the percentage of uniclonal columns vs clusters per sample in the DF (n = 1,044 clones) and PT (n = 805 clones) growth plates.
Figure 2—figure supplement 2
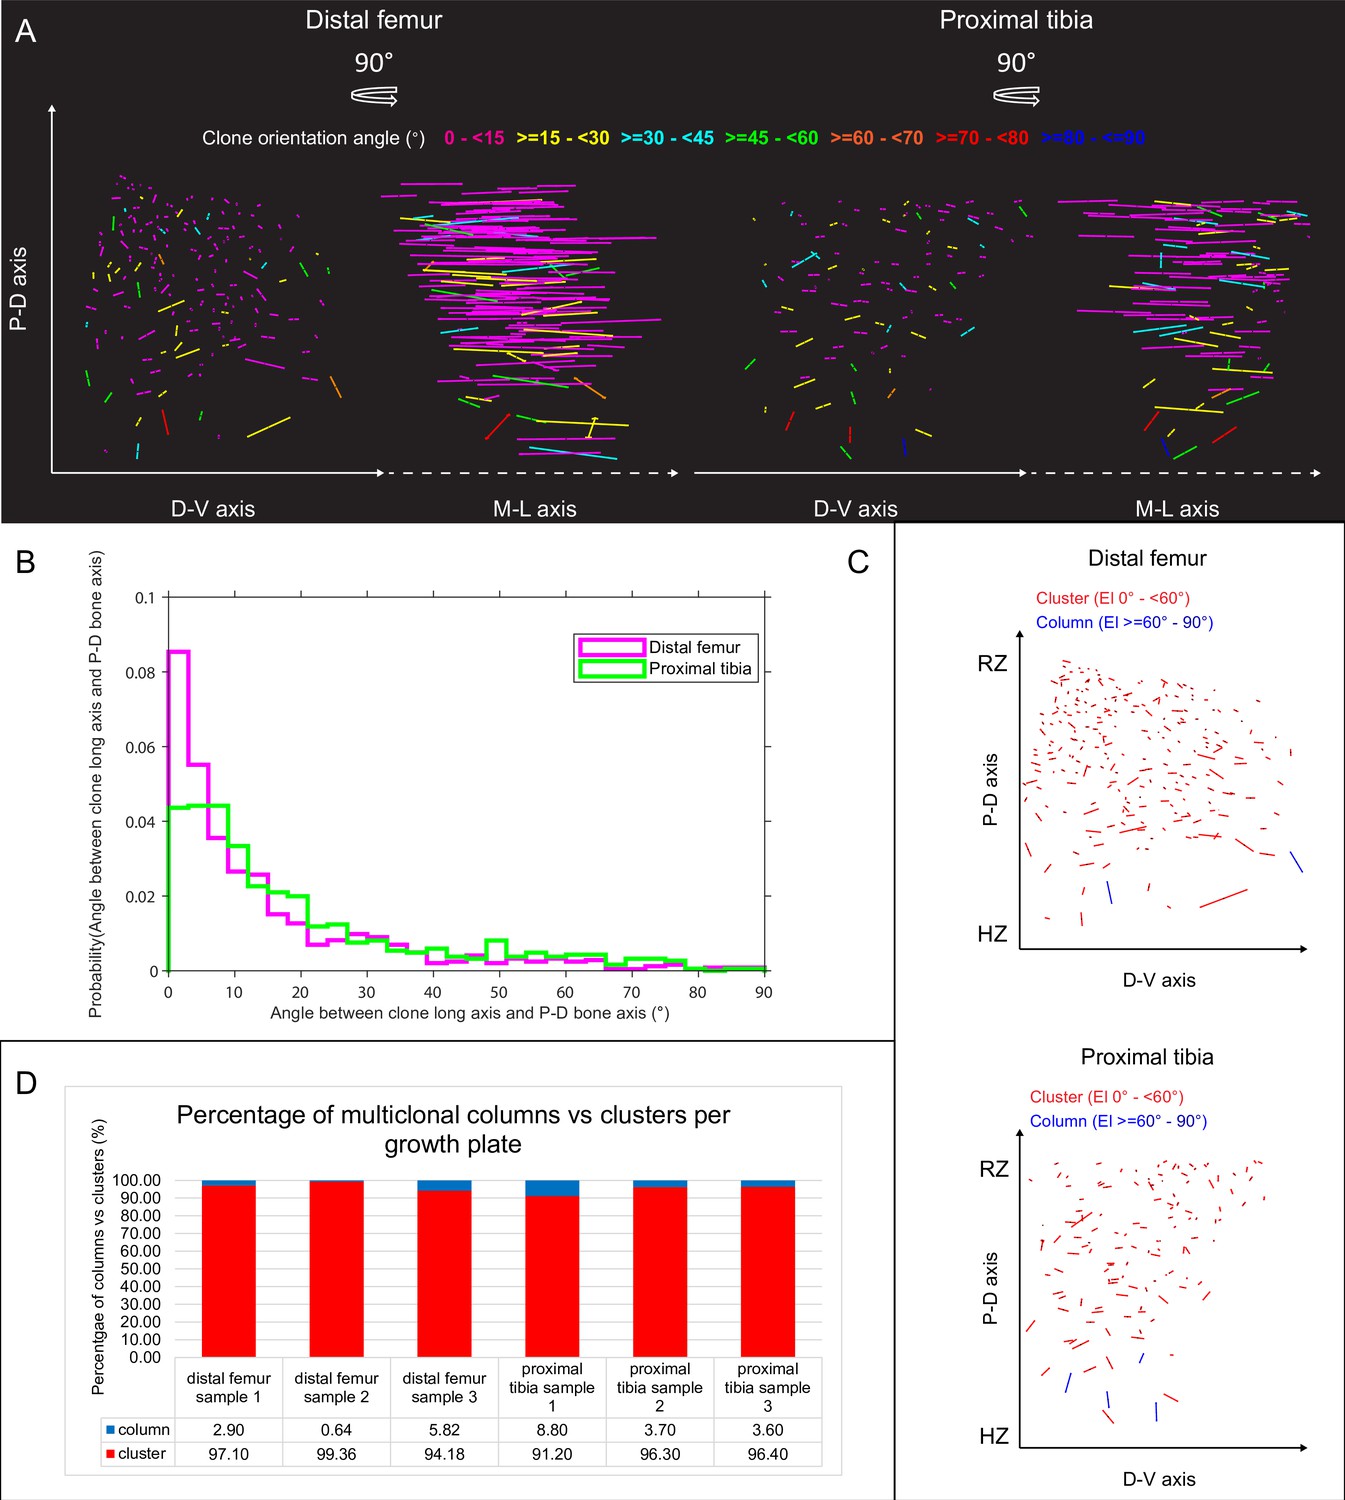
Orientation maps and distribution of multiclones in embryonic growth plates.
(A) Orientation maps of multiclones in E18.5 distal femur (DF) and proximal tibia (PT) growth plates from two orthogonal viewing angles. Each line represents the long axis of an individual clone, with its length proportional to that of the clone long axis (PC1). Multiclones whose long axis is parallel to the P-D bone axis are in dark blue, whereas orthogonal multiclones are in magenta. Elevation angles (°) are color-coded as indicated. (B) Distribution of elevation angles between multiclone long axis and P-D bone axis. (C) Orientation maps along the P-D and D-V axes of multiclonal columns and clusters in the DF and PT growth plates. Each line represents the long axis of an individual multiclone, with its length proportional to that of the clone long axis (PC1). Multiclonal columns (i.e., angle between clonal long axis and P-D bone axis is 60–90°) are in blue, whereas multiclonal clusters (i.e. angle below 60°) are in red. RZ refers to the middles of the resting zone. HZ refers to the end of the hypertrophic zone. (D) Quantification of the percentage of multiclonal columns vs clusters per sample in DF (n = 816 clones) and PT (n = 619 clones) growth plates.
Figure 3
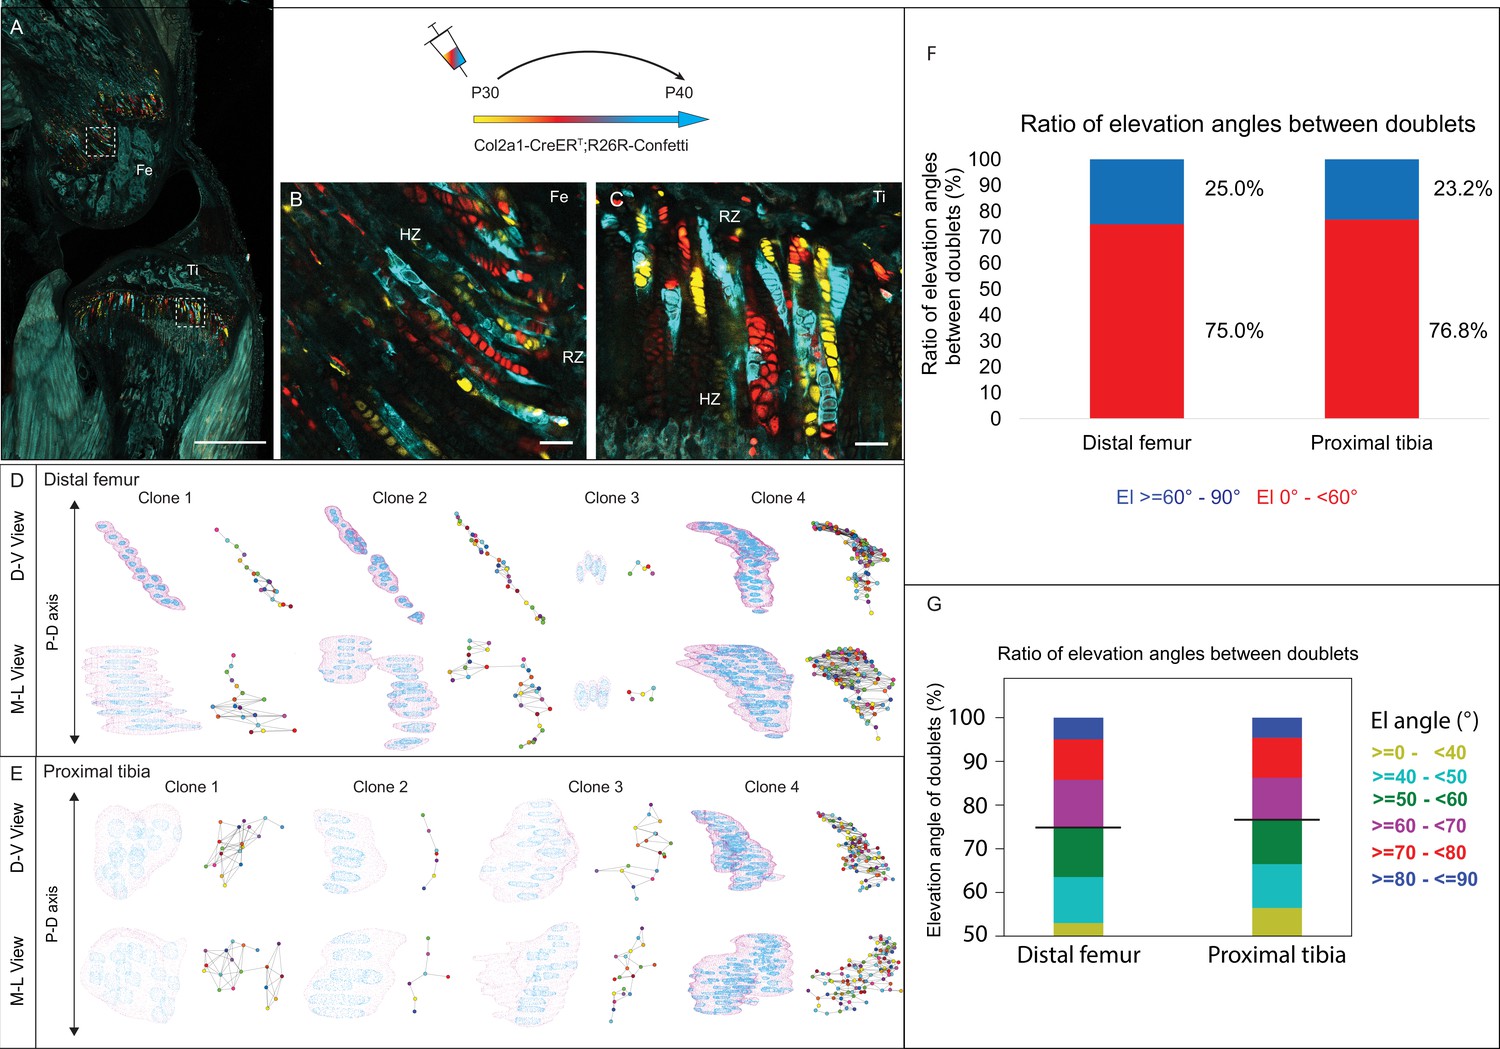
3D imaging of clones in the postnatal growth plate reveals diverse and complex morphologies.
3D morphology of chondrocyte clones was analyzed in the proximal tibia (PT) and distal femur (DF) growth plates of Col2a1-CreERT2:R26R-Confetti mice. Cells were pulsed by tamoxifen administration at P30 and traced until P40. (A) An image of chondrocyte clones in a P40 mouse knee was captured with a combination of multiphoton and confocal imaging using a Leica TCS SP8 confocal laser-scanning/MP microscope. Sparse labeling is observed throughout the growth plate. Scale bar: 1 mm. (B, C) Magnified optical sections of DF and PT clones reveal complex clones that appear to form columns. Scale bars: 50 µm. (D, E) 3D rendering of representative clones along the D-V and M-L axes of the DF and PT growth plates. Clone surface is in magenta and nuclear surfaces in blue. Skeletonized illustrations on the right highlight the complexity of each clone. Nuclear centroids are depicted as a randomly colored circle; lines represent connections with nearest neighbor nuclei. (F, G) Stacked histograms show quantification of elevation angles between cell doublets in clones. (F) Ratio between good rotations (El, 60–90° in blue) and incomplete rotations (El, 0–60°, in red). (G) Distribution of elevation angles (°), color-coded as indicated. Black line marks the 60° cutoff. DF, 1866 clones; PT, 1666 clones. RZ, resting zone; HZ, hypertrophic zone; El, elevation angle.
Figure 4 with 1 supplement
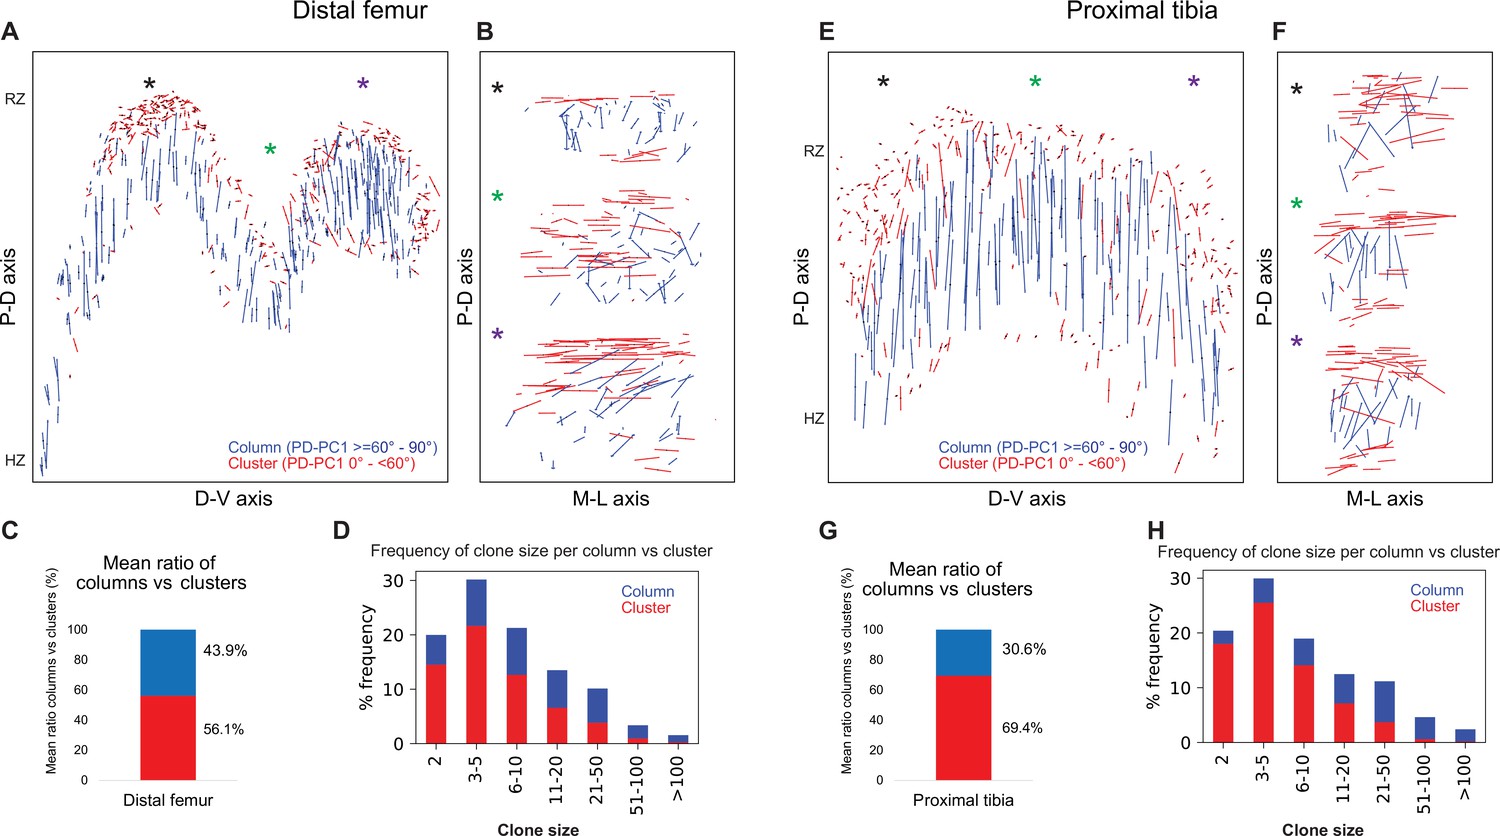
Complex longitudinal clones function as columns in the postnatal growth plate.
Orientation maps of clones in P40 growth plates. (A, B) Clone orientation along the P-D and D-V axes of distal femur (DF) growth plates (n = 737 columns, 1129 clusters). Asterisks indicate the same locations in the growth plate. Each line represents the long axis of an individual clone, with its length proportional to that of the clone long axis. Columns are shown in blue and clusters in red. (C) Quantification of mean ratio of columns vs clusters in the DF growth plates. (D) Frequency of clone size per column (blue) vs cluster (red). (E, F) Clone orientation in the proximal tibia (PT) growth plates (n = 512 columns, 1154 clusters). (G, H) Mean ratio of columns vs clusters and frequency of clone size in PT growth plates. RZ, resting zone; HZ, hypertrophic zone. Three biologically independent samples were examined in nine independent experiments.
Figure 4—figure supplement 1
Clones orientation in the postnatal growth plate.
(A) Orientation maps along the P-D and D-V axes of single clones from distal femur (DF) (n = 1866) and proximal tibia (PT) (n = 1666) growth plates at P40. Each line represents the long axis of an individual clone, with its length proportional to that of the clone long axis. Clones that are parallel to the P-D axis are in dark blue, whereas orthogonal clones are in magenta. Elevation angles (°) are color-coded as indicated. (B) Distribution of elevation angles between the clone long axis and P-D bone axis. (C) Quantification of the percentage of columns vs clusters per sample in DF and PT growth plates.
Figure 5 with 3 supplements
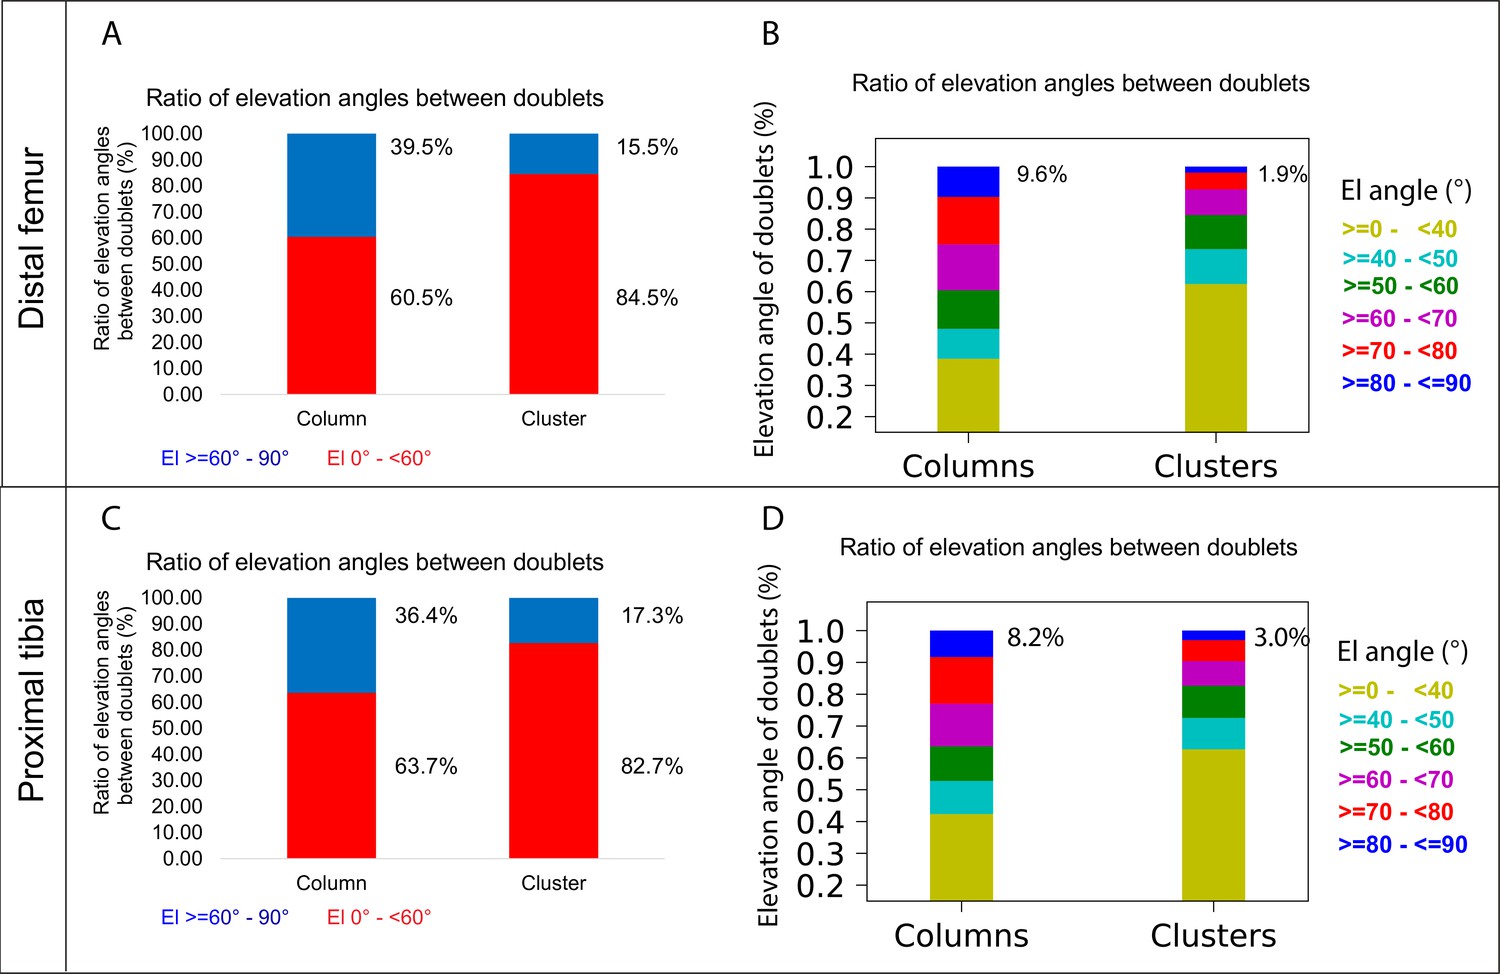
A column can tolerate 60% incomplete rotations.
(A, B) Stacked histograms show the proportion of doublet cells exhibiting complete rotations (i.e., elevation angle [El] of 60–90°, in blue) vs incomplete rotations (El under 60°, in red; A) and distribution of elevation angles in columns vs clusters (B) in P40 distal femur (DF) growth plates (n = 737 columns, 1129 clusters). (C, D) Same analysis in proximal tibia (PT) growth plates (n = 512 columns, 1154 clusters). Elevation angles (°) are color-coded as indicated. but also that bone expansion decreases at a faster rate than bone elongation, resulting in a decrease in the expansion vs elongation (E:E) ratio from embryonic to postnatal stages (Figure 6B and C, Figure 6—figure supplement 1B). Moreover, E:E growth ratio could be associated with the presence of clusters and columns in the growth plates. For example, in the embryonic growth plate, where columns are rare and clusters abundant, the E:E growth ratio was 0.18 in the DF and 0.16 in the PT. By P40, when columns become abundant and clusters are restricted to periphery, E:E ratio dropped to 0 in the DF and 0.04 in the PT. These trends were observed in all the growth plates analyzed. Notably, in some growth plates, such as the proximal fibula and distal tibia, E:E ratios decreased non-monotonically (Figure 6C).
Figure 5—figure supplement 1
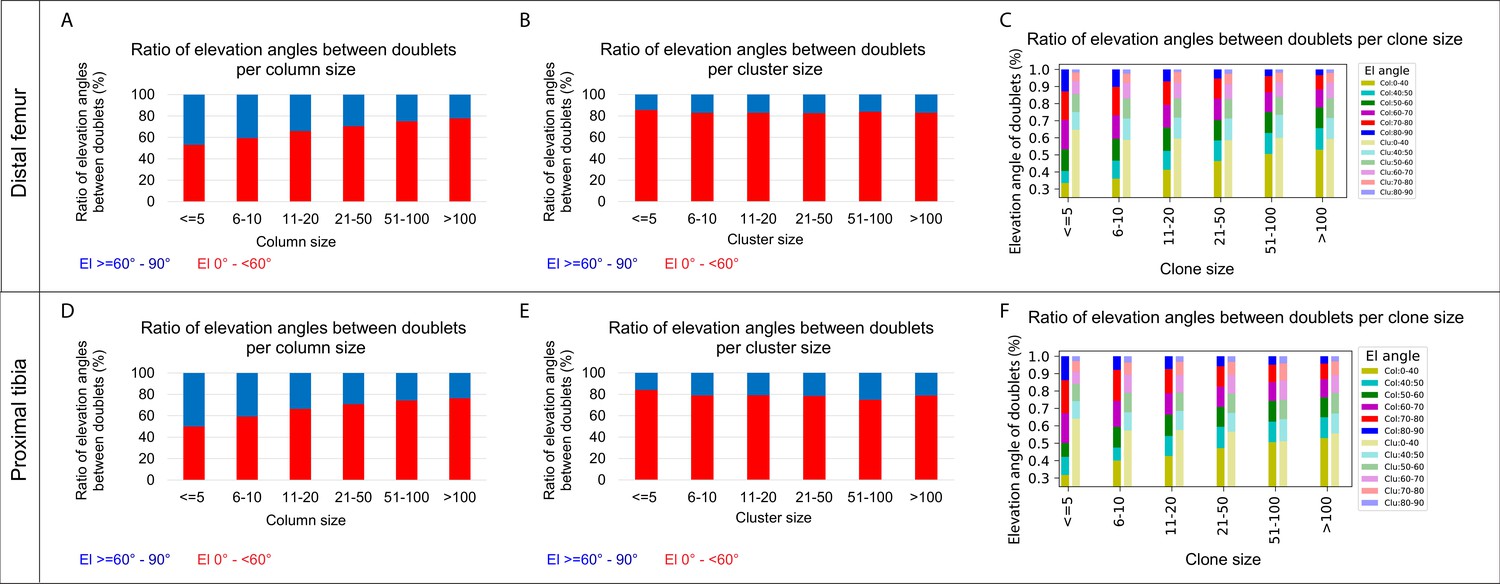
Elevation angles between postnatal doublet cells as a function of clone size.
(A–C) Quantification of elevation angles in cell doublets from P40 distal femur (DF) growth plates (n = 737 columns, 1129 clusters). (A, B) Stacked histogram shows the proportion of doublet cells exhibiting good rotations (i.e., elevation angle of 60–90°, in blue) vs incomplete rotations (El under 60°, in red) in columns (A) and clusters (B) as a function of column or cluster size. (C) Distribution of elevation angles between doublet cells as a function of clone size. (D–F) Analysis of cell doublets in P40 proximal tibia (PT) growth plates (n = 512 columns, 1154 clusters). Elevation angles (°) are color-coded as indicated.
Figure 5—figure supplement 2
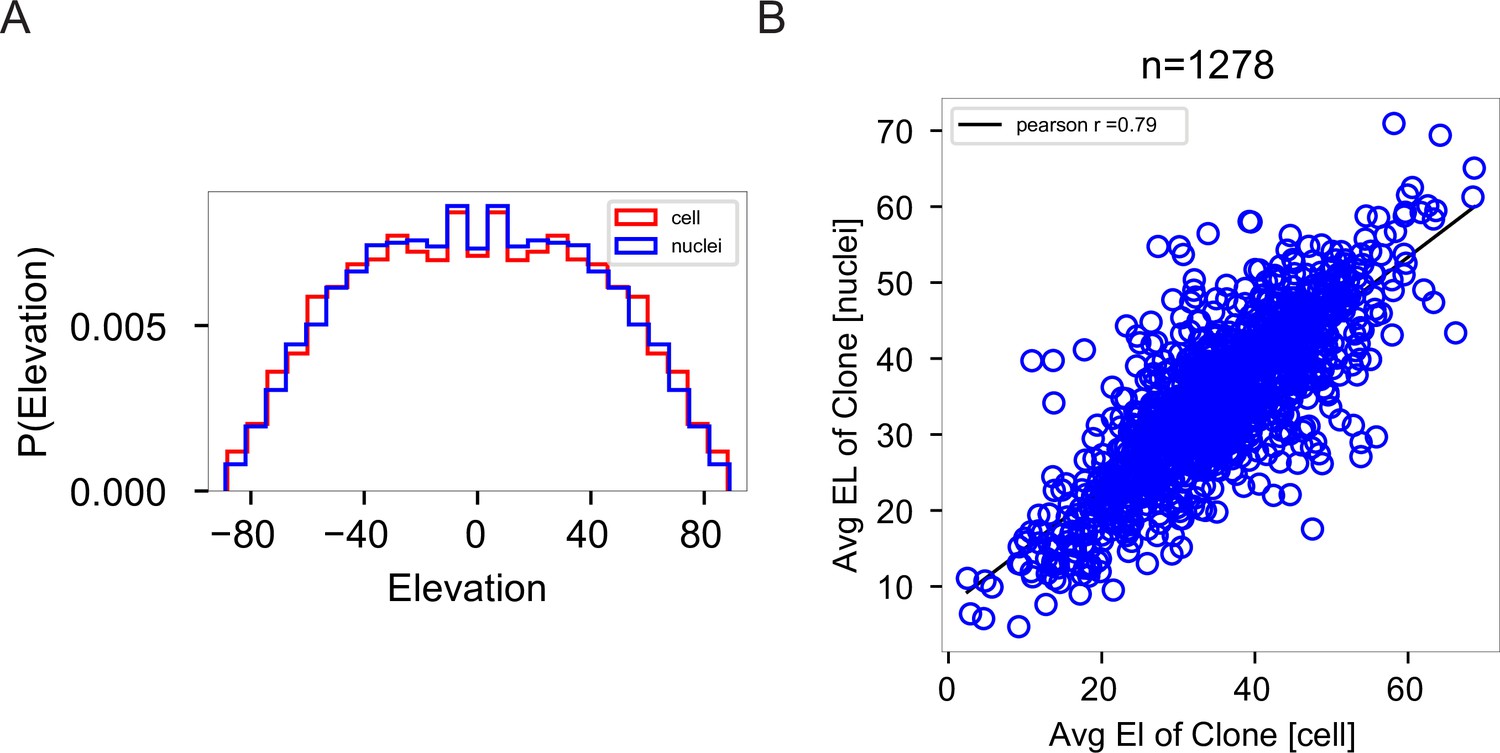
Correlation analysis between cells and nuclei.
(A) Histogram showing the distribution of elevation angles between doublet pairs of cells vs nuclei within a clone is nearly identical. Cells in red. Nuclei in blue. n = 1278 clones. (B) Pearson correlation analysis between cells and nuclei for elevation angle analysis. A Pearson coefficient of 0.79 suggests the nuclei can be used as a proxy for the cells. n = 1278 clones. El: elevation angle.
Figure 5—figure supplement 3
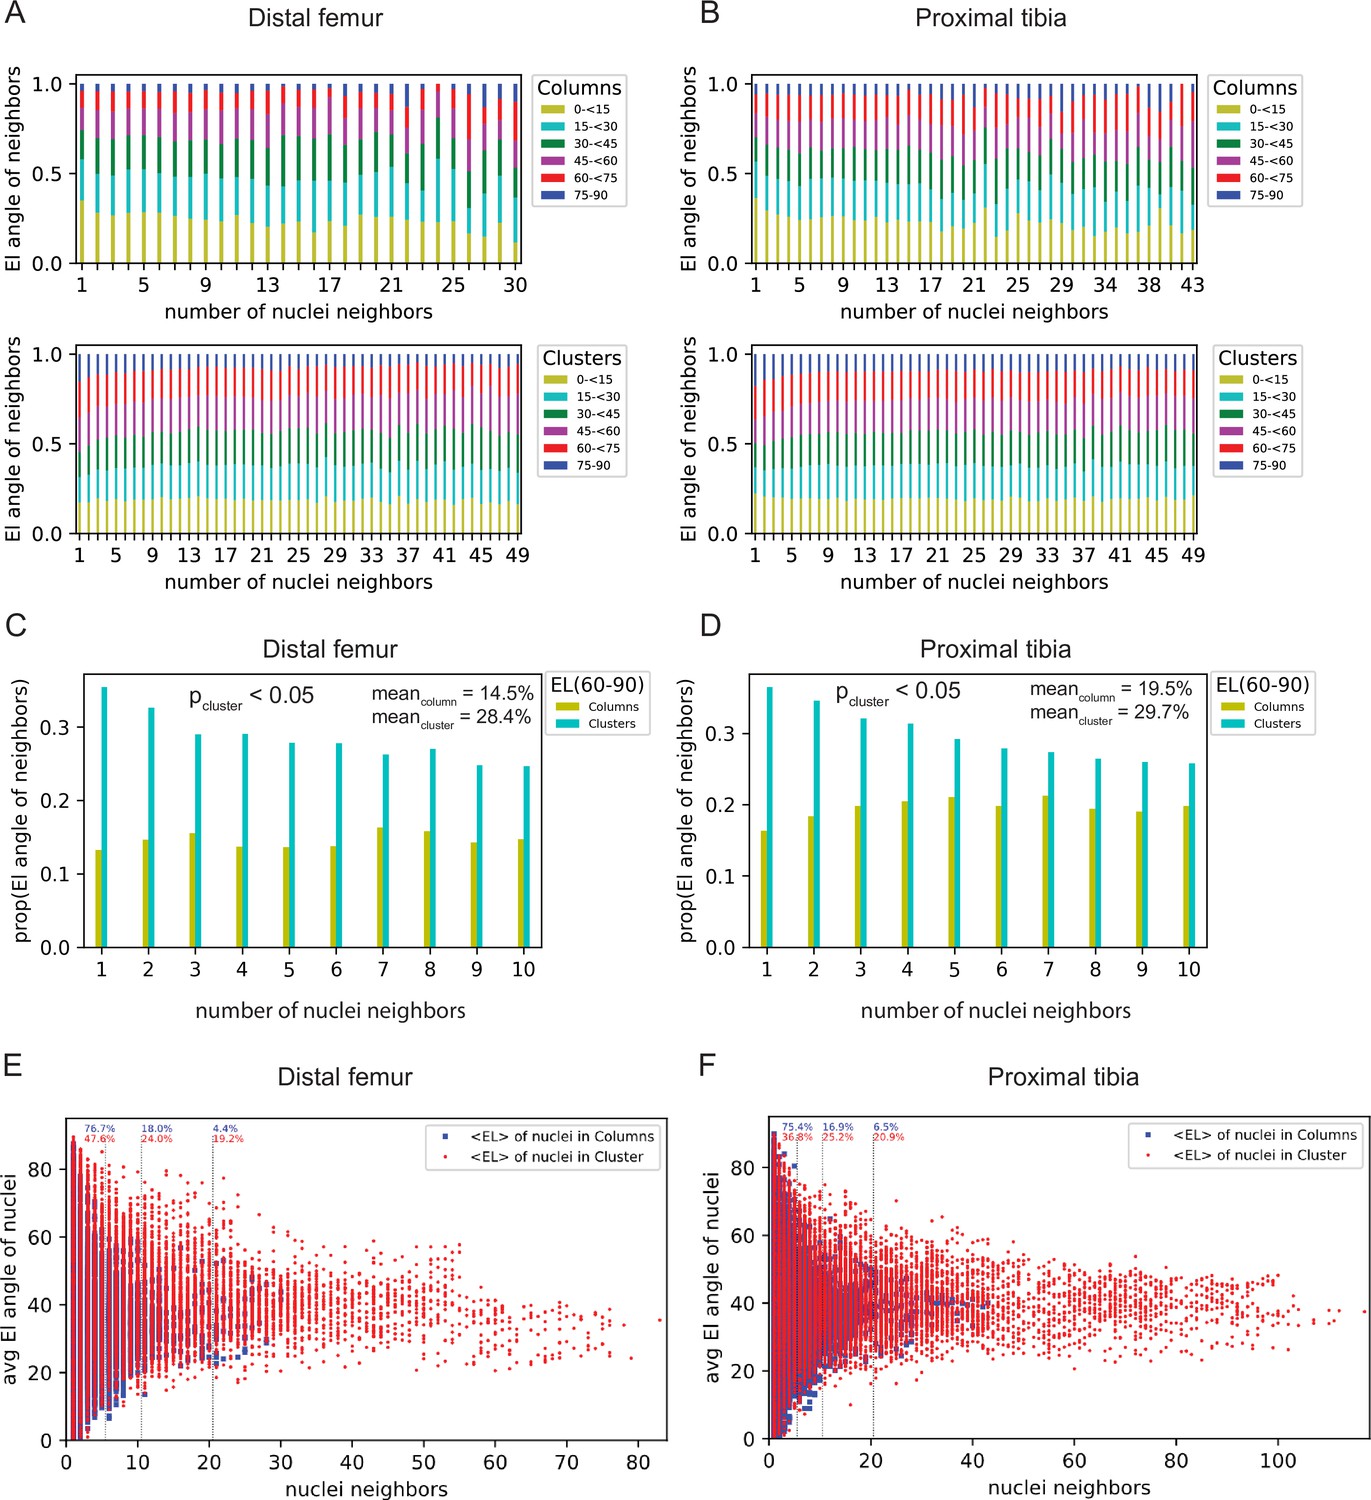
Noise evaluation of doublet analysis.
(A, B) Histogram showing the proportion of elevation angles from 0 to 90° of nuclei per column and per cluster as a function of number of nuclei neighbors. (C, D) Histogram showing the proportion of elevation angles from 60 to 90° of nuclei per column and per cluster as a function of number of nuclei neighbors. While examination of the influence of increasing nuclei neighbors on the proportion of elevation angles between 60 and 90° did not show any statistical significance in columns, we found clusters to show statistical significance (p-value<0.05, two-sample t-test) when comparing the mean of lower number of neighbors (Lecuit and Lenne, 2007; Irvine and Wieschaus, 1994; Bailles et al., 2022; Collinet and Lecuit, 2021; Sutherland et al., 2020) with larger numbers of nuclei neighbors (Sutherland et al., 2020; Rubin et al., 2021; Breur et al., 1991; Wilsman et al., 2008; Wilsman et al., 1996) for both the distal femur (DF) and proximal tibia (PT). DF, Meancolumn = 14.5% Meancluster = 28.4%; PT, Meancolumn = 19.5% Meancluster = 29.7%. (E, F) Histogram showing the distribution of mean elevation angle as a function of number of nuclei neighbors. Nuclei within columns in blue. Nuclei within clusters in red. DF column nuclei (n = 4872), DF cluster nuclei (n = 19,121), PT column nuclei (n = 6856), and PT cluster nuclei (n = 18,967). Dashed lines indicate the percentage of the population which falls under nuclei neighbor cutoffs of ≤ 5, ≤10, and ≤20 neighbors, respectively. El: elevation angle.
Figure 6 with 1 supplement
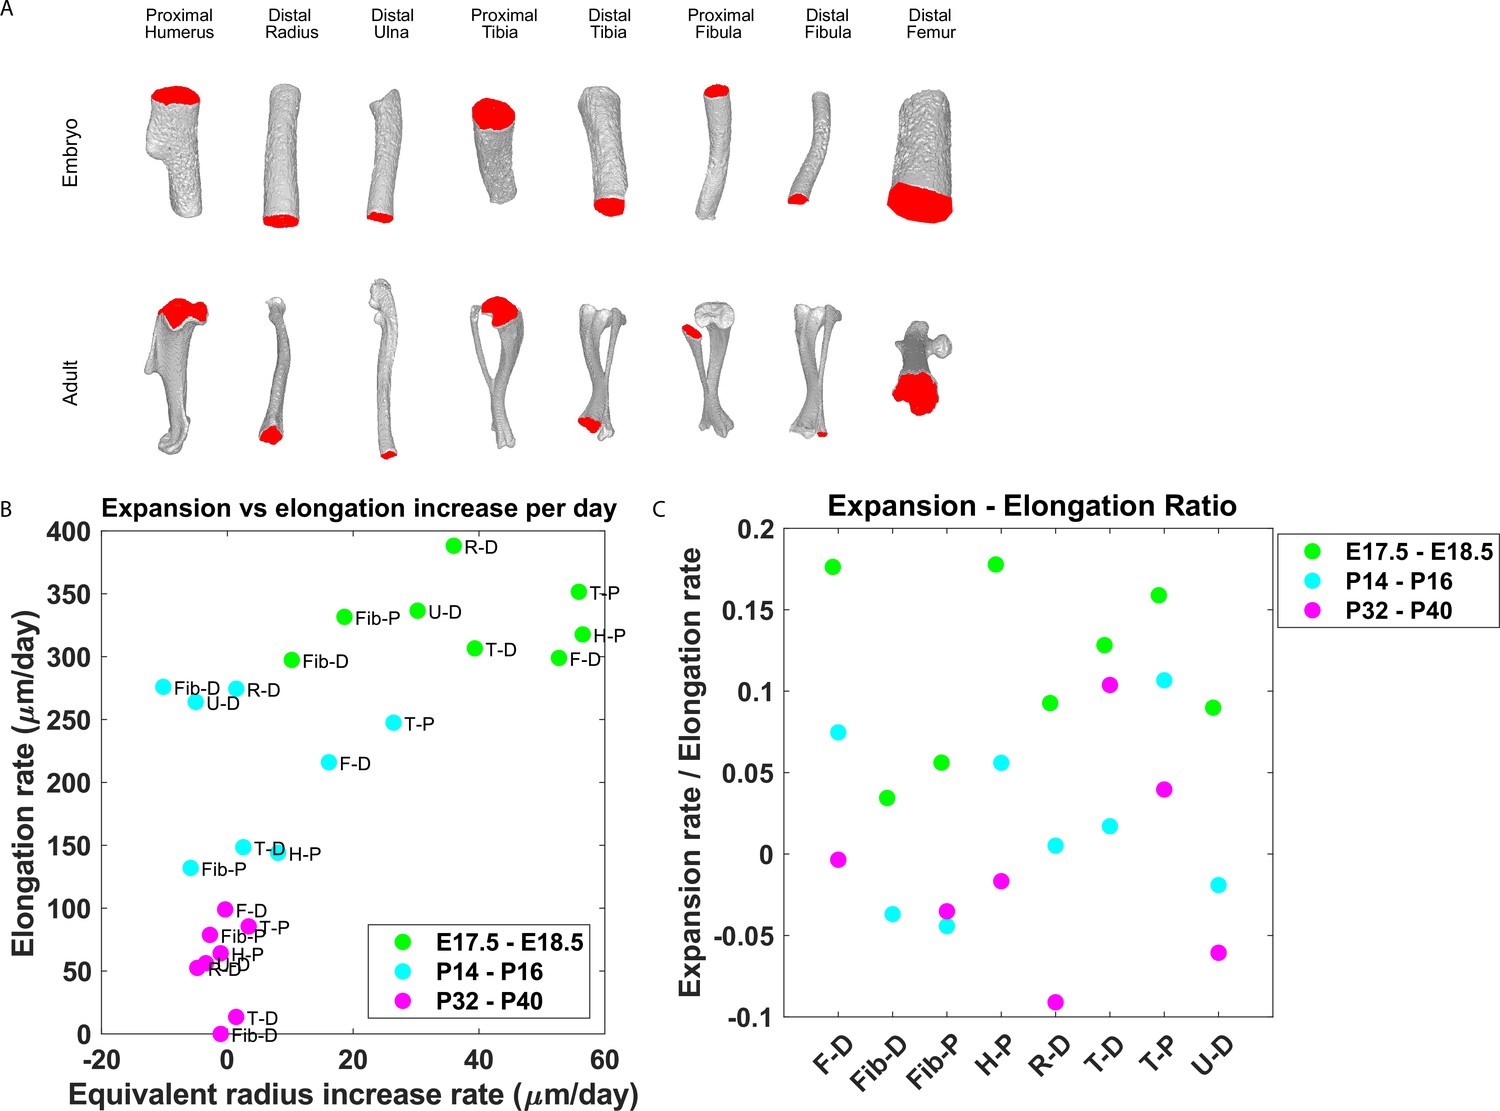
Growth plate expansion vs elongation ratio decreases as the bone grows.
(A) Isosurface renderings of embryonic and postnatal long bones with their chondro-osseous junction (COJ) highlighted in red. Distal femur, distal and proximal fibula, proximal humerus, distal radius, proximal and distal tibia, and distal ulna were analyzed. (B) The elongation rate was plotted against the equivalent radius increase rate in micrometers per day for three time windows; E17.5-E18.5 (green), P14-P16 (cyan), and P32-P40 (magenta). Growth plates from each time window clustered together. As bones develop, circumferential expansion is minuscule in comparison to elongation. (C) The expansion vs elongation (E:E) ratio, which was plotted for all growth plates and time windows, decreases as bones develop. Interestingly, in the proximal fibula and distal tibia, the decrease was non-monotonic.
-
Figure 6—source data 1
Distance from longitudinal origin and equivalent radius per growth plate from E17.5 - P40.
- https://cdn.elifesciences.org/articles/95289/elife-95289-fig6-data1-v3.xlsx
Figure 6—figure supplement 1
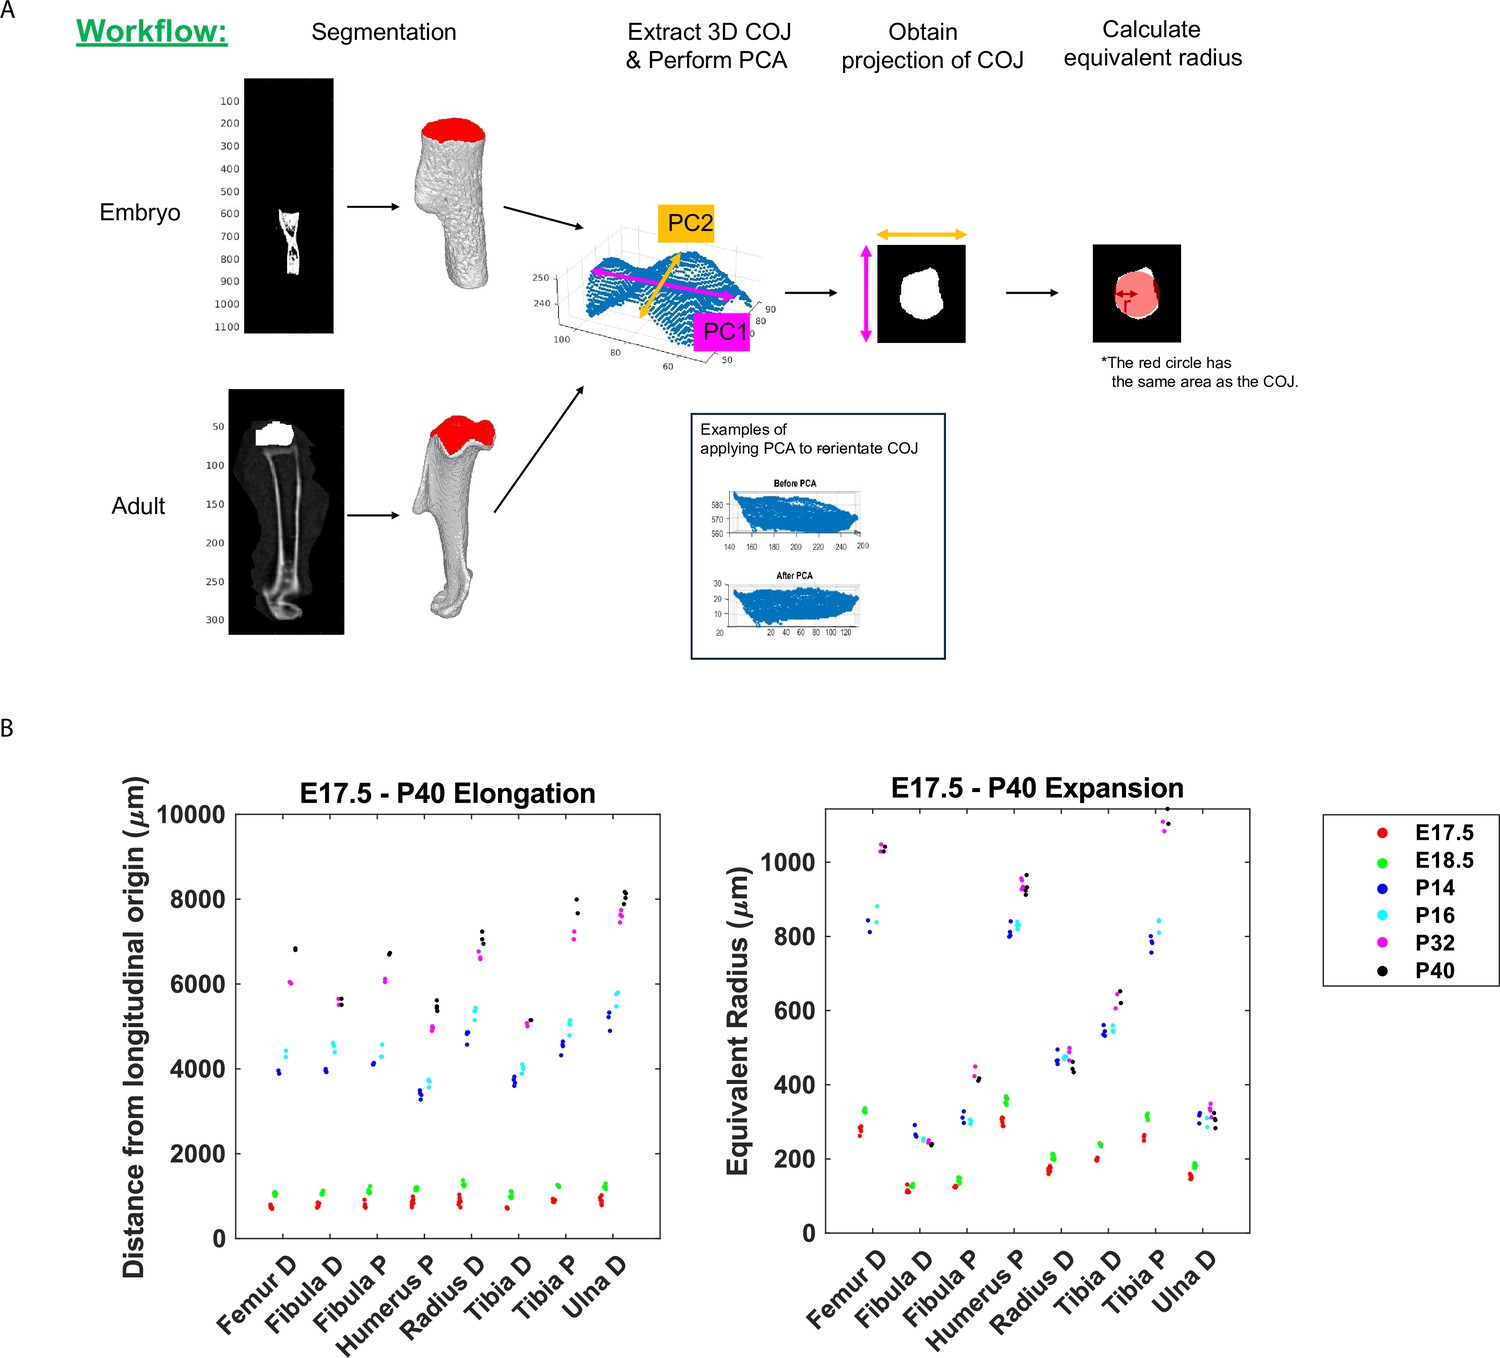
Schematic of calculating bone expansion based on micro-CT images and raw data measurements of distance from longitudinal origin and equivalent radius.
(A) Workflow describing how growth plate expansion was calculated using equivalent radius calculations of chondro-osseous junctions. (B) Raw data showing bone and elongation and bone expansion from the growth plates of different long bones from E17.5–P40. P; proximal, D; distal.
Figure 7

Model for the multifunctional design of the growth plate and its relation to bone growth.
(A) During oriented cell division in the growth plate, the division plane rotation can range from 0° to 90° (brown–blue). Less than 60° rotation indicates an incomplete rotation (red), whereas rotations greater than 60° indicate a complete rotation (dark blue). (B) In the embryo, higher rates of incomplete rotations result in cluster formation, which may support the expansion of the growing bone. Postnatally, complete rotations are more frequent, allowing columns to form. This supports bone elongation while potentially limiting bone expansion.
Author response image 1

48-hour labeling shows small clones that do not appear column-like.
3D morphology of chondrocyte clones was analyzed in the proximal tibia growth plate of Col2a1CreERT2:R26R-Confetti mice. (A) Cells were pulsed by tamoxifen administration at E15.5 and traced until E17.5. (B) Optical section through the growth plate shows sparse labeling throughout the PZ, PHZ, and HZ. (C) Zoomed-in optical PZ section shows small clones, some of which expand laterally. (D) 3D rendering of yfp, rfp, and cfp clones in the growth plate overlaid with nuclei in grey shows that most clones are single cells or doublets. (E) Highlight of two cfp clones from the PZ and PHZ. (F) Same region shown in D is rotated along the P-D axis. (G) Same region shown in in E shows that the clone long axis orients perpendicular to the P-D bone axis. Scale bars: B 100 µm, C 50 µm, D 70 µm, E 70 µm, F 70 µm, G 70 µm..
Author response image 2

PC1 vectors overlaid on clones.
Three orthogonal viewing angles (XZ, YZ, XY) of PC1 vectors marked by black arrow overlaid on four clones from embryonic (a-d) and postnatal (e-h) growth plates. a,b,e,f are clusters, whereas c,d,g,h are columns. Z-axis represents the P-D bone axis. Clone masks representing cell cytoplasm are in magenta, nuclei are in cyan.
Author response image 3

Column frequency per clone size.
Frequency of columns and clusters as a function of clone size in embryonic (A,B) and postnatal growth plates (C,D). When comparing clones of the same size, columns are more frequent postnatally.
Tables
Key resources table
| Reagent type (species) or resource | Designation | Source or reference | Identifiers | Additional information |
|---|---|---|---|---|
| Strain, strain background (mouse) | Col2-CreERT | Jackson Laboratories | RRID:IMSR_JAX:006774 | |
| Strain, strain background (mouse) | R26R-Confetti | Jackson Laboratories | RRID:IMSR_JAX:017492 | |
| Sequence-based reagent | Col2CreER-F | Jackson Laboratories | PCR primers (stock # 006774) | CAC TGC GGG CTC TAC TTC AT |
| Sequence-based reagent | Col2CreER-R | Jackson Laboratories | PCR primers (stock # 006774) | ACC AGC AGC ACT TTT GGA AG |
| Sequence-based reagent | Confetti-mutant Forward | Jackson Laboratories | PCR primers (stock # 017492) | GAA TTA ATT CCG GTA TAA CTT CG |
| Sequence-based reagent | Confetti-WT Forward | Jackson Laboratories | PCR primers (stock # 017492) | AAA GTC GCT CTG AGT TGT TAT |
| Sequence-based reagent | Confetti-common | Jackson Laboratories | PCR primers (stock # 017492) | CCA GAT GAC TAC CTA TCC TC |
| Chemical compound, drug | Tamoxifen | Sigma-Aldrich | T-5648 | |
| Other | Draq5 | Thermo Scientific | 62252 | 1:2000 for embryonic samples and 1:1500 for postnatal samples |
Additional files
-
Supplementary file 1
Mean and std for bone elongation and expansion measurements.
- https://cdn.elifesciences.org/articles/95289/elife-95289-supp1-v3.docx
-
MDAR checklist
- https://cdn.elifesciences.org/articles/95289/elife-95289-mdarchecklist1-v3.pdf
Download links
A two-part list of links to download the article, or parts of the article, in various formats.
Downloads (link to download the article as PDF)
Open citations (links to open the citations from this article in various online reference manager services)
Cite this article (links to download the citations from this article in formats compatible with various reference manager tools)
Limited column formation in the embryonic growth plate implies divergent growth mechanisms during pre- and postnatal bone development
eLife 13:e95289.
https://doi.org/10.7554/eLife.95289


