Allosteric coupling asymmetry mediates paradoxical activation of BRAF by type II inhibitors
- Department of Pharmacology, University of Minnesota, United States
- Department of Biochemistry, Molecular Biology, and Biophysics, University of Minnesota, United States
- Department of Chemistry, University of Minnesota, United States
- Center for Immunology, University of Minnesota, United States
- Masonic Cancer Center, University of Minnesota, United States
Figures
Figure 1 with 11 supplements
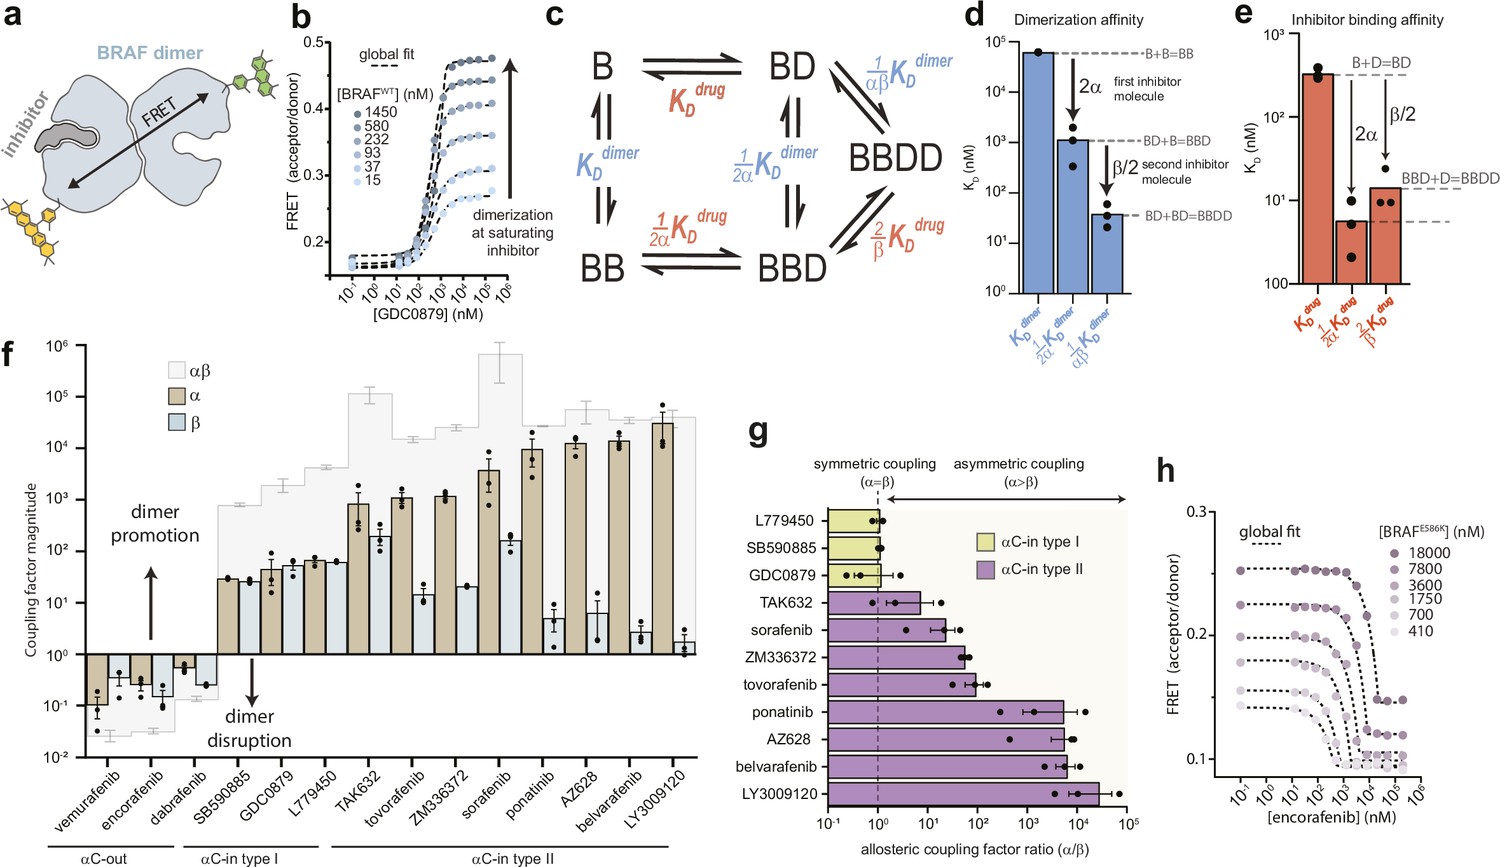
Type II αC-in inhibitors drive BRAF dimerization through asymmetric allosteric coupling.
(a) Schematic of the intermolecular FRET sensor used to quantify BRAF dimerization. A detailed structrual model of the FRET sensor is shown in Figure 1—figure supplement 1. (b) Representative intermolecular FRET experiments measuring BRAF dimerization by type I αC-in inhibitor GDC0879 as a function of BRAF concentration. Dashed lines represent the global fit of these data to the model shown in panel c. Data for all αC-in inhibitors are shown in Figure 1—figure supplement 3. (c) Model of inhibitor-induced BRAF dimerization used for the global fitting of FRET data in panel b. B represents apo/unbound BRAF monomer, BD drug/inhibitor-bound monomer, BB apo/unbound dimer, BBD dimeric BRAF with one bound inhibitor molecule, and BBDD dimeric BRAF with two inhibitor molecules bound. These biochemical species are linked by the equilibrium dissociation constants described in the main text and methods. (d, e) Equilibrium dissociation constants for dimerization (panel d) and inhibitor binding (panel e) determined from global fitting analysis of the GDC0879 experiments shown in panel b. Allosteric coupling factors α and β describe the coupling of BRAF dimerization to the first and second inhibitor binding events, respectively (see Materials and methods), and are similar in magnitude for this type I inhibitor. Dissociation constants for all inhibitors are shown in Figure 1—figure supplements 5 and 6 . (f) Allosteric coupling factors α and β, as well as their product αβ, are shown for all RAF inhibitors examined. Error bars represent the mean ± s.e.m.; n≥3 independent experiments, each performed in duplicate. (g) Plots of the allosteric coupling factor ratio α/β for all αC-in inhibitors. (h) Representative intermolecular FRET experiments measuring disruption of BRAFE586K dimerization by the αC-out inhibitor encorafenib at increasing BRAF concentrations. Dashed lines represent the global fit to the thermodynamic model shown in panel c.
-
Figure 1—source data 1
Tabulated source data for Figure 1.
- https://cdn.elifesciences.org/articles/95481/elife-95481-fig1-data1-v1.zip
Figure 1—figure supplement 1
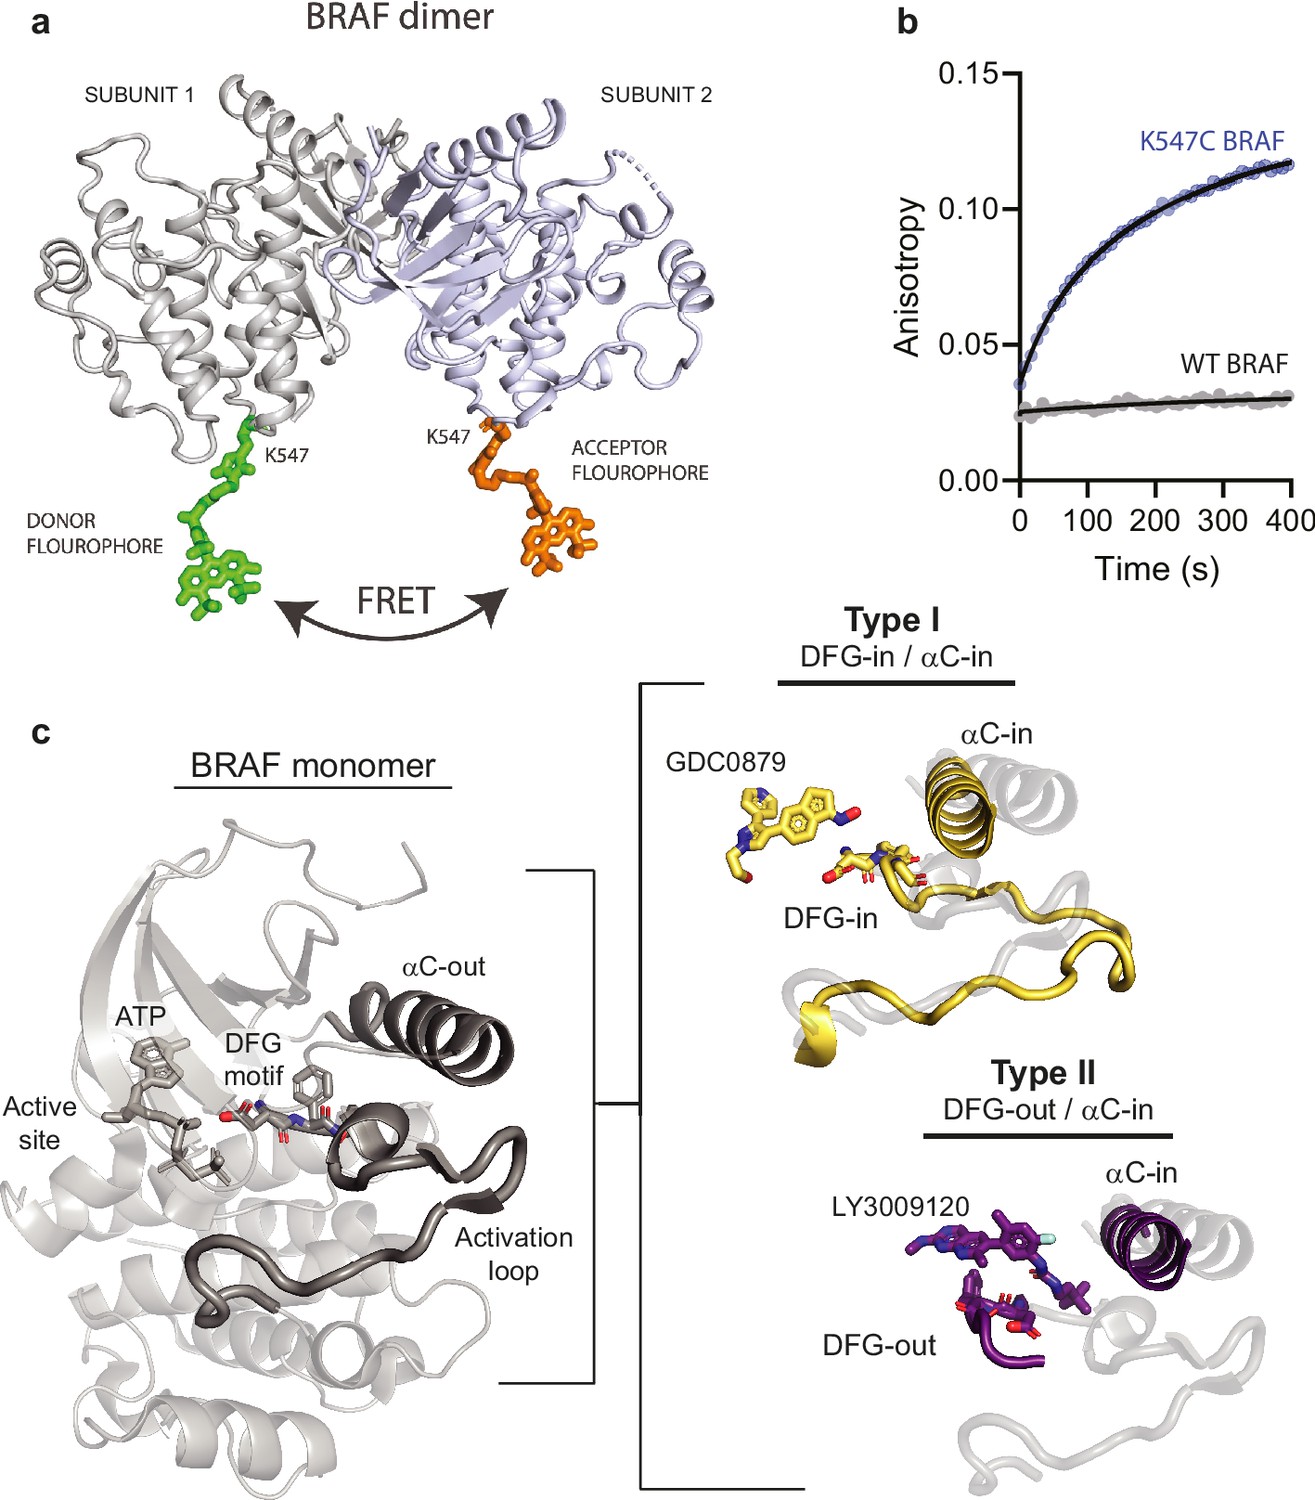
X-ray structures showing the BRAF dimer labeled with fluorophores and structural features of type I and type II inhibitor binding modes.
(a) X-ray structure (PDB: 5C9C) showing the BRAF dimer covalently labeled at K547 with Alexa Fluor 488 C5 maleimide using mtsslSuite (http://www.mtsslsuite.isb.ukbonn.de/). (b) Stopped flow fluorescence anisotropy data showing labeling of BRAF WT and K547C with Alexa 488. (c) X-ray structure of the inactive BRAF monomer (PDB ID: 6PP9) highlighting (dark gray) key regulatory features of the kinase domain including the DFG-motif, αC-helix, and activation loop. The structural differences that distinguish type I (yellow) and type II (purple) inhibitors are highlighted and overlaid with the structure of the autoinhibited BRAF monomer (light gray) (PDB IDs: 4MNE, 5C9C).
-
Figure 1—figure supplement 1—source data 1
Tabulated source data.
- https://cdn.elifesciences.org/articles/95481/elife-95481-fig1-figsupp1-data1-v1.zip
Figure 1—figure supplement 2
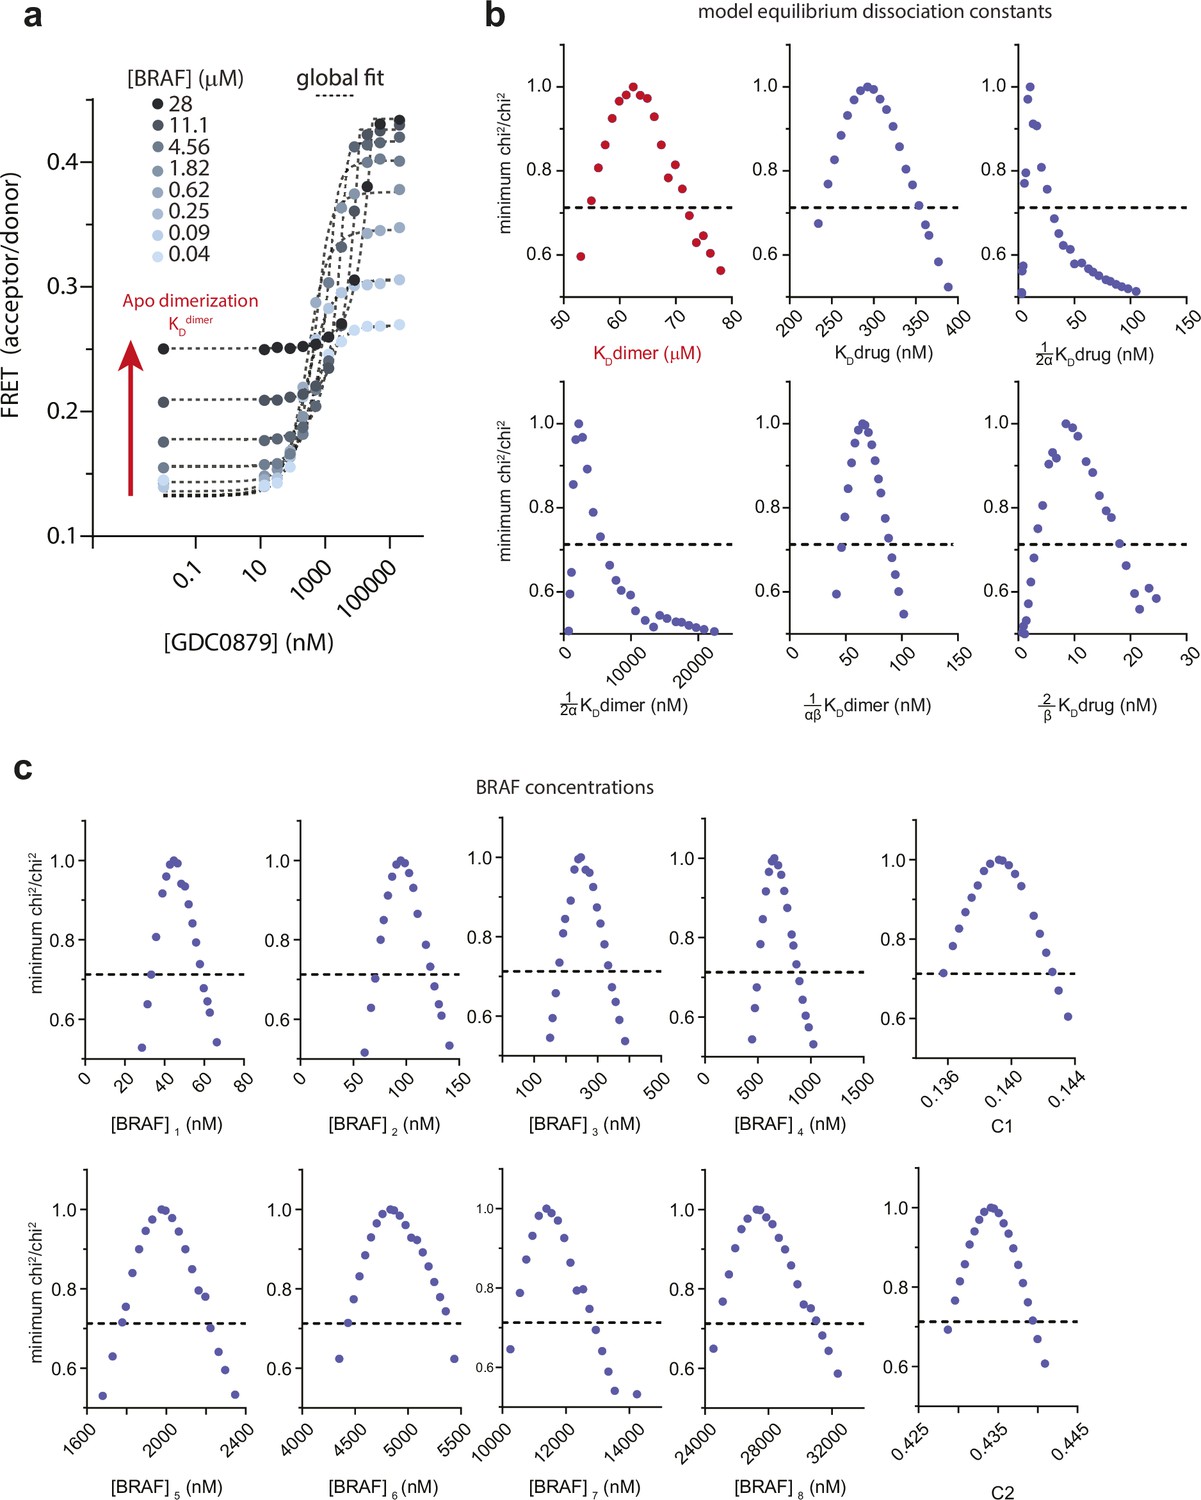
Quantifying apo BRAF dimerization affinity (KDdimer) and dimer induction by GDC0879.
(a) Intermolecular FRET experiments tracking BRAF dimerization as a function of GDC0879 concentration were carried out at high BRAF concentrations in order to define the relatively weak apo BRAF dimerization affinity. Black dotted lines represent a global fit to the thermodynamic model shown in Figure 1c (see Materials and methods). The red arrow highlights apo BRAF dimerization (KDdimer) occurring with no inhibitor. (b, c) Representative one-dimensional error surface analysis of the global fit parameters for the FRET data shown in panel a, including equilibrium dissociation constants (b) and BRAF concentrations and fluorescence coefficients (c). The black dotted line represents the chi2 threshold used to establish 95% CIs for each parameter (see Materials and methods). Note that all parameters shown are well constrained within this limit as indicated by their intersection with the chi2 threshold boundary.
-
Figure 1—figure supplement 2—source data 1
Tabulated source data.
- https://cdn.elifesciences.org/articles/95481/elife-95481-fig1-figsupp2-data1-v1.zip
Figure 1—figure supplement 3
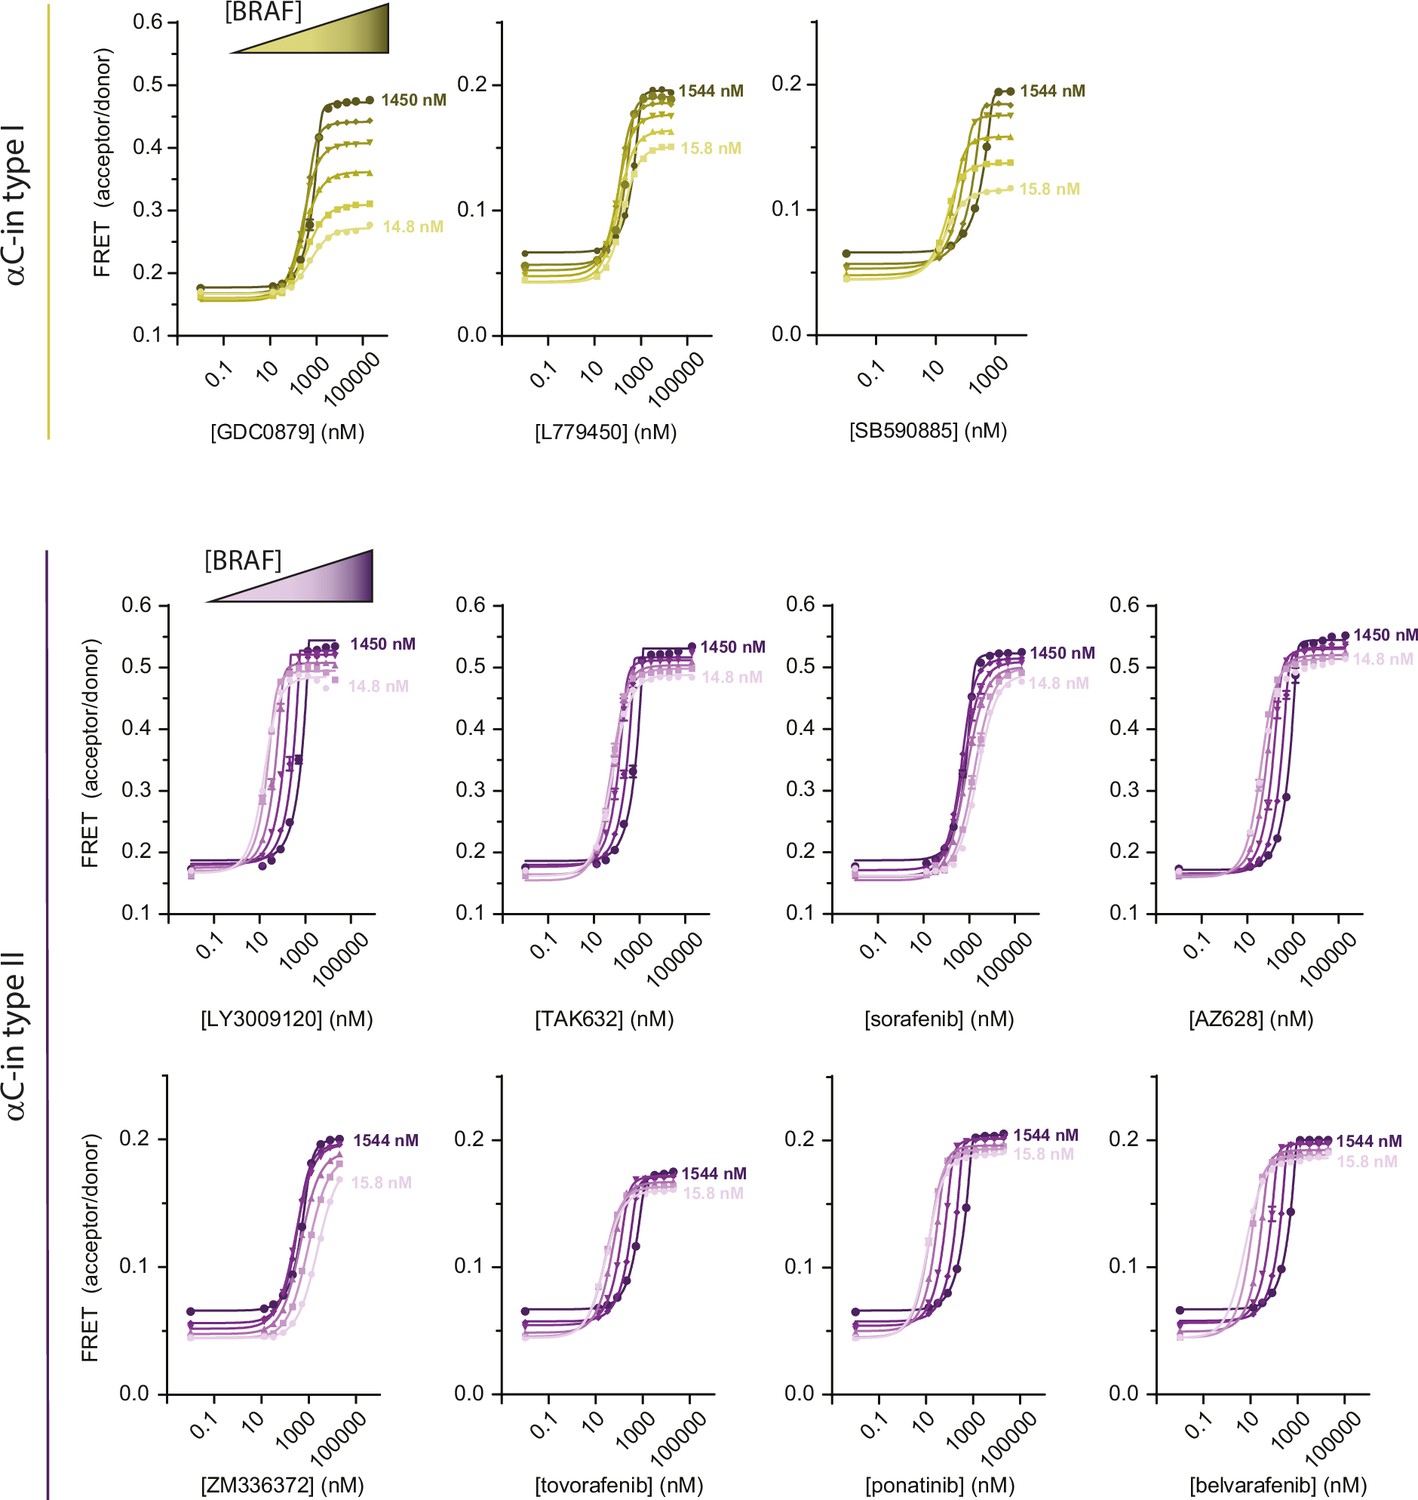
Intermolecular FRET experiments measuring inhibitor-induced BRAF dimerization.
Representative data for all αC-in inhibitors showing BRAF dimerization for type I (yellow) and type II (purple) inhibitors. Gradients from light to dark represent experiments done at increasing BRAF concentrations. Lines are fits of individual titrations to a quadratic binding model in GraphPad Prism and are for illustrative purposes only; all data were globally fit to the thermodynamic model shown in Figure 1c.
-
Figure 1—figure supplement 3—source data 1
Tabulated source data.
- https://cdn.elifesciences.org/articles/95481/elife-95481-fig1-figsupp3-data1-v1.zip
Figure 1—figure supplement 4
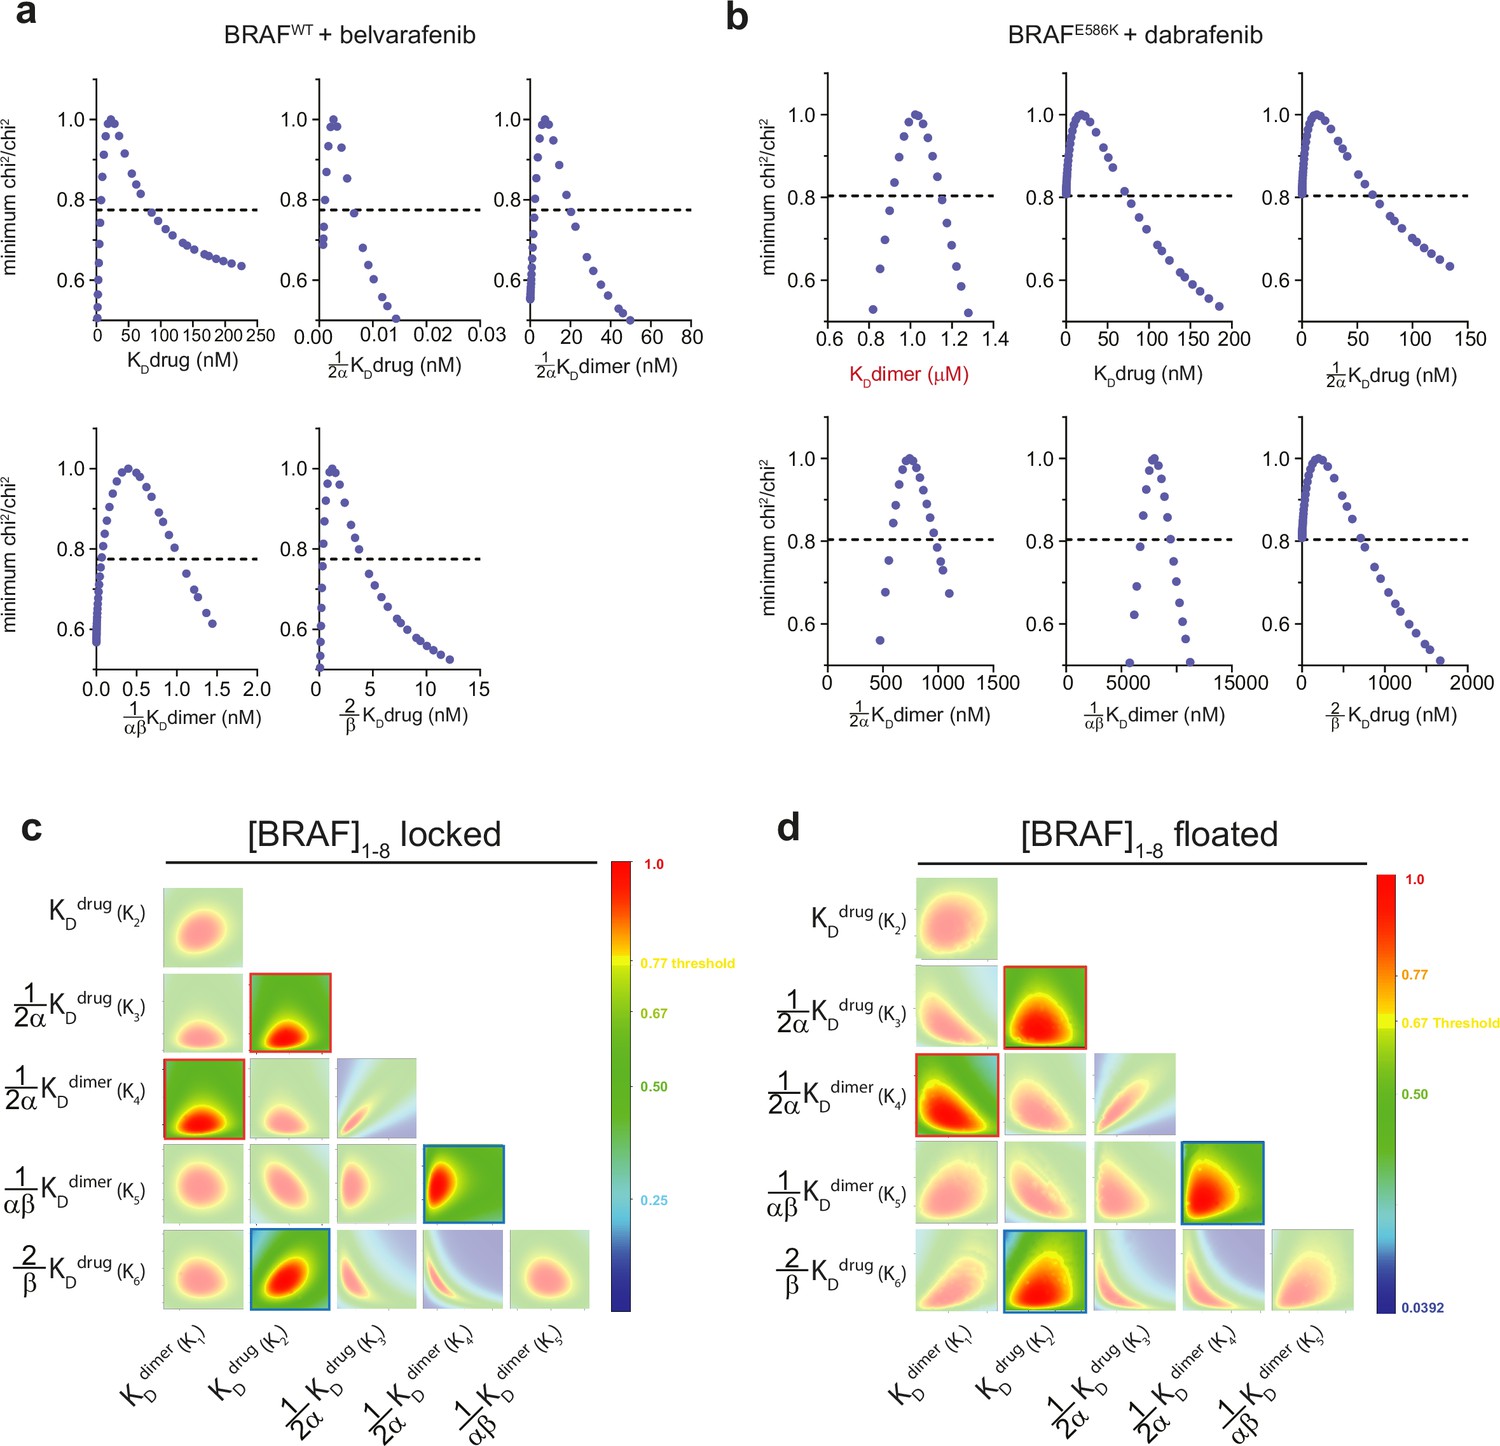
One- and two-dimensional error surfaces show that global fitting yields well-constrained parameters for the allosteric model.
Representative one-dimensional error surface analyses of the global fit parameters from FRET experiments with the αC-in type II inhibitor belvarafenib (a) and the αC-out inhibitor dabrafenib (b). The black dotted line represents the chi2 threshold used to establish 95% CIs for each parameter (see Materials and methods). Note that all parameters shown are well constrained within this limit as indicated by their intersection with the chi² threshold boundary. (c, d) Representative two-dimensional confidence contour analyses of the GDC0879 experiment shown in Figure 1—figure supplement 2a, performed either with BRAF concentrations locked to their experimentally determined values (c) or allowed to float during fitting (d). All pairwise combinations of unconstrained parameters were systematically varied to test for the presence of well-defined chi² minima and examine covariance between parameters. The color bar shows the chi² ratio with red representing the overall best-fit and yellow representing the chi² threshold boundary for 95% CIs. This analysis shows that all equilibrium constants as well as the allosteric coupling factors α and β, defined by the ratios of specific equilibrium dissociation constants (highlighted boxes, see Materials and methods), are well constrained in both fitting procedures.
-
Figure 1—figure supplement 4—source data 1
Tabulated source data.
- https://cdn.elifesciences.org/articles/95481/elife-95481-fig1-figsupp4-data1-v1.zip
Figure 1—figure supplement 5
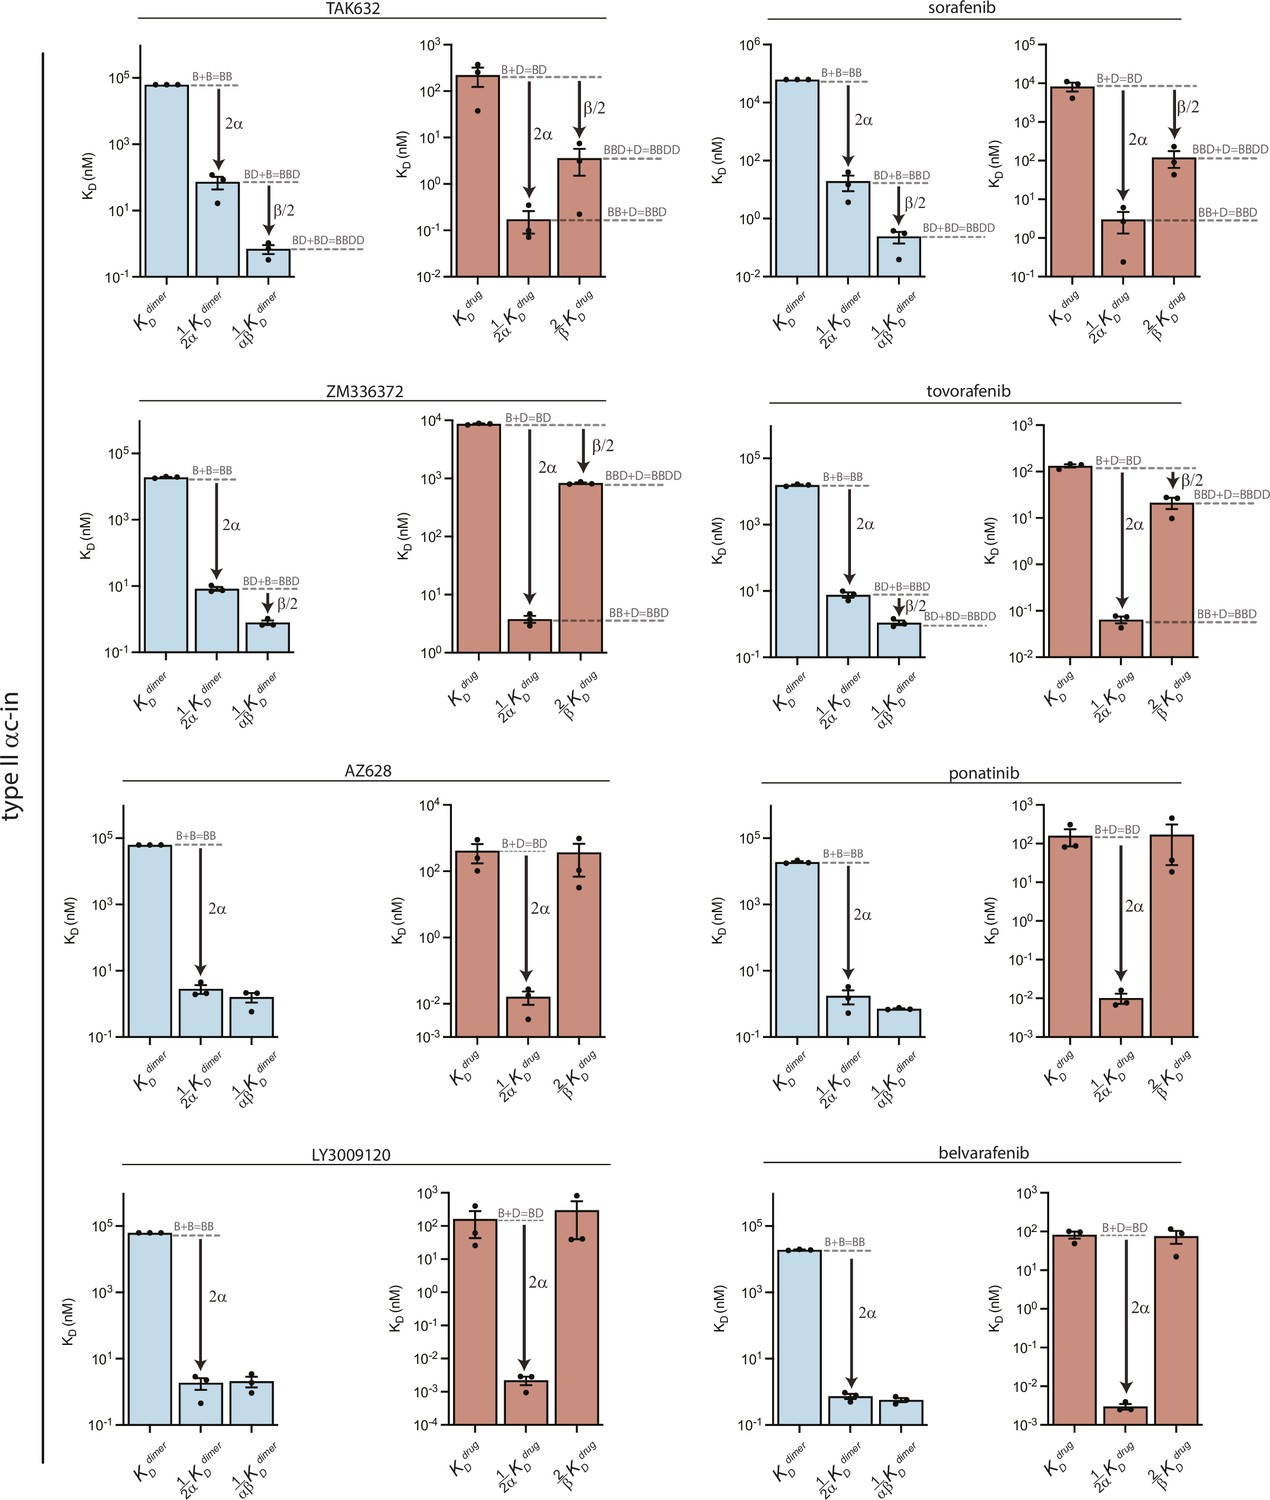
Equilibrium dissociation constants derived from global fitting of FRET data for all type II inhibitors.
Dissociation constants for BRAF dimerization (blue) and inhibitor binding affinity (red) derived from the global fitting analysis of the FRET dimerization data. Allosteric coupling factors α and β describe the coupling of the first and second inhibitor binding events to BRAF dimerization, respectively (see Materials and methods). For these type II inhibitors the greater value of α compared to β indicates asymmetric allosteric coupling. Data represent best-fit values from global analysis of n=3 independent experiments performed in duplicate.
-
Figure 1—figure supplement 5—source data 1
Tabulated source data.
- https://cdn.elifesciences.org/articles/95481/elife-95481-fig1-figsupp5-data1-v1.zip
Figure 1—figure supplement 6
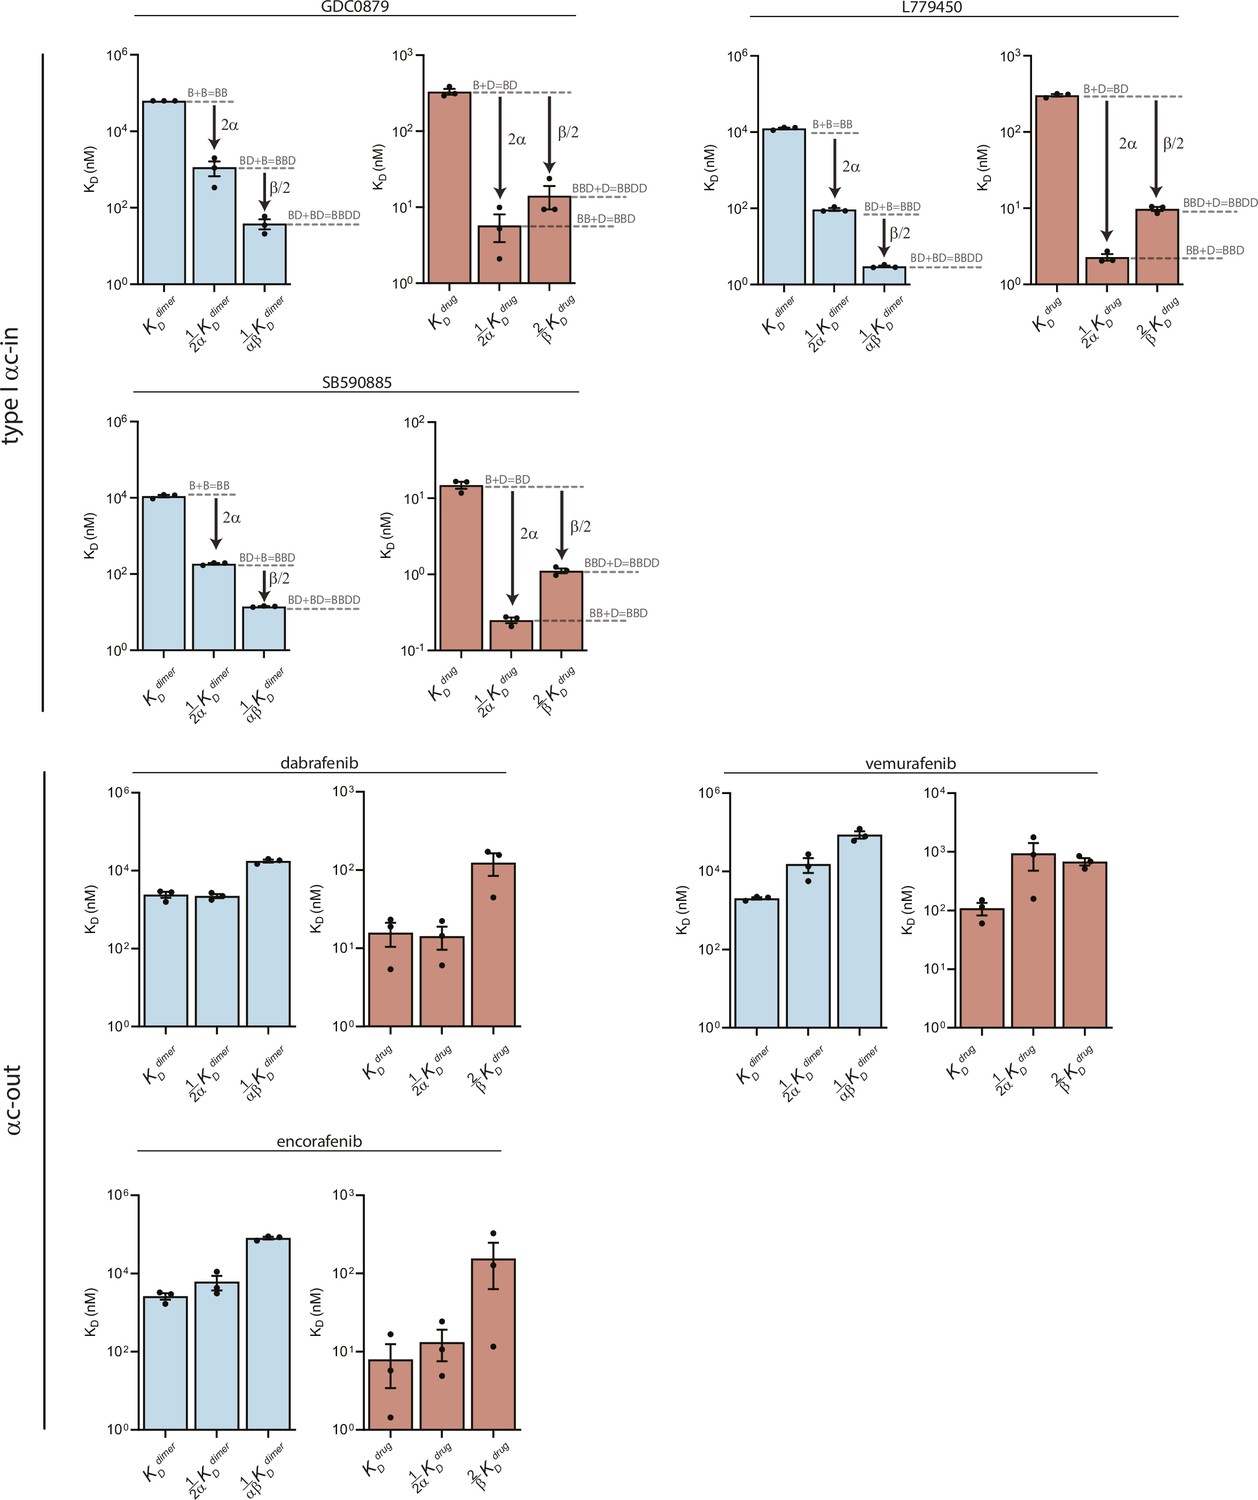
Equilibrium dissociation constants derived from global fitting of FRET data for type I αC-in and αC-out inhibitors.
Dissociation constants for BRAF dimerization (blue) and inhibitor binding affinity (red) derived from the global fitting analysis of the FRET dimerization data. Allosteric coupling factors α and β describe the coupling of the first and second inhibitor binding events to BRAF dimerization, respectively (see Materials and methods). The similar values of α and β for the type I inhibitors (top panels) indicate symmetric allosteric coupling, in contrast to the asymmetrically coupled type II inhibitors shown in Figure 1—figure supplement 5. The αC-out inhibitors (bottom panels) show negative allosteric coupling and weaken BRAFE586K dimerization. Data represent best-fit values from global analysis of n=3 independent experiments performed in duplicate.
-
Figure 1—figure supplement 6—source data 1
Tabulated source data.
- https://cdn.elifesciences.org/articles/95481/elife-95481-fig1-figsupp6-data1-v1.zip
Figure 1—figure supplement 7
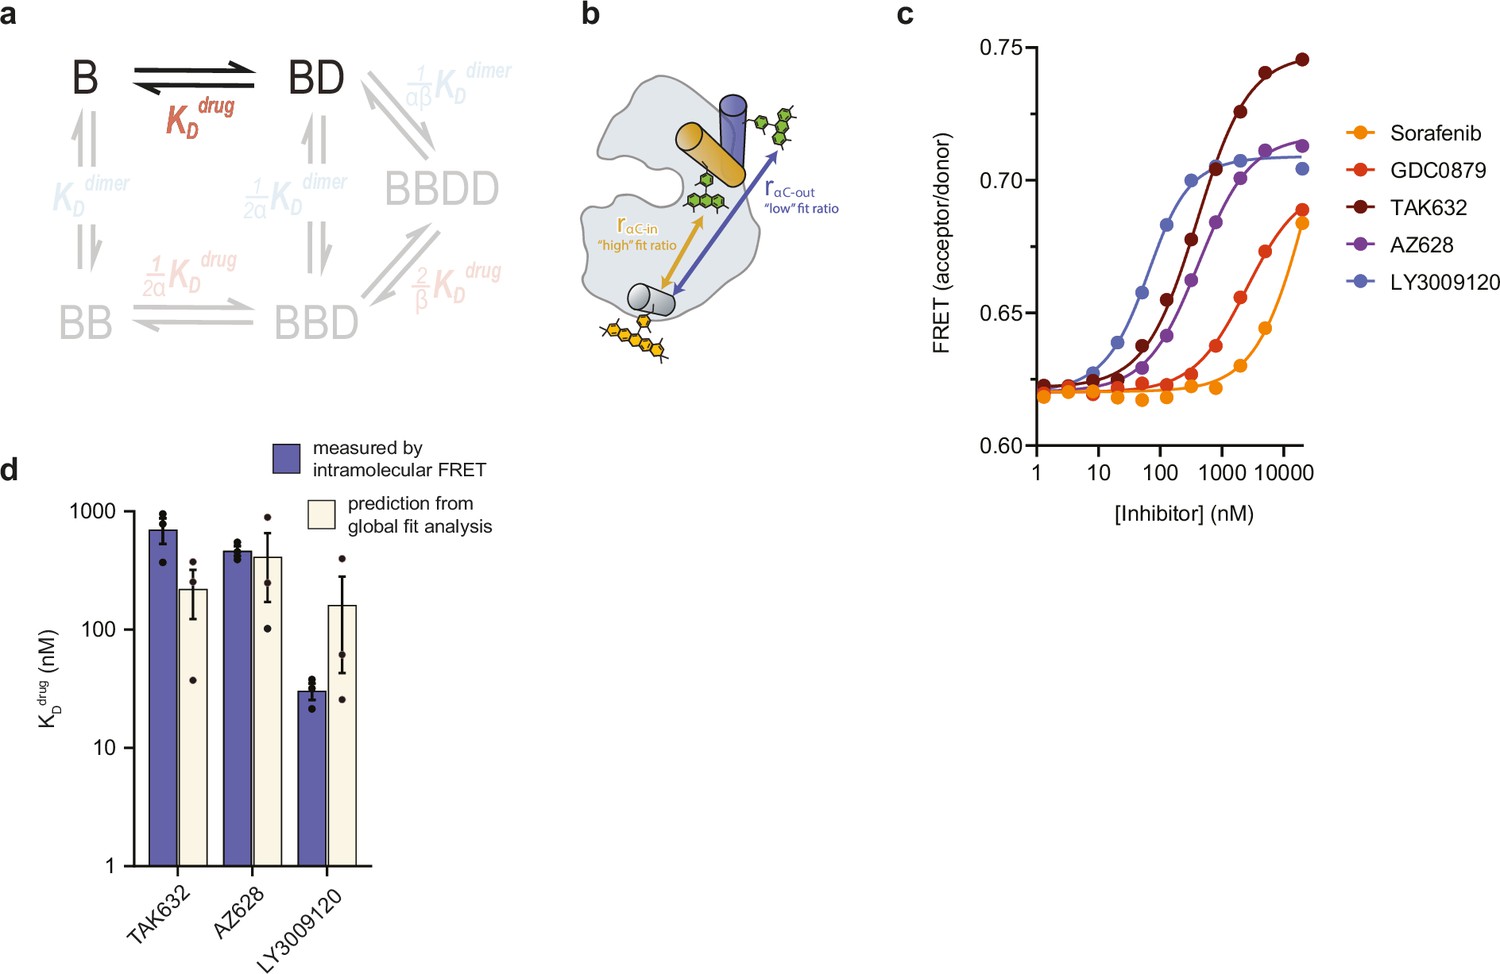
Inhibitor affinities for monomeric BRAF (KDdrug) measured by intramolecular FRET.
(a) Schematic highlighting the equilibrium dissociation constant KDdrug that is being independently measured in the context of the thermodynamic model used for global fitting. (b) Schematic showing the intramolecular FRET biosensor used to quantify inhibitor binding to monomeric BRAF containing dimer disrupting mutations. Inhibitor-induced conformational changes of the αC-helix upon binding lead to a change in FRET. (c) Inhibitor binding to monomeric BRAF as indicated by changes in FRET (acceptor/donor ratio). Binding curves were fit to a quadratic binding model in GraphPad Prism to extract KDdrug. (d) Best-fit values for KDdrug measured directly by intramolecular FRET (blue) in panel c compared to best-fit values predicted from the global fitting analysis of intermolecular FRET dimerization data (cream). Data represent the mean ± s.e.m.; n=3 independent experiments.
-
Figure 1—figure supplement 7—source data 1
Tabulated source data.
- https://cdn.elifesciences.org/articles/95481/elife-95481-fig1-figsupp7-data1-v1.zip
Figure 1—figure supplement 8

The A481F active site mutation blocks inhibitor binding and prevents inhibitor-induced dimerization.
(a) A schematic demonstrating how the A481F active site mutation eliminates the effects of β on BRAF dimerization by blocking inhibitor binding and preventing the formation of BRAF dimers with both active sites bound to inhibitors. (b) Intermolecular FRET dimerization data showing the formation of BRAFA481F/BRAFA481F homodimers as a function of αC-in inhibitor concentration. αC-in inhibitors fail to induce A481F homodimers indicating that the mutation effectively blocks inhibitor binding, with the exception of LY3009120 which, although it binds far more weakly to the mutant, does trigger dimerization at high concentrations.
-
Figure 1—figure supplement 8—source data 1
Tabulated source data.
- https://cdn.elifesciences.org/articles/95481/elife-95481-fig1-figsupp8-data1-v1.zip
Figure 1—figure supplement 9
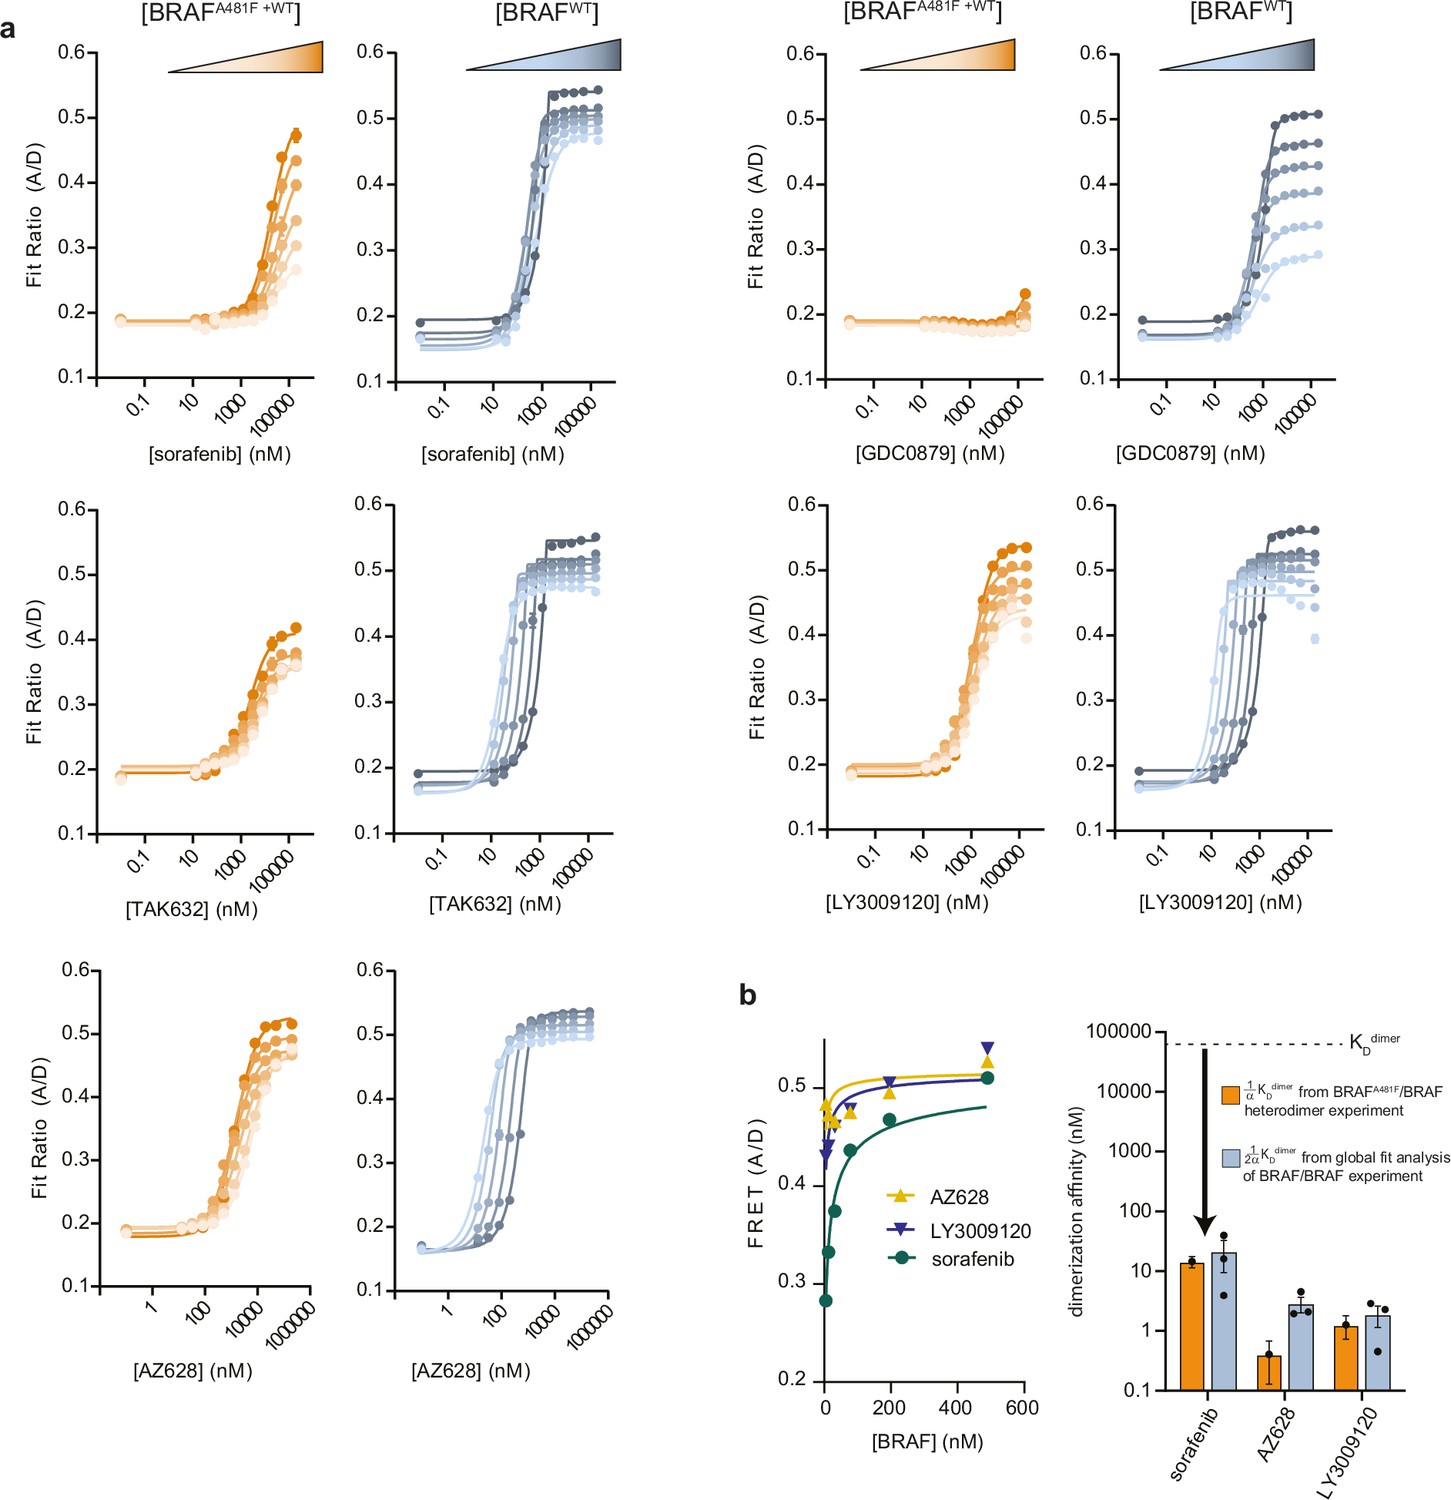
The binding of a single αC-in type II molecule to the BRAF dimer is sufficient to dramatically increase dimerization affinity.
(a) Representative intermolecular FRET dimerization data showing the formation of BRAFA481F/BRAF heterodimers (orange) and BRAF/BRAF homodimers (blue) as a function of inhibitor concentration. The type II inhibitors strongly induce BRAFA481F/BRAF heterodimers, while the type I inhibitor GDC0879 does not. (b) The upper baselines observed at saturating inhibitor concentrations in panel a were fit to a monomer-dimer equilibrium model (left) to obtain estimates of the KD values for saturated BBD dimers (right), which agree well with KDdimer values calculated from the global fitting analysis of independent FRET experiments.
-
Figure 1—figure supplement 9—source data 1
Tabulated source data.
- https://cdn.elifesciences.org/articles/95481/elife-95481-fig1-figsupp9-data1-v1.zip
Figure 1—figure supplement 10
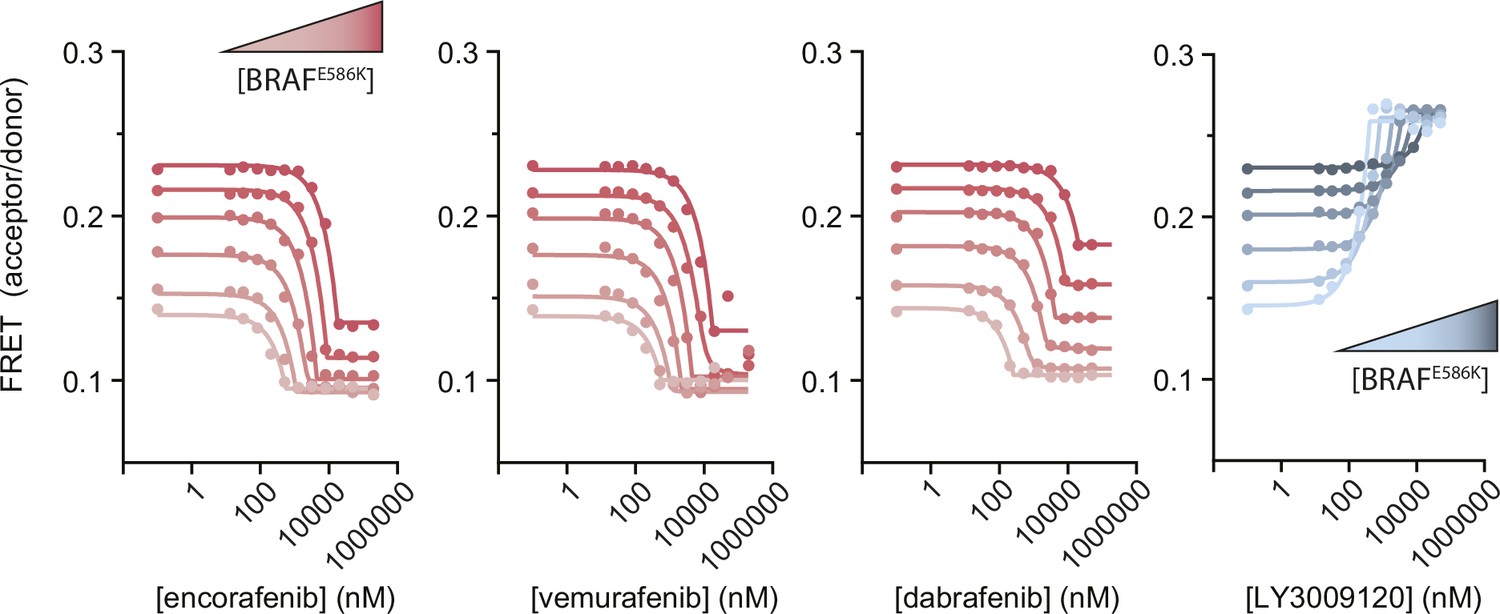
Intermolecular FRET experiments measuring the disruption of BRAFE586K dimerization by αC-out inhibitors.
Representative data showing BRAFE586K dimerization as a function of αC-out inhibitors (red) and the αC-in inhibitor LY3009120 (blue) for comparison. Gradients from light to dark represent experiments done at increasing BRAF concentration. Lines are fits of individual titrations to a quadratic binding model in GraphPad Prism and are for illustrative purposes only; all data were globally fit to the thermodynamic model shown in Figure 1c.
-
Figure 1—figure supplement 10—source data 1
Tabulated source data.
- https://cdn.elifesciences.org/articles/95481/elife-95481-fig1-figsupp10-data1-v1.zip
Figure 1—figure supplement 11

Only asymmetric allosteric models correspond to realistic levels of catalytic activity of BBD dimers for type II inhibitors.
(a) For some datasets, removing constraints on the BRAF concentrations used in the global fitting analysis resulted in two possible solutions, as shown for a representative case of fitting FRET data obtained with belvarafenib, where a one-dimensional error surface for the [BRAF]1 concentration parameter reveals two minima. The gray dotted line represents the chi2 threshold used to establish the 95% CI for the [BRAF]1 parameter. The two minima at different BRAF concentrations with equivalent chi² values correspond to a symmetric and an asymmetric model. (b) To independently test each model the induction of partially occupied and presumably active ‘BBD’ BRAF dimers was simulated as a function of belvarafenib concentration using either the symmetric (brown) or asymmetric (blue) allosteric models derived from the fitting shown in panel a. Simulations were performed for three independent FRET datasets. Note the asymmetric models yielded much stronger BBD induction than the symmetric models. (c) The kinase activity of BRAF was measured in vitro at different belvarafenib concentrations and fit to a bell-shaped dose-response curve to determine peak BRAF activity. (d) Peak kinase activity and predicted peak [BBD] were used to calculate the inferred catalytic turnover per BBD dimer from the asymmetric and symmetric models. Values were compared to the previously reported catalytic activity of 14-3-3-bound BRAF dimers (black dotted line) (Liau et al., 2020). Note that the inferred activity of BBD dimers predicted by the symmetric model (brown) is far higher than the published value for fully activated and uninhibited BRAF dimers. Conversely, the catalytic activity predicted by the asymmetric model (blue) is in close agreement with the published value and is slightly lower, consistent with one of the two active sites of the dimer being inhibited.
-
Figure 1—figure supplement 11—source data 1
Tabulated source data.
- https://cdn.elifesciences.org/articles/95481/elife-95481-fig1-figsupp11-data1-v1.zip
Figure 2 with 2 supplements
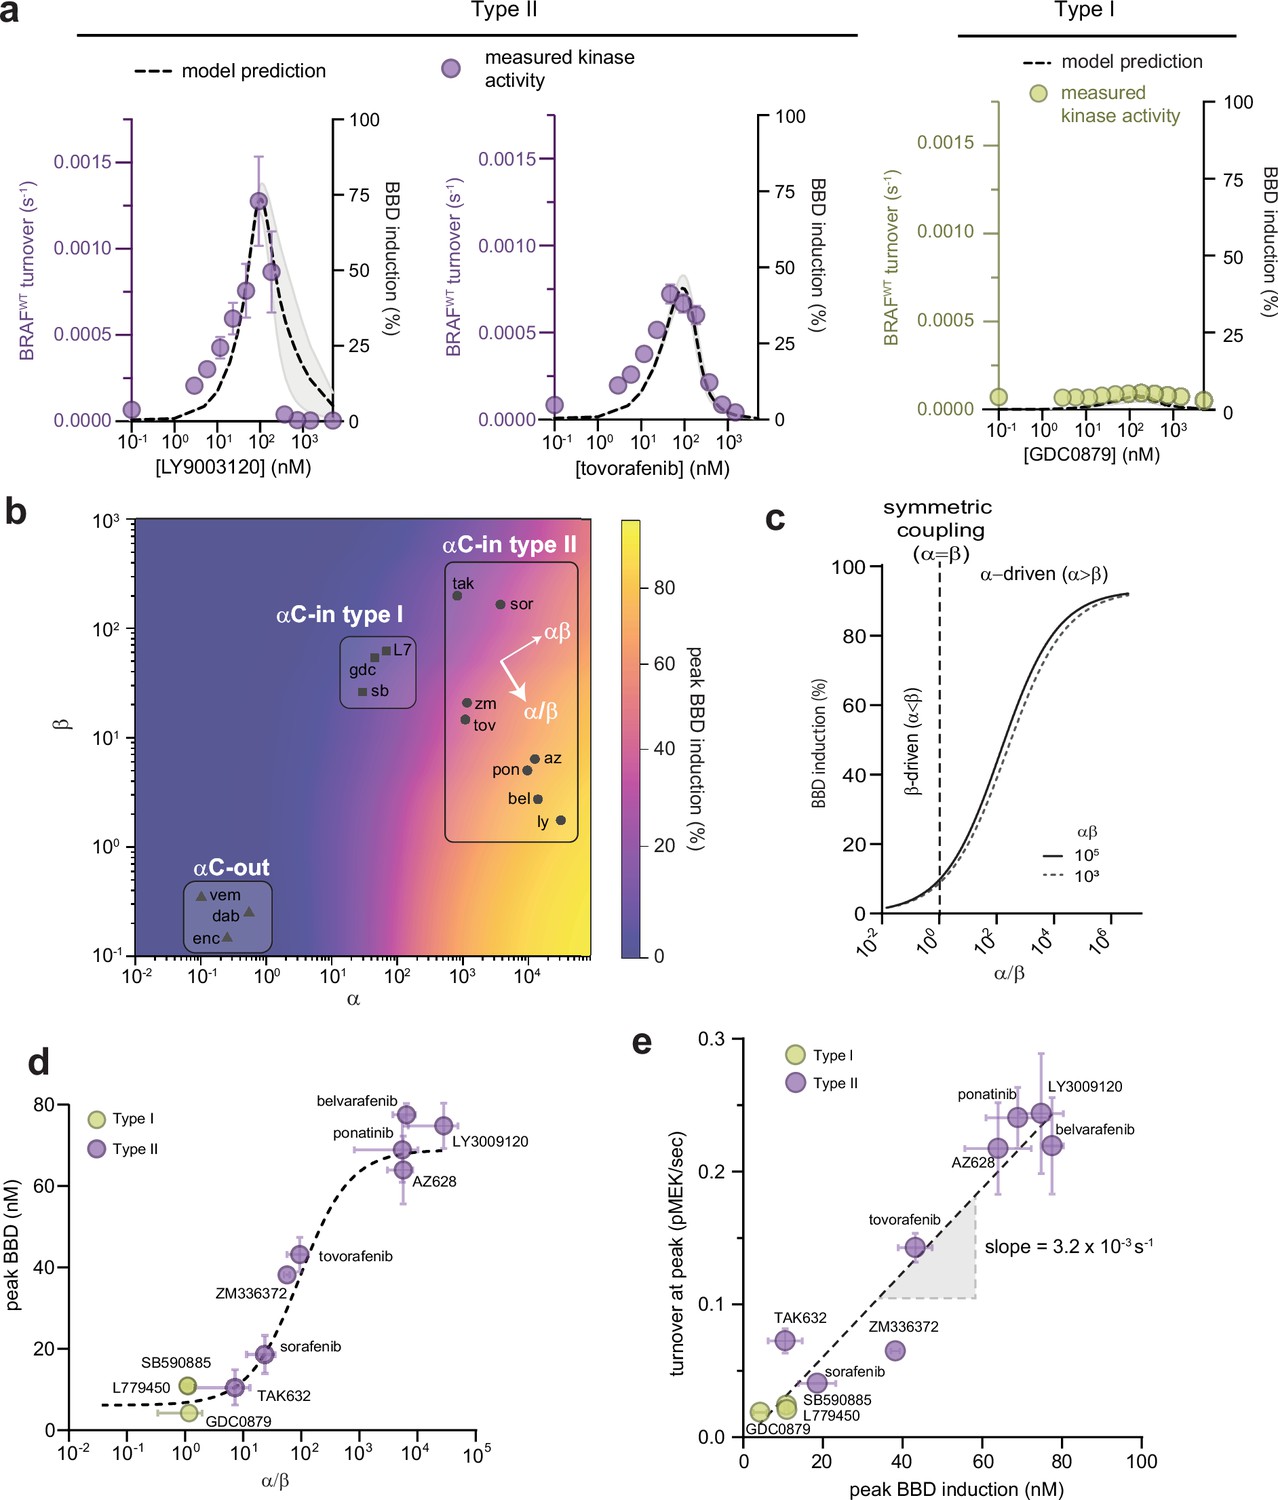
Allosteric asymmetry is the driving force for paradoxical activation by type ll αC-in inhibitors.
(a) Representative BRAF kinase activity data (circles, left y-axis) and induction of partially occupied BBD dimers (dashed line, right y-axis), for type II inhibitors LY3009120 and tovorafenib (purple) and the type I inhibitor GDC0879 (yellow). Activity data represent mean values ± s.e.m.; n=3 independent experiments each performed in duplicate. Activity data for other inhibitors are shown in Figure 2—figure supplement 1. BBD induction curves were simulated from the allosteric models parameterized with FRET data. The thickness of the band represents the 95%CI of the best-fit model from n=3 independently parameterized models. Simulations for other inhibitors are shown in Figure 2—figure supplement 1. (b) Induction landscape where the predicted amplitude of BBD induction is plotted over a wide range of α and β values. Simulations were performed using an allosteric model where KDdimer and KDdrug were kept constant and α and β were systematically varied. Inhibitors are shown mapped onto the landscape (black symbols) based on their experimentally determined α and β factors. az, AZ628, bel, belvarafenib, dab, dabrafenib, enc, encorafenib, gdc, GDC0879, ly, LY30019120, L7, L779450, pon, ponatinib, sor, sorafenib, sb, SB590885, tov, tovorafenib, tak, TAK632, vem, vemurafenib, zm, ZM33637. (c) The simulated peak BBD induction is shown as a function of coupling asymmetry α/β at two fixed values of the total coupling strength αβ. (d) Simulated BBD induction magnitudes versus allosteric coupling ratios (α/β) for αC-in type I (yellow) and αC-in type II (purple) inhibitors. Data represent the mean ± s.e.m.; n≥3 independent experiments each performed in duplicate. The dashed line represents a hyperbolic fit to the data and confirms the relationship predicted in panel c. (e) Amplitude of BRAF kinase activation measured in vitro as a function of the simulated peak BBD induction for each inhibitor. Kinase activity data represent the mean ± s.e.m.; n=3 independent experiments each performed in duplicate. The slope of the linear fit, corresponding to the catalytic activity of BBD dimers, is indicated.
-
Figure 2—source data 1
Tabulated source data for Figure 2.
- https://cdn.elifesciences.org/articles/95481/elife-95481-fig2-data1-v1.zip
Figure 2—figure supplement 1
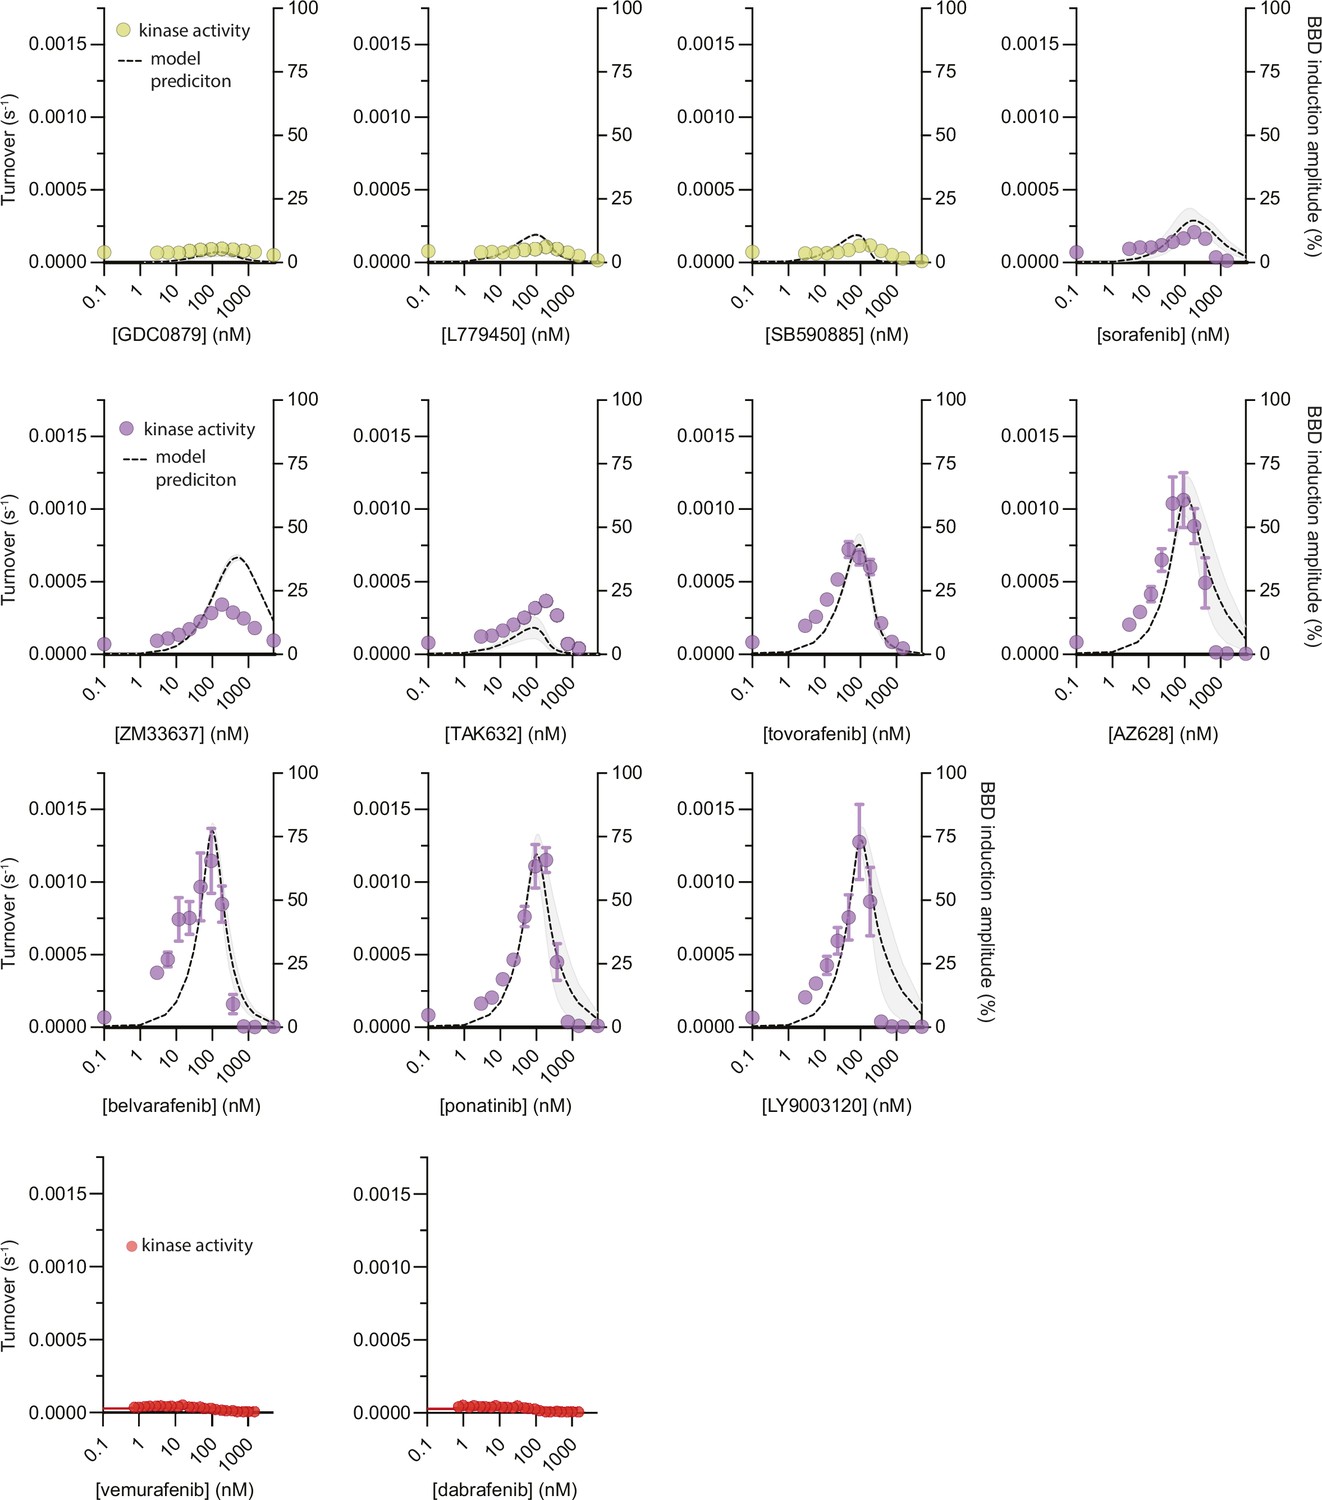
Simulations of partially occupied BRAF dimer formation and in vitro kinase activity.
The formation of partially occupied ‘BBD’ BRAF dimers was simulated as a function of inhibitor concentration using the allosteric model (Figure 1c) parameterized for each inhibitor via the global analysis of intermolecular FRET data (see Materials and methods). Multiple independent simulations were performed for each inhibitor based on models parameterized with separate FRET datasets and reported as BBD induction amplitude percent. The mean of these simulations from n=3 independent experiments is shown as a black dotted line with the 95%CI of the best-fit model shown as a light gray band. In vitro phosphorylation of MEK by BRAF was measured as a function of αC-in type I (yellow), αC-in type II (purple), and αC-out (red) inhibitors and overlayed onto the BBD induction amplitude simulations. The inhibitor-induced BRAF activation by the asymmetrically coupled type II inhibitors is far greater than the symmetrically coupled type I inhibitors, in excellent agreement with the allosteric model predictions. Data represent the mean ± s.e.m.; n=3 independent experiments performed in duplicate.
-
Figure 2—figure supplement 1—source data 1
Tabulated source data.
- https://cdn.elifesciences.org/articles/95481/elife-95481-fig2-figsupp1-data1-v1.zip
Figure 2—figure supplement 2
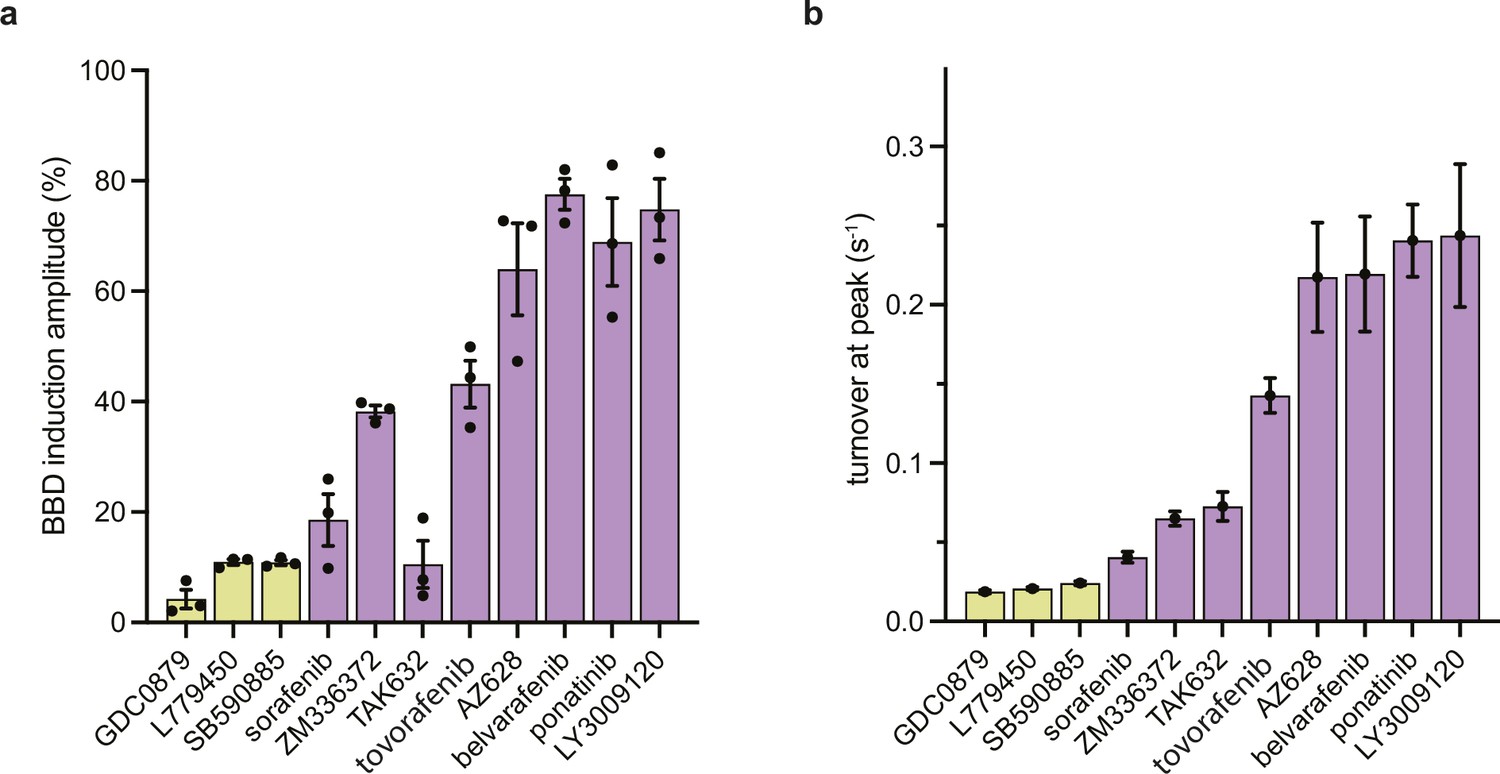
BBD induction amplitude and peak catalytic turnover.
(a) Peak BBD induction amplitudes from individual simulations shown in Figure 2—figure supplement 1 are shown for type I (yellow) and type II (purple) αC-in inhibitors. Data represent the mean ± s.e.m.; n=3 independent experiments performed in duplicate. (b) Peak inhibitor-induced BRAF kinase activity for αC-in inhibitors determined by in vitro kinase activity assays measuring MEK phosphorylation by BRAF shown in Figure 2—figure supplement 1. Data represent the mean and 95% CIs of peak kinase activity determined by fitting n=3 independent kinase activity experiments done in duplicate to a bell-shaped dose-response model in GraphPad Prism.
-
Figure 2—figure supplement 2—source data 1
Tabulated source data.
- https://cdn.elifesciences.org/articles/95481/elife-95481-fig2-figsupp2-data1-v1.zip
Figure 3 with 3 supplements
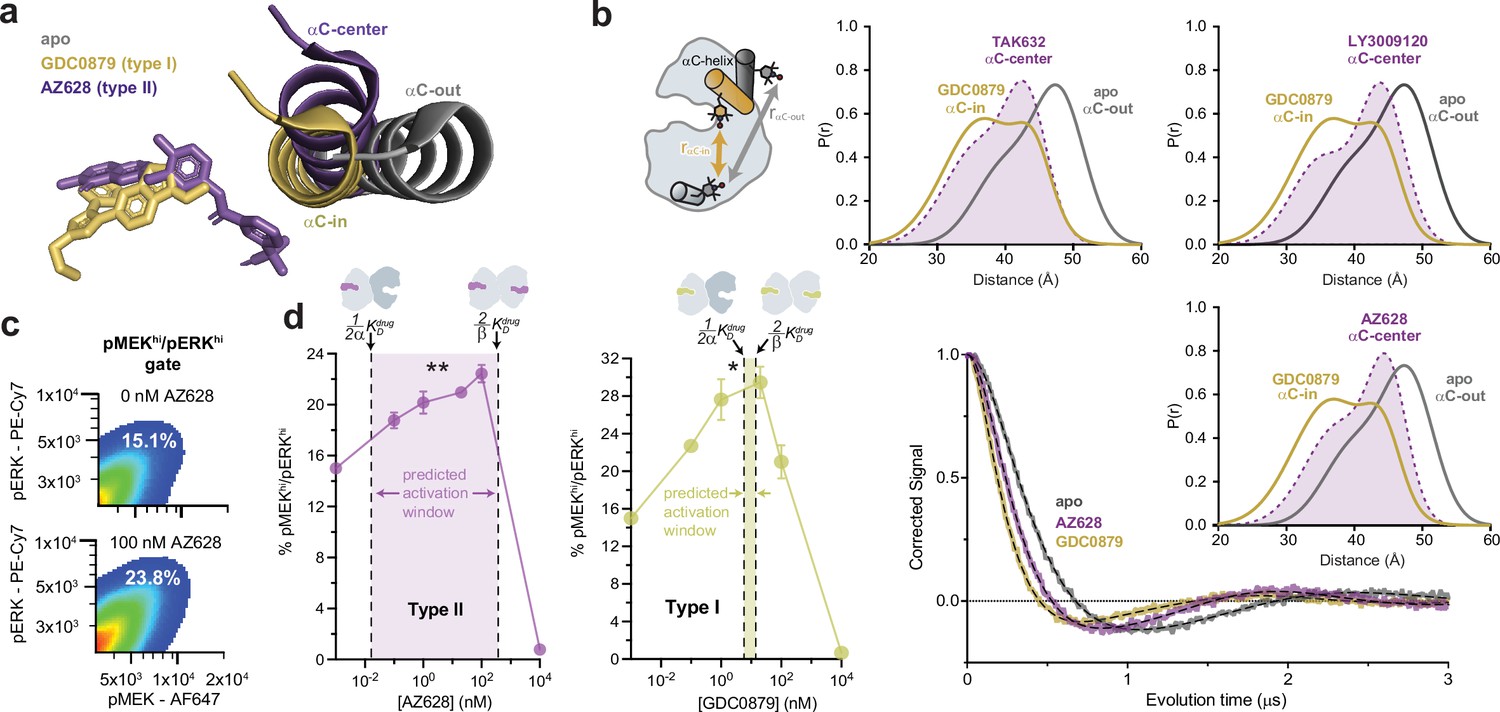
Type I and type II inhibitors induce distinct αC-helix conformations and promote MAPK/ERK pathway activation in SK-MEL-2 cells.
(a) X-ray structures of BRAF in the apo state (Park et al., 2019), bound to the type I inhibitor GDC0879 (Haling et al., 2014), and bound to the type II inhibitor AZ628 (Karoulia et al., 2016) (PDB IDs: 6PP9, 4MNF, 4RZW), highlighting the different αC-helix conformations stabilized by each inhibitor. Structures were aligned on the C-terminal lobe. (b) (Left) Schematic of the labeling strategy used to track the conformation of the αC-helix with double electron-electron resonance (DEER). (Right) DEER waveforms and Gaussian distance distributions for apo BRAF (gray), BRAF bound to type I inhibitor GDC0879 (yellow), and BRAF bound to the type II inhibitors TAK632, AZ628, and LY3009120 (purple). (c) Representative flow-cytometry plots showing gating used to define maximally activated (pMEKhi/pERKhi) SK-MEL-2 cells in the absence (top) and presence (bottom) of AZ628 at an activating concentration of 100 nM. White labels indicate the % of live, single cells within the maximally activated gate. (d) Induction and inhibition of RAF-mediated MAPK phosphorylation in SK-MEL-2 cells treated with the type II inhibitor AZ628 (left, purple) and the type I inhibitor GDC0879 (right, yellow). The overlaid dashed lines represent the inhibitor affinities for the first and second binding sites on the dimer, defined by KDdrug and KDdrug, respectively, determined from our global fitting analysis. The shaded concentration range between them defines the predicted activation window for each inhibitor. Data represent the mean ± s.e.m.; n=3 independent experiments. Significance was assessed using one-way ANOVA with Geisser-Greenhouse correction and Tukey’s multiple comparison test. Asterisks reflect significant paradoxical activation of AZ pairs: [0→20 nM**p=0.0036], [0→100*p=0.0256] and GDC pairs: [0→0.1*p=0.0105], [0→20*p=0.0459]. For both inhibitor titrations, all pairwise comparisons [x→10,000 nM] also rose to significance and comparisons not mentioned did not. Induction and inhibition of RAF-mediated MAPK phosphorylation in SK-MEL-2 cells treated with additional inhibitors is shown in Figure 3—figure supplement 2.
-
Figure 3—source data 1
Tabulated source data for Figure 3.
- https://cdn.elifesciences.org/articles/95481/elife-95481-fig3-data1-v1.zip
Figure 3—figure supplement 1
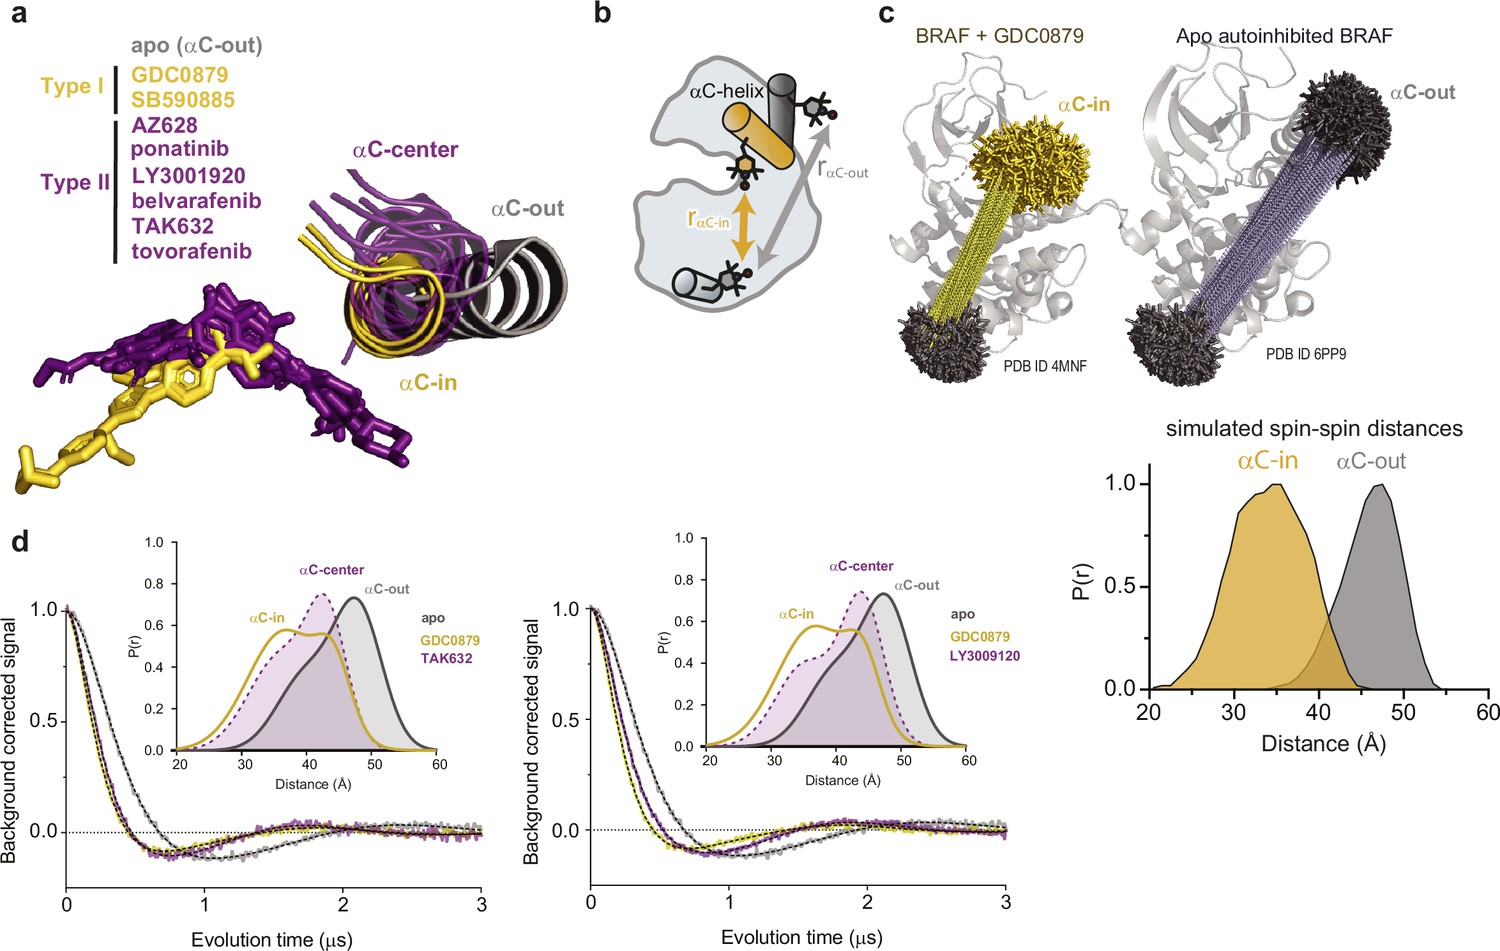
Measuring the conformation of the αC-helix with double electron-electron resonance (DEER).
(a) X-ray structures of BRAF in the apo state (gray) (PDB ID: 6PP9), bound to type I inhibitors (yellow) (PDB IDs: 4MNF, 2FB8) and type II inhibitors (purple) (PDB IDs: 4RZW, 6P3D, 5C9C, 6XFP, 4KSP, 6V34) highlighting the positioning of the αC-helix. Structures were aligned on the C-terminal lobe of the kinase. (b) Schematic of the labeling strategy used to track the conformation of the αC-helix with DEER. (c) MtsslWizard was used to generate predicted spin-spin distance distributions using BRAF crystal structures. Rotamers of 4-maleimido-TEMPO were generated from a GDC0879-bound BRAF structure (PDB ID: 4MNE) adopting an αC-in state (yellow) and a structure of apo BRAF (PDB ID: 6PP9) adopting an αC-out state (gray). Individual spin-spin distances (dashed lines) were calculated and compiled to simulate spin-spin distances (lower panel) used to assign the Gaussian distance distributions from DEER experiments represented in panel d. (d) DEER waveforms and Gaussian distance distributions for apo BRAF and BRAF bound to type I inhibitor GDC0879 (yellow) and type II inhibitors TAK632 and LY3009120 (purple).
-
Figure 3—figure supplement 1—source data 1
Tabulated source data.
- https://cdn.elifesciences.org/articles/95481/elife-95481-fig3-figsupp1-data1-v1.zip
Figure 3—figure supplement 2
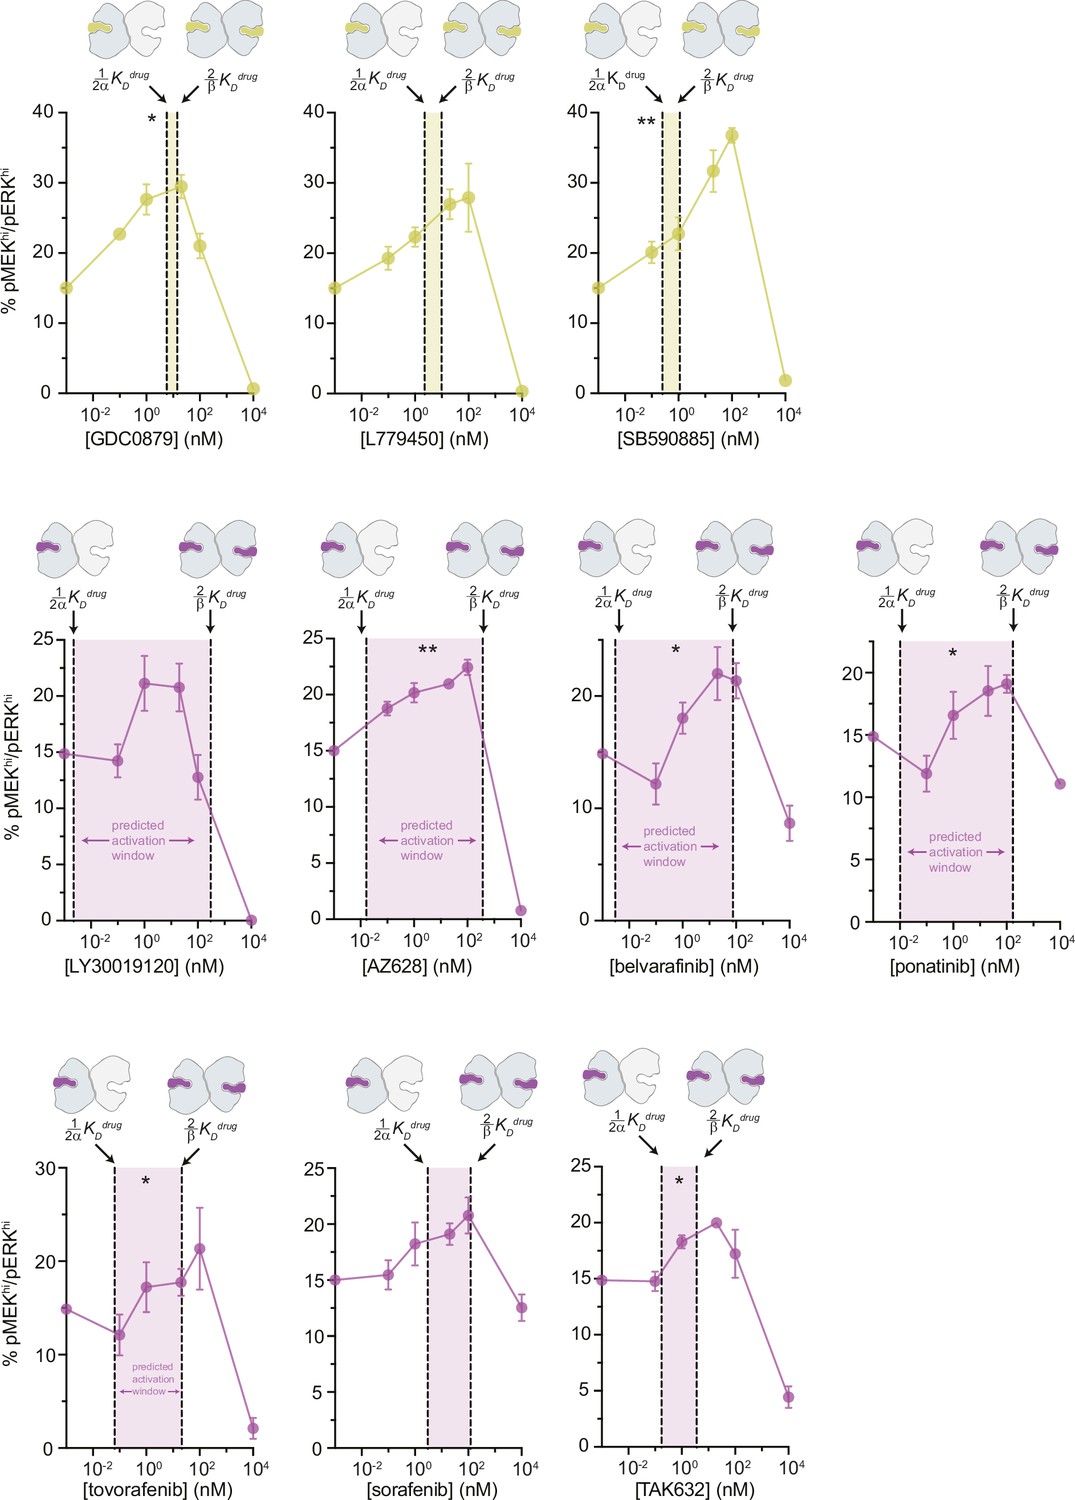
Inhibitor-induced MAPK/ERK pathway activation in SK-MEL-2 cells.
Paradoxical activation of MAPK/ERK signaling in SK-MEL-2 cells by type I (yellow) and type II (purple) RAF inhibitors measured by flow cytometry. The dashed lines represent the inhibitor affinities for the first and second subunit of the BRAF dimer ( Kdrug and Kdrug, respectively), determined from the global fitting analysis with the shaded gap between the two lines representing the predicted window of activation. Error bars represent the mean ± s.e.m.; n=3 independent experiments. Significance was determined from a one-way ANOVA/Geisser-Greenhouse/Tukey’s test. Asterisks reflect significant paradoxical activation between pairs of data points for GDC0879 [0→0.1 nM,*p=0.0105], [0→20*p=0.0459]; SB590885 [0→100**p=0.0085], [0.1→100**p=0.0064]; AZ628 [0→20**p=0.0036], [0→100*p=0.0256]; belvarafenib [0.1→1*p=0.0250], [0.1→100*p=0.0105]; ponatinib [1→20*p=0.0135]; tovorafenib [0.1→1*p=0.0328]; and TAK632 [0→20*p=0.0249], [0.1→20*p=0.0361]. Most pairwise comparisons [x→10,000 nM] also rose to significance while comparisons not mentioned did not.
-
Figure 3—figure supplement 2—source data 1
Tabulated source data.
- https://cdn.elifesciences.org/articles/95481/elife-95481-fig3-figsupp2-data1-v1.zip
Figure 3—figure supplement 3
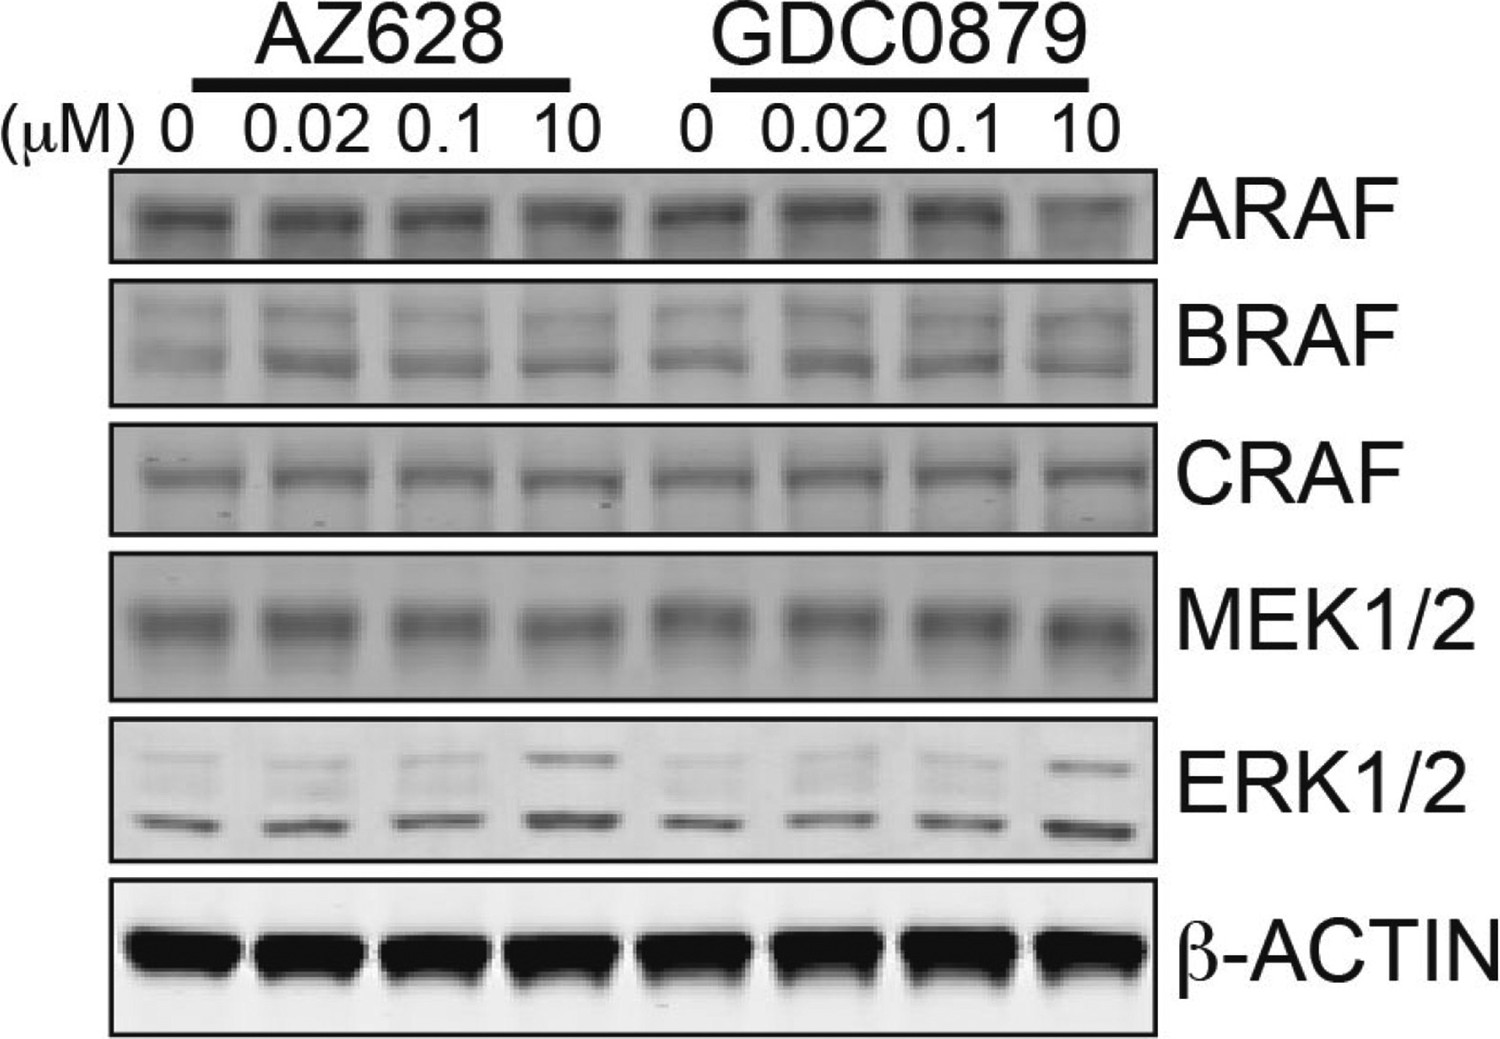
Western blot confirming the presence of all RAF isoforms in SK-MEL-2 cells.
SK-MEL-2 cells were treated with the indicated amount of type II inhibitor AZ628 or type I inhibitor GDC0879 for 1 hr. Cell lysates were immunoblotted for all endogenous RAF isoforms. Note that ARAF, BRAF, and CRAF are present at similar levels.
-
Figure 3—figure supplement 3—source data 1
Uneditited western blots.
- https://cdn.elifesciences.org/articles/95481/elife-95481-fig3-figsupp3-data1-v1.zip
Figure 4 with 2 supplements
The αC-helix in the BRAF dimer dynamically samples multiple conformational states.
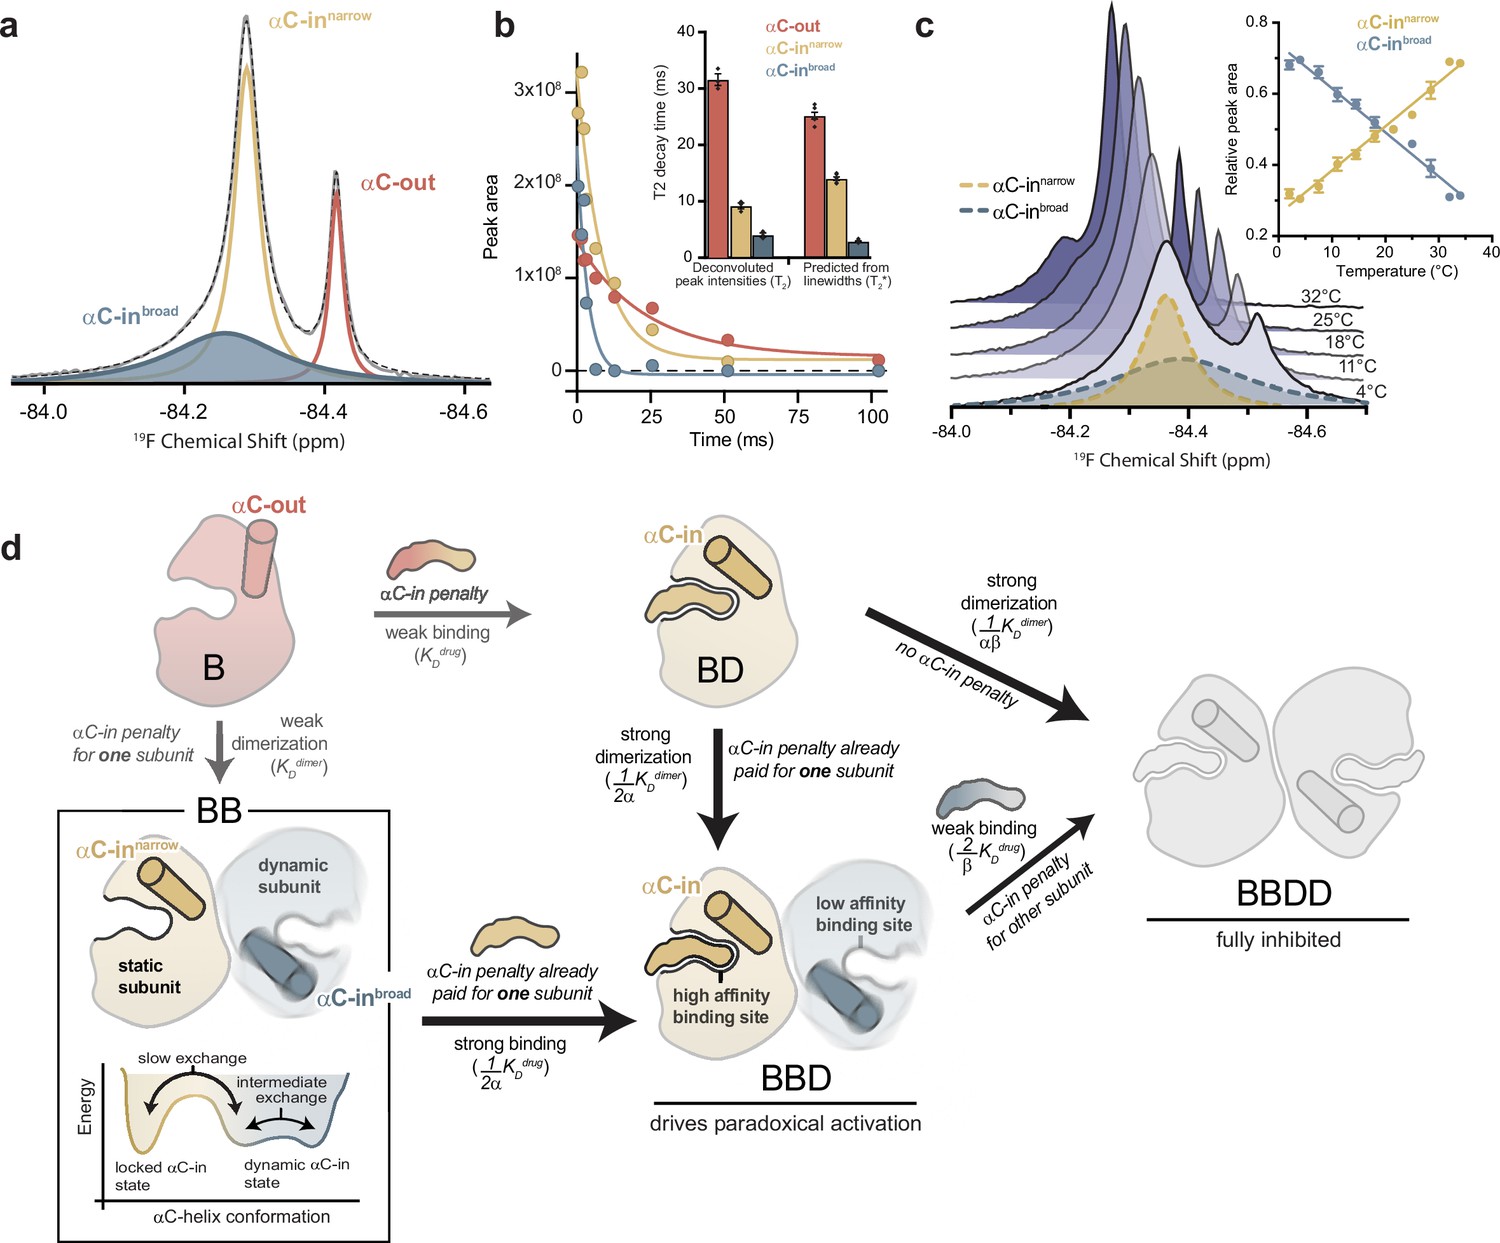
(a) 19F NMR spectrum of apo BRAF labeled on the αC-helix (Q493C) with 3-bromo-1,1,1-trifluoroacetone (BTFA). The raw spectrum (gray line) was fit to a multi-component Lorentzian model (dotted line). The deconvoluted spectrum consists of three unique resonances that correspond to one αC-out state (red) and two αC-in states (blue and yellow). Resonance assignments are shown in Figure 4—figure supplement 1a,b and c (b) Representative 19F NMR T2 relaxation profiles showing the peak areas of individual deconvoluted peaks shown in panel a as a function of T2 decay time. T2 decay parameters for each component were extracted by single-exponential fits. The inset shows a comparison of these T2 values with T2* values calculated from the spectral line widths of each component via the relationship T2*=1/(π × line width). Data represent the mean ± s.e.m.; n=4 independent experiments. (c) Variable-temperature 19F NMR experiments. Spectra collected at lowest (light blue) to highest (dark blue) temperatures are shown. The deconvoluted dimer peaks are also shown as dotted lines for the lowest temperature. The inset shows the relative peak areas of αC-innarrow (yellow) and αC-inbroad (blue) peaks as a function of temperature. Data represent the mean ± s.e.m.; n=3 independent experiments. (d) Schematic representation of our model for how dynamic heterogeneity in the BRAF dimer contributes to paradoxical activation. The relatively static αC-innarrow (yellow) and more dynamic αC-inbroad (blue) states observed by 19F NMR experiments are highlighted in the context of drug binding to monomers and dimers, with the biochemical species arranged in the same manner as in Figure 1c. This model can be further visualized with a free-energy diagram showing the αC-innarrow and αC-inbroad states similarly populated and in slow exchange. The αC-inbroad state consists of multiple conformational states separated by small energy barriers resulting in exchange on the intermediate timescale.
-
Figure 4—source data 1
Tabulated source data for Figure 4.
- https://cdn.elifesciences.org/articles/95481/elife-95481-fig4-data1-v1.zip
Figure 4—figure supplement 1
19F NMR resonance assignments and experiments confirming the presence of dynamic heterogeneity within the BRAF dimer.
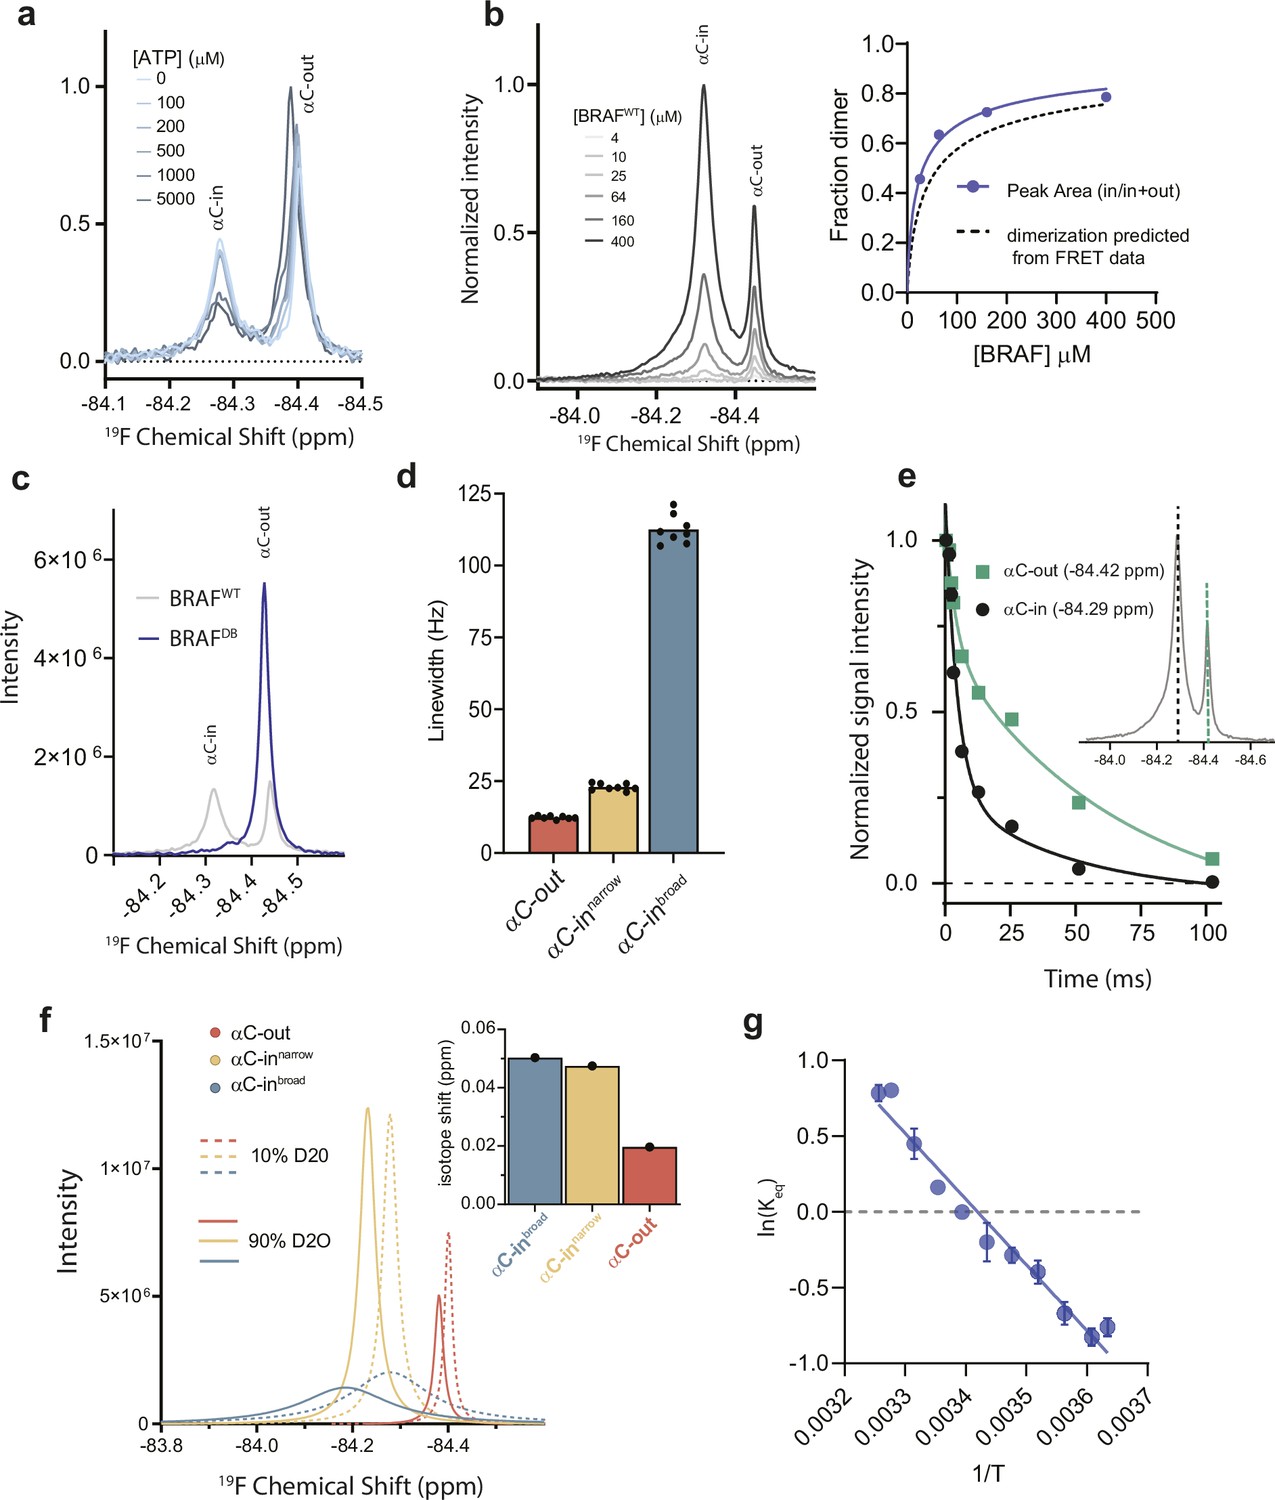
(a) 19F NMR spectra of BRAF labeled on the αC-helix with 3-bromo-1,1,1-trifluoroacetone (BTFA) in the presence of ATP. ATP causes an increase in the upfield resonance and decrease in the downfield resonance, allowing the upfield resonance to be assigned to the monomer/αC-out state and the downfield resonance to be assigned to the dimer/αC-in state. (b)19F NMR spectra of BRAF at different BRAF concentrations. The relative peak areas of the αC-in peak versus the αC-out peak were plotted as a function of BRAF concentration (upper right) and fit to a monomer-dimer equilibrium model (blue), to derive a value for the dimerization affinity which was in reasonable agreement with the value determined from the FRET experiments (dotted line) with a KDdimer of 32.2±9.4 μM. (c) 19F NMR spectra of BRAF (gray) and BRAF containing dimer disrupting mutations (BRAFDB+Q493C, blue). The disappearance of the downfield resonance in the presence of the dimer disrupting mutations is consistent with the resonance assignments discussed in a,b and supports the assignment of the exchange broadened peak to the dimeric state. (d) Line widths extracted from deconvoluted 19F NMR spectra corresponding to the individual species represented in Figure 4a. Data represent the best-fit values from the spectral deconvolution of n=8 independent experiments. (e) 19F NMR T2 relaxation profiles obtained from BRAF. Intensities at –84.42 ppm (green) and –84.29 ppm (black) corresponding to the αC-out and αC-in resonances, respectively, were plotted as a function of decay time. Relaxation profiles required a multi-exponential fit (p˂0.0001) indicating the presence of overlapping resonances with distinct relaxation times. Data represent the mean ± s.e.m.; n=15 independent experiments. (f) Solvent isotope effect experiments obtained with BRAF in 10% D2O (dotted lines) and 90% D2O (solid lines). Individual component fits from spectral deconvolution are shown and correspond to the αC-out (red), αC-innarrow (yellow), and αC-inbroad (blue) states. Relative peak shifts indicate that the two αC-in states exhibit a similar degree of solvent exposure. (g) Van’t Hoff plot showing the temperature dependence of the equilibrium between the αC-innarrow and αC-inbroad dimer states.
-
Figure 4—figure supplement 1—source data 1
Tabulated source data.
- https://cdn.elifesciences.org/articles/95481/elife-95481-fig4-figsupp1-data1-v1.zip
Figure 4—figure supplement 2
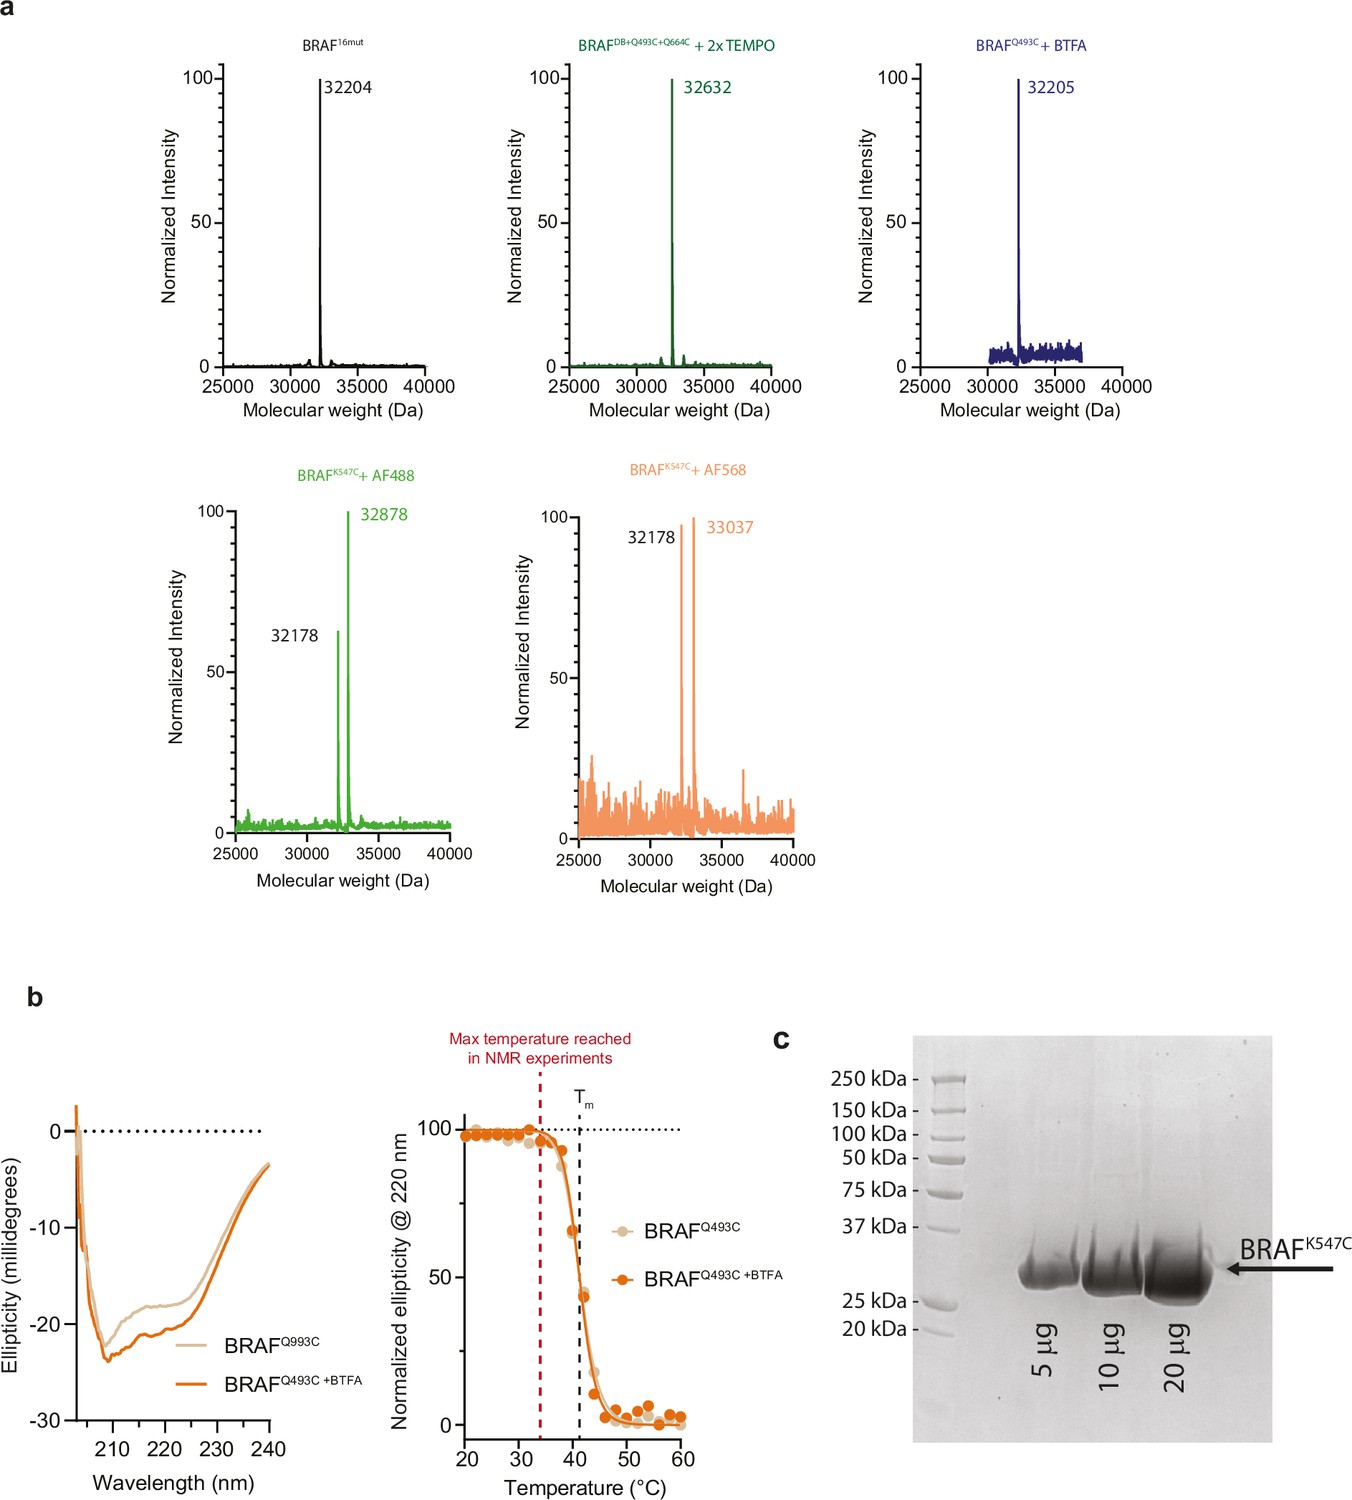
Validation of BRAF labeling, stability, and purity.
(a) Mass spectra of BRAF16mut (theoretical molecular weight: 32,204 Da), BRAFDB+Q493C+Q664C labeled with two 4-maleimido-TEMPO spin probes (theoretical molecular weight: 32,638 Da), BRAFQ493C labeled with 3-bromo-1,1,1-trifluoroacetone (BTFA, theoretical molecular weight: 32,205 Da), BRAFK547C (32,178 Da) labeled with Alexa Flour 488 (theoretical molecular weight: 32,900 Da), BRAFK547C (32,178 Da) labeled with Alexa Fluor 568 (theoretical molecular weight: 33,060 Da). (b) Circular dichroism spectra of BRAFQ493C (tan) and BRAFQ493C labeled with BTFA (orange). Ellipticity at 220 nm was plotted as a function of temperature. Note that the presence of the BTFA probe does not influence the melting temperature (Tm) which is well above the maximum temperature used in NMR experiments (red dotted line). (c) SDS-PAGE gel of BRAFK547C at increasing total protein amounts showing the purity of the samples used in intermolecular FRET experiments.
-
Figure 4—figure supplement 2—source data 1
Tabulated source data.
- https://cdn.elifesciences.org/articles/95481/elife-95481-fig4-figsupp2-data1-v1.zip
-
Figure 4—figure supplement 2—source data 2
Raw gel from panel c.
- https://cdn.elifesciences.org/articles/95481/elife-95481-fig4-figsupp2-data2-v1.zip
Additional files
-
Supplementary file 1
Inhibitor sources and validation by mass spectrometry.
- https://cdn.elifesciences.org/articles/95481/elife-95481-supp1-v1.docx
Download links
A two-part list of links to download the article, or parts of the article, in various formats.
Downloads (link to download the article as PDF)
Open citations (links to open the citations from this article in various online reference manager services)
Cite this article (links to download the citations from this article in formats compatible with various reference manager tools)
Allosteric coupling asymmetry mediates paradoxical activation of BRAF by type II inhibitors
eLife 13:RP95481.
https://doi.org/10.7554/eLife.95481.2


