The geometric basis of epithelial convergent extension
- Kavli Institute for Theoretical Physics, University of California, Santa Barbara, United States
- Department of Physics, University of California, Santa Barbara, United States
- Department of Molecular Biology, Princeton University, United States
- The Lewis-Sigler Institute for Integrative Genomics, Princeton University, United States
Figures
Figure 1 with 3 supplements

Light sheet imaging, segmentation, and tracking provide a global picture of the cell-level contributions to tissue flow.
(A) Segmented and tracked cells on the ellipsoidal surface of the early Drosophila embryo in 3D (top) and projected into the plane (bottom) using a cartographic projection (Heemskerk and Streichan, 2015) imaging, segmentation, and tracking data from Stern et al., 2022. Trunk cells are colored in bands along the DV axis to illustrate the major tissue deformations during early development of Drosophila: ventral furrow invagination (VFI, 25 min) and germ band extension (GBE, 45 min). During GBE, the lateral ectoderm (germ band, purple to green regions) contracts along the DV axis and extends along the AP axis, causing its posterior part to move over the pole. The dorsal ectoderm (amnioserosa, red and orange regions) contracts along the AP axis and extends along the DV axis. Cells that get internalized in folds are shaded in dark gray (CF: Cephalic furrow; DF: Dorsal folds; VF: Ventral furrow; PMG: posterior midgut). Only one side of the left-right symmetric embryo is shown but both sides were analyzed throughout the manuscript. (B) Tissue deformation is the sum of cell shape changes (top) and cell rearrangements (bottom). The elementary cell rearrangement is a T1 transition in a quartet of cells: The interface between the red cells collapses, giving rise to a transient fourfold vertex configuration (center); the fourfold vertex then resolves to form a new interface between the blue cells. (C) Colored, tracked cells illustrate cell rearrangement and shape change in the amnioserosa (top) and lateral ectoderm (bottom). While amnioserosa cells show large deformations and little coordination in their rearrangement, cell intercalations in the lateral ectoderm appear highly choreographed. (ROI size ). (D) Convergence and extension of the lateral ectoderm (-fold change defined relative to the minimum length and maximum width, respectively). During VFI, the lateral ectoderm is stretched along the DV axis and slightly contracts along the AP axis. GBE has an initial fast phase before slowing down at around 40 min. (E) and E’ Rate of interface collapses serves as a measure for the cell intercalation rate. During VFI, there are few intercalations. During GBE, a majority of intercalations are T1 transitions, while rosettes – rearrangements involving more than four cells – contribute significantly less to tissue deformation (E’). At 40 min, there is a noticeable drop in the T1 rate, marking the transition to the slow phase of GBE. Intercalation events before do not contribute to tissue flow and were excluded from the subsequent analysis.
Figure 1—figure supplement 1
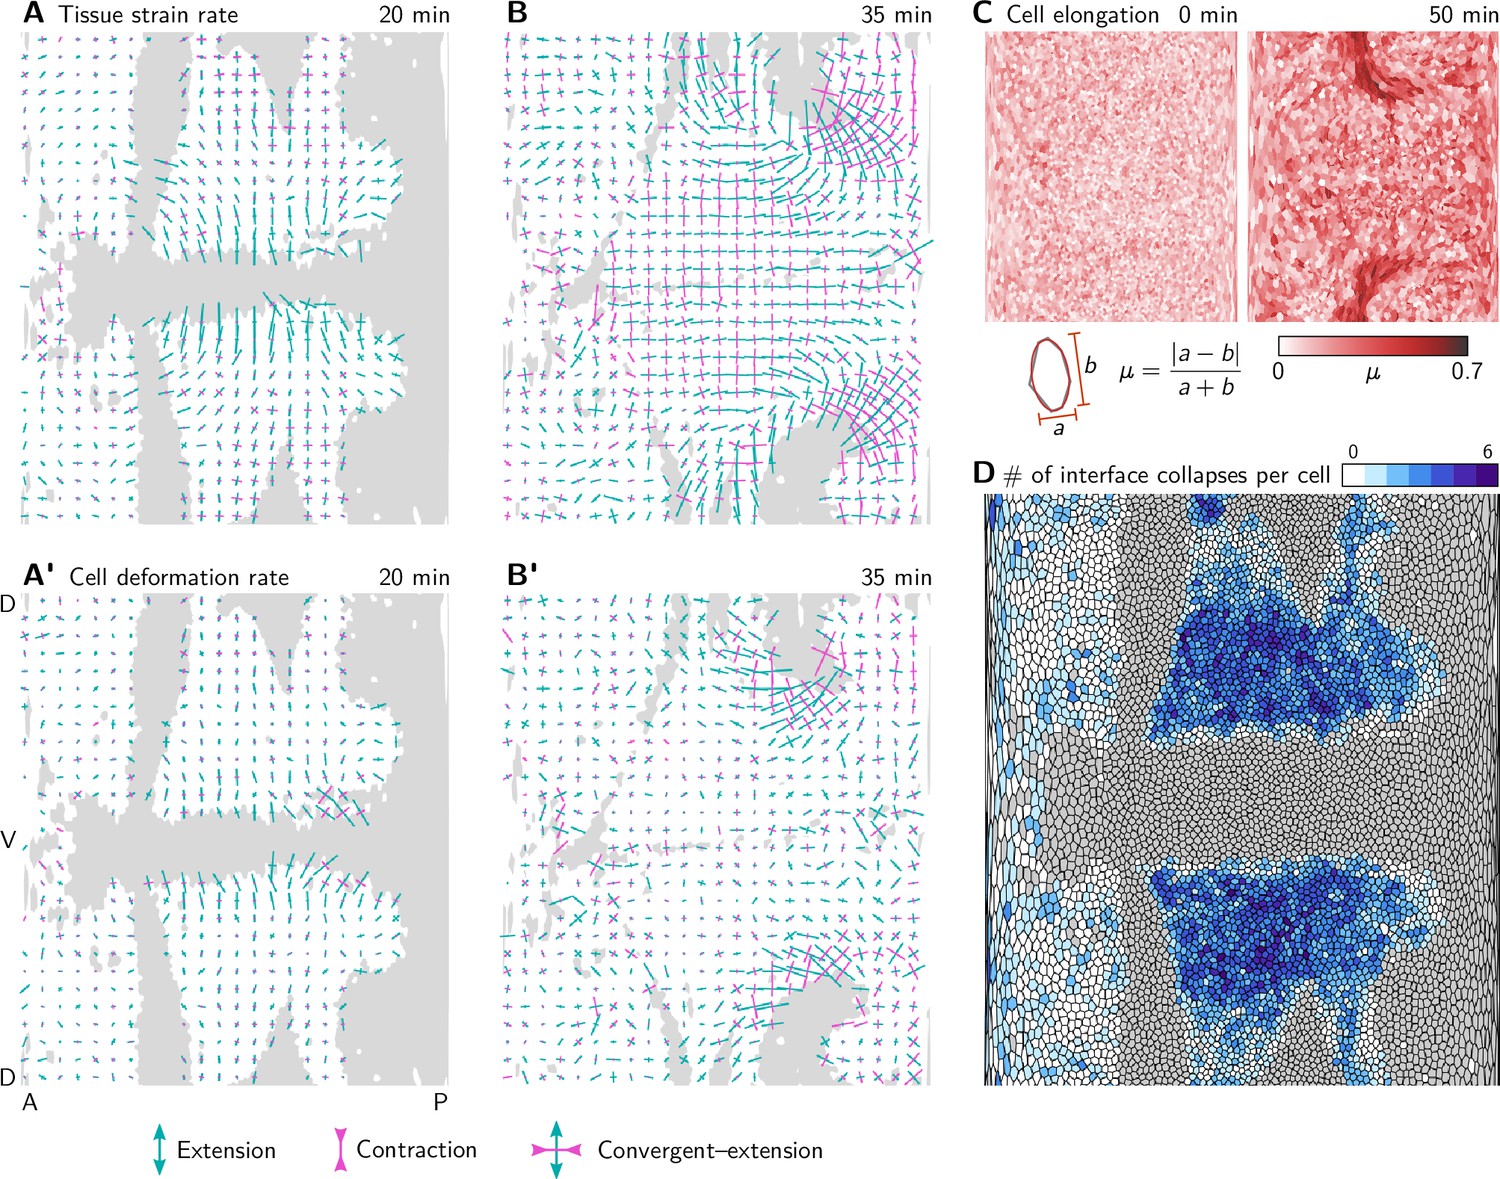
Tissue tectonics quantification.
(A and A’) During VF invagination, the tissue strain rate (A) and cell deformation rate (A’) are high in the lateral ectoderm adjacent to the ventral furrow, where cells get stretched along the DV axis. Crosses show the principal axis of strain averaged in a grid with spacing. Bar length is proportional to the strain rate and color indicates extension (green) and convergence (magenta). (B and B’) During GBE, the tissue strain rate (B) is high in the lateral ectoderm which undergoes convergent extension. The cell deformation rate (B’) there is low, and incoherent implying that the tissue deforms via cell rearrangements. In contrast, near the dorsal pole, both cell deformation and cell rearrangements contribute to tissue strain rate. (C) Cell elongation measured by the Beltrami coefficient µ from the best-fit ellipse. Cells near the dorsal pole become highly elongated. (D) Total number of interface collapses for each cell. Note that in Stern et al., 2022 (the source of the segmentation data), the number of intercalations is calculated as the sum of collapsed interfaces and new interfaces for each cell, leading to counts that are higher by a factor of 2 since almost all interface collapses are resolved by the emergence of a new interface. (Invaginating cells are shown in gray. Strain rates are only shown for cells that do not invaginate).
Figure 1—figure supplement 2
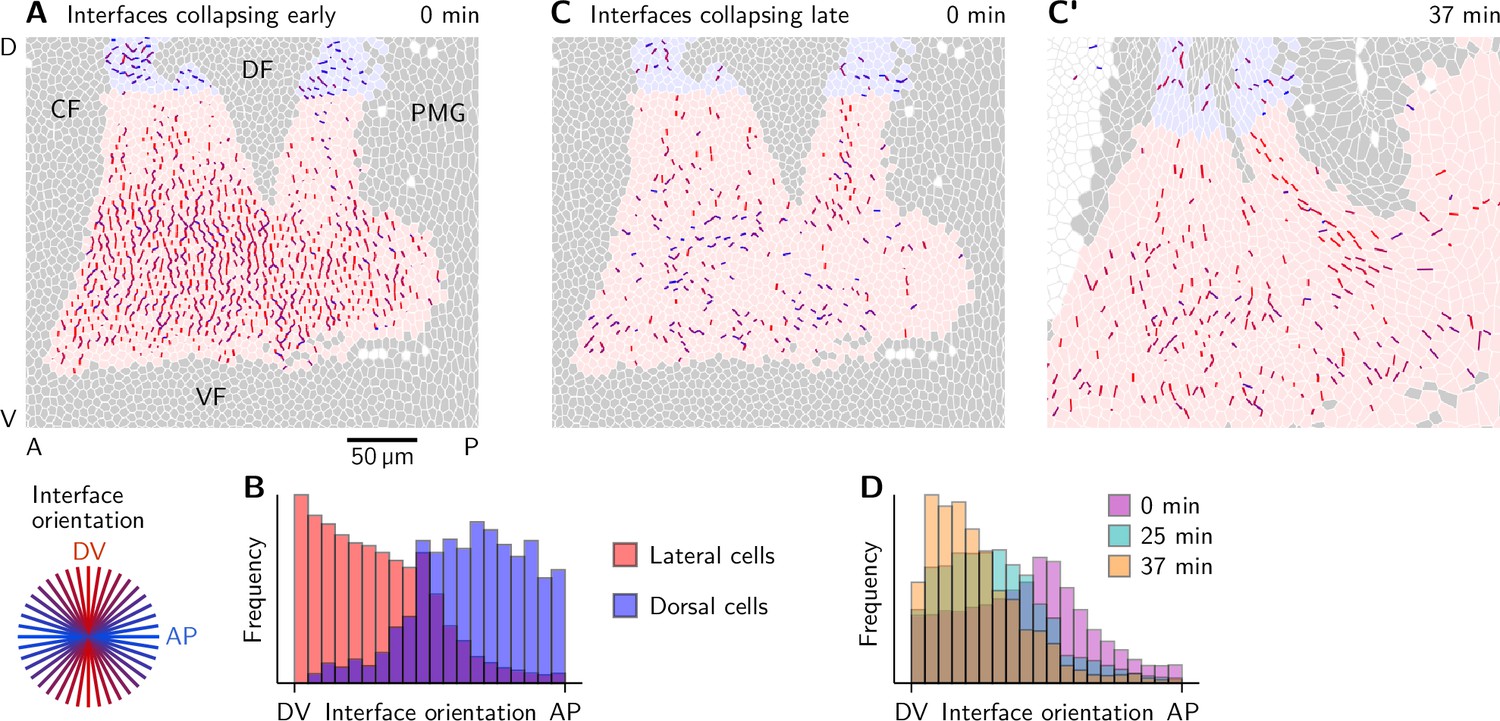
Orientation of collapsing interfaces.
(A and B) Interfaces collapsing early (before ) colored by their orientation at time 0 min (A) and histograms showing the interface orientation (B). Collapsing interfaces near the dorsal pole (shaded blue) are predominantly oriented along the AP axis. In the lateral ectoderm, the orientation is predominantly along the DV axis. (C–D) Interfaces collapsing late (after ) have a low initial orientational bias (C) but progressively align with the co-rotated DV axis before they start contracting (C’).
Figure 1—figure supplement 3

Cell rearrangements preserve AP stripe pattern.
(A) Computationally generated AP-stripe pattern based on the initial cell positions. Cell rearrangements preserve the stripe pattern with high fidelity. The magenta line separates the anterior germ band from the posterior germ band (see C for quantification). (B) Simulation snapshots showing the effect of passive cell rearrangements driven by stretching the cell array by a factor of two in length. Note that the stripes’ boundaries become rough and several cells become completely separated from their original stripe. (C) Quantification of AP-pattern degradation through cell rearrangements (see supplementary text for the definition of the gradient correlation measure). The cumulative number of interfaces lost per cell serves as a pseudo-time for the tissue deformation process. AP pattern information loss in the anterior germ band is slower compared to the passive simulation reference. In the posterior germ band, which moves over the pole of the embryo and thus undergoes significant distortion, AP pattern information is lost at the same rate as in the passive simulation reference.
Figure 2 with 2 supplements
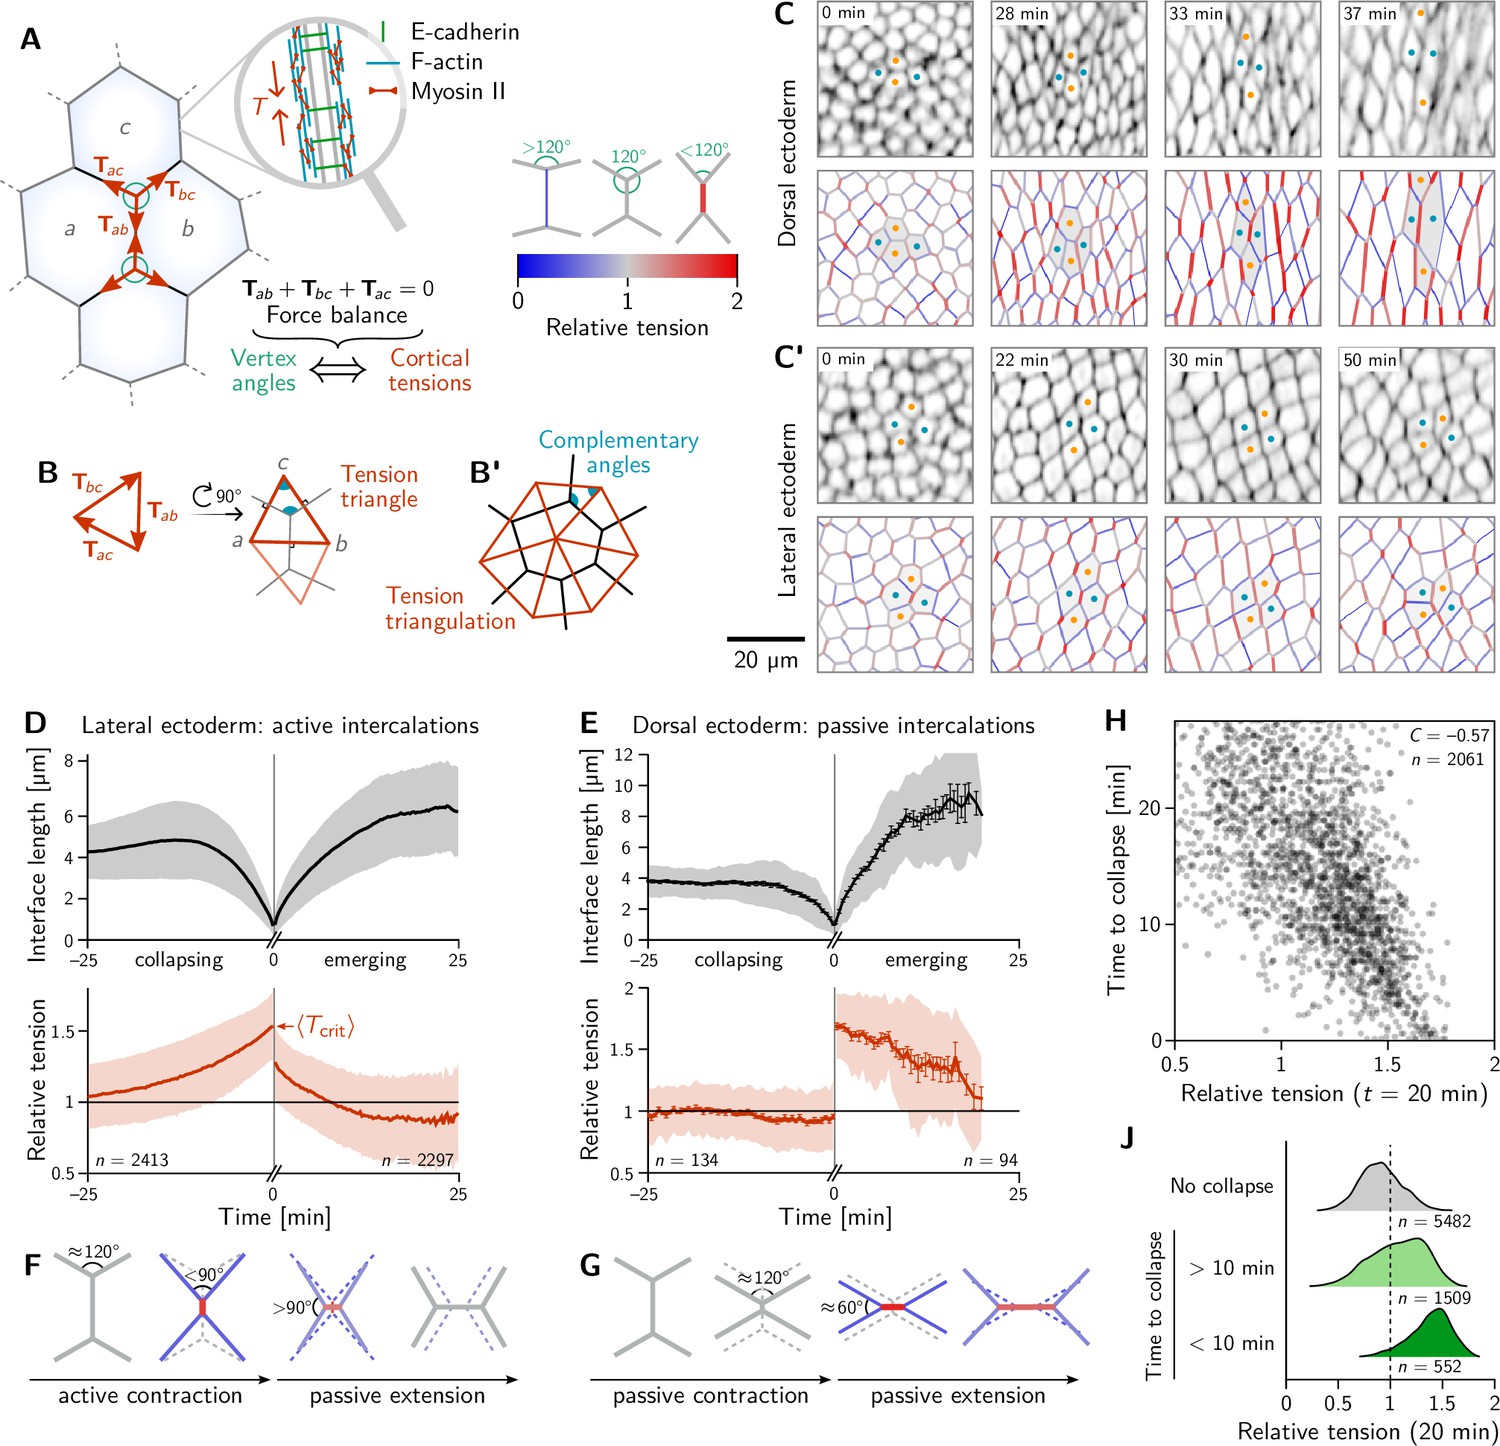
Inferred tension dynamics distinguishes active and passive T1s.
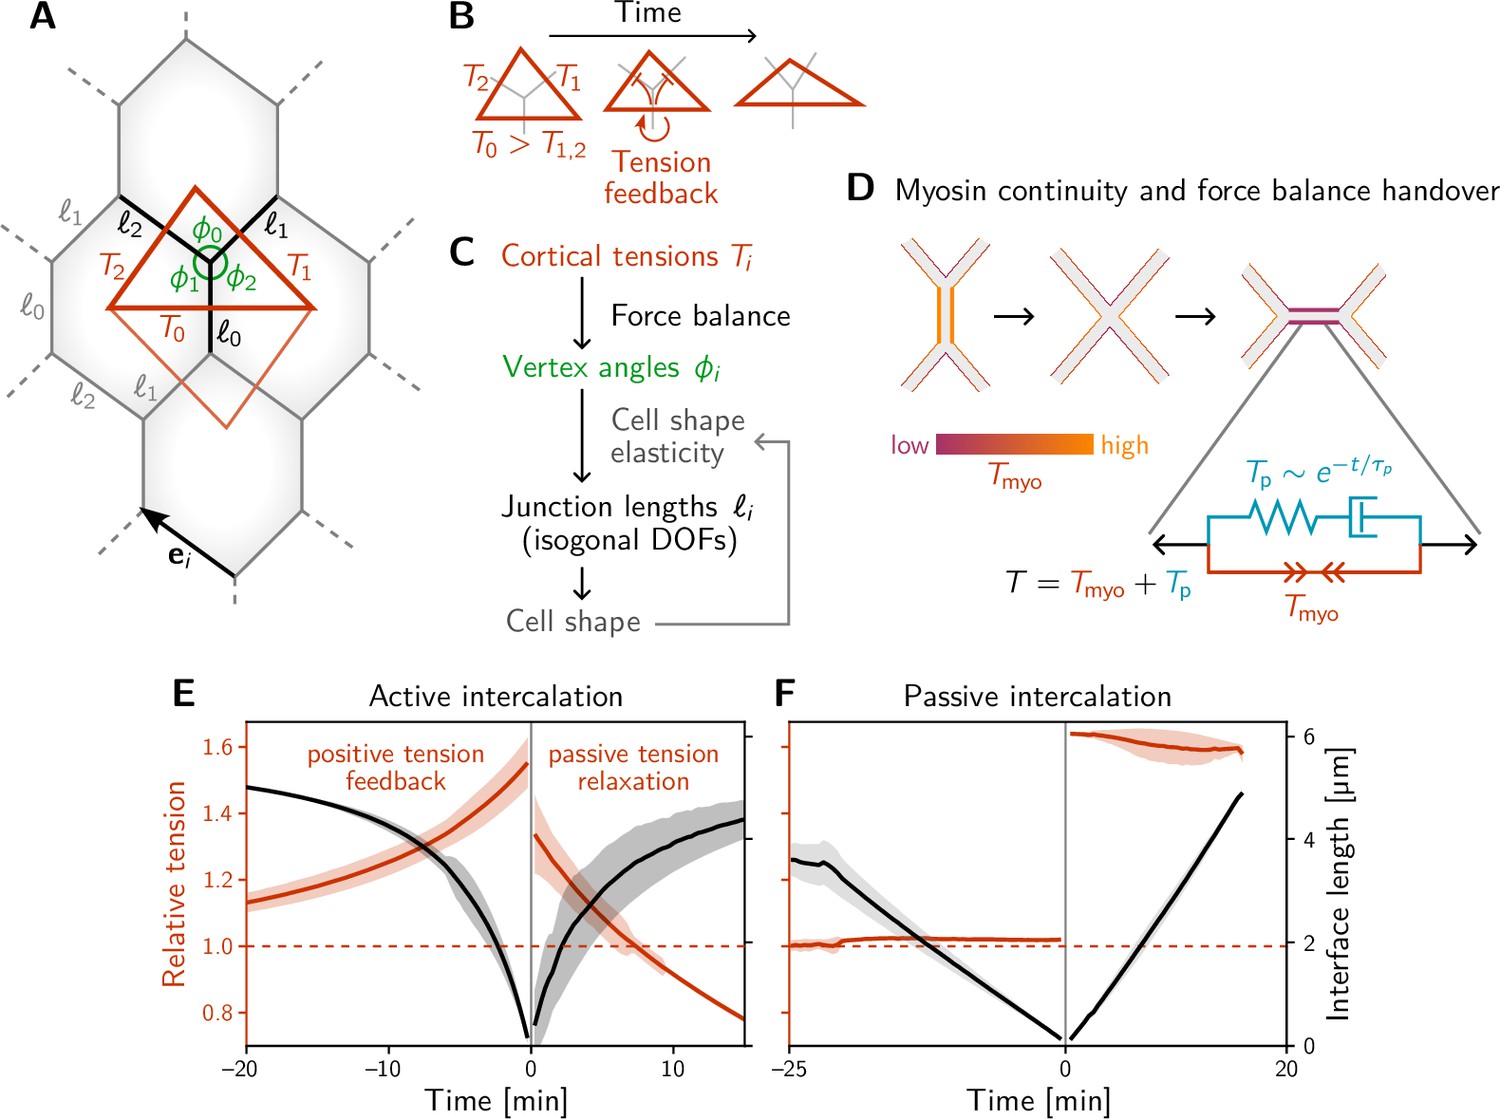
(A) Tension in the cortex at cell-cell interfaces is actively maintained by molecular motors (inset). In force balance, the forces exerted on a vertex (red arrows) must sum to zero, thus relating angles at vertices to the relative tensions. (B and B’) The angles in the tension triangles formed by the force vectors (rotated by 90°) are complementary to the interface angles at the vertex. Tension triangles corresponding to adjacent vertices share an edge and therefore fit together to form a tension triangulation (B’). (C and C’) Relative tensions inferred (bottom) from cell membrane images (top) in the amnioserosa (C) and the lateral ectoderm (C’). In the lateral ectoderm, high-tension interfaces contract. The regular pattern of alternating high and low tension interfaces therefore leads to coordinated T1s (Figure 1C, bottom). Blue and orange dots mark an intercalating cell quartet. (D and E) While active and passive T1s show similar dynamics of the length of the inner edge (top), they are markedly different in their tension dynamics (bottom). Increasing tension on contracting interfaces provides evidence for positive tension feedback in the lateral ectoderm (D). Constant relative tension on contracting tensions in the dorsal ectoderm indicates passive intercalations (E). Tension jumps at time zero result from the relation between the angles before and after the neighbor exchange. Collapsing and emerging interfaces were tracked and analyzed separately (see Appendix 1.3). Bands and fences show SD and SEM, respectively; the SEM in (D) is smaller than the line thickness. (F) Increasing tension on an actively contracting interface causes the angles opposite of it to become increasingly acute. (G) Constant cortical tensions (and thus vertex angles) before the neighbor exchange are the hallmarks of passive T1s. This geometrically determines the vertex angles after the neighbor exchange, such that the emerging interface is under high tension. (H and J) In the lateral ectoderm, relative tension predicts the time until an interface collapses (H) and high relative tension predicts which interfaces collapse (J). Relative tensions were averaged from 20–21 min (over four timepoints), i.e., at the end of ventral furrow invagination (VFI) (Figure 1E).
Figure 2—figure supplement 1
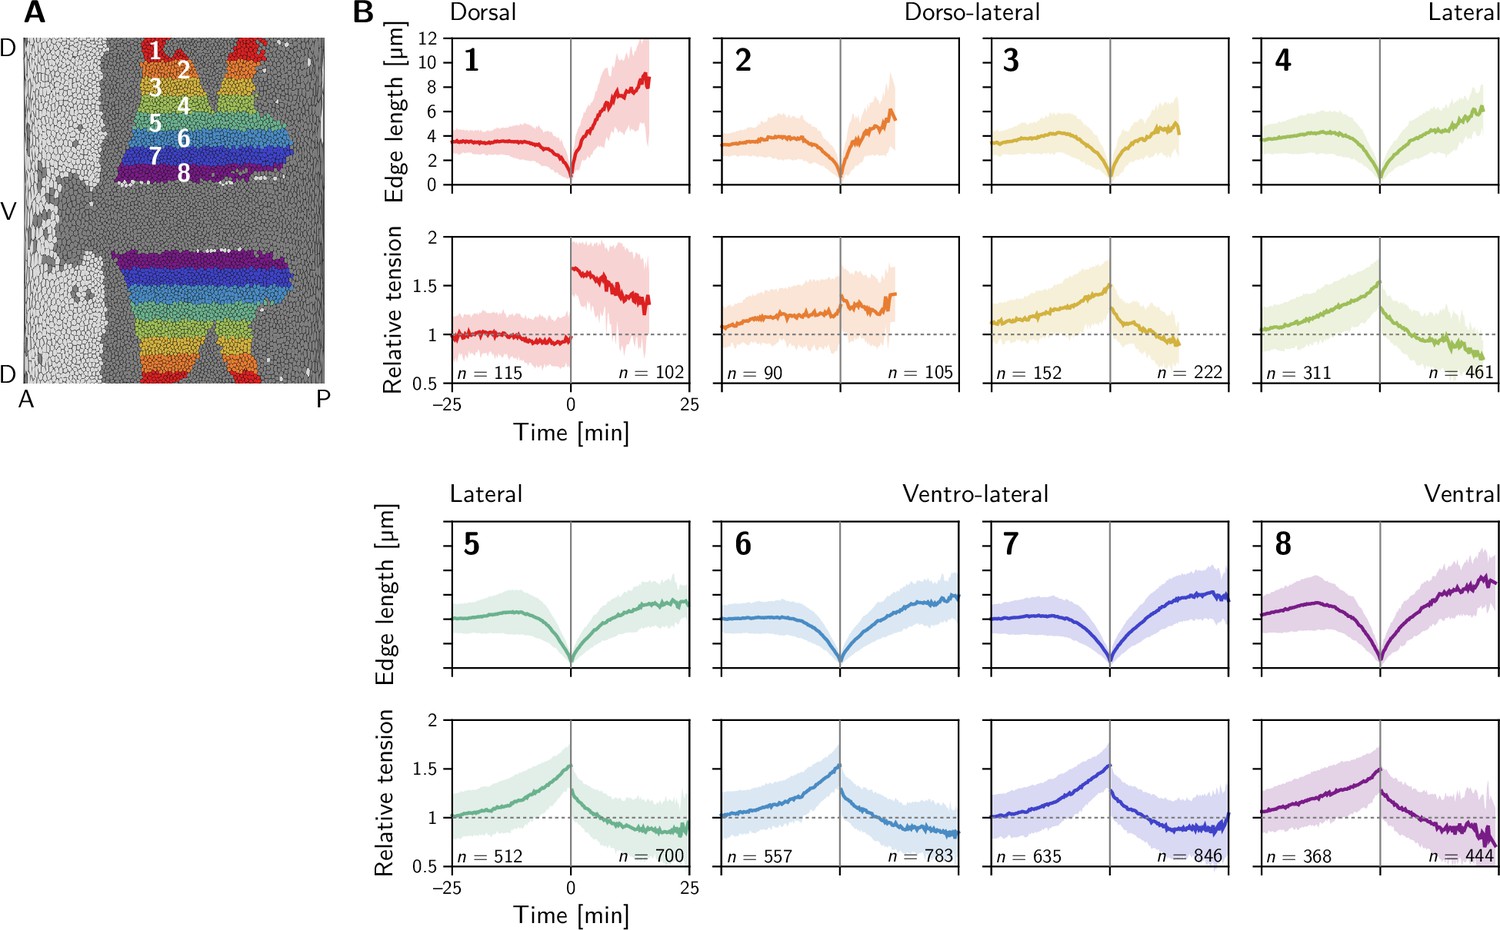
Quartet analysis resolved by DV position.
Two distinct classes of behavior are found: in the dorsal-most region (1), the relative tension remains constant at one on the contracting interface and jumps to a high value () on the collapsing interface where it slowly relaxes back towards one. In contrast in the lateral ectoderm (regions 3–8), relative tension increases nonlinearly during interface contraction while the tension on the emerging interface starts at a lower value and rapidly relaxes to a value below one. Region 2 is an exception and appears to fall between the two above cases. Collapsing and emerging interfaces were analyzed separately, such that the numbers of events do not match exactly between them. Events are counted as part of a stripe when at least one of the two cells that come into contact comes from that stripe. Because cells converge along the DV axis in the lateral ectoderm, this implies that many interface emergence events are double counted there which inflates the number of emergence events relative to the collapse events.
Figure 2—figure supplement 2

Relative tension does not correlate to interface collapses in the amnioserosa.
Figure 3 with 1 supplement
A minimal model for positive tension feedback reproduces the signatures of active T1s and creates passive T1s when feedback is turned off.
(A) A single quartet of identical cells forms the elementary setting for modeling T1s. This geometry is characterized by two vertex angles (, and ) and three interface lengths (). The interface angles are determined by the pair of identical tension triangles corresponding to the cell quartet. To avoid boundary effects, the cell quartet and tension triangles are set up to tile the plane periodically as a regular lattice. (B) Positive tension feedback causes the longest edge in a tension triangle to grow at the expense of the shorter two edges, thus deforming the triangle to become increasingly obtuse (We fix the total tension scale. In real cells, the overall tension scale is set by the available myosin pool. Relative tensions change as myosin is redistributed between the cortex at different interfaces). (C) The tension triangle shape determines the vertex angles, . To fix the interface lengths , we determine the cell shape by minimizing an elastic cell-shape energy while keeping angles fixed (see Appendix 5 for details). (D) Two-sided architecture of junctional cortex determines the myosin level on the newly formed interface. Sketch of intercalating quartet with myosin in each cell’s cortex color-coded. After a neighbor exchange, the active tension (i.e. myosin level) on the new edge is determined by a ‘handover’ mechanism that assumes continuity of myosin concentration at vertices within each cell. As a consequence, the active tension on the new edge right after the neighbor exchange is below the total tension that is determined by geometry. This tension imbalance causes the new edge to extend by remodeling. To capture the remodeling, we introduce a passive viscoelastic tension due to passive cortical crosslinkers. decays exponentially with a characteristic remodeling time . Notably, no additional active ingredients (like medial myosin contractility) are required to drive the extension of the new edge. (E and F) The model reproduces the signatures of active and passive T1s observed in the Drosophila embryo. The tension feedback rate and passive relaxation rate are fitted to match the observed timescales. (Bands show the standard deviation from an ensemble of simulations with initial angles drawn from the experimental vertex angle distribution at 0 min.).
Figure 3—figure supplement 1

Additional quantification of single-quartet simulations.
(A and B) Tension–isogonal decomposition of cell quartet shape during active (A) and passive (B) T1s in the single-quartet model (same simulations as Figure 3E–F). (C) Geometry of a quartet of identical cells and the corresponding tension triangles (red) parametrized by the angles . (D) Comparison of different cell shape elastic energies which determine the cell interface lengths as a function of the angles . The plot shows the inner interface length for a left-right symmetric quartet (i.e. an isosceles tension triangle) where . For reference, the inner interface length for a Voronoi tessellation based on the tension triangles is shown (dashed black line). The interface length obtained by minimizing elastic energy Equation 2 with isotropic target shape (solid black line) closely follows the reference Voronoi length and vanishes at the same critical angle. By contrast, minimizing the ‘area-perimeter’ energy of the vertex-model gives an interface length (dot-dashed black line) that vanishes only for and the elastic energy diverges in this limit (dashed green line). This implies that tension dynamics, changing the angles at vertices, cannot drive T1s for this choice of elastic energy in the absence of noise.
Figure 4 with 1 supplement
Tension–isogonal decomposition of epithelial geometry identifies active (tension-driven) and passive contributions to tissue deformation.
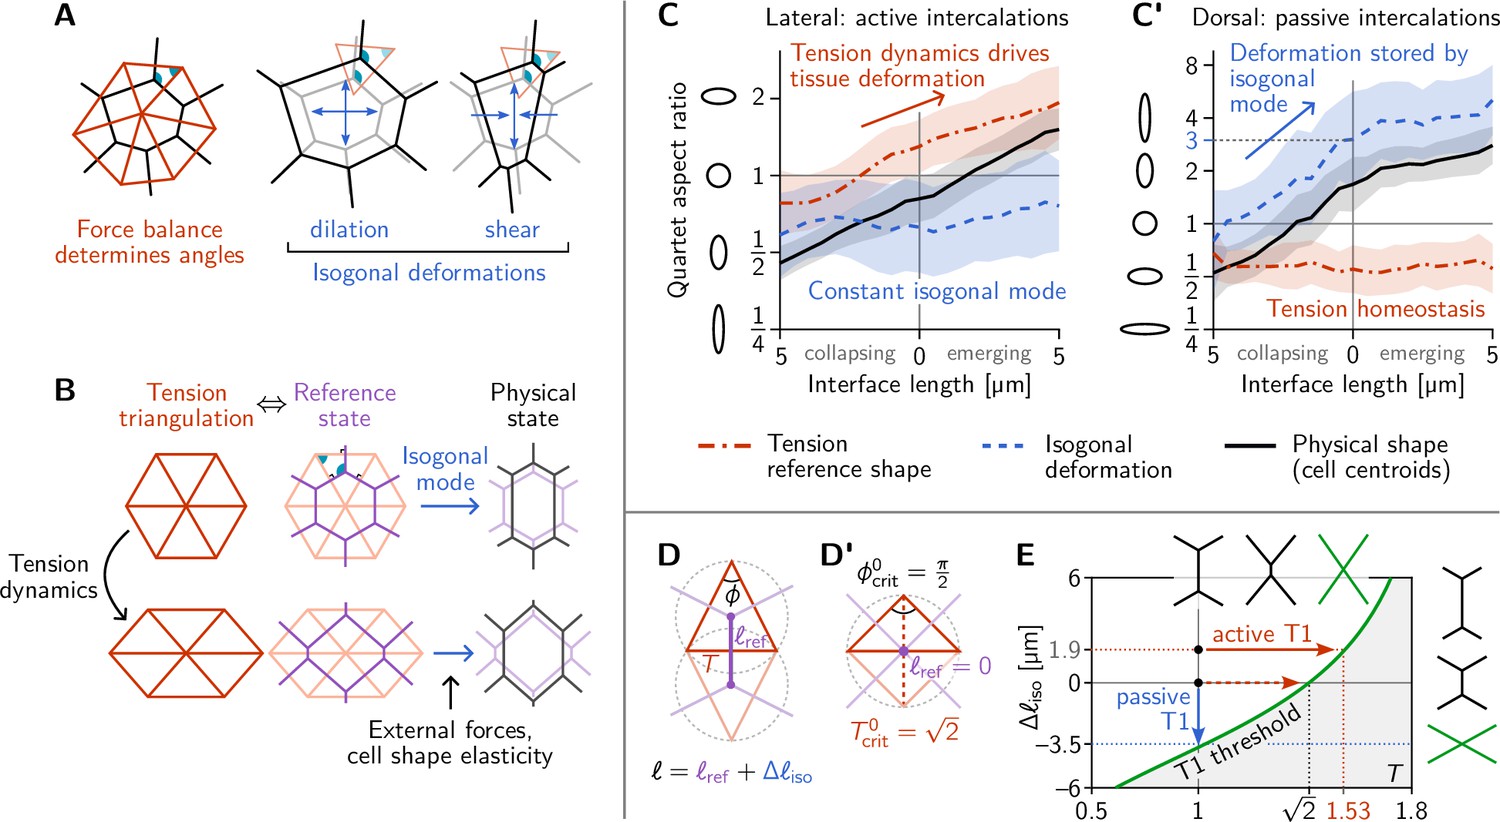
(A) The angles in the tension triangulation (red) are complementary to those in the cell array (black) (left). The triangulation acts as a scaffold that leaves freedom for isogonal (angle preserving) deformations which encompass both dilation (center) and shear (right). (B) Deformations of the physical cell array (black, right) can be decomposed into deformations of the tension triangulation (red, left) and isogonal deformations (blue). The former reflect the dynamics of cortical tensions while the latter reflect the effect of external forces and cell shape elasticity. A reference cell array (purple, e.g. a Voronoi tessellation) constructed from the tension triangulation serves as an intermediate relative to which the isogonal deformations are defined. (C and C’) Quartet shape (aspect ratio) and stretch ratio of the isogonal deformation plotted against the length of the quartet’s inner interface, which serves as a pseudo-time parametrization of the T1 process. An aspect ratio of 1 indicates an isotropic quartet shape and no isogonal deformation, respectively. Active T1s (left), are driven by a deformation of the tension triangulation while the isogonal mode remains constant. Passive T1s (right), are driven by isogonal deformations while the shape of the tension triangulation remains constant. Bands indicate SD; SEM is smaller than the line width. (D) A symmetric pair of tension triangles is characterized by a single angle . The cell quartet’s central interface in the Voronoi reference configuration (purple) connects the centers of the triangles’ circumcircles (dashed gray circles). The general case of asymmetric triangles, characterized by two internal angles, is discussed in the companion paper (Claussen et al., 2024). (D’) The circumcircles coincide when . In this case, the two isosceles tension triangles form a square such that we can read off the critical tension from the diagonal length . (E) T1 threshold for symmetric cell quartets in the - plane found by solving Equation 3 with for a symmetric quartet as illustrated in (D). The threshold can be reached by isogonal contraction under constant relative tension (blue arrow) or by active contraction under increasing relative tension (red arrow).
Figure 4—figure supplement 1
Additional quantification of cell quartet dynamics using the tension-isogonal decomposition.
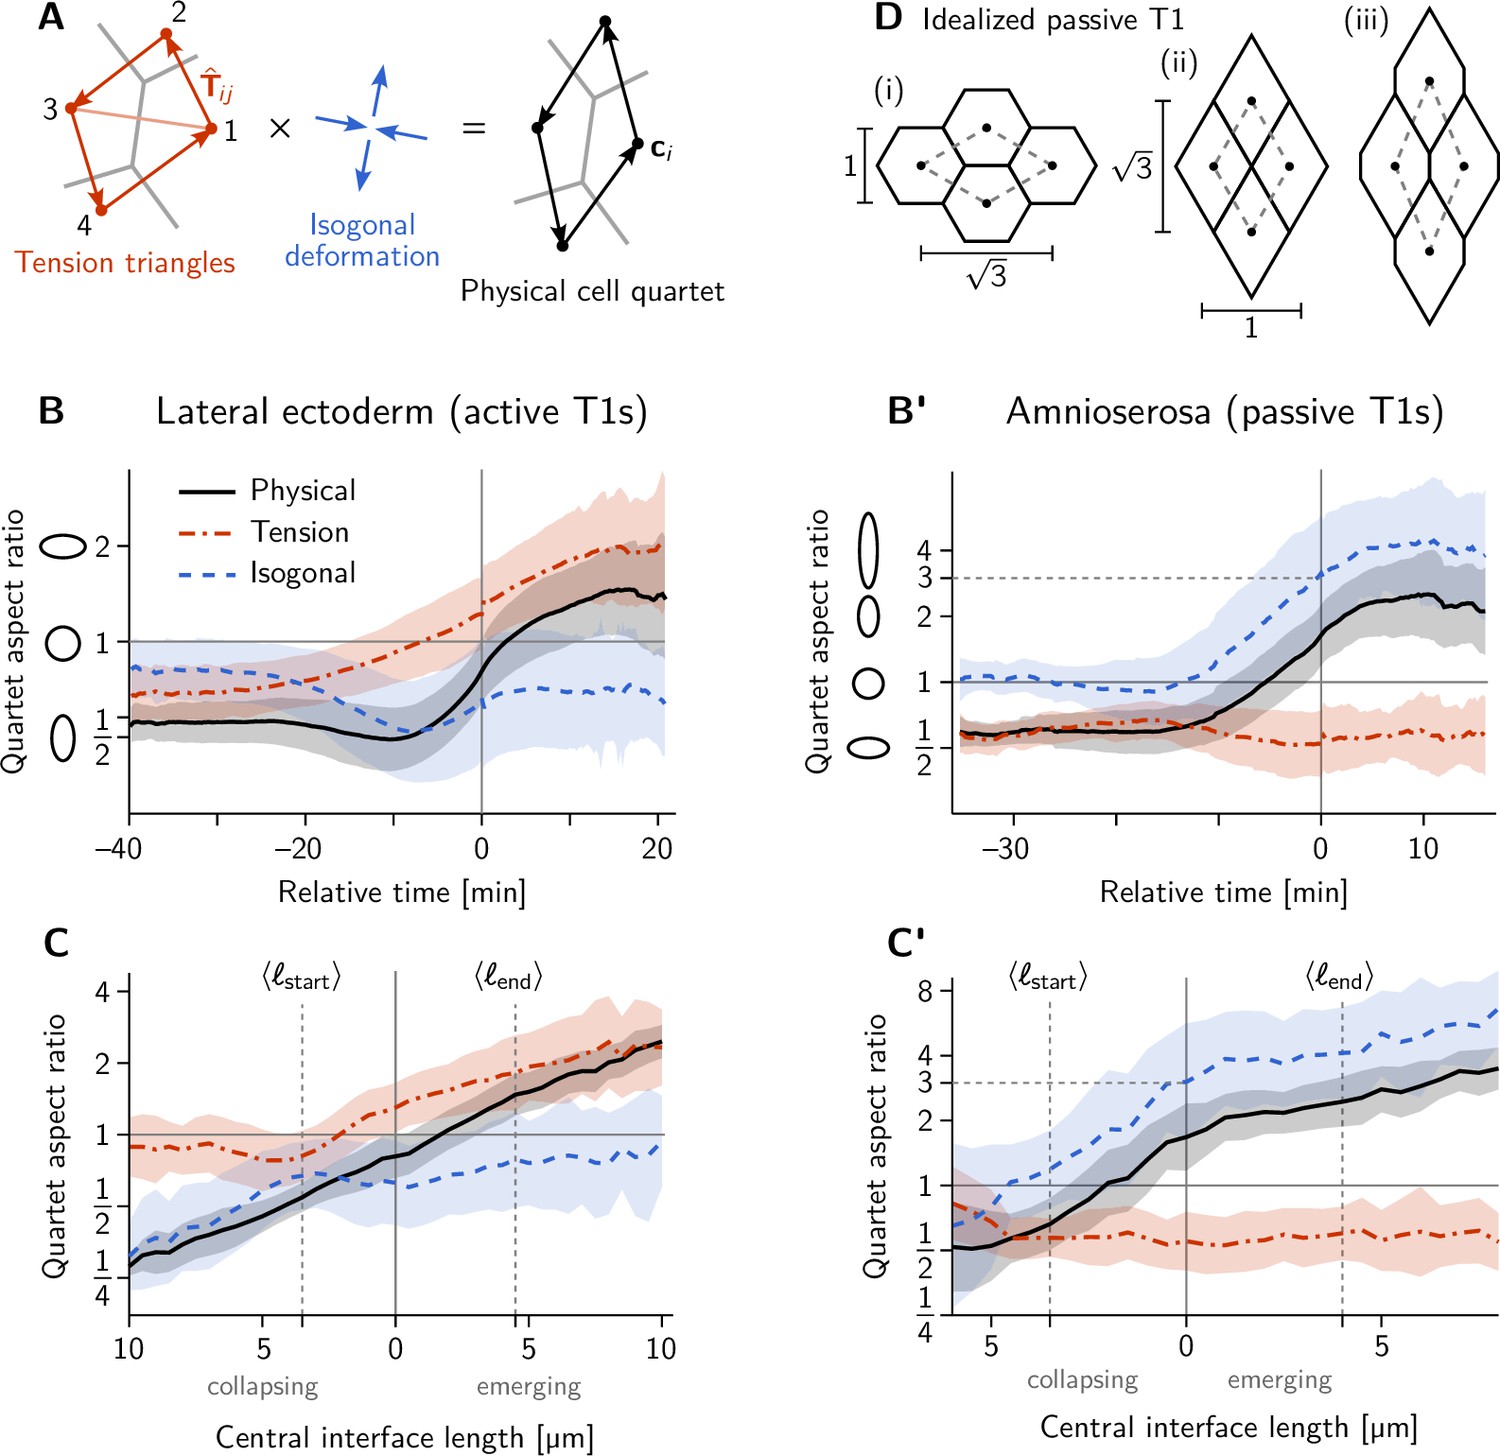
(A) The isogonal deformation for a cell quartet is defined as the tensor that deforms the ‘kite’ formed by the tension vectors into the corresponding centroidal kite, formed from the cell centroids . The indices label the four cell pairs going around the kite: (12), (23), (34), (41). (B–C’) Quartet aspect ratio and eigenvalue ratio of the isogonal deformation tensor as a function of time relative to the T1 event (B and B’) and as a function of the central interface’s length (C and C’). The isogonal deformation is seen in B from –20 to 10 min and in C for collapsing edge lengths is driven by the VF invagination which stretches the germ band. (D) Passive intercalation of an idealized cell quartet composed of regular hexagons: (i) initial configuration; (ii) fourfold vertex configuration after area-preserving isogonal shear changing the aspect ratio by a factor 3; (iii) further isogonal deformation after the neighbor exchange. Black disks mark the cell centroids used to define the quartet shape (see A).
Figure 5

Tissue scale tension anisotropy matches orientation of convergent extension flow.
(A) Local anisotropy of tension (double-ended arrow) at a single tri-cellular vertex. (B) Tension anisotropy at the end of VF invagination/onset of GBE (25 min) locally averaged on a grid with spacing. Line segments indicate the local orientation and magnitude (length and color of the line segments) of tension anisotropy. (C) Mean DV component of locally averaged anisotropic tension in the trunk (green region in B) (DV component measured along a fixed axis orthogonal to the long axis of the embryo; SE is smaller than the line width). (D) Significant DV alignment of the tension orientation in the trunk precedes any tissue flow, while the tension in the head shows no orientation bias (0 min). The DV alignment of tension slightly increases during VF invagination (25 min) and decreases during GBE (37 min).
Figure 6 with 1 supplement

Tissue scale quantification of isogonal strain identifies regions of passive tissue deformation.
(A) Tension-isogonal decomposition at a single tri-cellular vertex. The isogonal strain tensor (illustrated by blue arrows) transforms the tension triangle (solid red lines) into the centroidal triangle (dashed black lines). (B and B’) Isogonal strain at the end of VF invagination (25 min, B) and during GBE (37 min, B’) averaged over vertices in a grid with spacing. High isogonal strain in the tissue adjacent to the VF at 25 min (dashed black rectangle) and in the amnioserosa (AS, dashed black outline) at 37 min indicate passive tissue deformations in these regions. High isogonal strain is also found at the front of the invaginating posterior midgut (PMG, dotted outline). Crosses indicate the principal axes of isogonal strain. Bar lengths indicate the magnitude of strain (green: extensile, magenta: contractile). Colored tissue regions are quantified in (C). (C) Time traces of the DV component of isogonal strain. The isogonal (i.e. passive) stretching of the tissue adjacent to the VF (purple) is transient. The lateral ectoderm as a whole (green and blue) is stretched weakly, but persistently. The amnioserosa (red) is strongly stretched as the lateral ectoderm contracts along the DV axis during GBE (DV component is defined with respect to the local co-rotating frame, see SI; Shaded bands show one SD; SEM is comparable to the line width). Figure 6—figure supplement 1. Illustration and additional quantification of tissue-scale tension-isogonal decomposition.
Figure 6—figure supplement 1
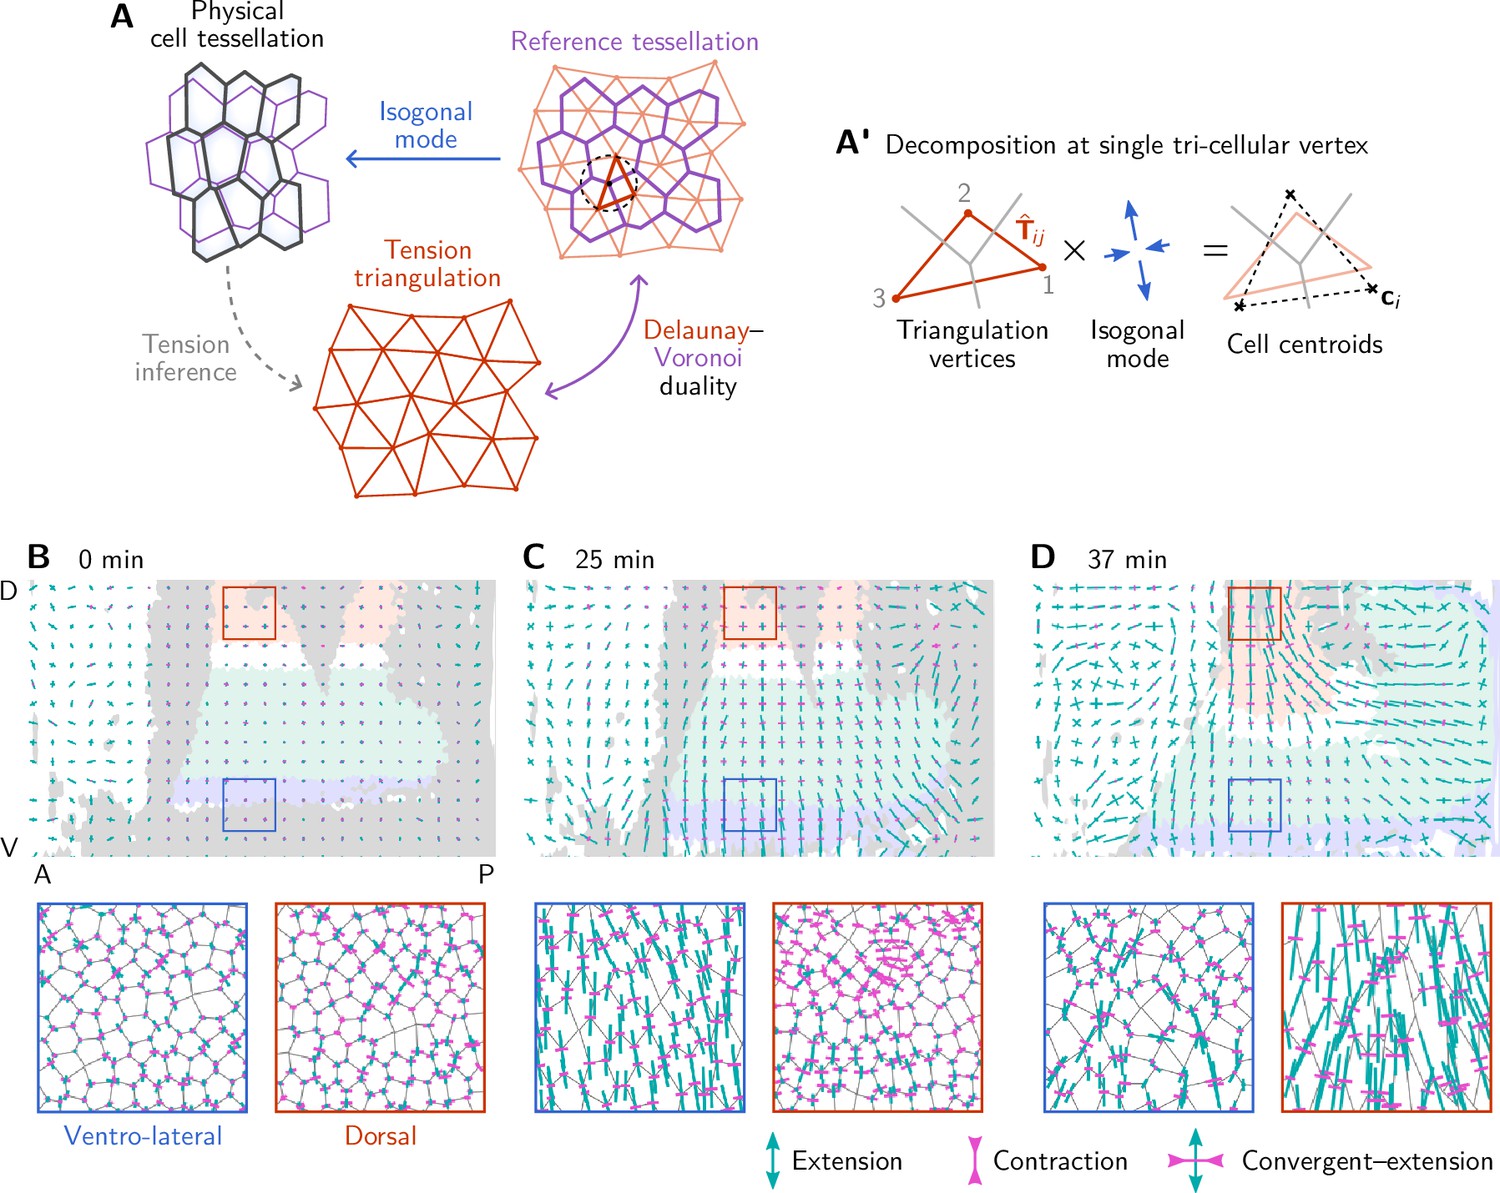
Illustration and additional quantification of tissue-scale tension-isogonal decomposition.
(A) To a given tension triangulation (red), a corresponding dual cell array is obtained via the Voronoi construction (purple), which is based on the circumcircles of the triangles. Because the tension triangulation fixes only the angles, it leaves freedom for isogonal (angle-preserving) modes that collectively change the interface lengths. Deformations of the tissue can be decomposed into deformations of the tension triangulation and isogonal deformations. A’ The tension–isogonal decomposition at a single vertex based on the tension triangulation vectors and the cell centroids . The indices label the three cells that meet at the vertex. (B–D) Coarse-grained isogonal strain (top) and isogonal strain at individual vertices (insets) for different time points. The initial isogonal strain (B) is minimized to fix the scale factor . During VF invagination, the lateral ectoderm close to the ventral furrow is stretched (C). During germ band extension (GBE), the isogonal strain in the lateral ectoderm remains approximately constant while the amnioserosa gets stretched. Crosses show the principal axes of the local isogonal strain tensor. Bar length indicates the amount of strain (green = extension, magenta = contraction). Coarse-grained strain tensors were averaged on a grid with a spacing of . Insets show regions with a size of .
Figure 7 with 1 supplement

The relative tension threshold for T1s is shifted in a snail mutant.
(A) In a wild-type (WT) embryo (left), the invaginating ventral furrow (green) stretches the lateral ectoderm (red) along the DV axis prior to germ band extension (GBE). In a snail mutant (right), the ventral furrow is abolished, such that no DV-stretch of the lateral ectoderm occurs. (B) In a snail mutant, the T1 threshold of active T1s in the lateral ectoderm is shifted to the value predicted by our model in the absence of isogonal deformation (Figure 4E). Figure 7—figure supplement 1. Quantification of isogonal strain in a snail mutant.
Figure 7—figure supplement 1
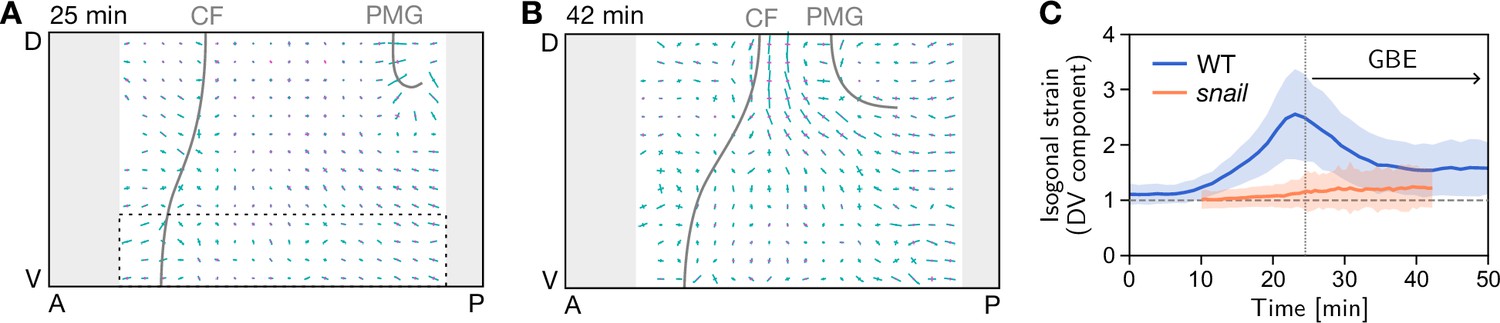
Quantification of isogonal strain in a snail mutant.
(A) At the onset of germ band extension (GBE) (25 min) there is no isogonal strain in the lateral ectoderm, in particular the most ventral region (dashed box), where large isogonal strain is found in the wild-type (WT) (Figure 6B). Gray lines mark the cephalic furrow (CF) and the invagination front of the posterior midgut (PMG). (B) Towards the end of GBE (42 min), significant isogonal strain has built up near the dorsal pole (amnioserosa), similar to the WT (Figure 6B’). (C) DV component of isogonal strain in the ventral ectoderm (dashed box in A). (Gray regions near the anterior and posterior pole were excluded from the image segmentation.)
Figure 8 with 2 supplements

Emergence and loss of order in local tension configurations.
(A) Distinct configurations of tension are found on the cell scale: ‘Tension bridges,’ characterized by a high-tension interface connected to four low-tension interfaces, are the local motif of an alternating pattern of high and low tensions. This alternating pattern gives rise to coordinated T1s as the high-tension interfaces collapse, driven by positive tension feedback. By contrast, tension cables, characterized by multiple adjacent high-tension interfaces, cause frustrated or incoherent T1s which manifest as rosettes. (B) Space of local tension configurations at a single vertex (quantified by the tension triangle shape, see Claussen et al., 2024 and Appendix 4 for details). The dashed lines indicate the ‘T1 thresholds’ in the absence of isogonal strain (orange line, ‘snail’) and for the average isogonal strain in the wild-type (WT) embryo’s germ band (blue line). This threshold is at a lower anisotropy magnitude for tension bridges than for tension cables, indicating that the former are more efficient at driving active intercalations. (C) Distribution of tension configurations defines an order parameter that quantifies the relative abundance of tension cables and bridges in the lateral ectoderm. Arrows highlight the increasing fraction of tension bridges before germ band extension (GBE) (0–25 min) and its decrease during GBE (25–50 min). (D) Median of the bridge-vs-cable parameter in the lateral ectoderm of the WT embryo (blue line) and the snail embryo (orange line). (The initiation of cephalic furrow invagination was used for temporal alignment. Shading shows SD; SEM is smaller than the line width). Figure 8—figure supplement 1. Quantification of local tension configurations in terms of tension triangle shape. Figure 8—figure supplement 2. Shape statistics of a random Delaunay triangulation.
Figure 8—figure supplement 1
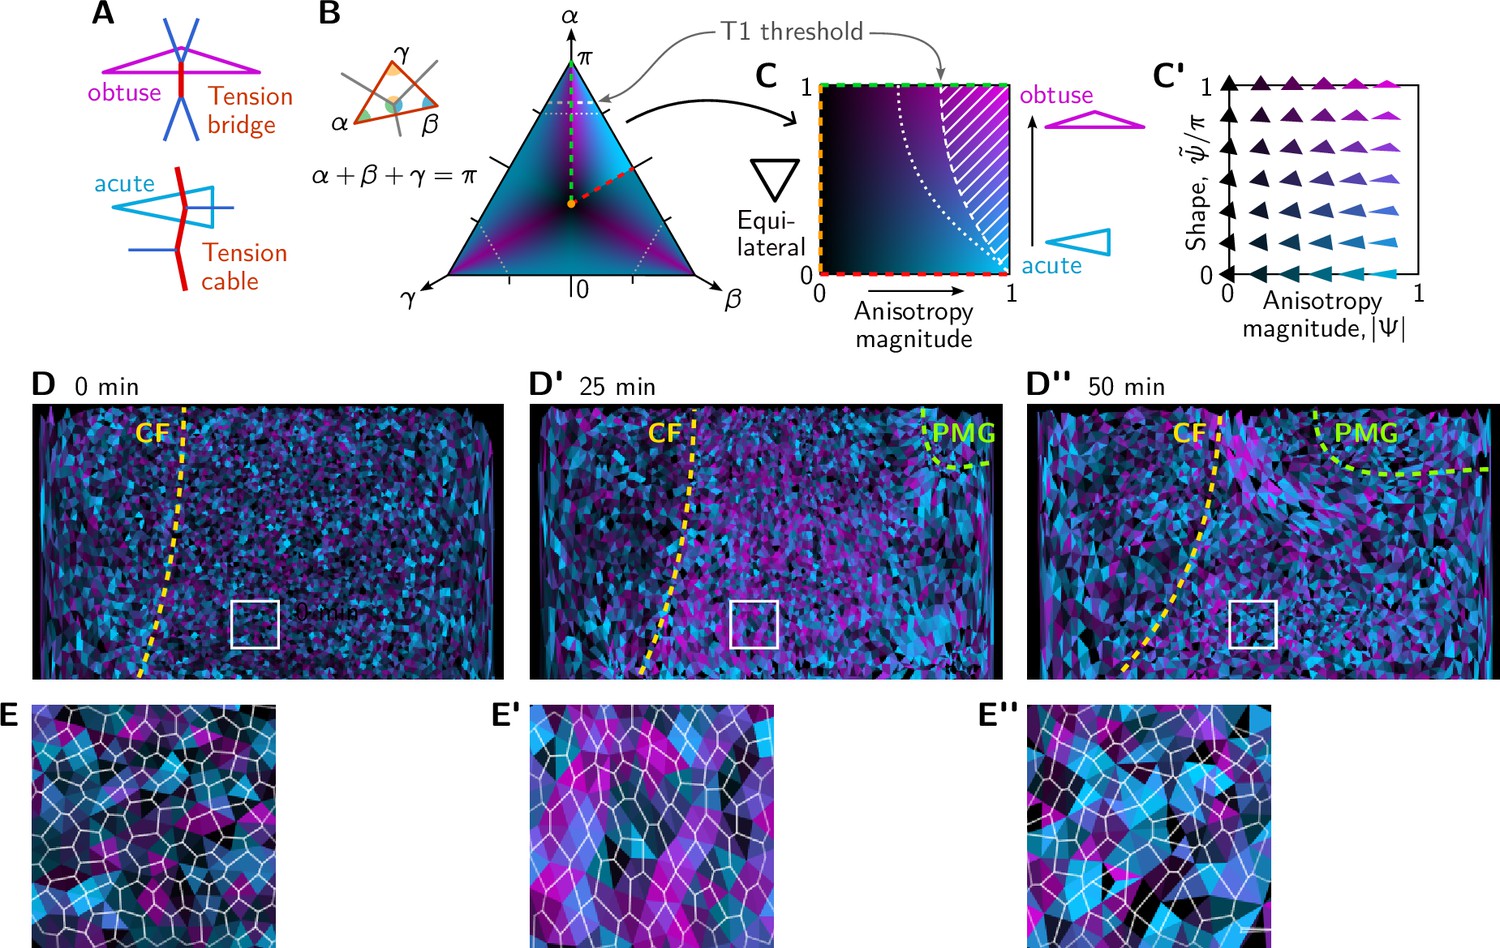
Quantification of local tension configurations (LTC) in terms of tension triangle shape.
(A) Tension triangle shape characterizes the local tension configuration. (B) Space of triangles in barycentric coordinates using the angles . The color indicates the degree of acuteness vs obtuseness by hue from cyan to magenta and the magnitude of anisotropy by brightness (see text for details). A single fundamental domain is highlighted. The remaining shape space is composed of rotated and reflected copies of this fundamental domain, corresponding to permutations of the angles . Dashed white lines indicate the threshold for neighbor exchanges based on the (generalized) Delaunay condition for pairs of identical tension triangles (Claussen et al., 2024). (C and C’) Triangle shape space spanned by the anisotropy magnitude and acute-vs-obtuse parameter as axes. See main text for the definitions of and . (D–D”) Snapshots showing the tension configuration at the onset of germ band extension (GBE). For each vertex, a triangle is drawn between the centroids of the adjacent cells and colored according to the tension triangle associated with the vertex. Yellow and green lines mark the cephalic furrow (CF) and the boundary of the posterior midgut (PMG), respectively. (E–E”) Blowups of the white square in (D–D”).
Figure 8—figure supplement 2

Shape statistics of a random Delaunay triangulation.
(A) Example of a random Delaunay triangulation seeded by a Ginibre random point process. Triangles have been colored according to the shape parameters (Figure 8—figure supplement 1C). (B and C) Histograms showing the triangle shape distribution for the Ginibre-based random Delaunay triangulation (B), tension triangles from the lateral ectoderm at the end of germ band extension (GBE) (C, Figure 8C). (D) Initial and final angle distributions in the lateral ectoderm compared to a random Delaunay triangulation. The initial distribution matches a perturbed equilateral triangular lattice.
Figure 9
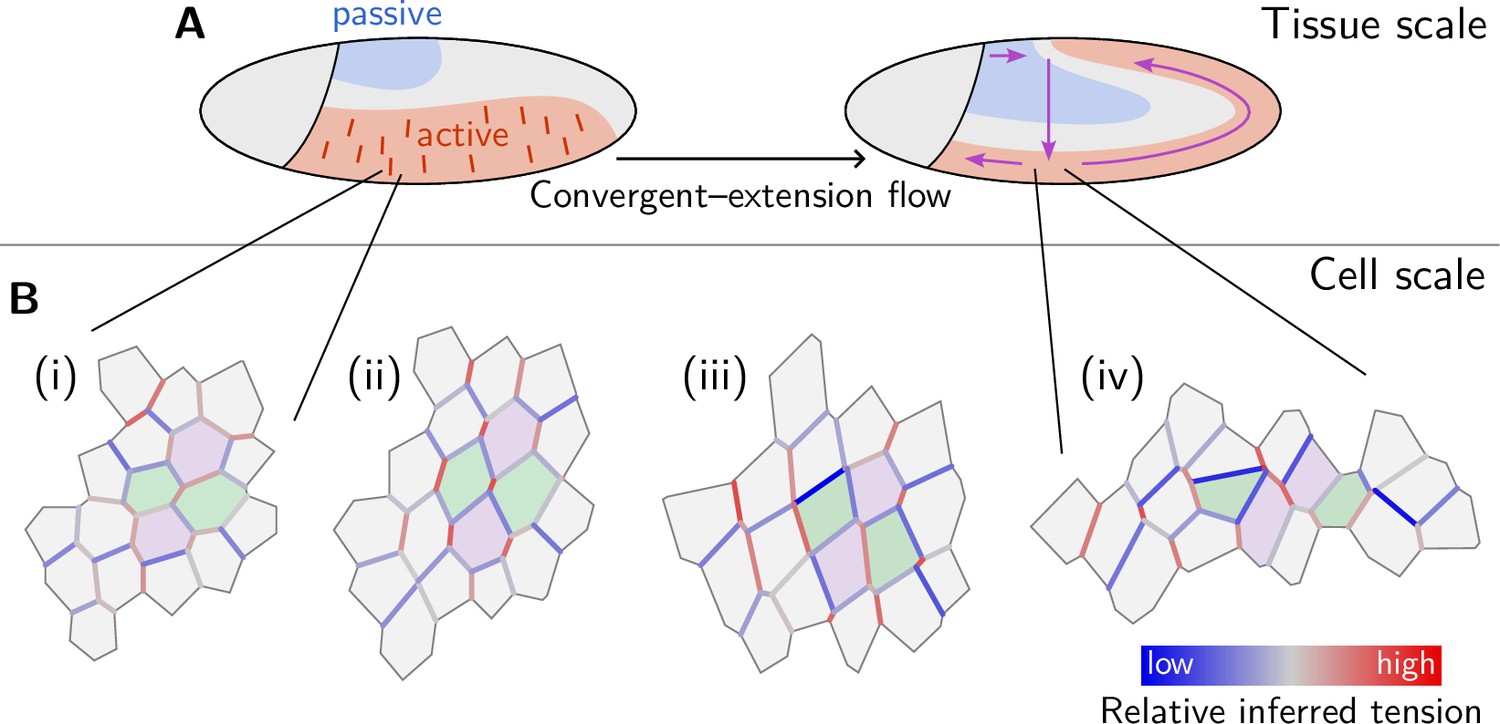
Mechanical coordination of convergent extension flow on the tissue and cell scale.
(A) Dorso-ventral patterning of mechanical properties and tension anisotropy (red lines) organize and orient tissue flow. (B) A cell scale pattern of tensions coordinates active cell intercalations that drive convergent extension of the lateral ectoderm. From relatively uniform but weakly anisotropic initial tensions (i), an alternating pattern of high and low tensions emerges (ii). Subsequently, high-tension interfaces fully contract thereby driving parallel active T1 transitions (iii). As T1s proceed, the order in the tension configurations is lost, and convergent extension flow cedes (iv).
Appendix 1—figure 1

Local basis vectors aligned with the initial AP (blue) and DV (red) directions.
On the right (35 min), the basis vectors have been advected with the tissue flow, i.e., they are the local Lagrangian basis vectors. Note that in the pullback maps, the basis vectors appear distorted near the poles because the projection is not angle- or length-preserving. In figures showing the magnitudes and orientations of anisotropic quantities such as strain and tension this distortion has been removed (Figure 5, Figure 6, Figure 1—figure supplement 1, Figure 6—figure supplement 1 and Figure 7—figure supplement 1).
Appendix 6—figure 1
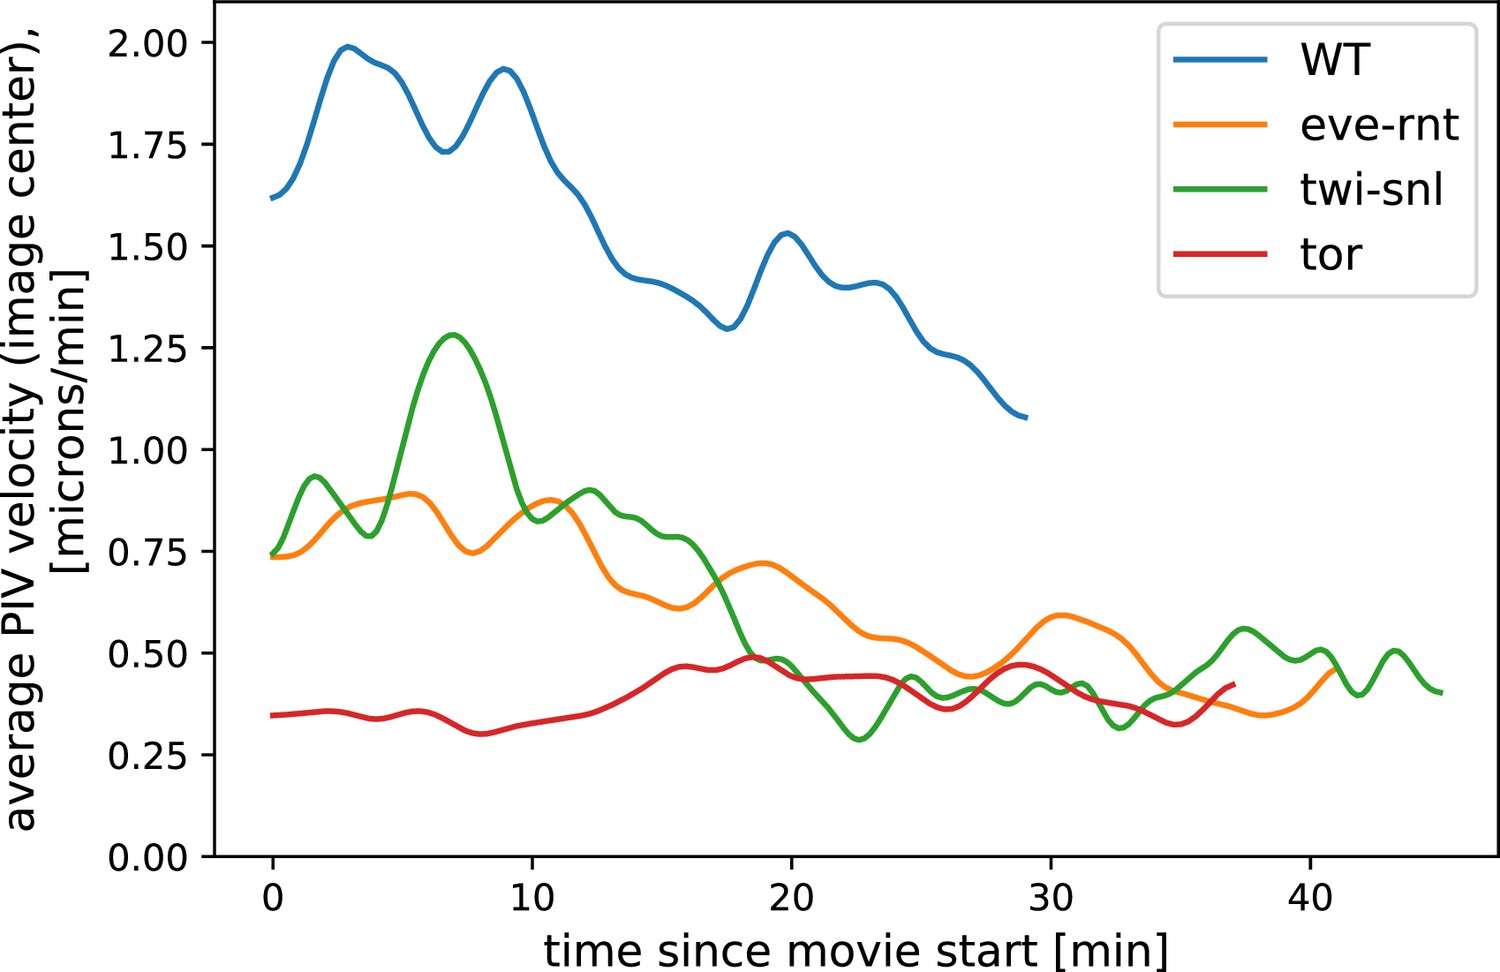
Particle Image Velocimetry (PIV)-analysis of tissue flow ahead of a DV cauterization fence in different genetic backgrounds.
In the eve/rnt and the twi/snl embryo, where active force generation in the germ band is impaired, tissue flow is strongly reduced compared to wild-type (WT). For analysis, we excluded the cauterization fence itself. Data from Collinet et al., 2015 ( movie for each genotype).
Videos
Video 1
In toto cell tracking during gastrulation.
Ventral furrow invagination (gray cells on the dorsal side) is followed by convergence-extension of the germ band (lateral ectoderm cells colored purple, blue, and green). As the germ band elongates along the AP axis, the cells move over the posterior pole. The amnioserosa (orange and red cells) undergoes convergence-extension in the opposite direction of the germ band and exhibits significant cell shape elongation while cells in the germ band remain mostly isotropic in shape. Near the end of germ band extension (ca 35 min) cell divisions start. (Corresponds to Figure 1A; invaginating cells are colored in gray; cells in the head are colored white; cells after division events are colored in light gray).
Video 2
Relative tension dynamics in the lateral ectoderm.
Relative junctional tensions inferred from cell geometry reveal the emergence of an alternating pattern of high and low tensions that organizes cell intercalations (T1 transitions). Coherent intercalations drive convergent extension tissue flow which slows down significantly as cell scale order is lost.
Video 3
Simulation of a single intercalating cell quartet.
Simulation of an intercalating cell quartet driven by positive tension feedback and myosin handover mechanism, corresponding to Figure 3E. Out of the ensemble from Figure 3E, the movie and shows a simulation for symmetric initial tensions (i.e. equal initial tensions on the two non-collapsing interfaces ). After the edge flip, the blue parts of the inner tension triangulation edge indicate the passive tension on the newly formed interface. The passive tension rapidly relaxes while the active tension grows due to positive tension feedback.
Additional files
Download links
A two-part list of links to download the article, or parts of the article, in various formats.
Downloads (link to download the article as PDF)
Open citations (links to open the citations from this article in various online reference manager services)
Cite this article (links to download the citations from this article in formats compatible with various reference manager tools)
The geometric basis of epithelial convergent extension
eLife 13:RP95521.
https://doi.org/10.7554/eLife.95521.3


