Microstructural asymmetries of the planum temporale predict functional lateralization of auditory-language processing
- State Key Laboratory of Cognitive Neuroscience and Learning & IDG/McGovern Institute for Brain Research, Beijing Normal University, China
- School of Artificial Intelligence, Beijing Normal University, China
- Department of Psychology, Medical School Hamburg, Germany
- ICAN Institute for Cognitive and Affective Neuroscience, Medical School Hamburg, Germany
- Institute of Cognitive Neuroscience, Biopsychology, Faculty of Psychology, Ruhr University Bochum, Germany
- Beijing Key Laboratory of Brain Imaging and Connectomics, Beijing Normal University, China
- Chinese Institute for Brain Research, China
Figures
Figure 1
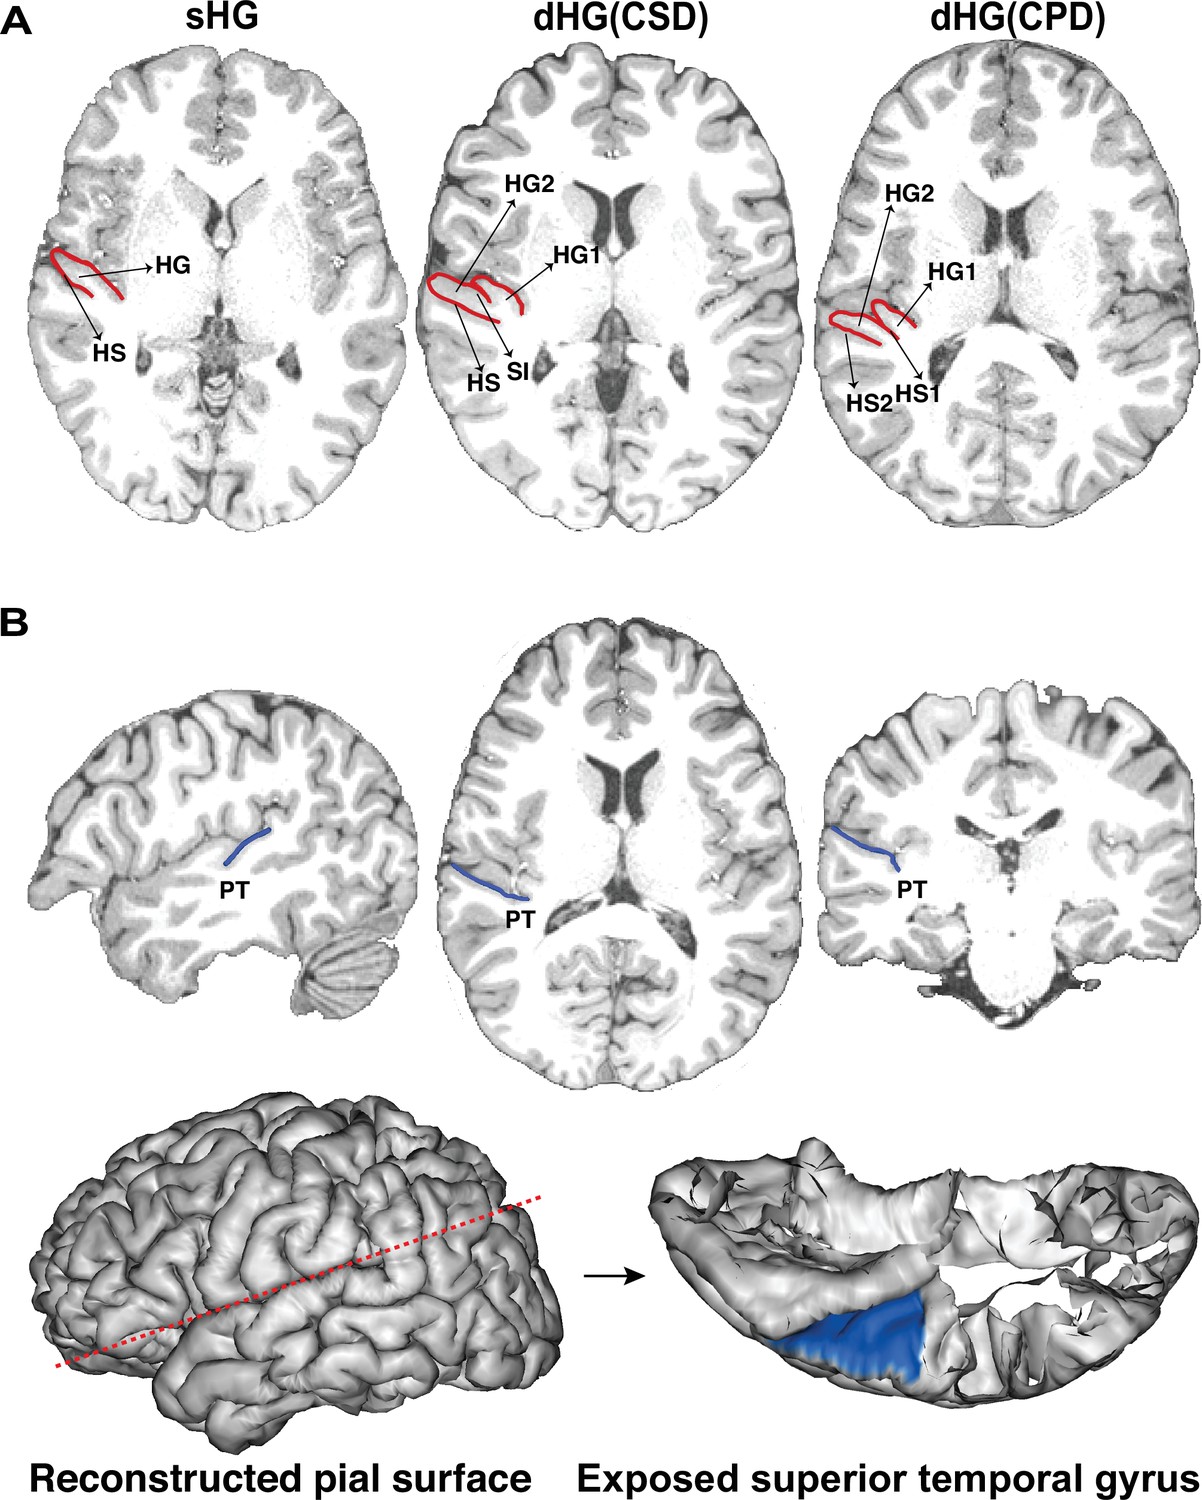
The gyrification pattern of Heschl’s gyrus (HG) and manual delineation of the planum temporale (PT) on individual images.
(A) Examples of three types of HG gyrification patterns (red line): are single HG (sHG), common stem duplication (CSD), and complete duplication (CPD). HG1, the anterior part of duplicated HG; HG2, the posterior part of duplicated HG; SI, the sulcus intermedius; HS1, the anterior Heschl’s sulcus; HS2, the posterior Heschl’s sulcus. (B) An example of manually delineated PT on a T1-weighted image (blue line) and reconstructed 32k~ pial surface (blue area). The oblique section plane (red dotted line) was applied to expose the internal surface of the superior temporal gyrus using the Anatomist (Rivière et al., 2011).
Figure 2 with 2 supplements

Planum temporale (PT) functional lateralization of speech processing at the group level.
For each group, a linear mixed model (LME) was used to test the hemispheric asymmetry of each PT functional activation. ‘Hemisphere’ was the fixed effect, asymmetry index was the response variable, age, and sex, and total brain volume were covariates. L1/R1, single HG on the left and single HG on the right; L1/R2, single HG on the left and duplicated HG on the right; L2/R1, duplicated HG on the left and single HG on the right; L2/R2, duplicated HG on the left and duplicated HG on the right. * denotes a significant difference between left and right PTs (i.e. PFWE <0.05). Positive and negative values of the asymmetry index represent leftward and rightward asymmetry, respectively.
Figure 2—figure supplement 1
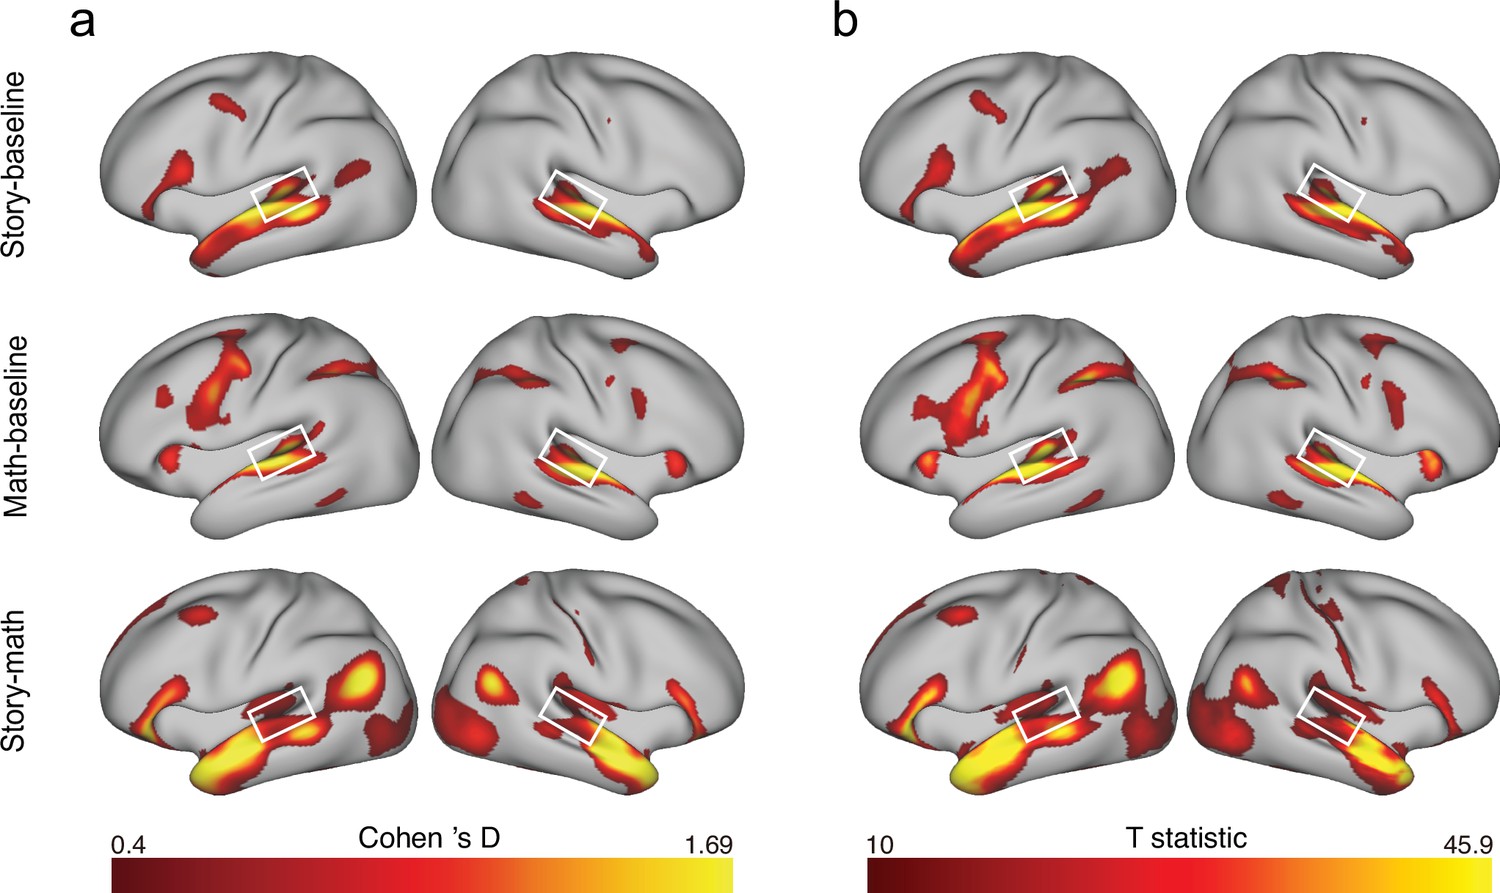
fMRI activation maps of the human connectome project (HCP) language processing task.
(a) The group Cohen’s D effect size maps, show vertices with a medium effect size (Cohen’s D>0.4). (b) Group T statistic maps from the Permutation Analysis of Linear Models (PALM), showing vertices with T>10. There were three contrasts between task conditions from this task: ‘story – baseline,’ ‘math – baseline,’ and ‘story – math.’ Statistical maps were generated from 997 subjects with quantified fMRI data. A white rectangle is placed around the planum temporale (PT). As shown, bilateral PTs were successfully activated under the three contrasts.
Figure 2—figure supplement 2

The difference in planum temporale (PT) functional activation between subjects with single and duplicated Heschl's gyrus (HG).
The PT functional activation of the two groups was compared using two-sample t-tests after controlling for age, sex, and hemispheric brain volume (ICV). sHG, single Heschl’s gyrus; dHG, duplicated Heschl’s gyrus; ns, non-significant. Nonsignificant differences (PFWE >0.05) are colored gray. Cohen’s d values are listed in Supplementary file 1j.
Figure 3 with 1 supplement
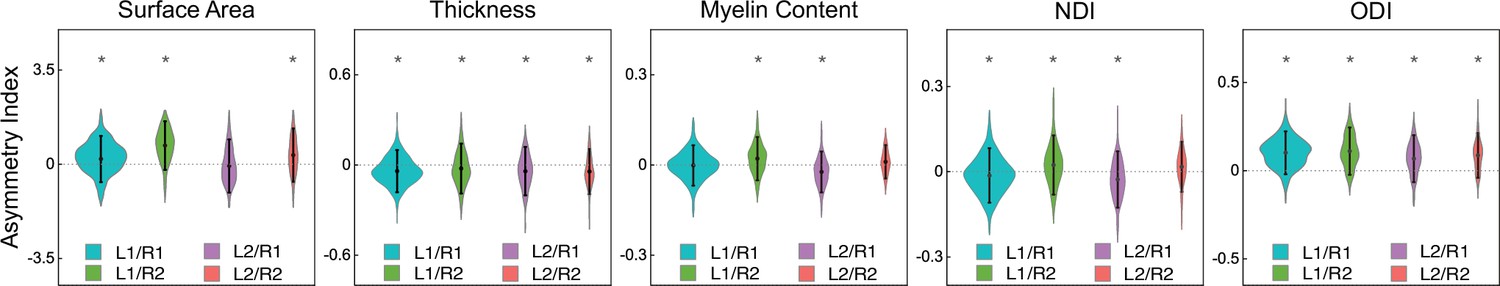
planum temporale (PT) structural asymmetry at the group level.
For each group, a linear mixed model (LME) was used to test the hemispheric asymmetry of each PT structural measure. “Hemisphere” was the fixed effect, and the asymmetry index was the response variable. Age, sex, and total brain volume were covariates. Notably, we did not standardize these structural measures, so the scales differed between indicators. L1/R1, single HG on the left and single HG on the right; L1/R2, single HG on the left and duplicated HG on the right; L2/R1, duplicated HG on the left and single HG on the right; L2/R2, duplicated HG on the left and duplicated HG on the right. NDI, neurite density index; ODI, orientation dispersion index. * denotes a significant difference between left and right PTs (PFWE <0.05). Positive and negative values of the asymmetry index represent leftward and rightward asymmetry, respectively.
Figure 3—figure supplement 1
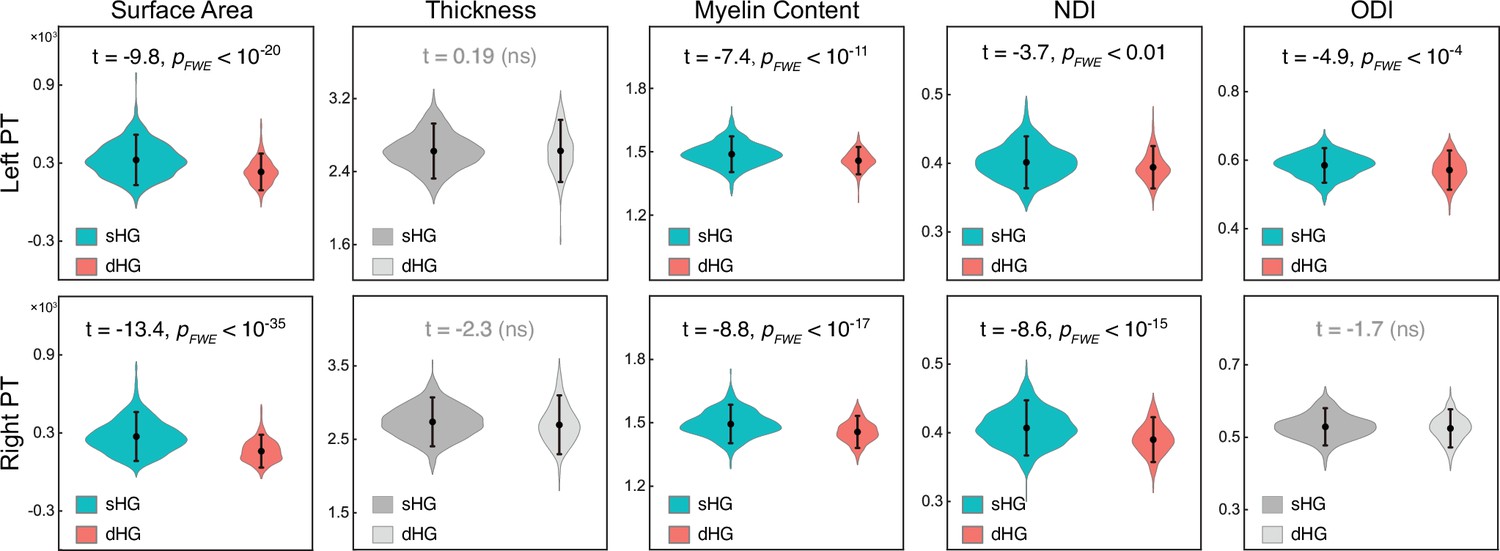
The difference in planum temporale (PT) structural measures between subjects with single and duplicated Heschl's gyrus (HG).
The PT structural measures of the two groups were compared using two-sample t-tests after controlling for age, sex, and hemispheric brain volume (ICV). sHG, single Heschl’s gyrus; dHG, duplicated Heschl’s gyrus. Nonsignificant differences (PFWE >0.05) are colored gray. NDI, neurite density index; ODI, orientation dispersion index; ns, non-significant. Cohen’s d values are listed in Table.
Figure 4
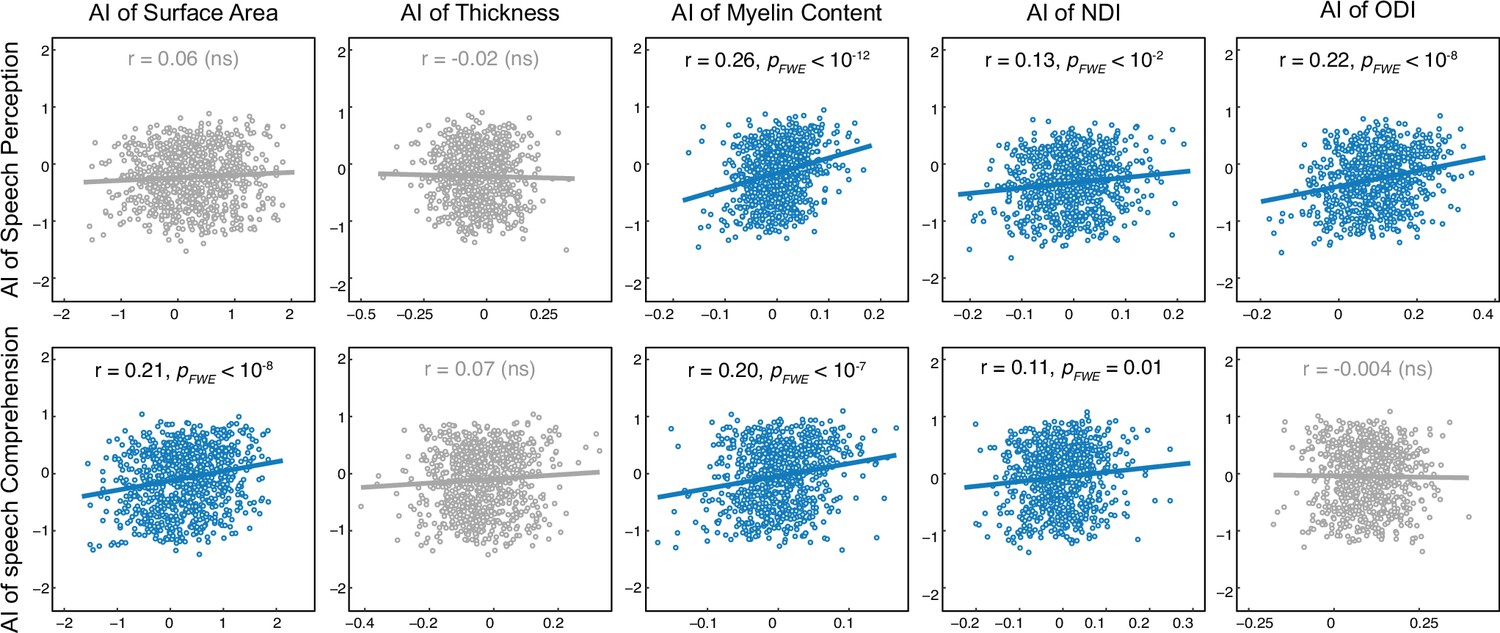
Interindividual correlation of planum temporale (PT) functional and structural asymmetries.
For each pair of correlations, a general linear model (GLM) was used. ‘Functional AI’ was the response variable and ‘structural AI,’ ‘group,’ and ‘structural AI × group’ were predictor variables. Age, sex, and total brain volume were covariates. The scatter plots for nonsignificant correlations (PFWE >0.05) are colored gray. AI, asymmetry index; NDI, neurite density index; ODI, orientation dispersion index; ns, non-significant.
Figure 5
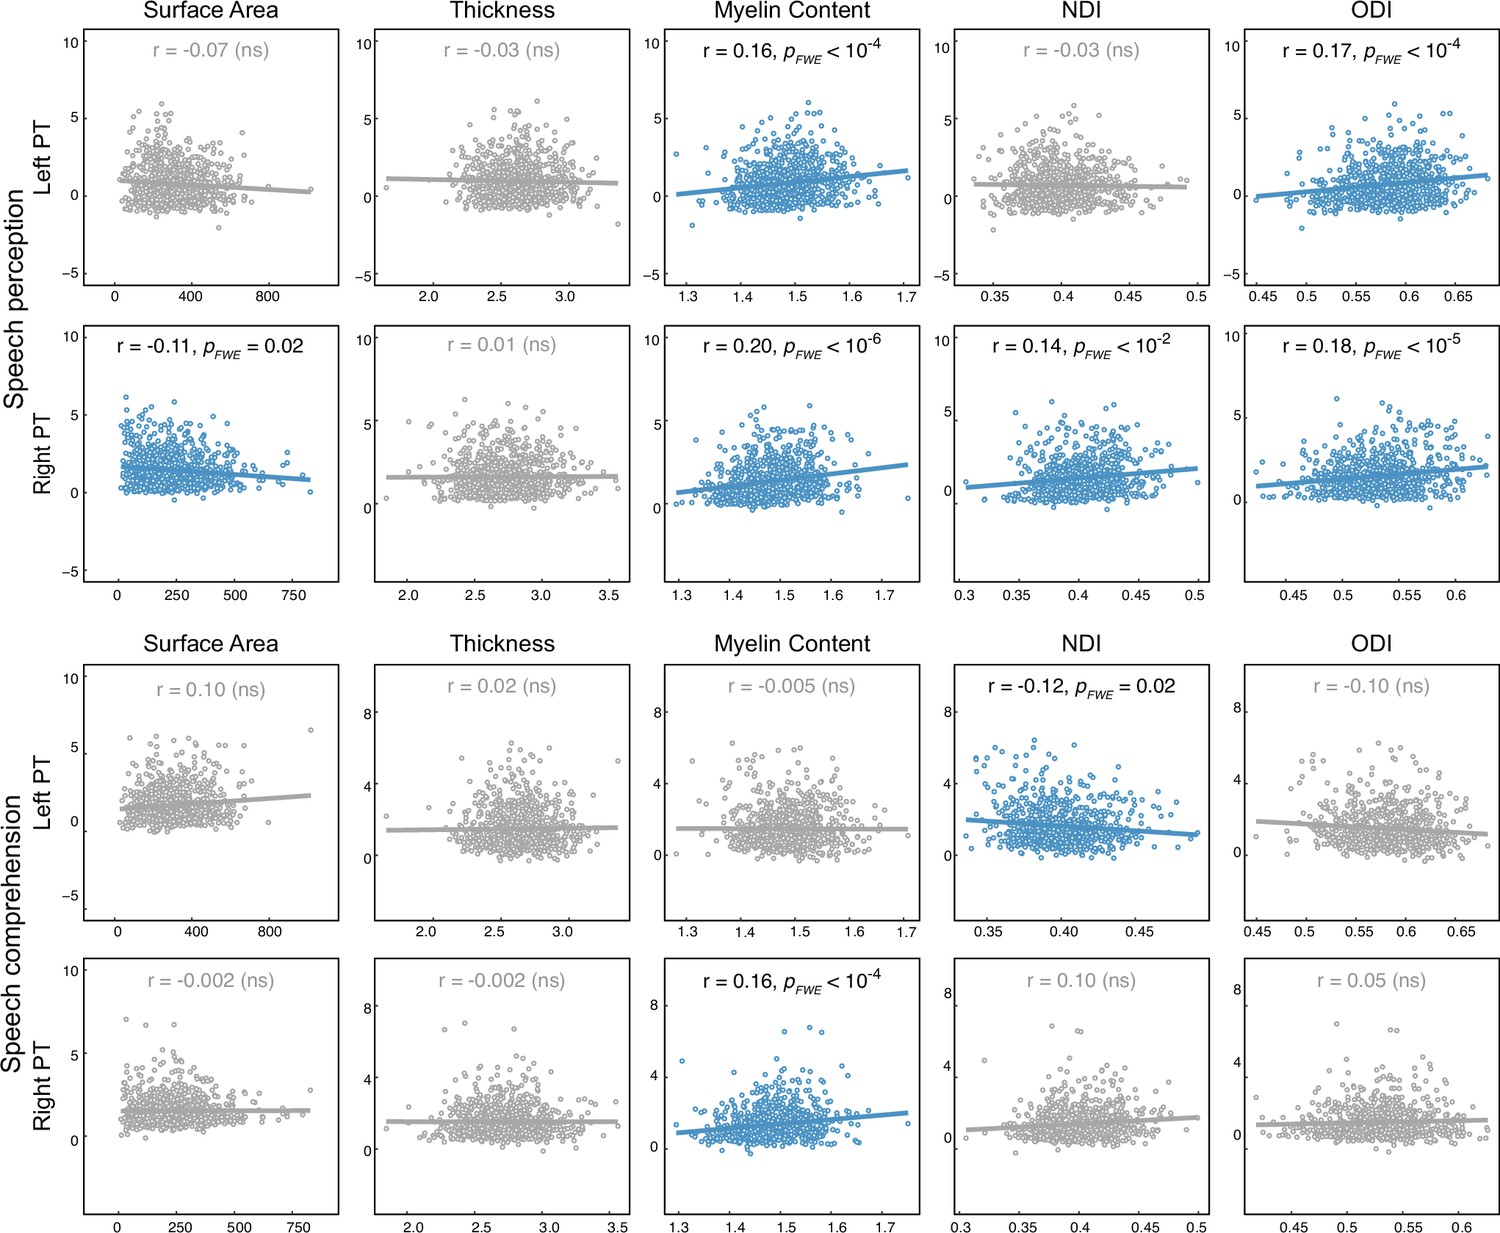
Interindividual functional-structural correlations of the left and right planum temporale (PT).
For each pair of correlations, a general linear model (GLM) was used. ‘Functional measure’ was the response variable and ‘structural measure,’ ‘group,’ and ‘structural measure × group’ were predictor variables. Age, sex, and hemispheric brain volume were covariates. The scatter plots for nonsignificant correlations (PFWE >0.05) are colored gray. NDI, neurite density index; ODI, orientation dispersion index; ns, non-significant.
Tables
Table 1
The reliability of planum temporale (PT) measures from manually delineated PT.
| Reliability | Interrater ICC(N=20) | Imaging test-retest ICC(N=43) | |
|---|---|---|---|
| PT functional activation | Speech perception | 0.99 | 0.55 |
| Speech comprehension | 0.99 | 0.78 | |
| PT structural measures | Surface area | 0.85 | 0.69 |
| Thickness | 0.97 | 0.72 | |
| Myelin content | 0.98 | 0.61 | |
| NDI | 0.99 | 0.73 | |
| ODI | 0.96 | 0.86 | |
-
ICC, intraclass correlation coefficient; PT, planum temporale; NDI, neurite density index; ODI, orientation dispersion index.
Table 2
The distribution of Heschl's gyrus (HG) gyrification patterns.
| Type of HG gyrification pattern | |||||
|---|---|---|---|---|---|
| L1/R1 | L1/R2 | L2/R1 | L2/R2 | Group difference | |
| Subject number | 503 | 175 | 141 | 88 | |
| Age (mean±SD) | 28.8±3.7 | 28.8±3.8 | 29.2±3.6 | 28.1±3.6 | p=0.19 |
| Sex (F/M) | 275/228 | 96/79 | 83/58 | 55/33 | p=0.49 |
Additional files
-
Supplementary file 1
Supplementary tables.
(a) Group-level hemispheric asymmetry of planum temporale (PT) functional and structural measures. (b) The interaction effect of ‘PT structural AI × Heschl's gyrus (HG) gyrification pattern’ on PT nonspeech-related functional asymmetry indexes (AIs) (the first specificity analysis). (c) The correlations of PT structural AIs with PT nonspeech-related functional activation AIs after controlling for the HG gyrification pattern (the first specificity analysis). (d) The interaction effect of ‘PT structural measure × HG gyrification pattern’ on PT nonspeech-related functional activation for each hemisphere (the first specificity analysis). (e) The correlations of PT structural measures with PT nonspeech-related functional activation for each hemisphere after controlling for the HG gyrification pattern (the first specificity analysis). (f) The interaction effect of ‘PT structural AI ×HG gyrification pattern’ on speech-related functional AIs of the entire hemisphere (the second specificity analysis). (g) The correlations of PT structural AIs with speech-related functional AI of the entire hemisphere after controlling for the HG gyrification pattern (the second specificity analysis). (h) The interaction effect of ‘PT structural measure × HG gyrification pattern’ on speech-related functional activation of the entire ipsilateral hemisphere (the second specificity analysis). (i) The correlations of PT structural measures with speech-related functional activation of the entire ipsilateral hemisphere after controlling for the HG gyrification pattern (the second specificity analysis). (j) The difference in PT functional and structural metrics between groups with single and duplicated HG within each hemisphere (the effect size, Cohen’s D).
- https://cdn.elifesciences.org/articles/95547/elife-95547-supp1-v1.docx
-
Supplementary file 2
Heschl's gyrus (HG) gyrification pattern.
(a) The Heschl's gyrus (HG) gyrification patterns of subjects included in the present study.
- https://cdn.elifesciences.org/articles/95547/elife-95547-supp2-v1.csv
-
MDAR checklist
- https://cdn.elifesciences.org/articles/95547/elife-95547-mdarchecklist1-v1.docx
Download links
A two-part list of links to download the article, or parts of the article, in various formats.
Downloads (link to download the article as PDF)
Open citations (links to open the citations from this article in various online reference manager services)
Cite this article (links to download the citations from this article in formats compatible with various reference manager tools)
Microstructural asymmetries of the planum temporale predict functional lateralization of auditory-language processing
eLife 13:RP95547.
https://doi.org/10.7554/eLife.95547.3


