Single-cell eQTL mapping in yeast reveals a tradeoff between growth and reproduction
- Department of Human Genetics, University of California, Los Angeles, United States
- Department of Biological Chemistry, University of California, Los Angeles, United States
- Howard Hughes Medical Institute, United States
Figures
Figure 1 with 8 supplements
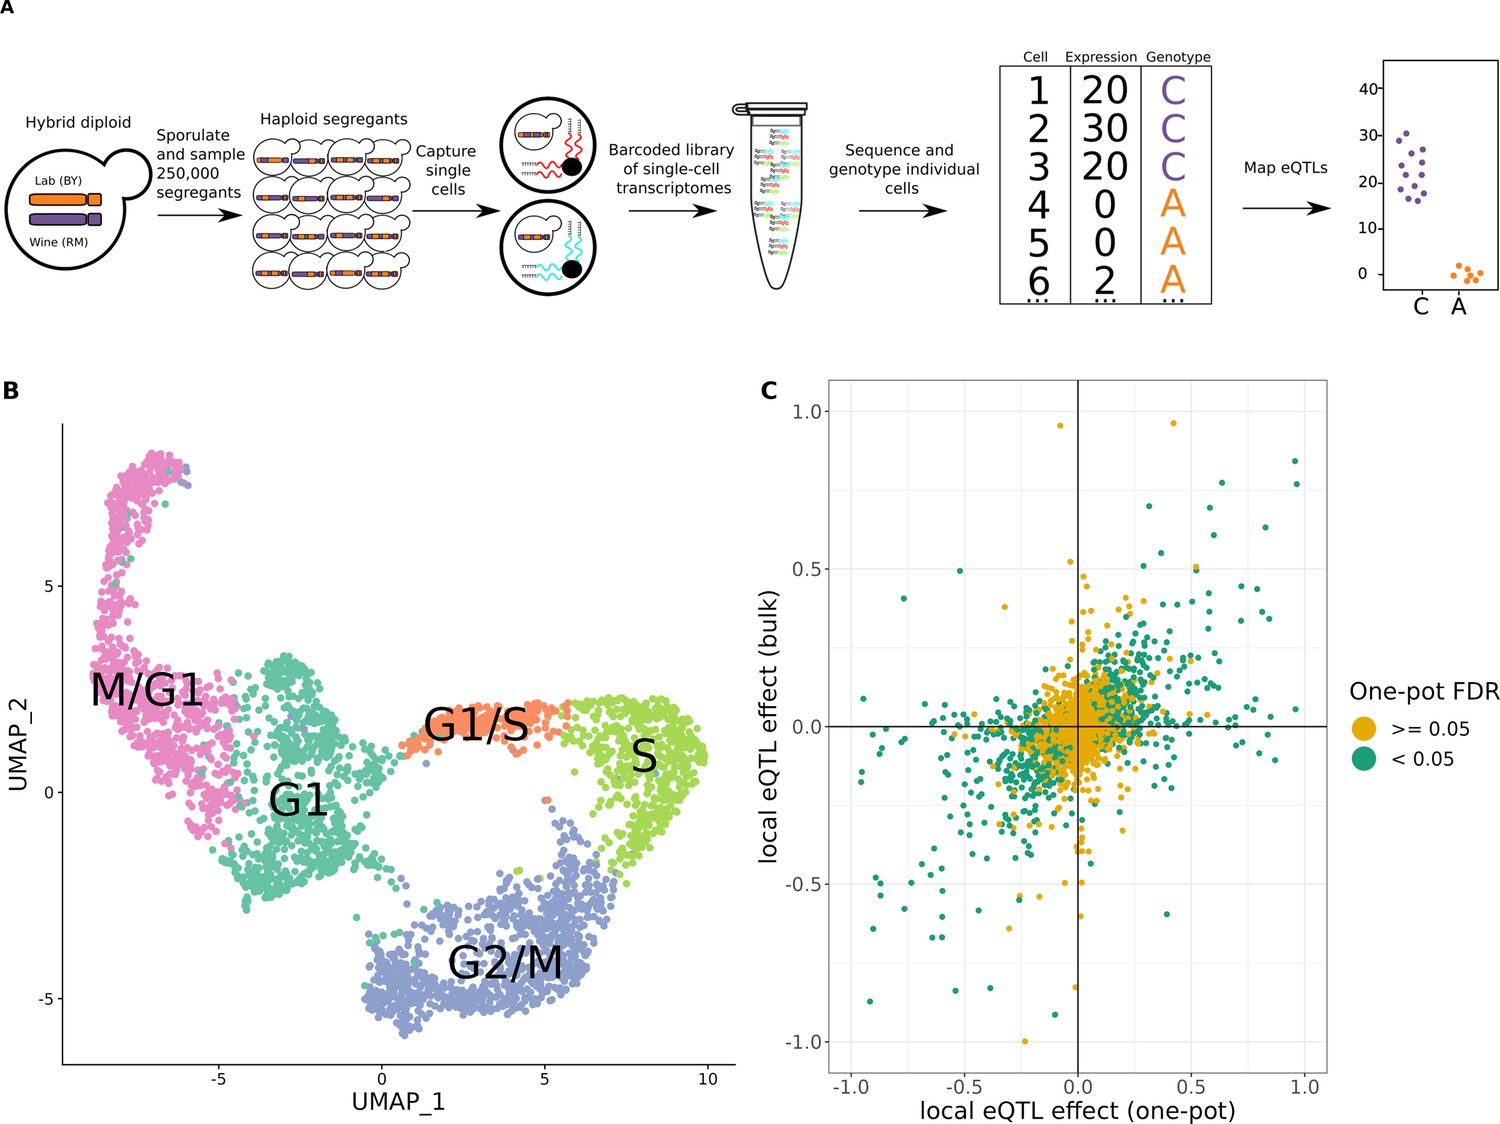
One-pot eQTL mapping is feasible in yeast.
(A) One-pot eQTL mapping workflow. A large population of hybrid diploid cells is sporulated, and MATa haploid yeast progeny cells (segregants) are isolated by fluorescence-activated cell sorting. Cells are captured and processed with the 10× Chromium device. The resulting barcoded library of single-cell transcriptomes is sequenced by Illumina short-read sequencing. Unique molecular identifier (UMI) counts are tallied for each transcript in each segregant. The number of supporting molecules for each parental allele is identified at every transcribed sequence position that differs between the parental strains, and a hidden Markov model is used to infer the genotype of each segregant. In the cartoon example of an eQTL shown on the top right, segregants with the C allele have higher expression of the gene than those with the A allele. (B) Representative Uniform Manifold Approximation and Projection for Dimension Reduction (UMAP) plot of cells colored by their assigned cell-cycle stage. (C) Scatter plot of local eQTL effects from the one-pot experiment in the cross between BY and RM (x-axis) against local eQTL effects based on expression measurements from bulk RNA-seq in the same cross (y-axis) (Albert et al., 2018). Green dots denote one-pot eQTL effects that were significant at a false-discovery rate (FDR) of 0.05; yellow dots denote those that were not. The x- and y-axis were truncated at –1 and 1 for ease of visualization, which left out 67 of 4044 data points.
Figure 1—figure supplement 1
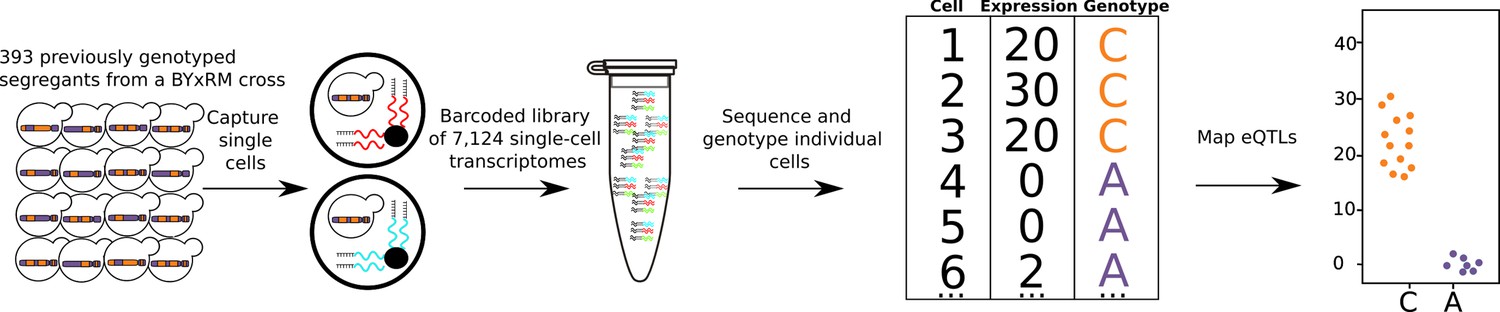
Single-cell eQTL mapping of 393 previously genotyped segregants.
393 segregants were pooled, grown in minimal medium, and processed using the 10× Chromium device. The resulting barcoded library is sequenced with Illumina short-read sequencing. The number of supporting molecules for each allele is inferred at every variant position between the parental strains and a hidden Markov model is used to infer the genotype of each segregant. A cartoon example of one eQTL is shown on the top right, cells with the C allele had higher expression than cells with A allele.
Figure 1—figure supplement 2
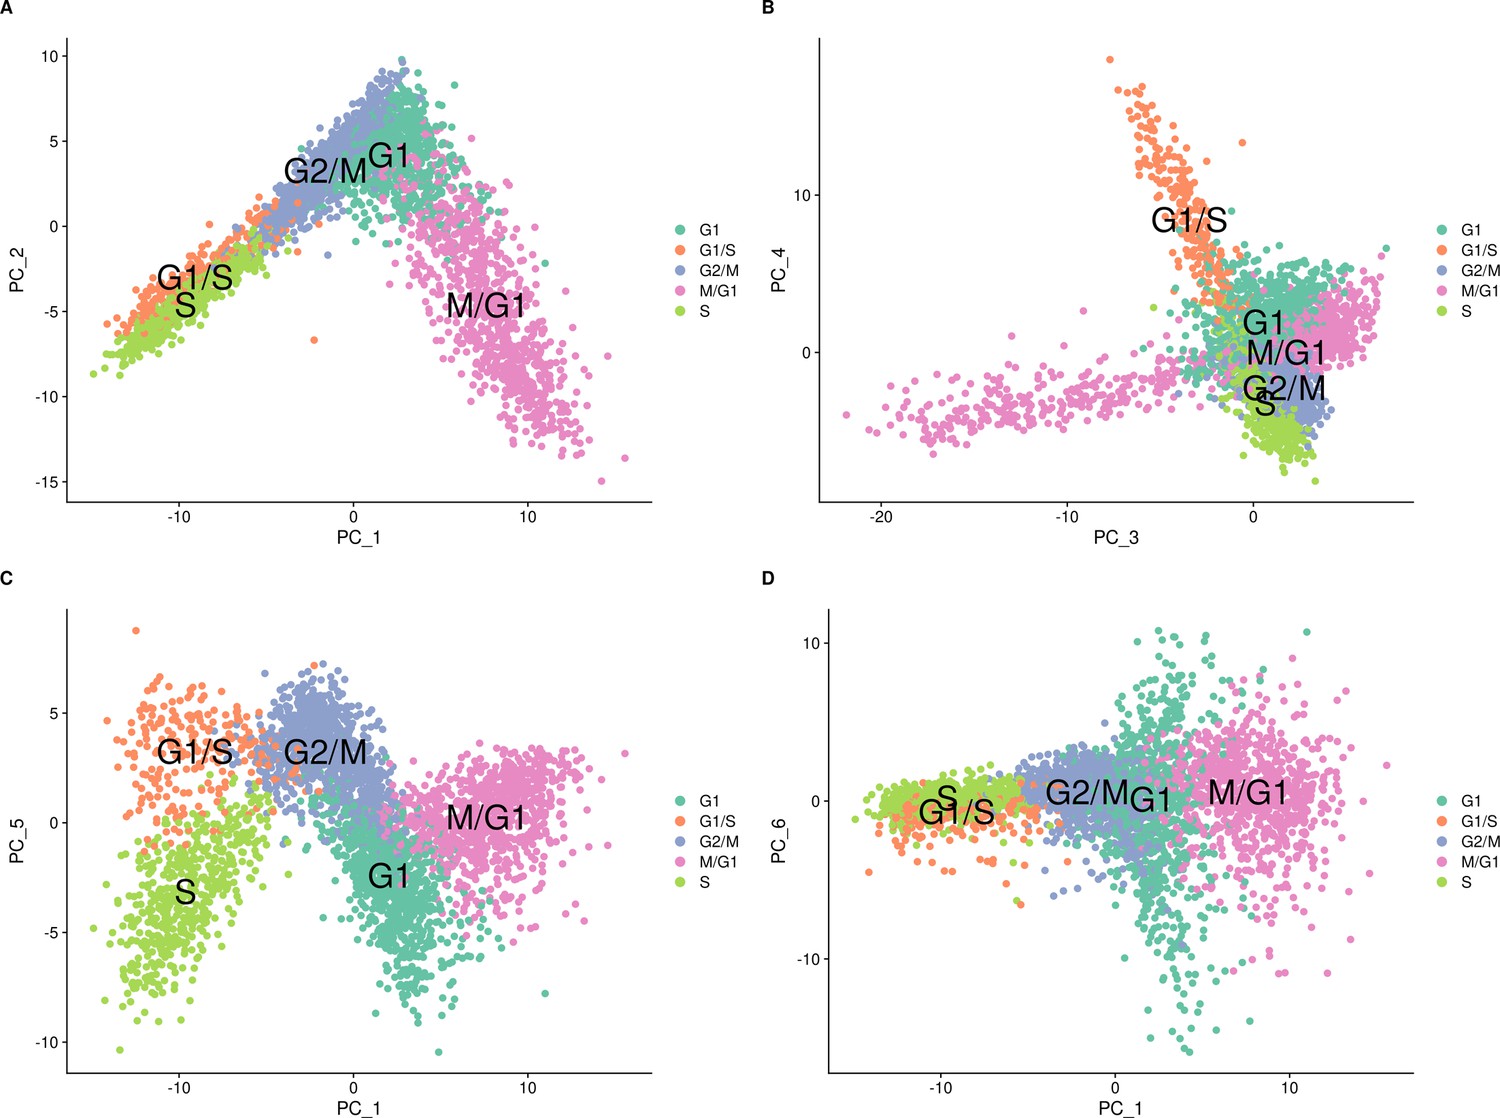
Cell-cycle classification of the single cells from the set of 393 previously genotyped segregants visualized on different combinations of principal components.
These data are from the first 10× run of the 393 segregants (number of cells = 3454). The results look similar for the second run. The principal components (PCs) were calculated using Seurat with the cell-cycle genes. Cells are colored according to their assigned cell-cycle stage. (A) PC plot from the single-cell data comparing PC 1 and PC 2. (B) PC plot from the single-cell data comparing PC 3 and PC 4. (C) PC plot from the single-cell data comparing PC 1 and PC 5. (D) PC plot from the single-cell data comparing PC 1 and PC 6.
Figure 1—figure supplement 3
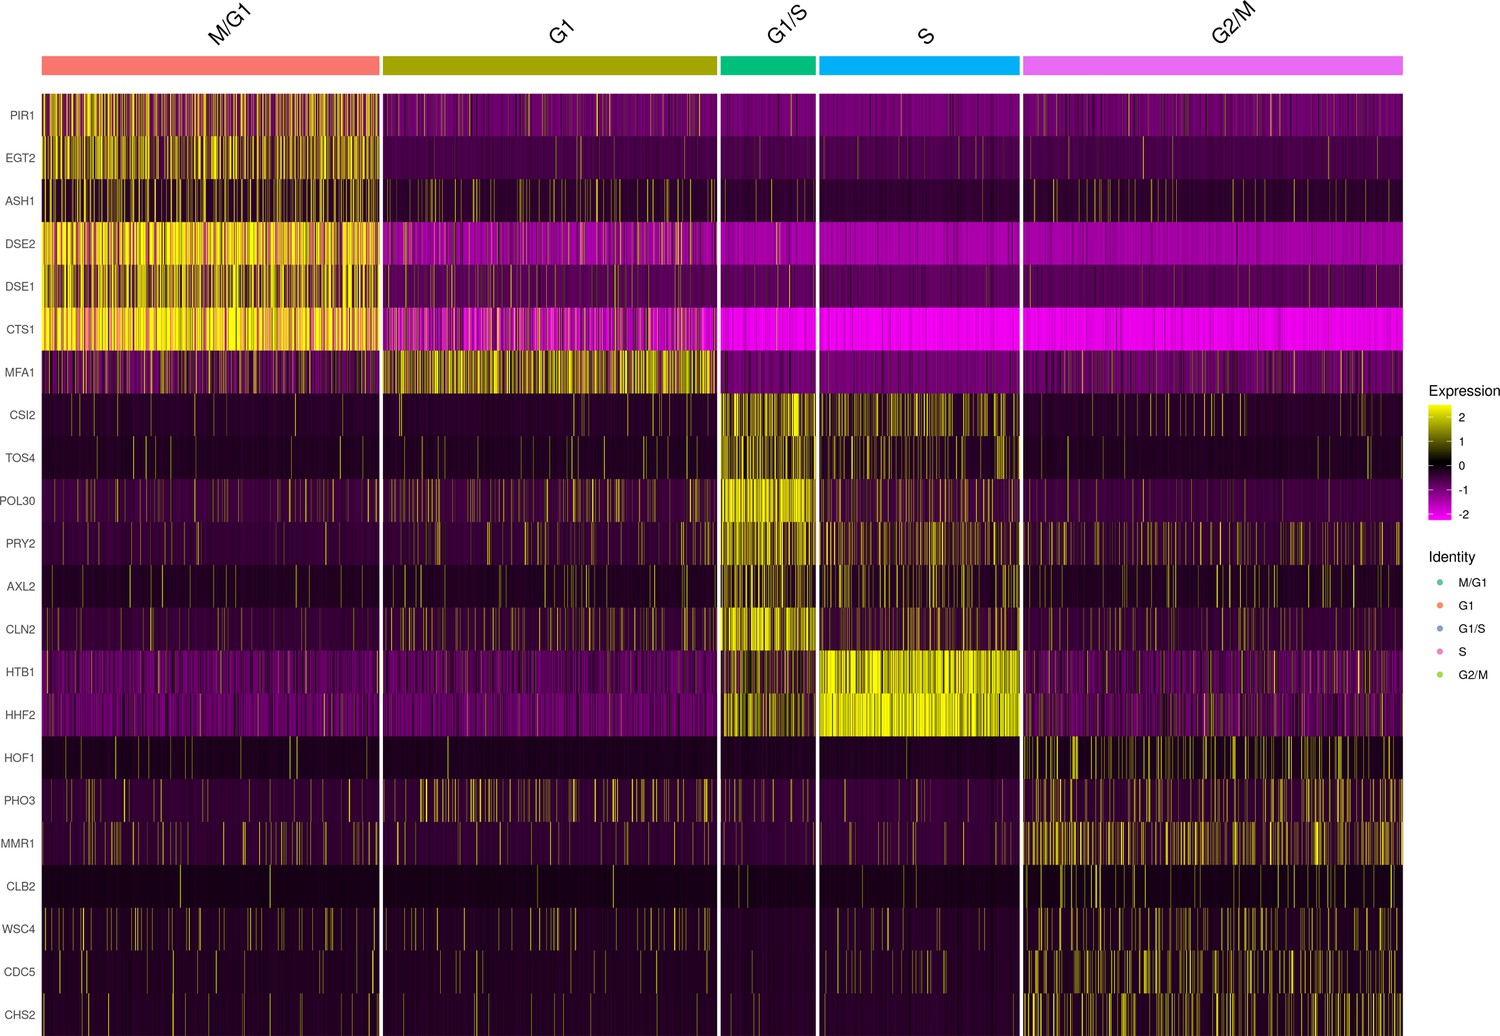
Marker gene expression of cell-cycle classified single cells from the set of 393 previously genotyped segregants.
These data are from the first 10× run of the 393 segregants (number of cells = 3454). The results look similar for the second run. The heatmap shows the normalized expression of each of the 22 markers used for assigning clusters to each cell-cycle stage. For the M/G1 stage, we used the genes PIR1, EGT2, ASH1, DSE1, DSE2, and CTS1. For the G1 stage, we used the gene MFA1, which in our experiments reproducibly connected the M/G1 and G1/S transition stages. For the G1/S stage, we used the genes CSI1, TOS4, POL30, PRY2, AXL2, and CLN2. For the S stage, we used these genes HTB1 and HHF2. Finally, for the G2/M stage we used the genes HOF1, PHO3, MMR1, CLB2, WSC4, CDC5, and CHS2.
Figure 1—figure supplement 4
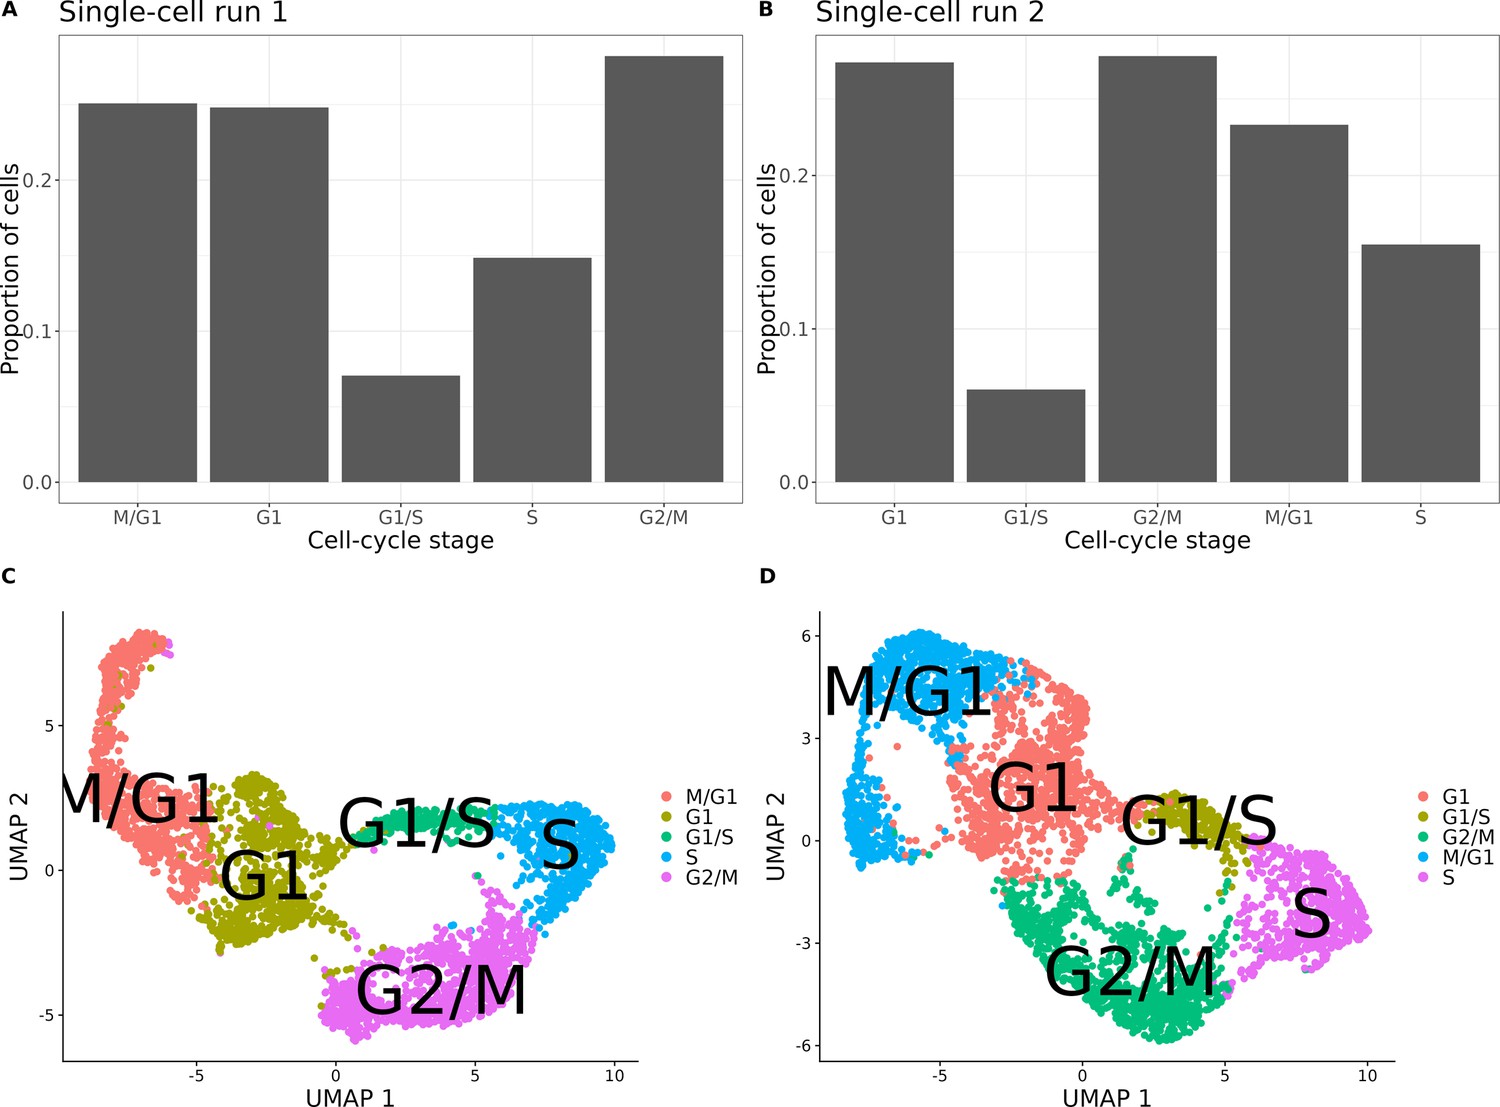
Cell-cycle classification of the single cells from the set of 393 previously genotyped segregants.
(A) Proportion of cells assigned to each cell-cycle stage for the first of two 10× runs of single cells from the pool of 393 segregants (number of cells = 3454). (B) Proportion of cells assigned to each cell cycle for the second 10× run of single cells from the pool of 393 segregants (number of cells = 3708). (C) UMAP plot from the single-cell data in (A) with cells colored according to their assigned cell-cycle stage. (D) UMAP plot from the single-cell data in (B) with cells colored according to their assigned cell-cycle stage.
Figure 1—figure supplement 5
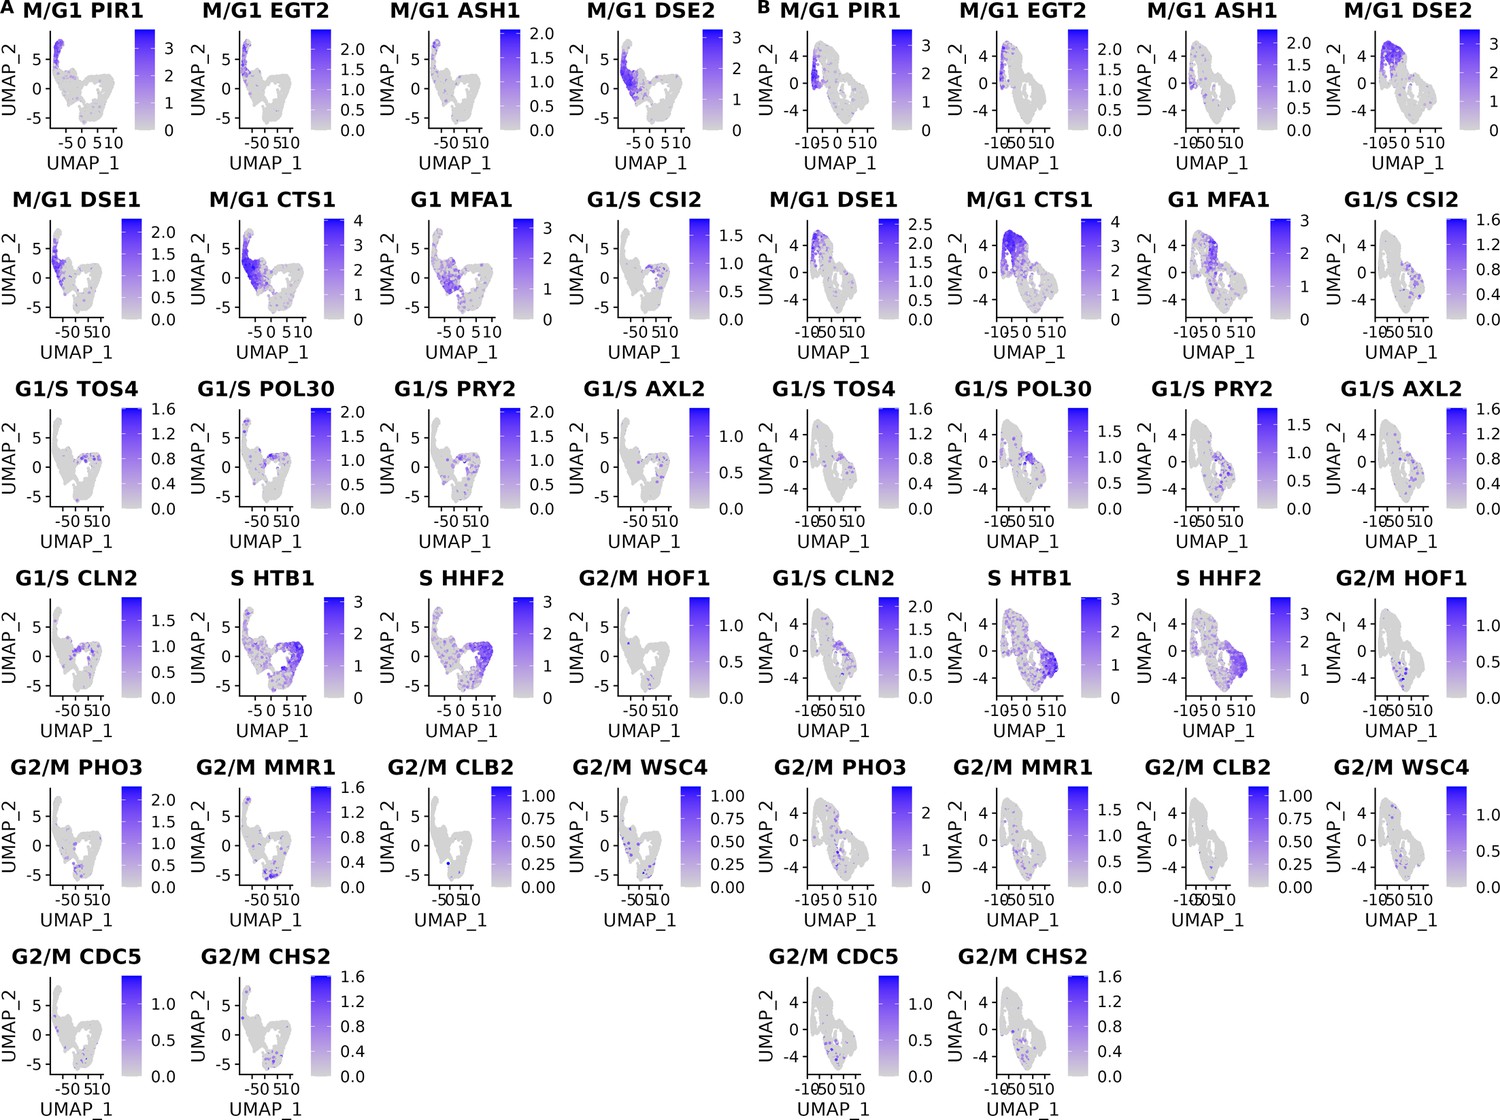
Cell-cycle marker gene expression of the single cells from the set of 393 previously genotyped segregants.
(A) Gene expression levels of the 18 cell-cycle markers used for classification with panels ordered by their position in the cell cycle for the first of two 10× runs of single cells from the pool of 393 segregants (number of cells = 3454). (B) Same as (A) for the second 10× run of single cells from the pool of 393 segregants (number of cells = 3708).
Figure 1—figure supplement 6
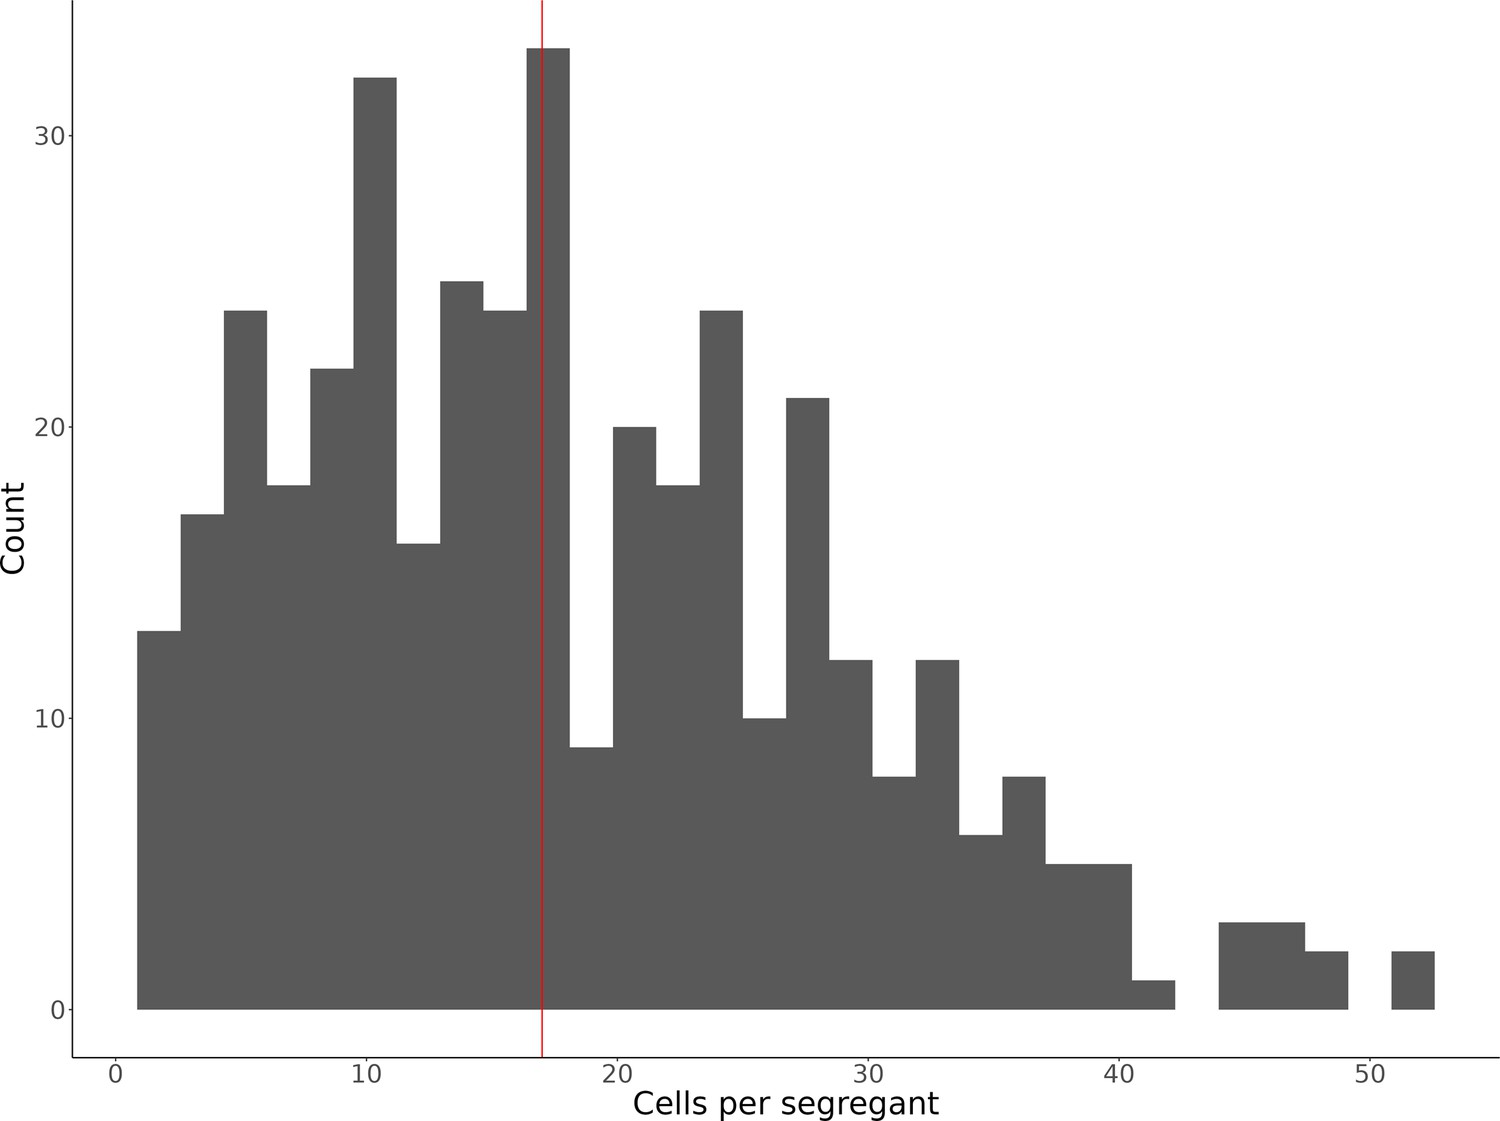
Histogram of the number of single cells identified for each of the 393 segregants.
The median number of cells per segregant (17 cells) is displayed as a vertical red line.
Figure 1—figure supplement 7
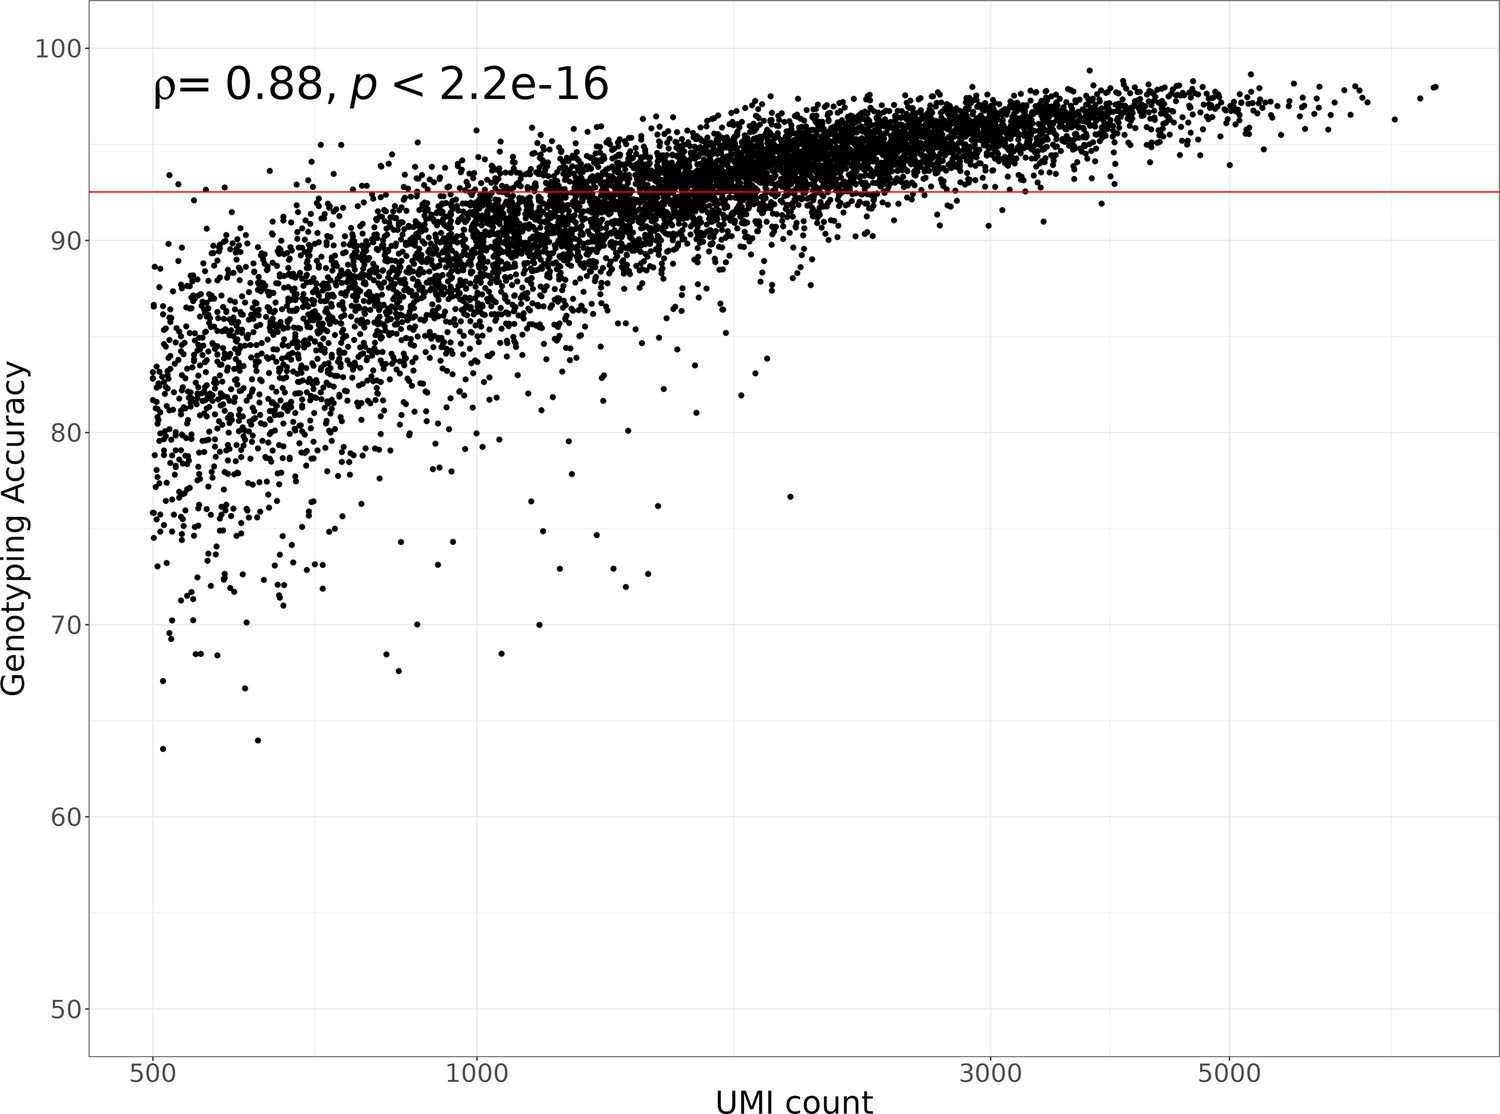
Single-cell hidden Markov model (HMM) genotyping accuracy compared to the number of unique molecular identifiers (UMIs) per cell.
The horizontal red line shows the median genotyping agreement of 92.5%. The Spearman’s correlation coefficient and p-value comparing the genotyping accuracy to the number of UMIs is shown in the top left corner of the plot. A log10 transformation was applied to the x-axis.
Figure 1—figure supplement 8
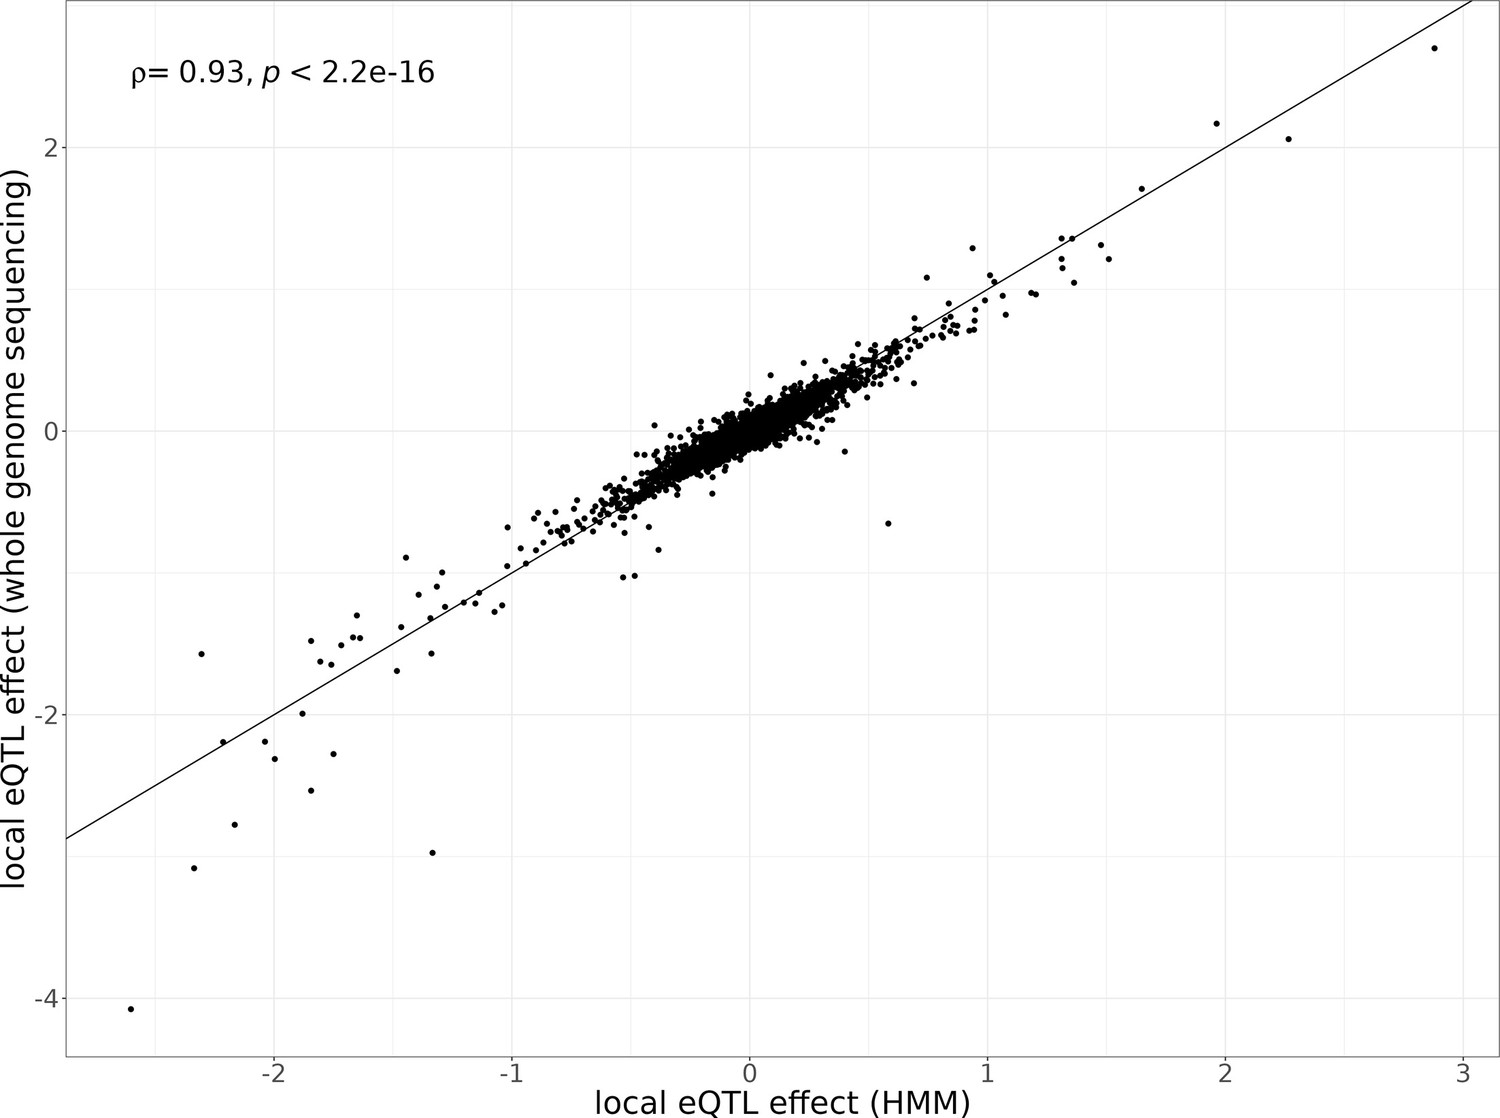
Local eQTL effects estimated with different genotyping methods.
Local eQTL effect sizes estimated using the hidden Markov model (HMM)-based genotypes from single-cell data (x-axis) compared to local eQTL effect sizes estimated using the lookup of genotypes obtained from whole-genome sequencing (y-axis). The single-cell sequencing data of the 393 segregants is used for quantifying gene expression for each eQTL analysis. The Spearman’s correlation coefficient of the local eQTL effect size estimates between these genotyping methods and p-value are shown in the top left corner of the plot.
Figure 2
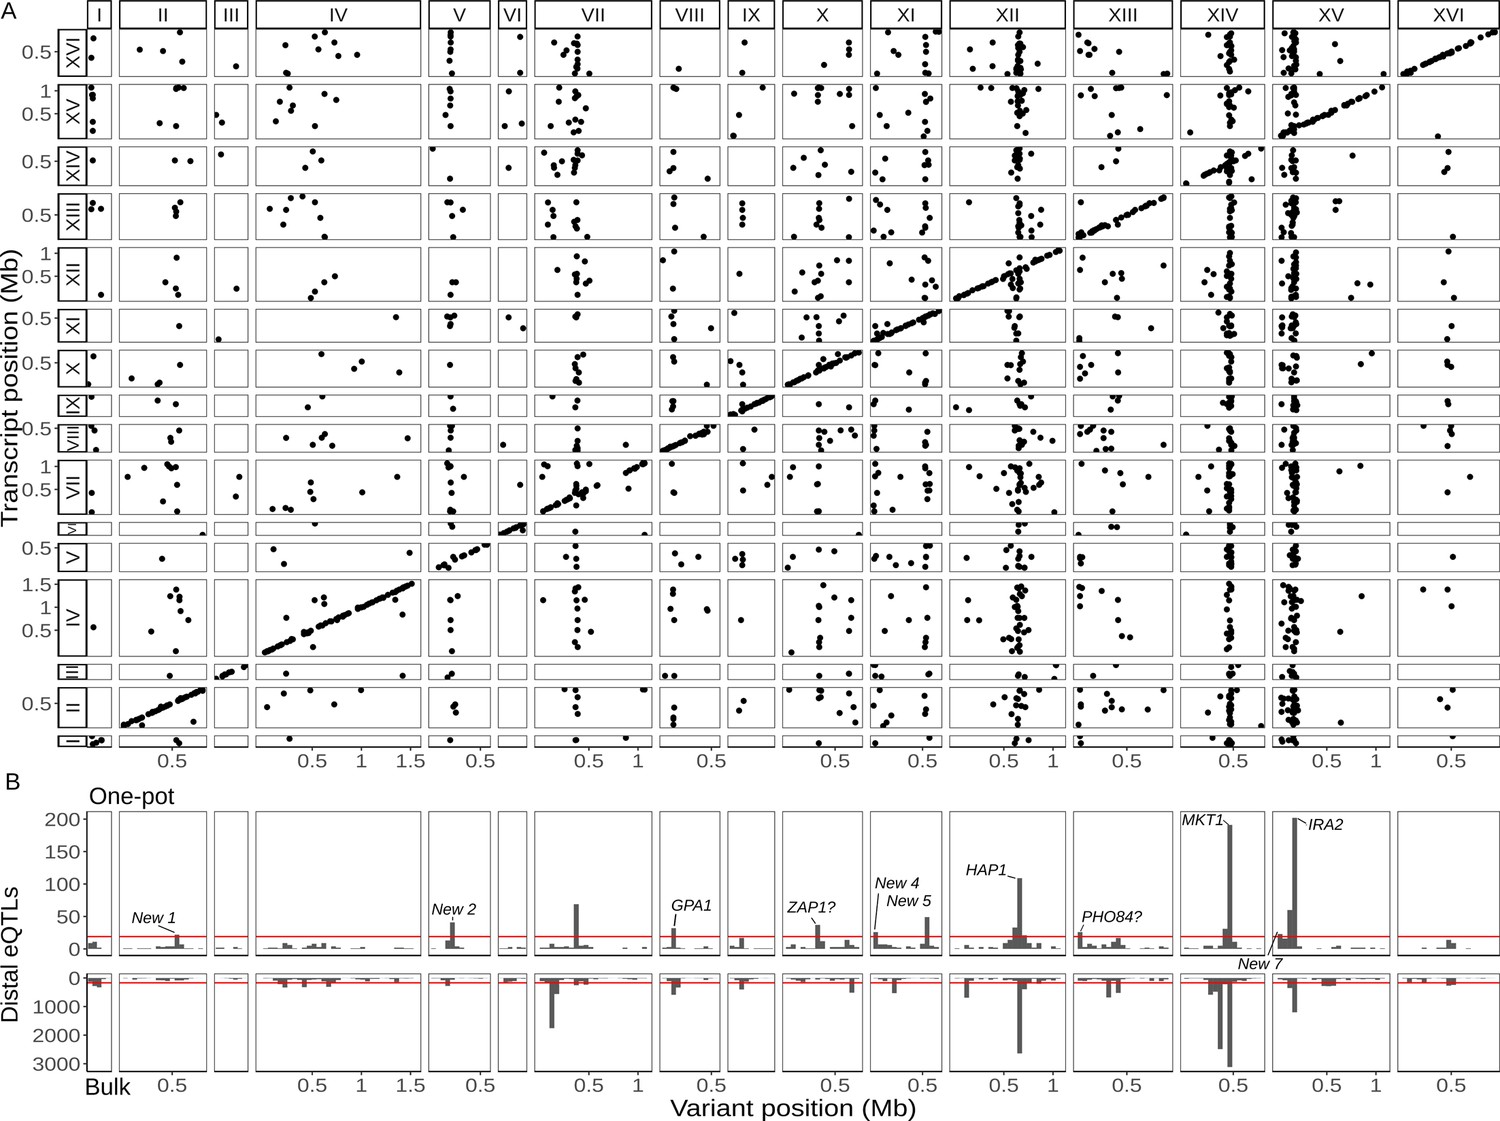
Single-cell eQTL map recapitulates bulk trans-eQTL hotspots and identifies new hotspots.
(A) Map of local and distant eQTLs. Each point denotes an eQTL, with the genomic position of the peak marker on the x-axis and the genomic location of the gene with the expression difference on the y-axis. The high density of points on the diagonal line with a slope of one indicates that many genes have local eQTLs. The dense vertical bands correspond to trans-eQTL hotspots. (B) Histogram showing the number of distant eQTLs in 50 kb windows top: one-pot eQTL map; bottom: bulk eQTL map (Albert et al., 2018). Red lines show statistical eQTL enrichment thresholds for a window to be designated a hotspot. Text labels highlight known and putative causal genes underlying hotspots, as well as loci that meet hotspot criteria only in the current study.
Figure 3
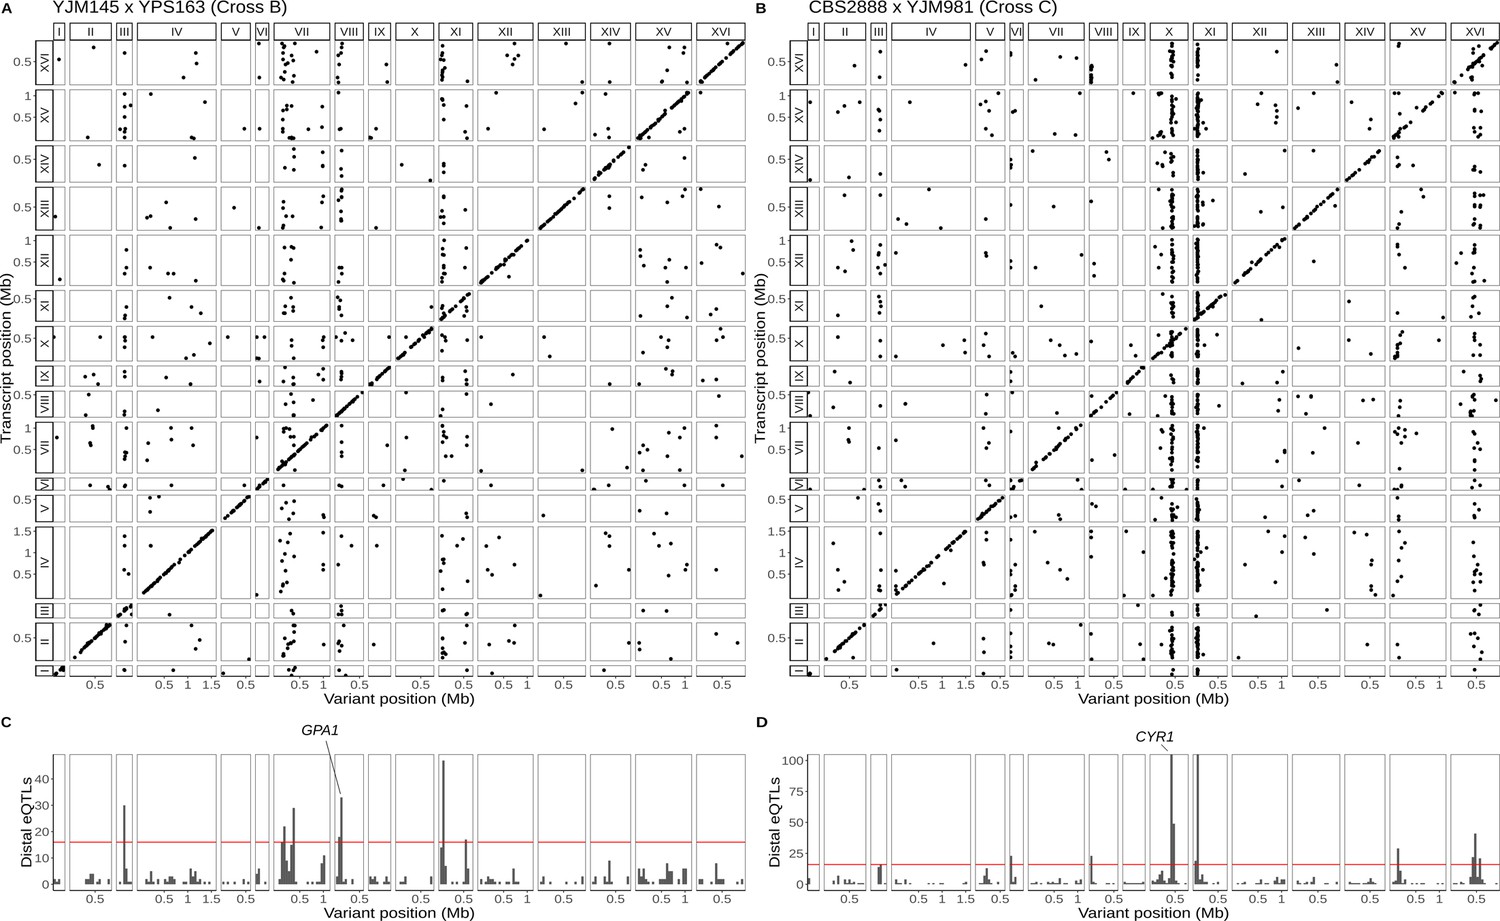
Single-cell eQTL maps in two new crosses.
(A) eQTL map for the YJM145 × YPS163 cross (cross B). (B) eQTL map for the CBS2888 × YJM981 cross (cross C). (C) Histogram of distal eQTLs showing hotspots in cross B. (D) Histogram of distal eQTLs showing hotspots in cross C. The y-axis has been truncated to have a maximum value 100 for ease of visualization purposes. The hotspot on chromosome X near the gene CYR1 influences the expression of 175 genes, and the hotspot on chromosome XI influences the expression of 386 genes.
Figure 4 with 3 supplements
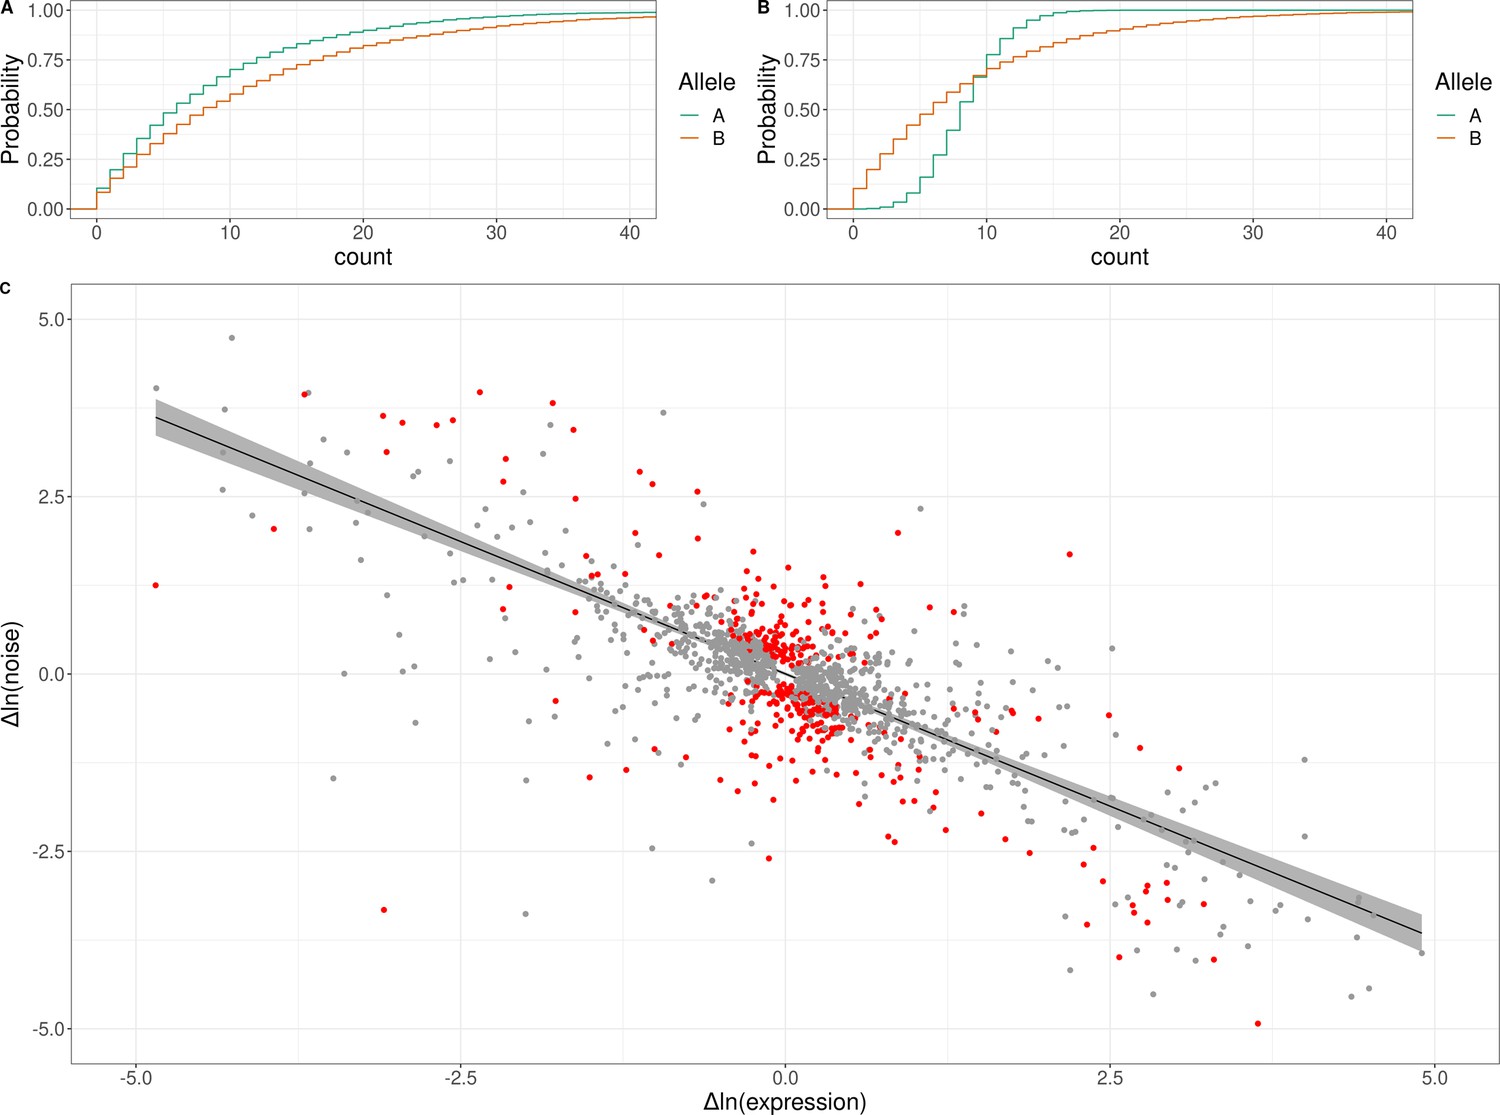
Genetic effects on expression noise.
(A) Cumulative distribution of simulated allele-specific counts for two alleles with different average expression but the same expression noise. (B) Cumulative distribution of simulated allele-specific counts for two alleles with different expression noise but the same average expression. These simulated distributions are shown to illustrate allele-specific effects on average expression and on expression noise, respectively. (C) Log–log scatter plot of change in expression noise between alleles (x-axis) against change in average expression between alleles (y-axis); points correspond to all 1487 genes with significant allele-specific effects on expression noise and/or average expression. Black line shows the predicted change in noise given a change in expression, with the 95% confidence interval for the trend shown in gray. The 377 genes with allele-specific effects on expression noise that cannot be accounted for by the overall trend are shown in red. The x and y axes have been truncated at –5 and 5 for ease of visualization purposes, which left out 30 of 1487 data points.
Figure 4—figure supplement 1
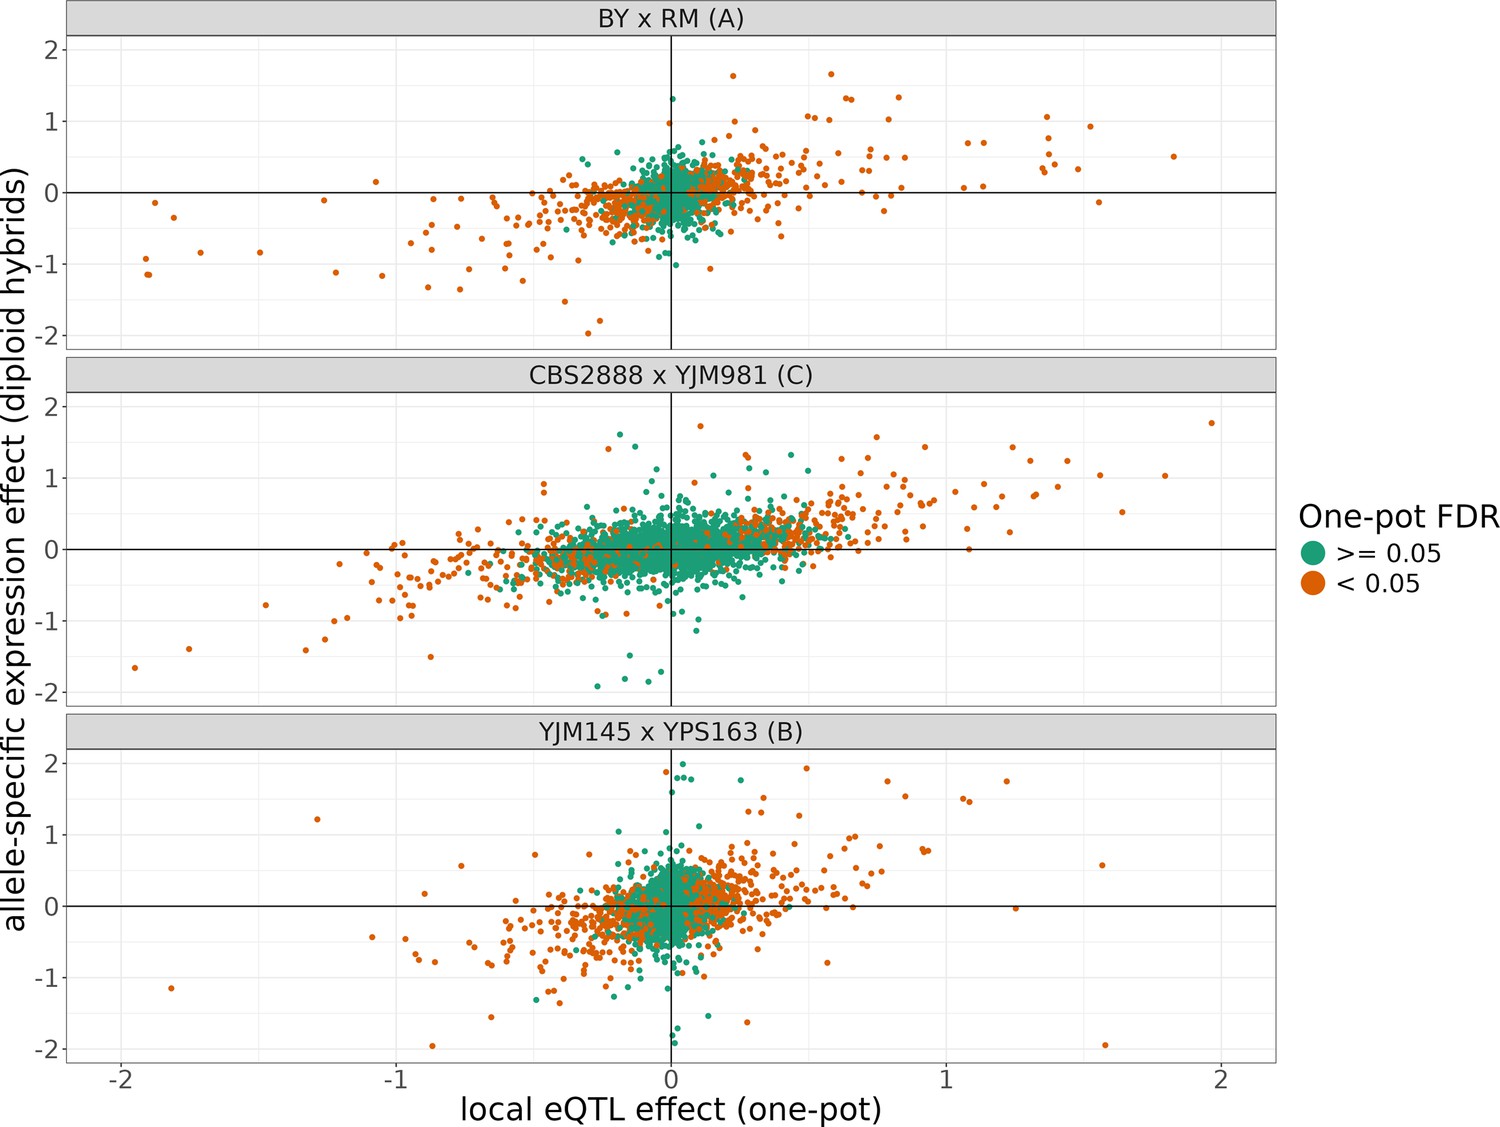
The allele-specific expression effects compared to the local eQTL effects from each cross.
The position of points on the y-axis represents the allele-specific expression effect of a transcript estimated from the three F1 diploid hybrids of crosses of each of the shown haploid parents and the position of points on the x-axis represents the local eQTL effect estimated for that gene estimated in our one-pot eQTL experiment. The points are colored depending on whether they were significant in the one-pot eQTL experiment at a false-discovery rate (FDR) of <5%. The x and y axes have been truncated at –2 and 2 for ease of visualization purposes, which left out 117 of 7942 data points.
Figure 4—figure supplement 2
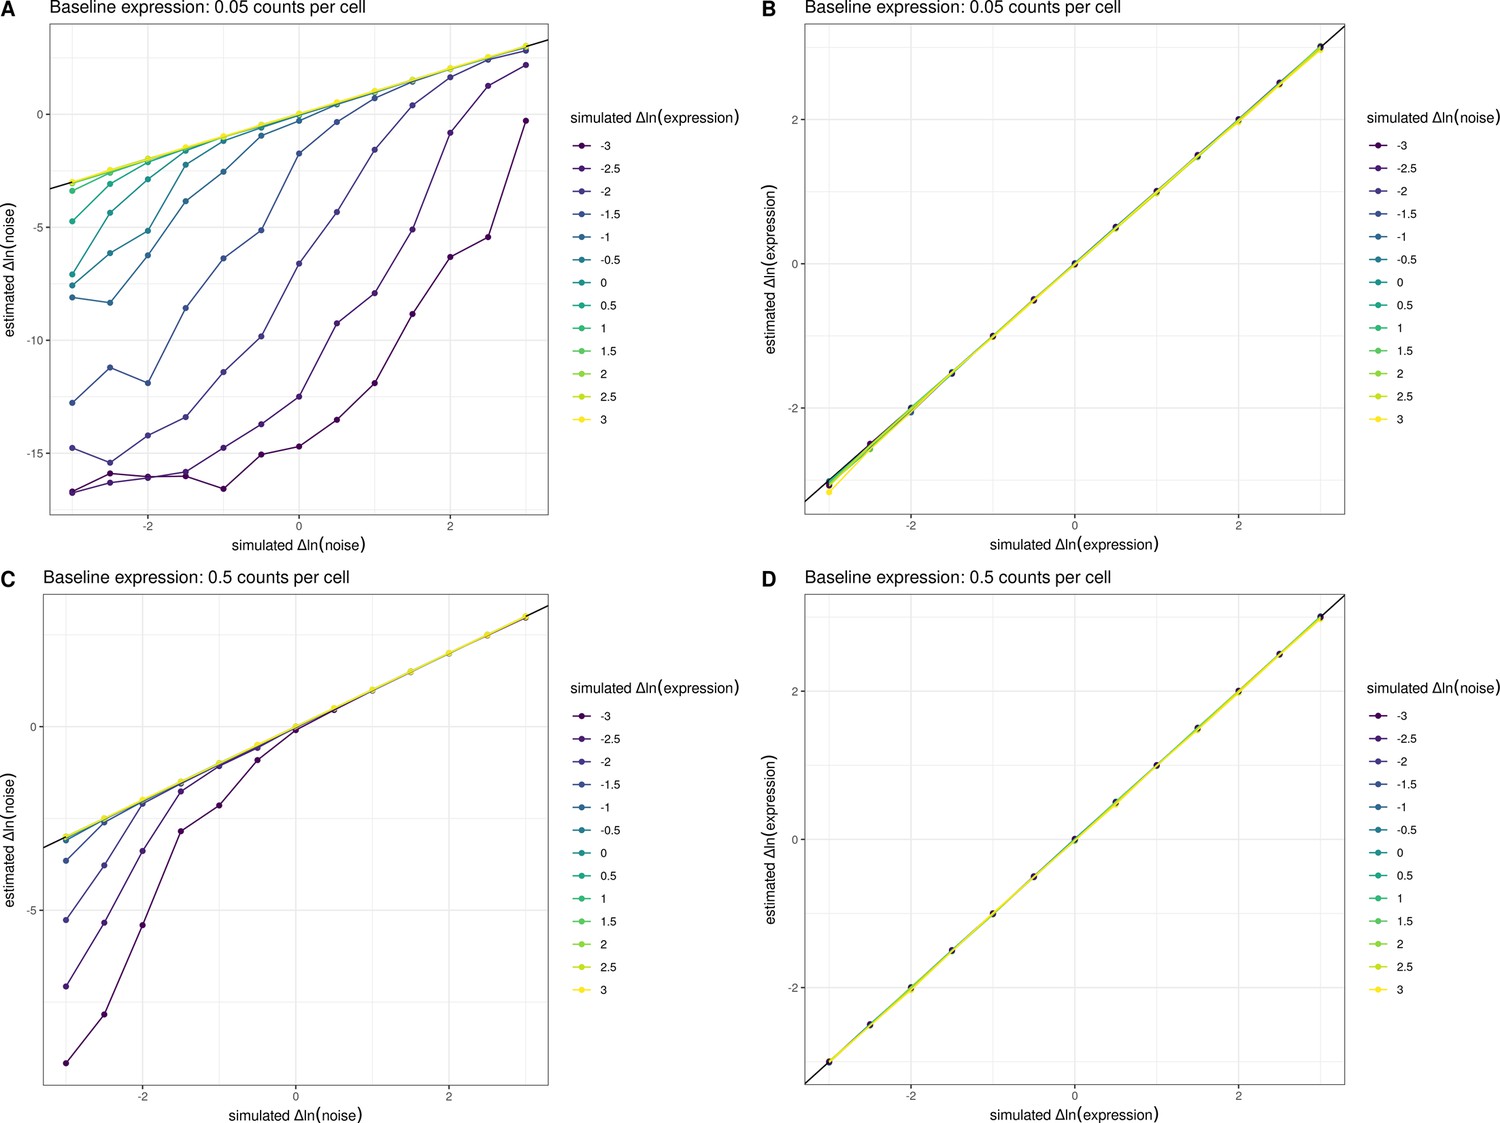
Estimates of noise are biased downwards at low expression levels.
We simulated allele-specific counts from 5000 cells across a range of differences in expression level and noise and fit a count-based negative binomial model with a genotype effect for both the mean and the noise (Methods). The estimated and simulated parameters are displayed across the panels. For (A, B), we assumed a baseline expression of 0.05 counts per cell, and for (C, D), we assumed a baseline expression of 0.5 counts per cell. 0.05 counts per cell represents the number of counts observed for an average yeast gene in our experiments, and 0.5 counts per cell represents the average number of counts observed for the top 10% of yeast genes in our single-cell data. In (A, C) the relationship between the simulated change in ln(noise) between alleles and estimated change in ln(noise) between alleles is shown. Individual lines were grouped and colored based on the amount of simulated change in ln(expression) between alleles. In (B, D), the relationship between the simulated change in ln(expression) between alleles and estimated change in ln(expression) between alleles is shown. Individual lines were grouped and colored based on the amount of simulated change in ln(noise). These simulations show that the estimates of noise are biased downwards when expression levels are low, but the p-values are well calibrated and not significant in such instances (data not shown). This behavior of the models runs opposite to the global trend we observe whereby increasing expression decreases noise.
Figure 4—figure supplement 3
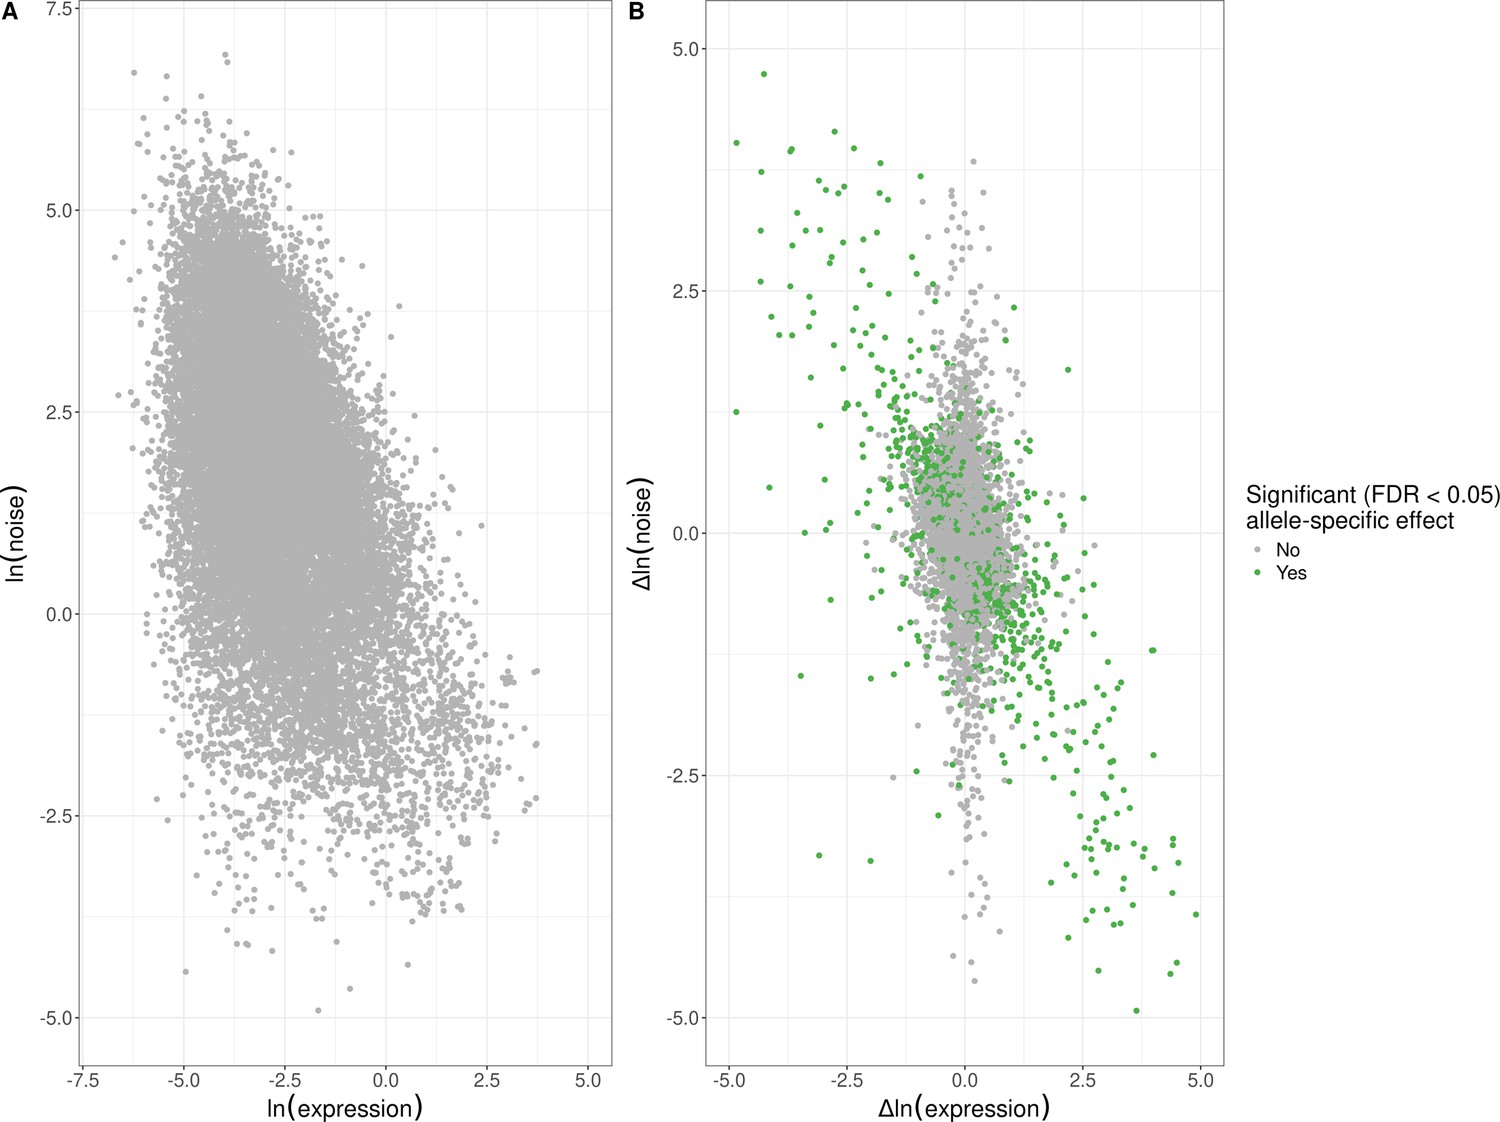
Empirical global relationship between expression noise and average expression levels.
(A) Log–log scatter plot of allelic average expression (x-axis) against allelic expression noise (y-axis); points correspond to all 22,294 alleles for which we were able to estimate allele-specific effects. Average allelic expression is negatively correlated with allelic noise (Spearman’s ⍴ = −0.42, p < 10–15). (B) Log–log scatter plot of change in expression between alleles (x-axis) against change in expression noise between alleles (y-axis); points correspond to all 11,147 genes for which we were able to estimate allele-specific effects. Points in green highlight the 1487 genes with significant allele-specific effects at a false-discovery rate (FDR) of <5% on expression noise and/or average expression. Changes in noise are negatively correlated with expression level, across all genes (Spearman’s ⍴ = −0.32, p < 10–15), genes without an allele-specific effect (Spearman’s ⍴ = −0.23, p < 10–15), and genes with significant allele-specific effects (Spearman’s ⍴ = −0.64, p < 10–15). The x and y axes have been truncated at –5 and 5 for ease of visualization purposes, which left out 142 of 11,147 data points.
Figure 5 with 1 supplement
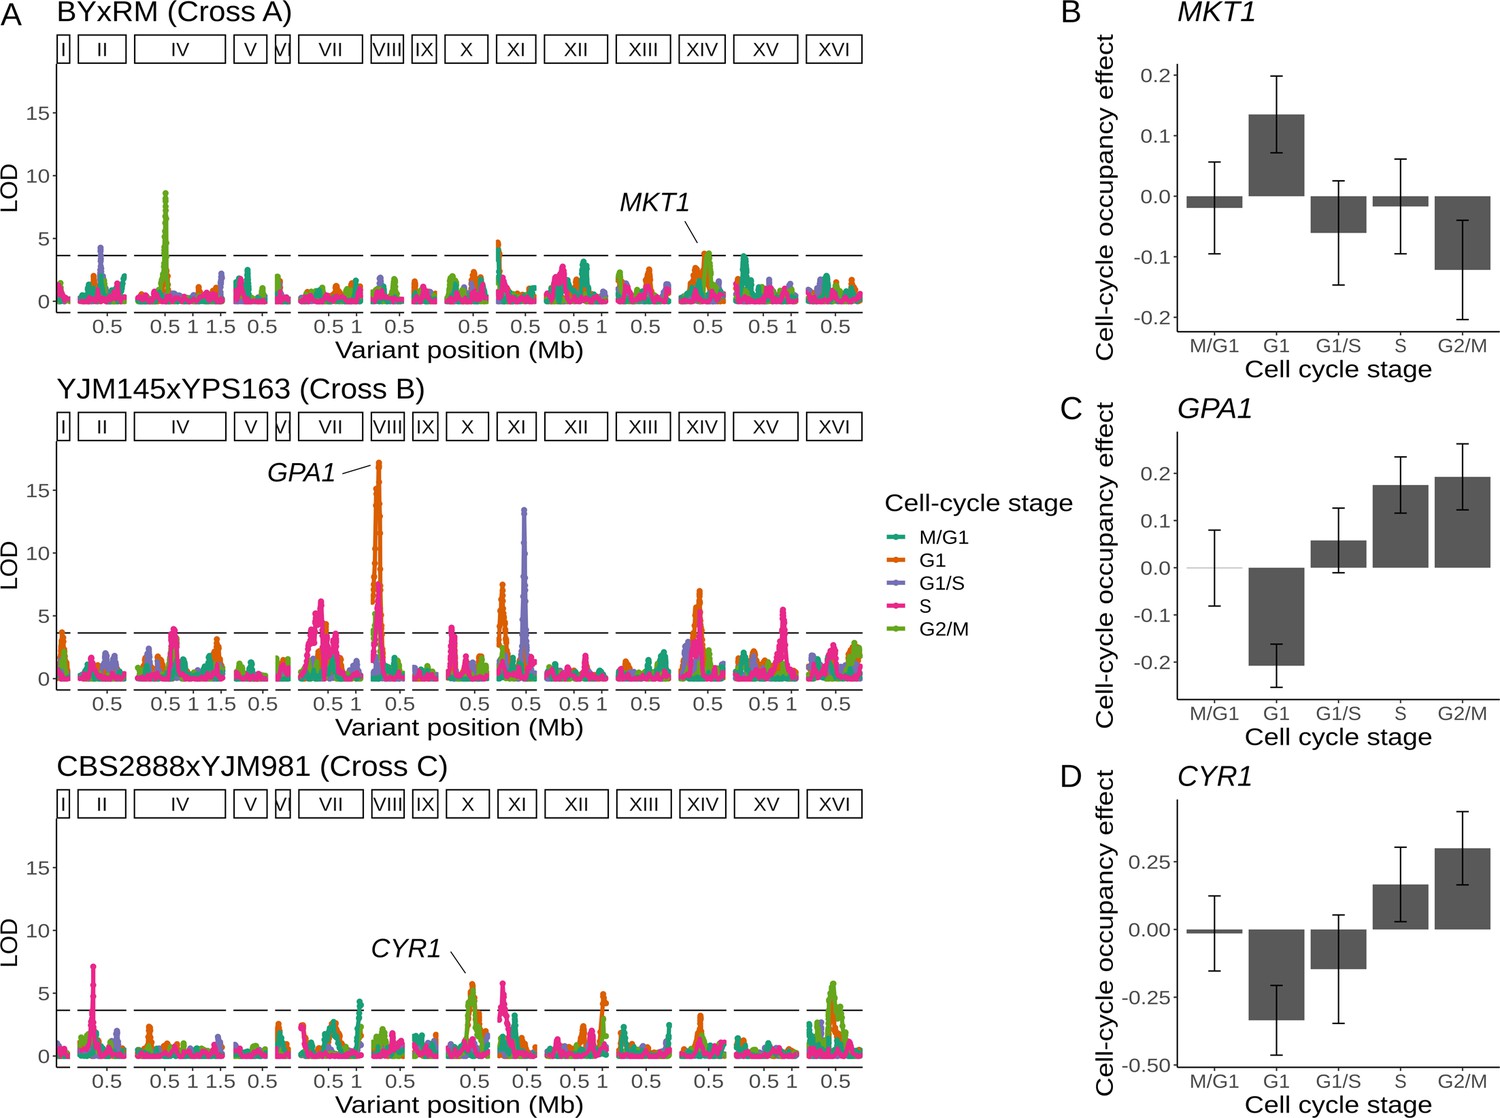
Natural genetic variants affect cell-cycle occupancy.
(A) Cell-cycle occupancy QTL map for three different crosses. LOD score for linkage with cell-cycle occupancy (y-axis) is plotted against the genomic location of genetic markers (x-axis). Colored lines show results for different cell-cycle stages as denoted in the legend. Horizontal line corresponds to a family-wise error rate (FWER) threshold of 0.05. Text labels highlight genes with QTL effects shown in panels B–D. Cell-cycle occupancy mapping was not performed on chromosome III. (B) Variation in MKT1 increases G1 occupancy and decreases G2/M occupancy in the BY × RM cross. (C) Variation in GPA1 decreases G1 occupancy and increases S and G2/M occupancy in the YJM145 × YPS163 cross. (D) Variation in CYR1 decreases G1 occupancy and increases S and G2/M occupancy in the CBS2888 × YJM981 cross. Error bars in B–D represent 95% confidence intervals.
Figure 5—figure supplement 1
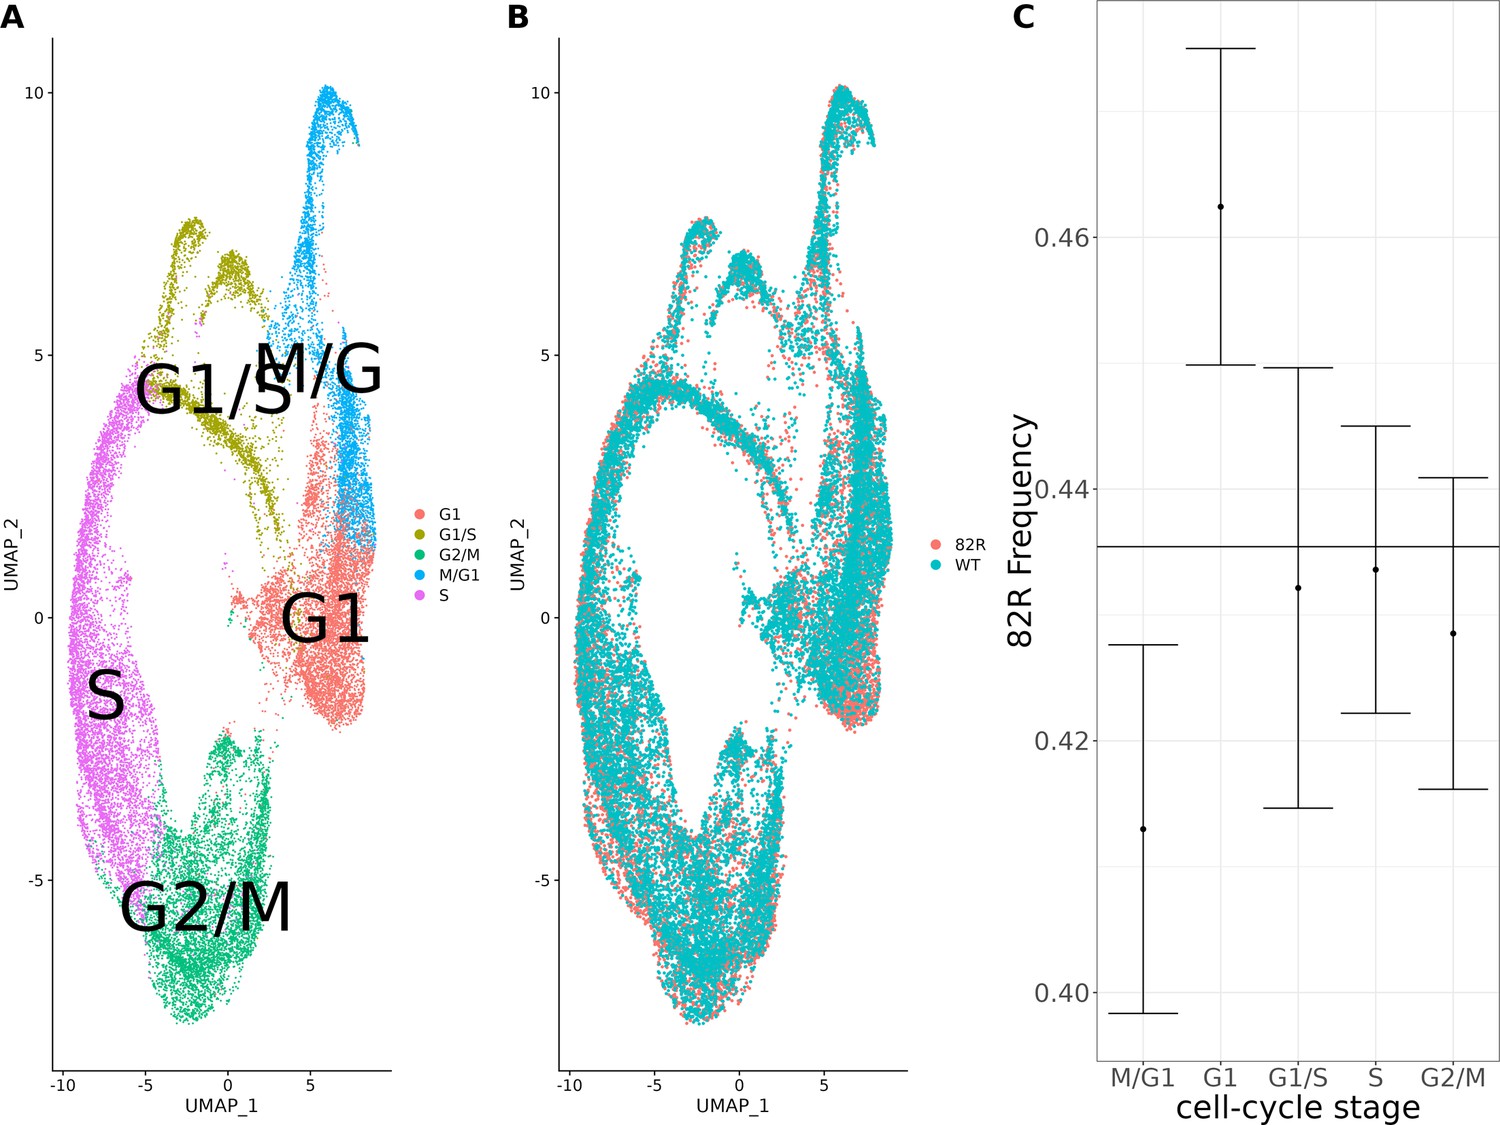
Single-cell expression profiling of allele-replacement strains comparing the cell-cycle distribution of strains with the 82R allele of GPA1 to strains with the WT allele of GPA1.
Single-cell RNA sequencing (scRNA-seq) of 26,859 cells from 11,695 cells with the 82R allele and 11,695 cells with the WT (82W) allele. (A) Combined UMAP plot of the integrated single-cell dataset with cells colored according to their cell-cycle stage. (B) Combined UMAP plot of the integrated single-cell dataset with cells colored according to their genotype at position 82 of the GPA1 protein. (C) Allele frequency of the 82R allele across the cell cycle in our allele-replacement single-cell data. Error bars represent the 95% confidence intervals for the proportion of cells in each cell-cycle stage.
Figure 6 with 3 supplements
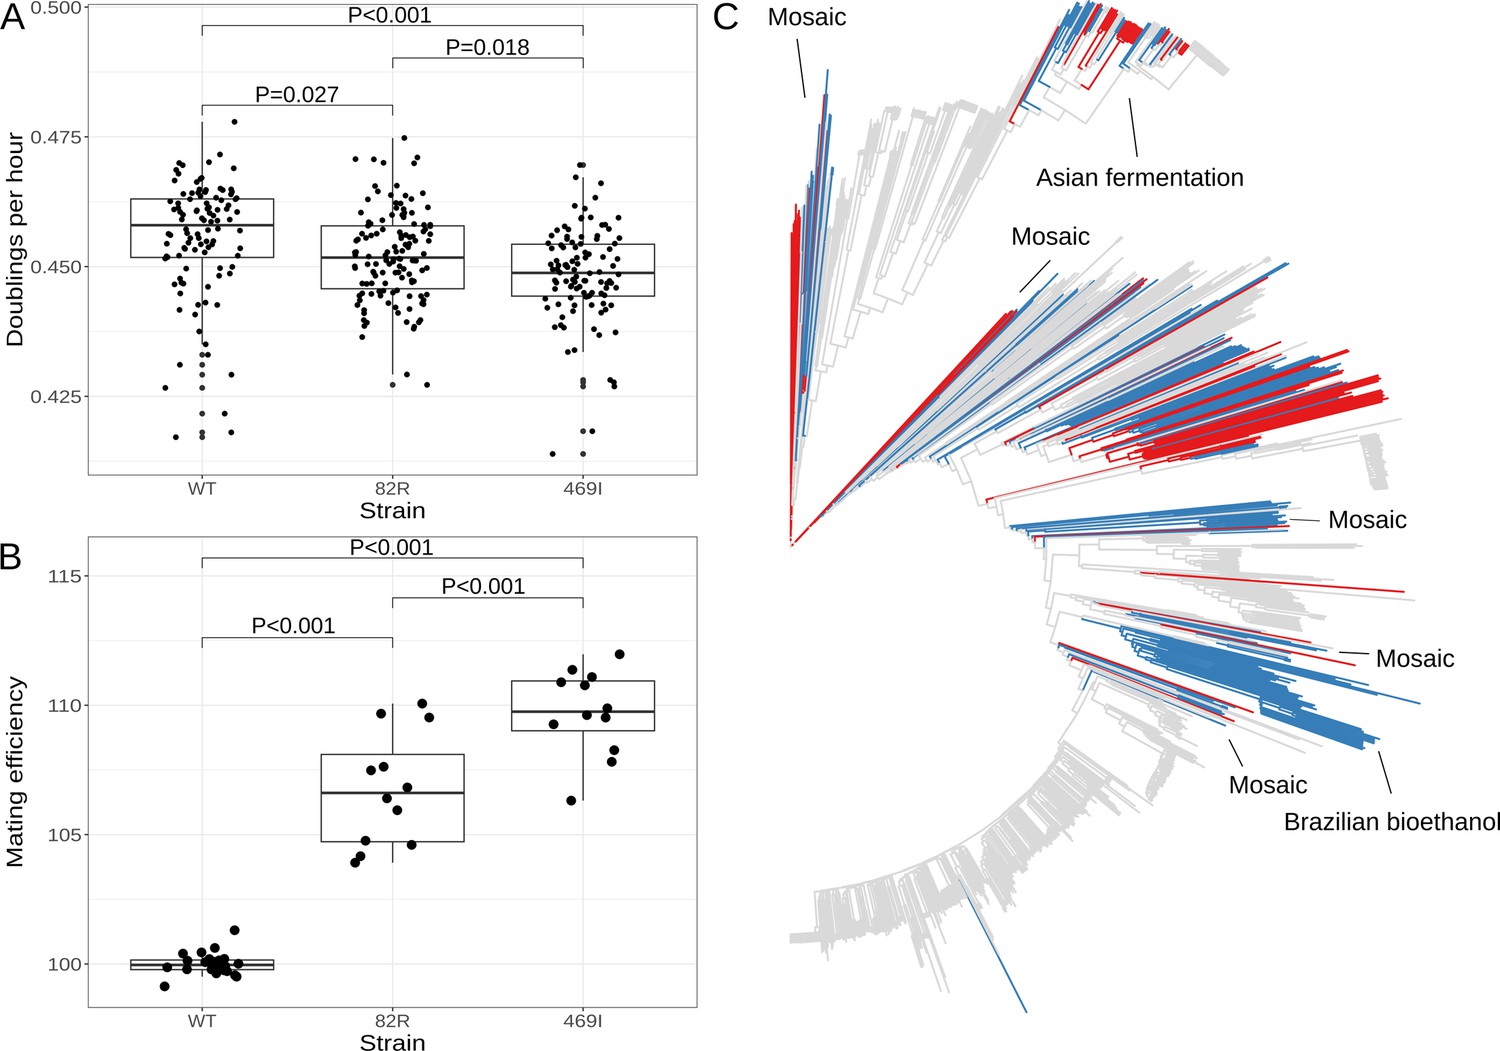
The 82R allele of GPA1 increases mating efficiency at the cost of growth rate and is associated with increased outbreeding in natural populations.
(A) Boxplots show growth of allele replacement strains grown in glucose. Points represent replicate measurements of the doublings per hour for each strain. Tukey’s HSD adjusted p-values of pairwise comparisons of allele replacement strains are shown. (B) Boxplots show mating efficiency of allele replacement strains; details as in A. (C) Genome-wide neighbor-joining tree of 1011 sequenced yeast isolates. Strains in which only the 82R allele is present are denoted in blue; strains with support for both 82R and 82W alleles are denoted in red; and strains in which only 82W allele is present are denoted in gray. We observed that the 82R allele is enriched in mosaic strains (allele frequency = 45.3%, permutation test p = 0.007). Other clades mentioned in the text are labeled on the tree.
Figure 6—figure supplement 1
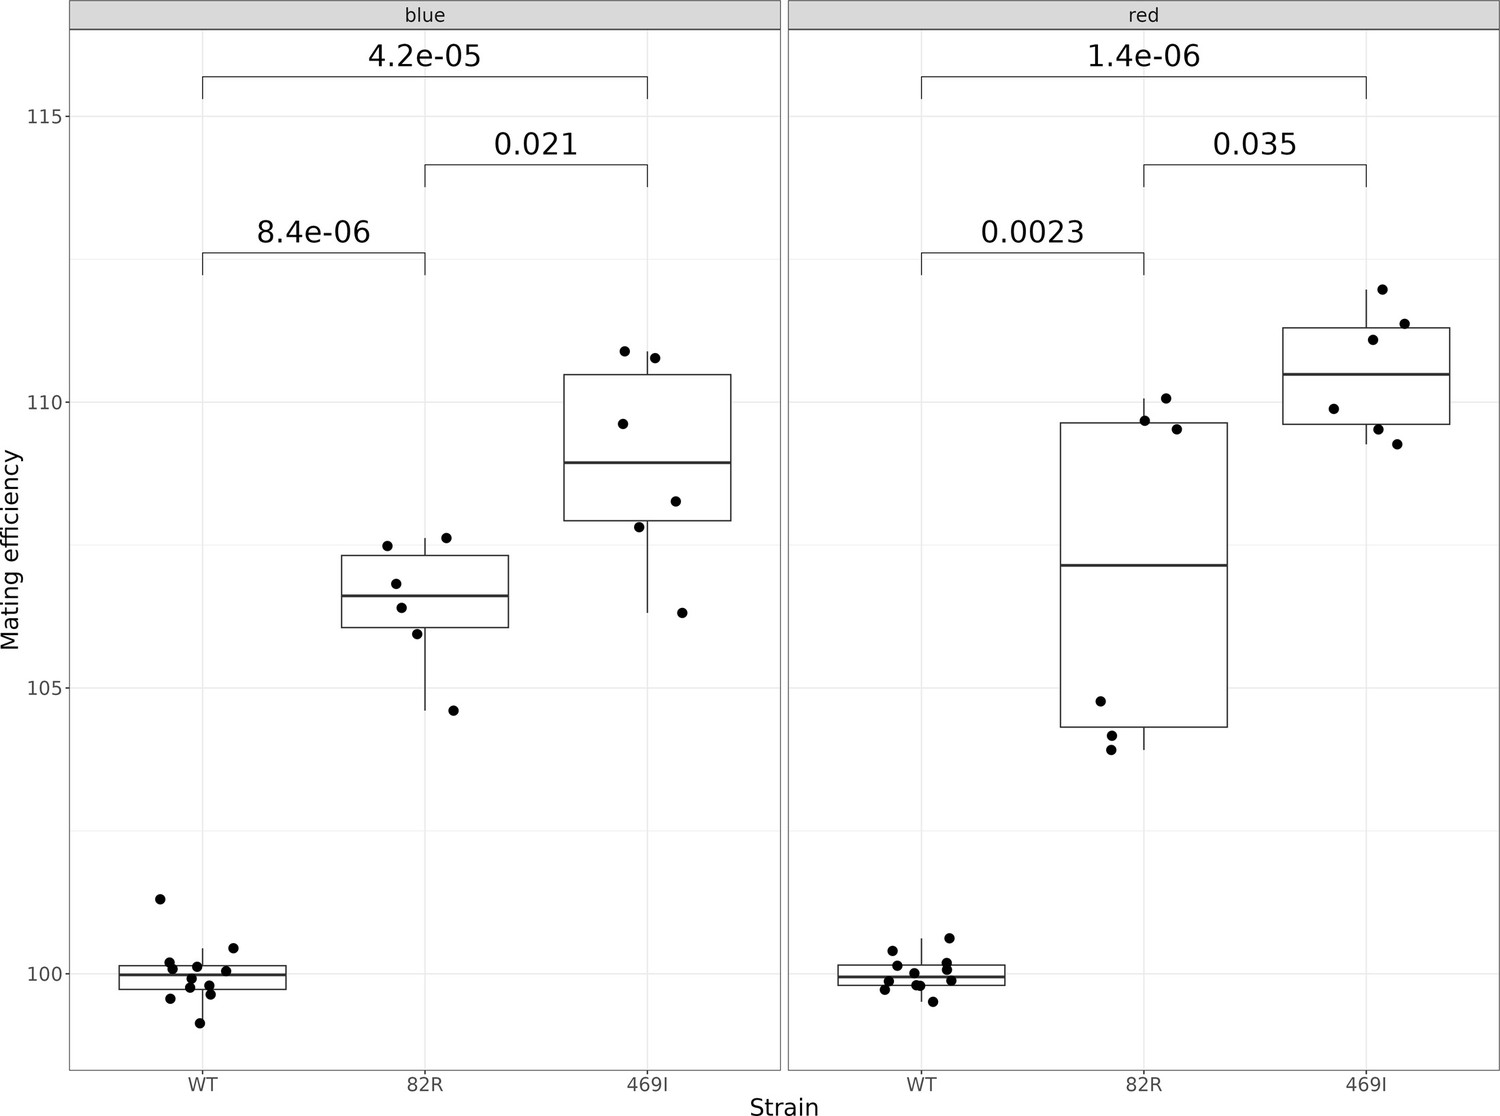
Mating efficiency of the 82R allele of GPA1 compared to the 469I and wild-type (82W 469S) alleles.
The boxplots show the mating efficiency of different allele-replacement strains. Each point represents replicate measurements of the mating efficiency as estimated by flow cytometry. The plot is further subdivided into two panels depending on the color of the fluorescent protein used to estimate mating efficiency. Mating efficiency values were normalized to the average mating efficiency value of the WT strain. The unadjusted p-values of pairwise t-tests between the alleles are shown.
Figure 6—figure supplement 2
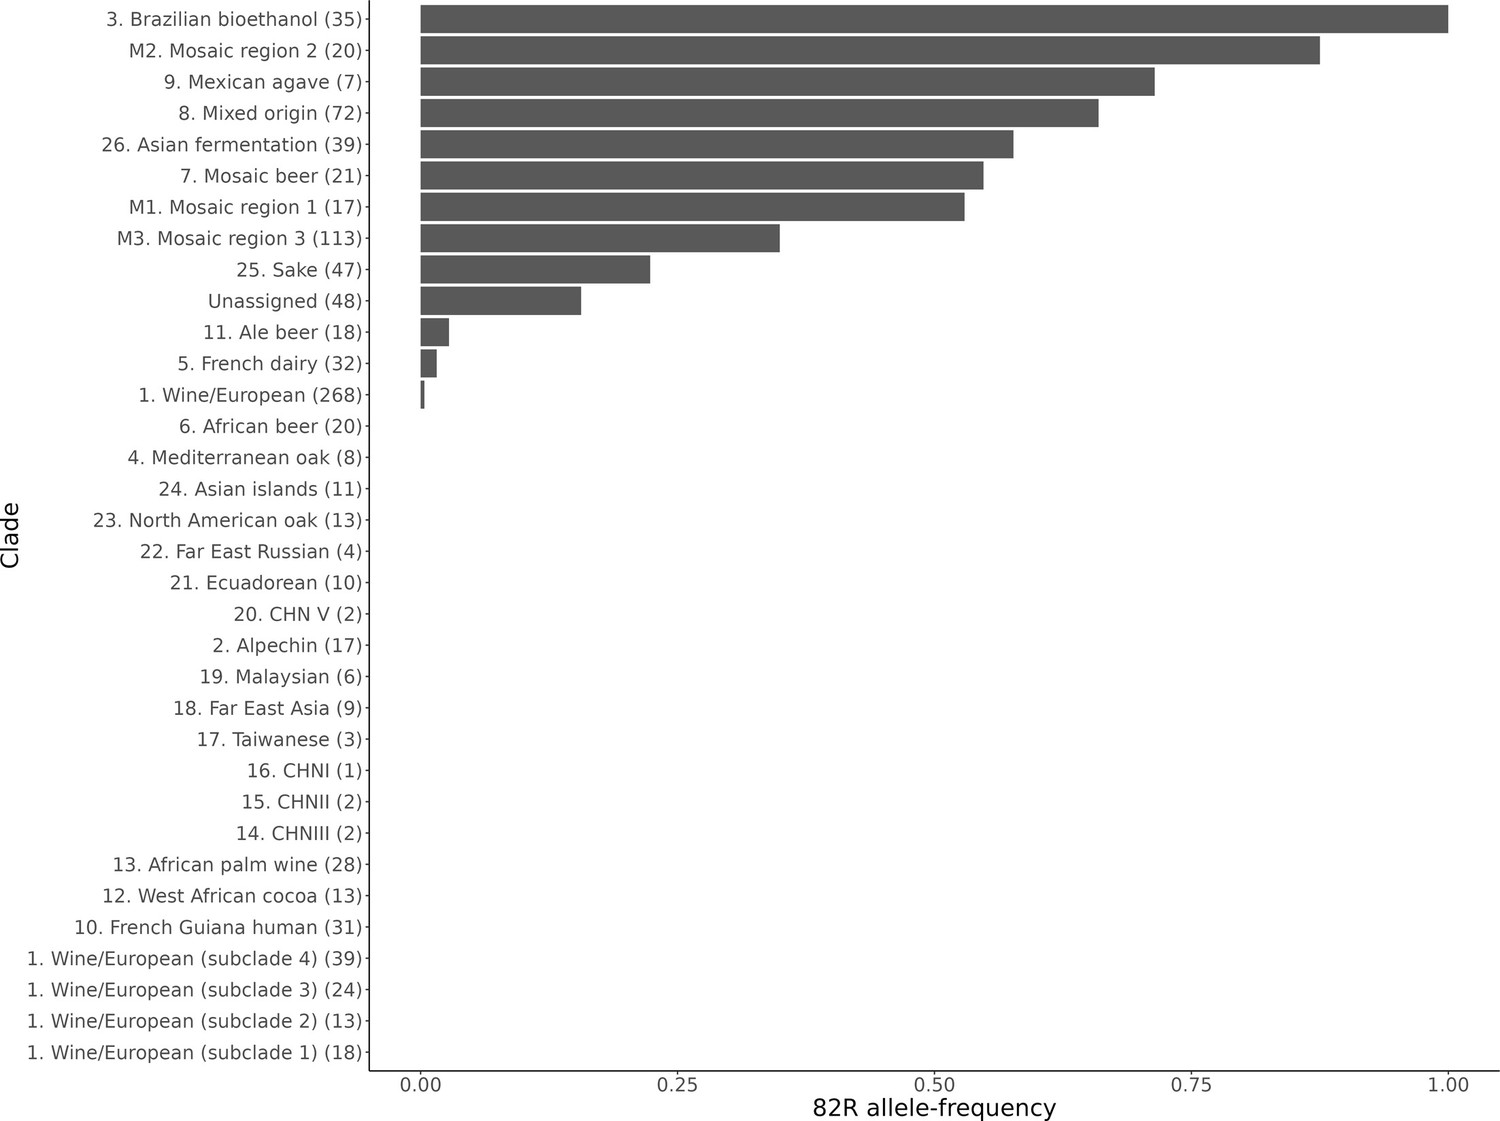
Allele frequency of the 82R allele of GPA1 in sequenced yeast strains.
The allele frequency is further broken down by the clade assignments given in Peter et al., 2018. The number of strains in each clade is given in the brackets next to the clade name.
Figure 6—figure supplement 3
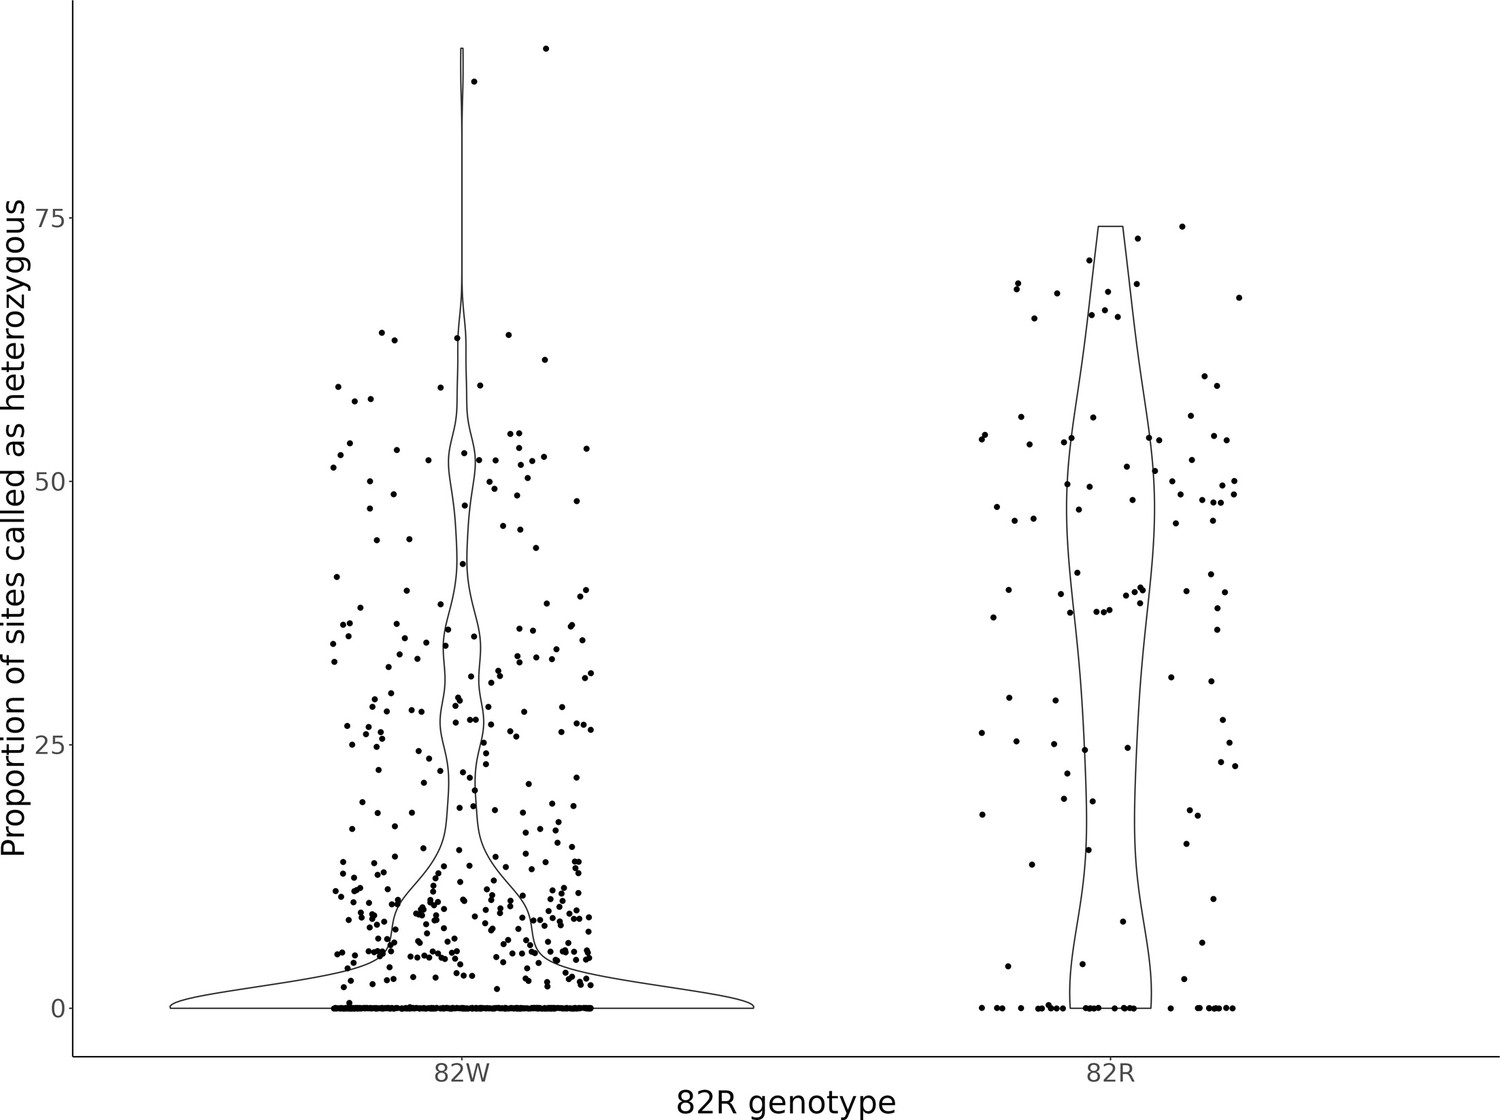
Genome-wide heterozygosity per strain, after classifying strains as having the 82W allele or 82R allele of GPA1.
The violin plots display the distribution of the proportion of sites per strain called heterozygous from Peter et al., 2018. Strains were classified depending on whether it is homozygous for the 82W (N = 760) or 82R (N = 164) alleles. Strains with support for both 82R and 82W alleles (N = 87) were not analyzed here.
Tables
Appendix 1—key resources table
| Reagent type (species) or resource | Designation | Source or reference | Identifiers | Additional information |
|---|---|---|---|---|
| Strain, strain background (Saccharomyces cerevisiae) | YLK3301 | Bloom et al., 2019a | YPS163 MatA ho∆::HphMX flo8∆::NatMX (YLK2438) x YJM145 MatAlpha ho∆::HphMX flo8∆::NatMX (YLK2436) | |
| Strain, strain background (Saccharomyces cerevisiae) | YLK3004 | Bloom et al., 2019a | YJM981 MatAlpha ho∆::HphMX (yST191) x CBS2888 MatA ho∆::KanMX (Box A1 C3) | |
| Strain, strain background (Saccharomyces cerevisiae) | YLK3051 | Bloom et al., 2019a | BY MatA (YLK1879) x RM MatAlpha AMN1-BY ho∆::HphMX flo8∆::NatMX (YLK1950) | |
| Strain, strain background (Saccharomyces cerevisiae) | YLK1993 | Albert et al., 2018 | BY MatA (YLK1879) x RM MatAlpha AMN1-BY ho∆::HphMX flo8∆::NatMX (YLK1950) | |
| Strain, strain background (Saccharomyces cerevisiae) | YLK3221 | Sadhu et al., 2018 | Mata met15Δ his3Δ1 leu2Δ0 ura3Δ0 nej1Δ::KanMX Gpa1-82W,469S [p415 GalL-Cas9-Cyc1t] | |
| Strain, strain background (Saccharomyces cerevisiae) | YLK3302 | This paper | Mata chrVII:113512_C chrVIII:113496_C Gpa1-469S [p415 GalL-Cas9-Cyc1t] | |
| Strain, strain background (Saccharomyces cerevisiae) | YLK3303 | This paper | Mata chrVII:113512_C chrVIII:113496_C Gpa1-469S [p415 GalL-Cas9-Cyc1t] | |
| Strain, strain background (Saccharomyces cerevisiae) | YLK3304 | This paper | Mata chrVII:113512_C chrVIII:113496_C chrVIII:114674_G chrVIII:114672_T Gpa1-469S Gpa1-82W [p415 GalL-Cas9-Cyc1t] | |
| Strain, strain background (Saccharomyces cerevisiae) | YLK3305 | This paper | Mata chrVII:113512_C chrVIII:113496_C chrVIII:114674_G chrVIII:114672_T Gpa1-469S Gpa1-82W [p415 GalL-Cas9-Cyc1t] | |
| Strain, strain background (Saccharomyces cerevisiae) | YLK3306 | This paper | Mata chrVII:113512_C chrVIII:113496_C Gpa1-469S | |
| Strain, strain background (Saccharomyces cerevisiae) | YLK3307 | This paper | Mata chrVII:113512_C chrVIII:113496_C Gpa1-469S | |
| Strain, strain background (Saccharomyces cerevisiae) | YLK3308 | This paper | Mata chrVII:113512_C chrVIII:113496_C chrVIII:114674_G chrVIII:114672_T Gpa1-469S Gpa1-82W | |
| Strain, strain background (Saccharomyces cerevisiae) | YLK3309 | This paper | Mata chrVII:113512_C chrVIII:113496_C chrVIII:114674_G chrVIII:114672_T Gpa1-469S Gpa1-82W | |
| Strain, strain background (Saccharomyces cerevisiae) | YLK3310 | This paper | Mata chrVII:113512_C chrVIII:113496_C chrVIII:114674_G chrVIII:114672_T Gpa1-469S Gpa1-82W | |
| Strain, strain background (Saccharomyces cerevisiae) | YLK3311 | This paper | Mata chrVII:113512_C chrVIII:113496_C chrVIII:114674_G chrVIII:114672_T Gpa1-469S Gpa1-82W | |
| Strain, strain background (Saccharomyces cerevisiae) | YLK3312 | This paper | Mata met15Δ his3Δ1 leu2Δ0 ura3Δ0 nej1Δ::KanMX Gpa1-82W, Gpa1-469I | |
| Strain, strain background (Saccharomyces cerevisiae) | YLK3313 | This paper | Mata met15Δ his3Δ1 leu2Δ0 ura3Δ0 nej1Δ::KanMX Gpa1-82W Gpa1-469I | |
| Strain, strain background (Saccharomyces cerevisiae) | YLK3314 | This paper | Mata chrVII:113512_C chrVIII:113496_C Gpa1-469S [PLK127] | |
| Strain, strain background (Saccharomyces cerevisiae) | YLK3315 | This paper | Mata chrVII:113512_C chrVIII:113496_C Gpa1-469S [PLK128] | |
| Strain, strain background (Saccharomyces cerevisiae) | YLK3316 | This paper | Mata chrVII:113512_C chrVIII:113496_C chrVIII:114674_G chrVIII:114672_T Gpa1-469S Gpa1-82W [PLK127] | |
| Strain, strain background (Saccharomyces cerevisiae) | YLK3317 | This paper | Mata chrVII:113512_C chrVIII:113496_C chrVIII:114674_G chrVIII:114672_T Gpa1-469S Gpa1-82W [PLK128] | |
| Strain, strain background (Saccharomyces cerevisiae) | YLK3318 | This paper | Mata met15Δ his3Δ1 leu2Δ0 ura3Δ0 nej1Δ::KanMX Gpa1-82W, Gpa1-469S [PLK127] | |
| Strain, strain background (Saccharomyces cerevisiae) | YLK3319 | This paper | Mata met15Δ his3Δ1 leu2Δ0 ura3Δ0 nej1Δ::KanMX Gpa1-82W, Gpa1-469S [PLK128] | |
| Recombinant DNA reagent | MF2 p41 neo (plasmid) | Treusch et al., 2015 | RRID:Addgene_58564 | Flourescent magic marker plasmid with KanMX resistant cassette |
| Recombinant DNA reagent | MF2 p41 nat (plasmid) | Treusch et al., 2015 | RRID:Addgene_58546 | Flourescent magic marker plasmid with NatMX resistant cassette |
| Recombinant DNA reagent | p415 GalL-Cas9-Cyc1t (plasmid) | DiCarlo et al., 2013 | RRID:Addgene_43804 | Gal inducible CAS9 with LEU cassette |
| Recombinant DNA reagent | SNR52p-gRNA(BstEII/SphI). CAN1.Y-SUP4t (plasmid) | DiCarlo et al., 2013 | RRID:Addgene_98814 | Guide RNA expression plasmid with URA resistance |
| Recombinant DNA reagent | plk88+GPA1 novel variant (plasmid) | This paper | Guide RNA and coupled repair template to change 82 W to 82 R in Gpa1 | |
| Recombinant DNA reagent | plk88+GPA1 reversion (plasmid) | This paper | Guide RNA and coupled repair template to change 82I to 82 S in Gpa1 | |
| Recombinant DNA reagent | HIS3 2 um with ruby2 (plasmid) | This paper | ConLS-pTef1-mRuby2-tEno1-ConR1-His3-2micron-AmpR | |
| Recombinant DNA reagent | HIS3 2 um with mTurquoise (plasmid) | This paper | ConLS-pTef1-mTurquoise-tEno1-ConR1-His3-2micron-AmpR | |
| Commercial assay or kit | Chromium Single Cell 3' v3 | 10 x Genomics | 10 X:CG000201 | |
| Software, algorithm | HMM, eQTL mapping, and noise analysis code | This paper | Avaliable at https://github.com/joshsbloom/single_cell_eQTL, archived at: https://doi.org/10.5281/zenodo.14834926 | |
| Software, algorithm | 3' UTR extension script for cell ranger | This paper | Available at https://gist.github.com/theboocock/aacf72277a572ee3fe589c430bfd496e | |
| Software, algorithm | Figure creation code | This paper | Avaliable at https://github.com/theboocock/yeast_single_cell_post_mapping_analysis, archived at: https://doi.org/10.5281/zenodo.14834916 |
Additional files
-
Supplementary file 1
Yeast strains (Table S1), plasmids (Table S2), and primers used in this study (Table S3); summary information for the single-cell expression data generated in this study (Table S4); variance explained by cell-cycle stage and the effect of segregant per transcript for the 393 previously generated segregants (Table S5); and Local eQTL summary statistics for the 393 previously generated segregants (Table S6).
- https://cdn.elifesciences.org/articles/95566/elife-95566-supp1-v1.xlsx
-
Supplementary file 2
Local eQTL summary statistics for our one-pot eQTL experiments.
Each sheet has the local eQTL summary statistics for the three crosses we examined (Table S1 cross A=BY and RM, Table S2 cross B=YJM145 and YPS163, Table S3 cross C=CBS2888xYJM981). The column ‘has cell-cycle interaction’ is set to 1 if a cell-cycle interaction was observed at a FDR of <5%. For cross A, the summary statistics from bulk eQTL are provided in additional columns. For cross A, the summary statistics from bulk eQTL7 are provided in additional columns. Missing values in the bulk eQTL columns indicate that a gene did not pass our filtering criteria, and a local eQTL test was not performed.
- https://cdn.elifesciences.org/articles/95566/elife-95566-supp2-v1.xlsx
-
Supplementary file 3
Distant eQTL summary statistics for our one-pot eQTL experiments.
Each sheet has the local eQTL summary statistics for the three crosses we examined (Table S1 cross A=BY and RM, Table S2 cross B=YJM145 and YPS163, Table S3 cross C=CBS2888xYJM981). The column ‘has cell-cycle interaction’ is set to 1 if a cell-cycle interaction was observed at a FDR of <5%. The column ‘eQTL in hotspot’ is set to 1 if a distal eQTL falls within a significant hotspot bin.
- https://cdn.elifesciences.org/articles/95566/elife-95566-supp3-v1.xlsx
-
Supplementary file 4
Hotspot annotation files for each cross (cross A = BY and RM, cross B = YJM145 and YPS163, cross C = CBS2888xYJM981, A_bulk = BY and RM with expression measured by bulk RNA-seq Albert et al., 2018).
- https://cdn.elifesciences.org/articles/95566/elife-95566-supp4-v1.zip
-
Supplementary file 5
Single-cell allele-specific expression (ASE) summary statistics.
Each sheet has the ASE summary statistics for the parental hybrids of the three crosses we examined (Table S1 cross A=BY and RM, Table S2 cross B=YJM145 and Table S3 YPS163, cross C=CBS2888xYJM981). The local eQTL summary statistics were included from the corresponding one-pot eQTL experiment for each transcript that was tested there. Missing values in the one-pot eQTL columns indicate that a gene did not pass our filtering criteria, and a local eQTL test was not performed.
- https://cdn.elifesciences.org/articles/95566/elife-95566-supp5-v1.xlsx
-
Supplementary file 6
Summary statistics for allele-specific effects on noise and average expression.
Each sheet has the summary statistics for the parental hybrids of the three crosses we examined (Table S1 cross A=BY and RM, Table S2 cross B=YJM145 and YPS163, Table S4 cross C=CBS2888xYJM981). The estimates and p-values are derived from the joint model that contains cell-cycle, cell-cycle interactions, and allelic effects on both the mean and noise. The column ‘Overlaps global trend line’ is set to 1 if the 95% confidence interval of the noise effect did not overlap the 95% confidence interval of the global trend line.
- https://cdn.elifesciences.org/articles/95566/elife-95566-supp6-v1.xlsx
-
Supplementary file 7
Cell-cycle occupancy QTL summary statistics for our one-pot eQTL experiments.
Each sheet has the cell-cycle occupancy QTL summary statistics for the three crosses we examined (Table S1 cross A=BY and RM, Table S2 cross B=YJM145 and YPS163, Table S3 cross C=CBS2888xYJM981).
- https://cdn.elifesciences.org/articles/95566/elife-95566-supp7-v1.xlsx
-
Supplementary file 8
Alignment and tree files from a clustered blast search of the yeast Gpa1 protein sequence (YHR005C).
- https://cdn.elifesciences.org/articles/95566/elife-95566-supp8-v1.zip
-
Supplementary file 9
Single-cell RNA sequencing of allele-replacement strains with the 82R and 82W alleles of GPA1.
The distant eQTL effects near GPA1 from our one-pot eQTL experiment are contrasted to a differential expression analysis of our allele replacement strains. The p-values from our one-pot eQTL study were adjusted using a permutation procedure, and a Bonferroni correction was used to adjust the single-cell validation p-values. Missing values in the single-cell validation columns indicate that a gene did not pass our filtering criteria, and a differential expression test was not performed.
- https://cdn.elifesciences.org/articles/95566/elife-95566-supp9-v1.xlsx
-
MDAR checklist
- https://cdn.elifesciences.org/articles/95566/elife-95566-mdarchecklist1-v1.pdf
Download links
A two-part list of links to download the article, or parts of the article, in various formats.
Downloads (link to download the article as PDF)
Open citations (links to open the citations from this article in various online reference manager services)
Cite this article (links to download the citations from this article in formats compatible with various reference manager tools)
Single-cell eQTL mapping in yeast reveals a tradeoff between growth and reproduction
eLife 13:RP95566.
https://doi.org/10.7554/eLife.95566.3


