SRF-deficient astrocytes provide neuroprotection in mouse models of excitotoxicity and neurodegeneration
- Centre for Neuroscience, Indian Institute of Science, India
- Neuroscience Unit, Jawaharlal Nehru Centre for Advanced Scientific Research, India
- Department of Neurology, Washington University School of Medicine, United States
Figures
Figure 1 with 2 supplements
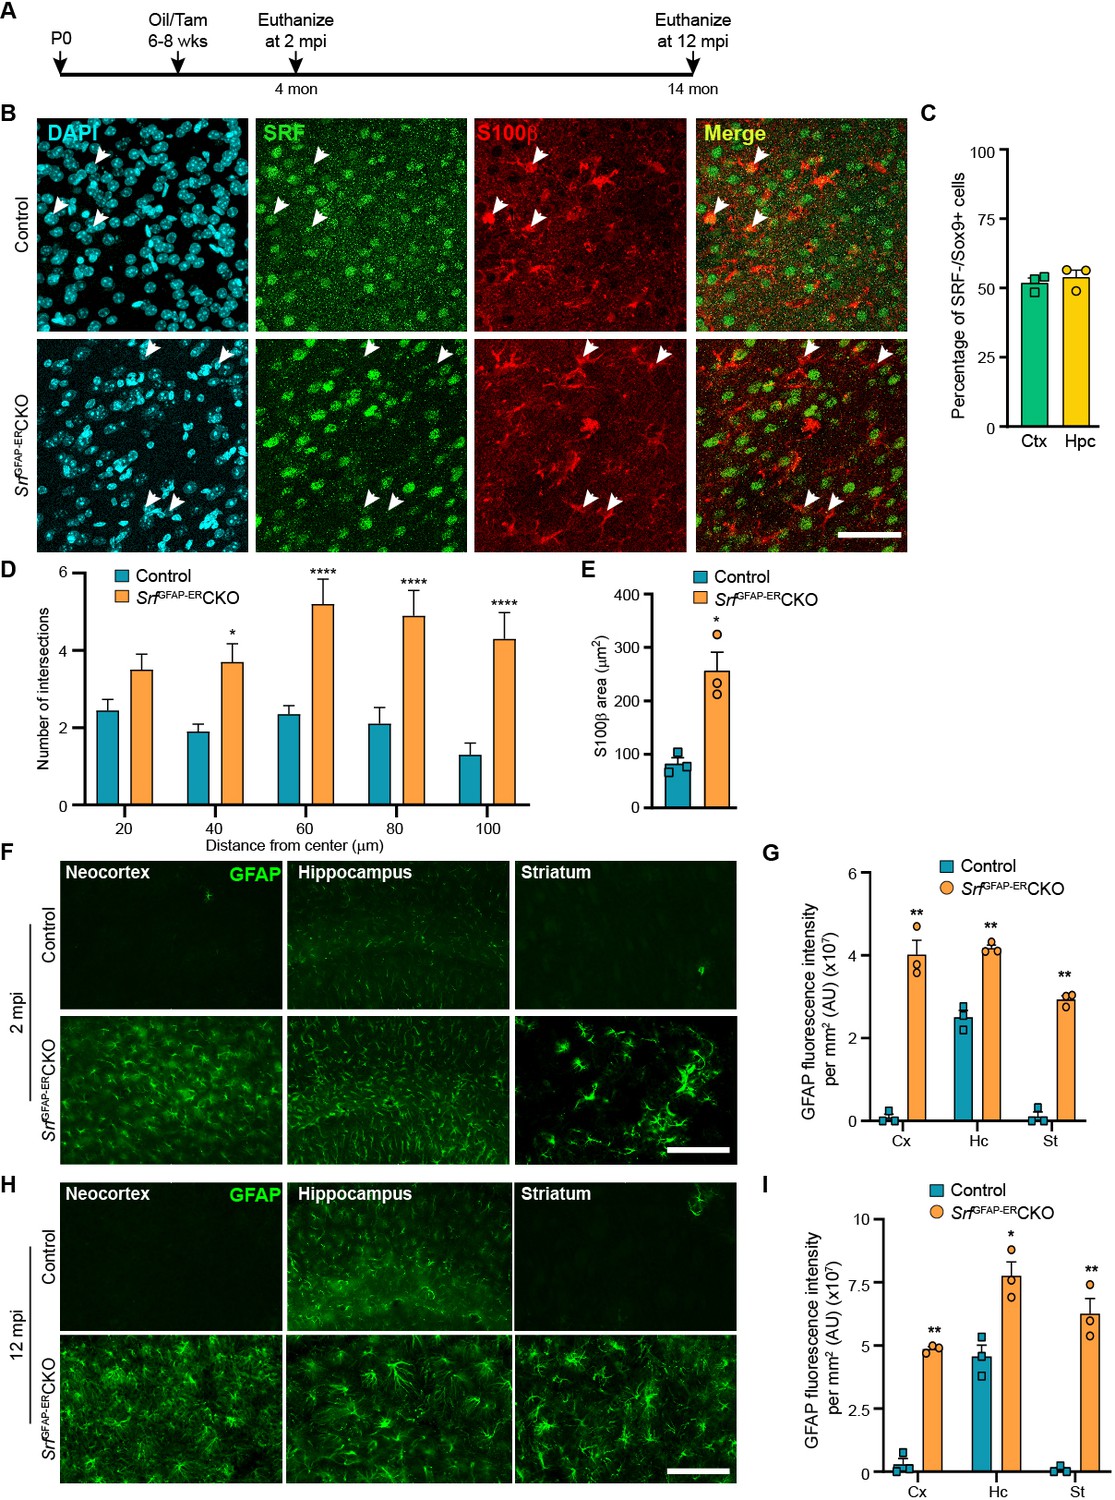
Srf deletion in post-natal astrocytes results in hypertrophic GFAP +astrocytes.
(A) Schematic of timeline of tamoxifen injection and analysis of astrocyte phenotype. (B) Coronal sections showing immunostaining for SRF and S100β in control and SrfGFAP-ERCKO mice at 2 mpi. Astrocytes in control mice showed staining for both SRF and S100β while several astrocytes in the mutant mice did not show any SRF staining (white arrowheads). (C) Quantification of extent of SRF loss in astrocytes. (D) Sholl analysis of S100β expressing astrocytes from (B) shows hypertrophic morphology of SRF ablated astrocytes. n=3 mice. (E) Quantification of S100β-immunoreactive surface area. n=3 mice. (F) Coronal sections showing immunostaining for GFAP in control and SrfGFAP-ERCKO mutant mice at 2 mpi. (G) Quantification of relative GFAP fluorescence intensity in F. n=3 mice. (H) Coronal sections showing immunostaining for GFAP in control and SrfGFAP-ERCKO mutant mice at 12 mpi. (I) Quantification of GFAP fluorescence intensity in H. n=3 mice. Data are represented as mean ± SEM. * p<0.05, ** p<0.01, **** p<0.0001, ns, not significant. Unpaired t-test. Scale bar, 50 µm (B), 100 µm (F, H).
Figure 1—figure supplement 1
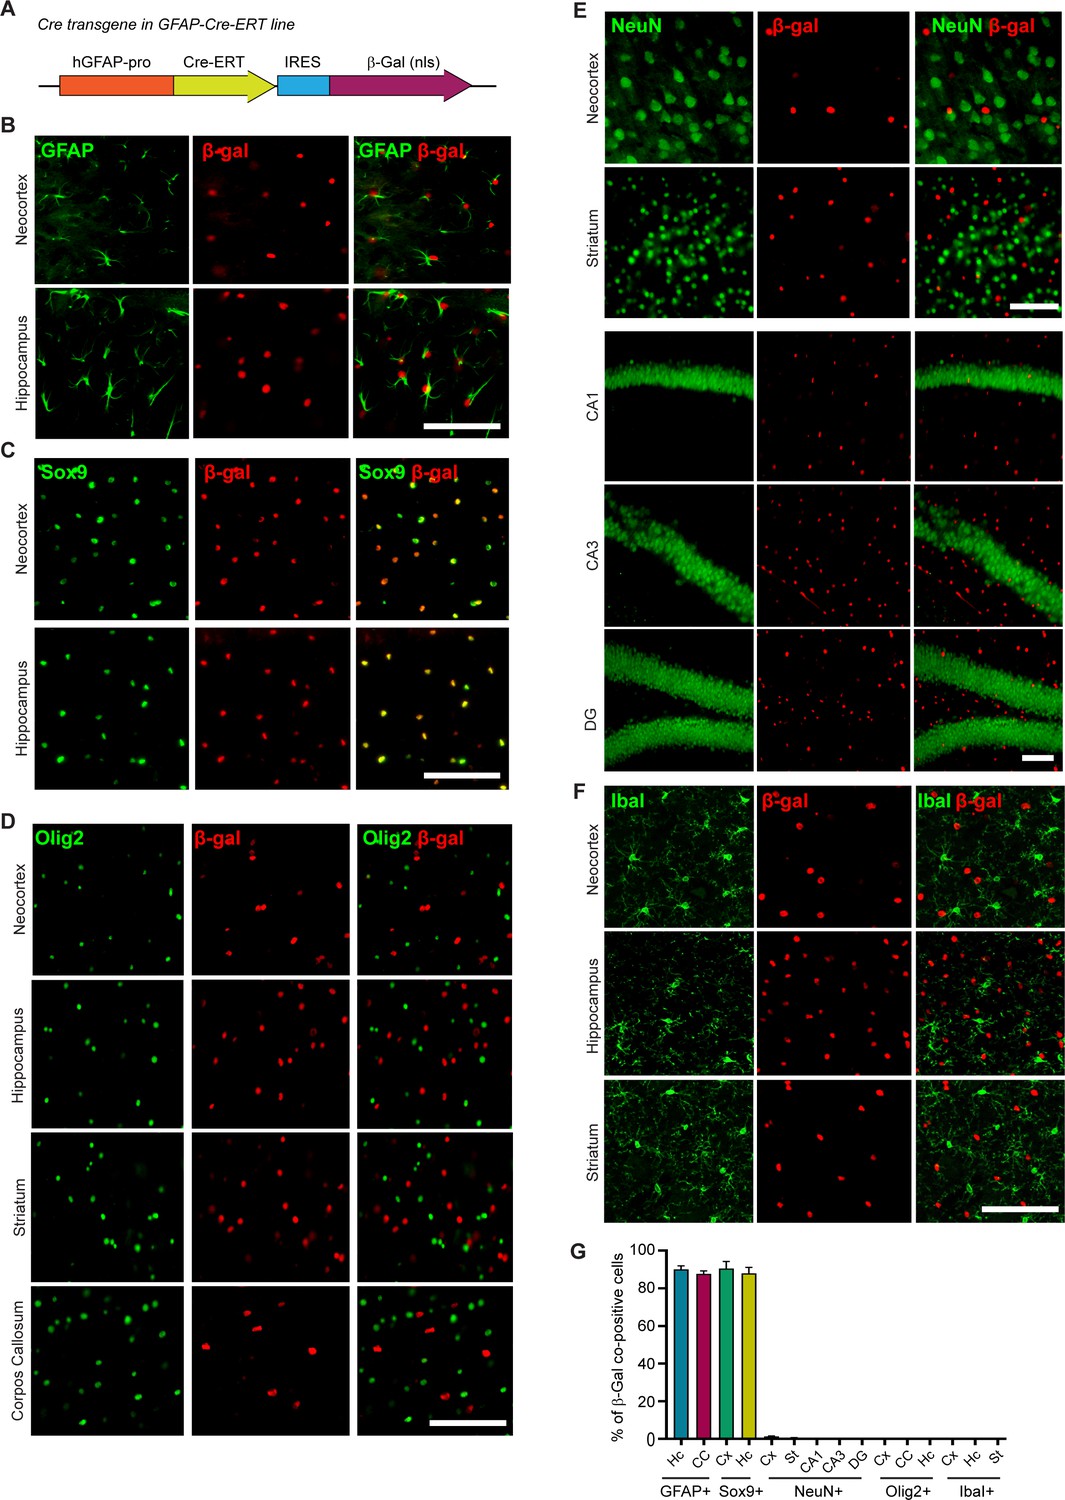
Cre recombinase expression in hGFAP-Cre-ERT transgenic mouse line.
(A) Schematic of Cre recombinase transgene in hGFAP-Cre-ERT mouse line. (B–F) Coronal sections showing co-immunostaining of GFAP+/β-Gal+ cells (B), Sox9+/β-Gal+ cells (C), Olig2+/β-Gal+ cells (D), NeuN+/β-Gal+ cells (E), IbaI+/β-Gal+ cells (F) in the indicated regions. β-Gal staining serves as a proxy for Cre-ERT expression. (G) Quantification of β-Gal+ cells that are co-positive for cell-specific markers. Cx, neocortex; Hc, hippocampus; DG, dentate gyrus; CC, corpus callosum; St, striatum. Scale bar, 100 µm.
Figure 1—figure supplement 2
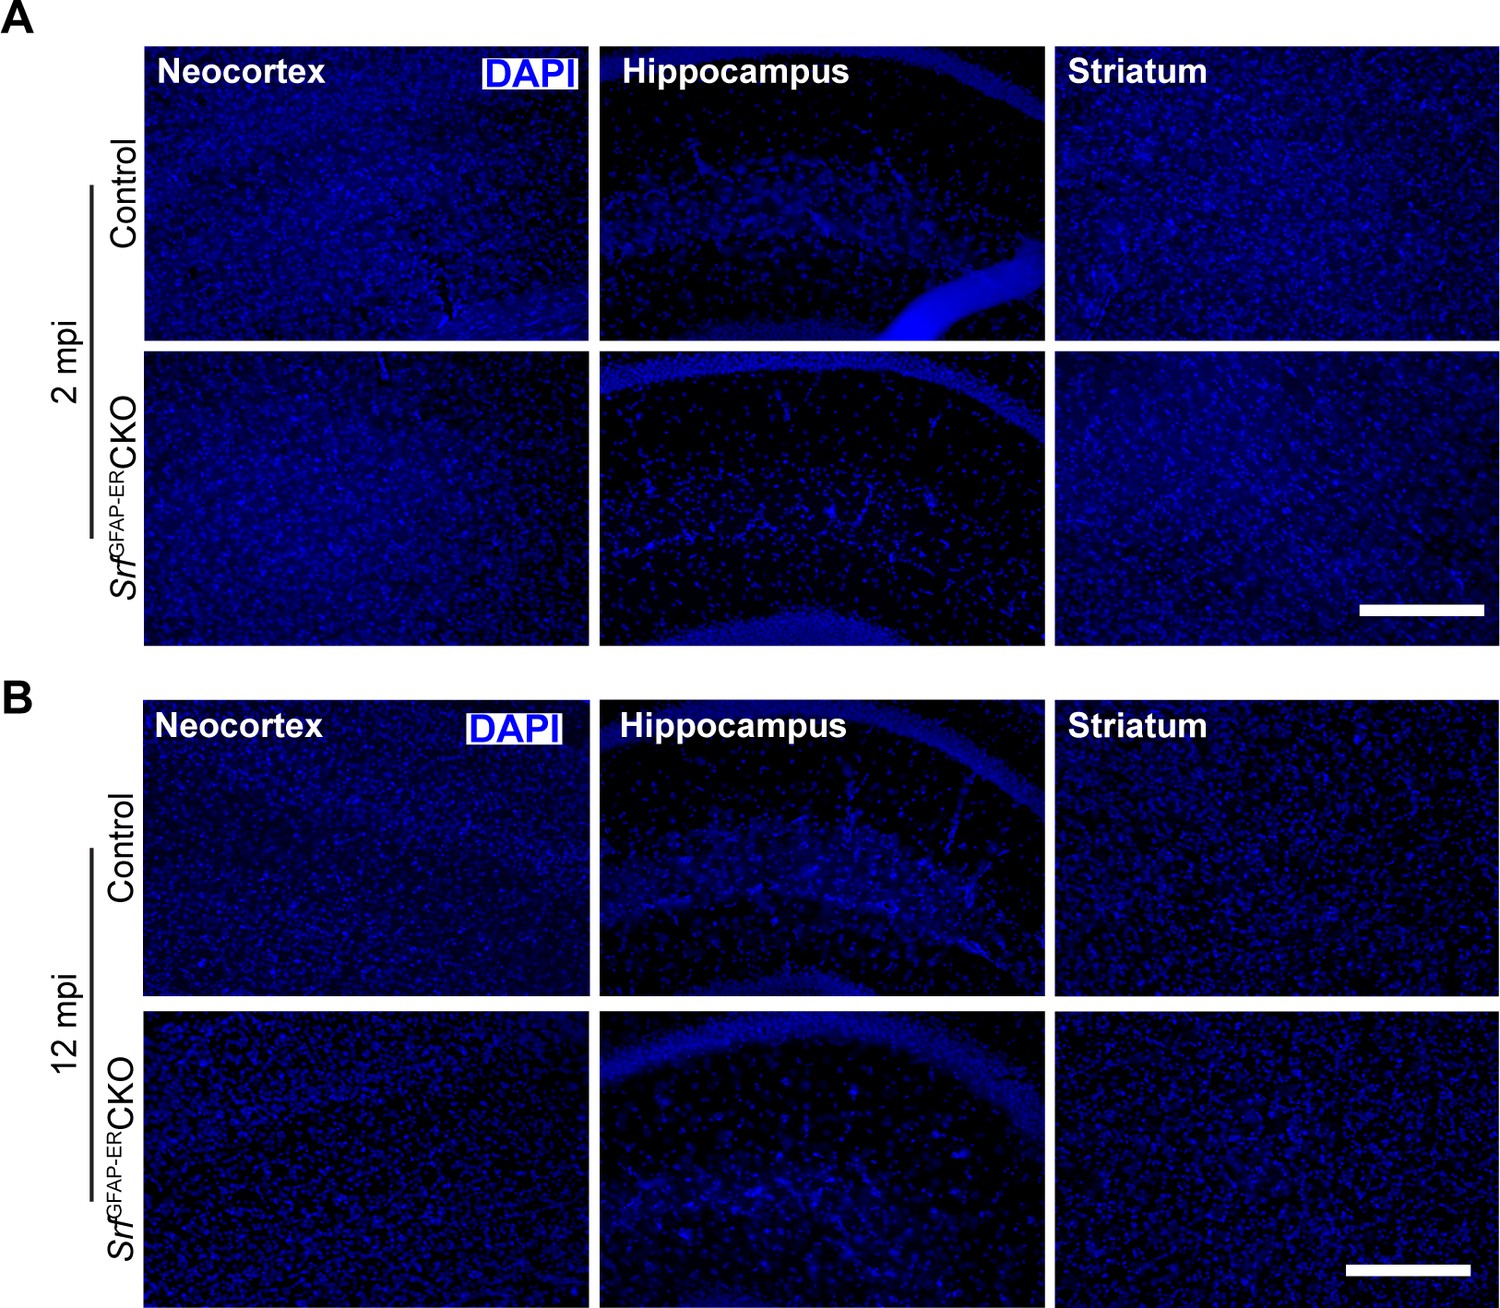
DAPI staining of brain sections from control and SrfGFAP-ERCKO mice at 2 mpi (A) and 12 mpi (B) for the GFAP staining data shown in Figure 2.
Scale bar, 100 µm.
Figure 2 with 1 supplement
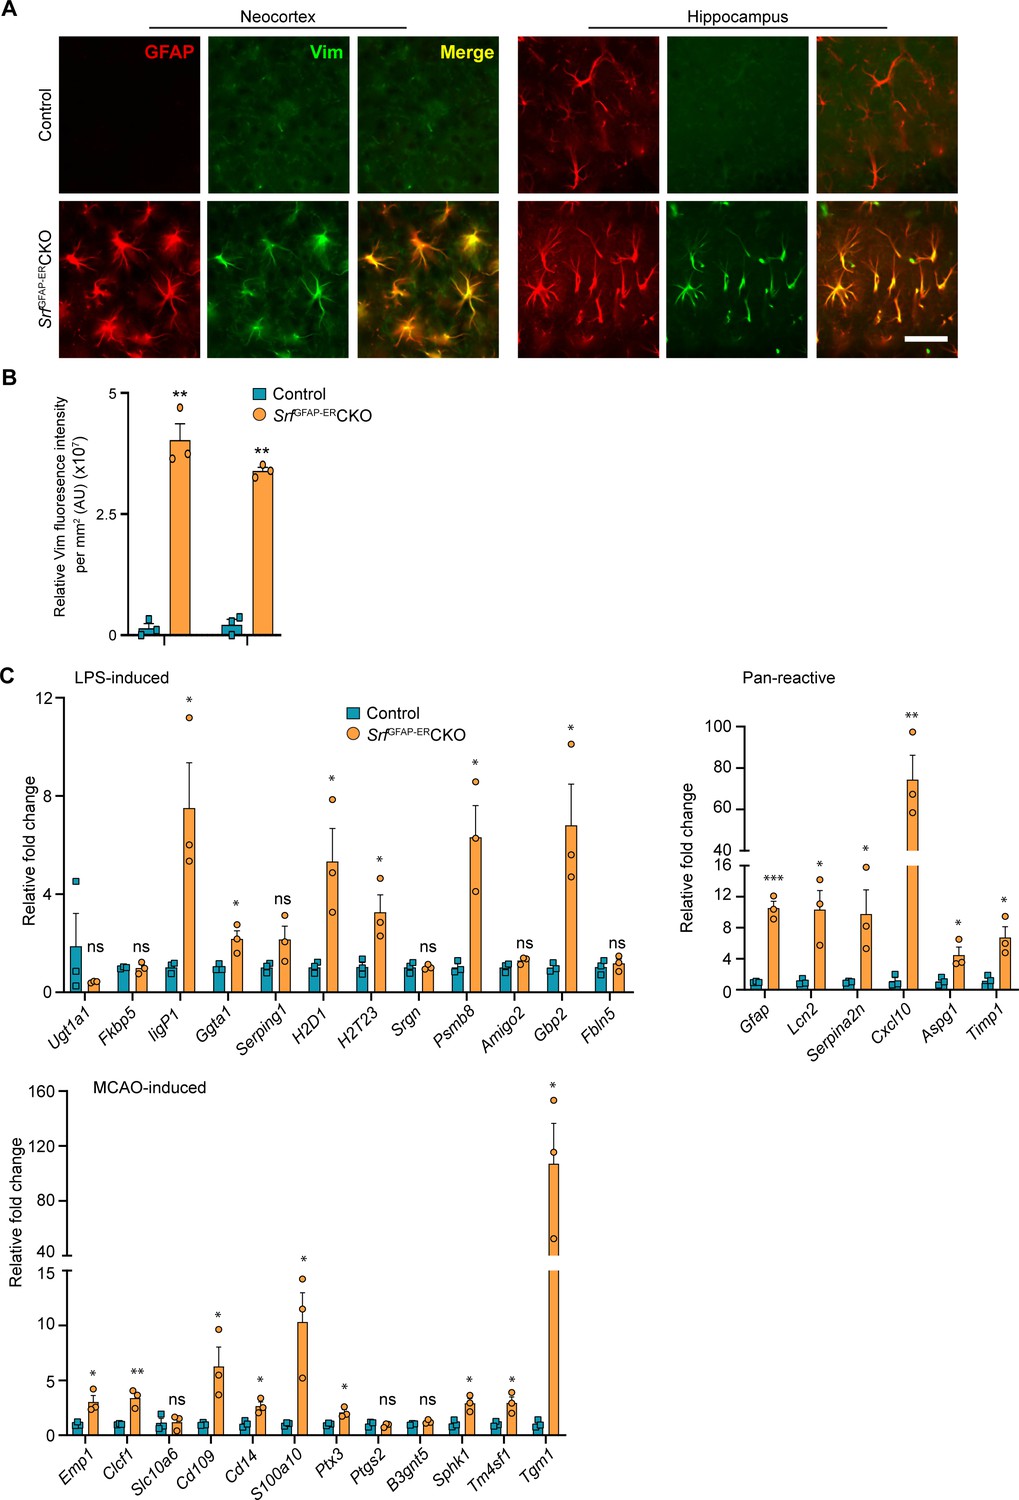
Srf-deficient astrocytes express reactive astrocyte markers.
(A) Coronal sections showing GFAP and Vimentin (Vim) immunostaining in control and SrfGFAP-ERCKO mice at 2 mpi. Astrocytes in the neocortex and hippocampus were positive for both GFAP and Vimentin. The control astrocytes exhibited weaker staining for GFAP only in the hippocampus and not for Vimentin. (B) Quantification of Vim fluorescence intensity in the astrocytes in the neocortex and hippocampus shown in (A). n=3 mice. (C) Quantitative PCR analysis of genes induced by inflammatory LPS stimulation, middle cerebral artery occlusion (MCAO) and markers of pan-reactive astrocytes in control and Srf cKO mice. n=3 mice. ** p<0.01. Unpaired t-test. Data are represented as mean ± SEM. Cx, neocortex; Hc, hippocampus. AU, arbitrary units. Scale bar, 25 µm.
Figure 2—figure supplement 1
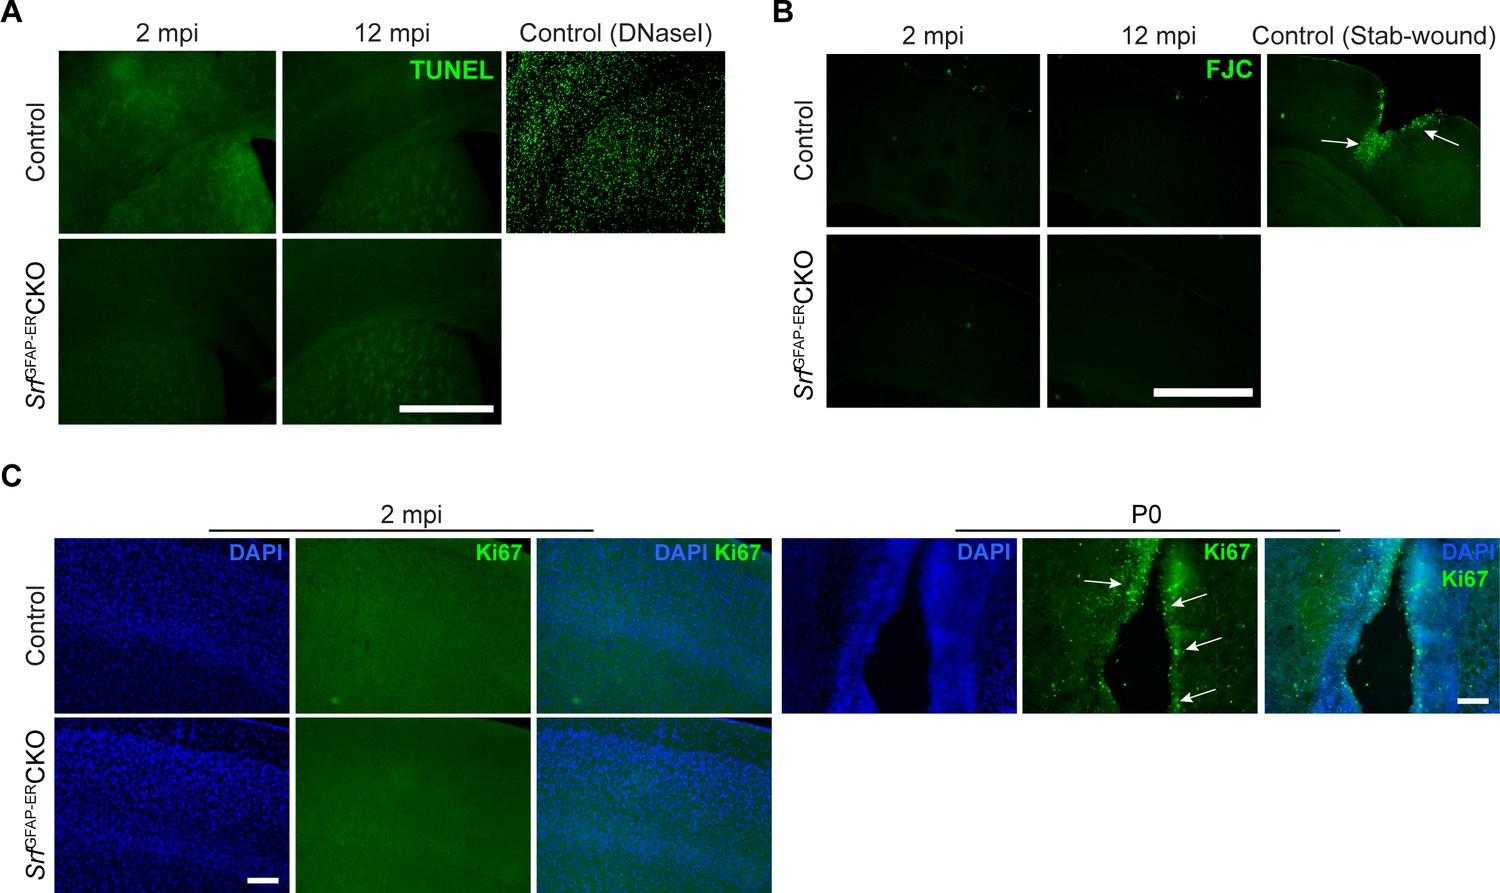
Absence of proliferation and cell death in SrfGFAP-ERCKO mice.
(A) Coronal section showing TUNEL staining in the neocortex of control and SrfGFAP-ERCKO mice at 2 mpi and 12 mpi. DNaseI treated section was used for control. (B) Coronal sections showing FluoroJade-C (FJC) staining of the neocortex. Brain section following stab-wound was used a control for FJC staining (arrows). (C) Coronal sections showing immunostaining for Ki67 in the neocortex. Staining of a neonatal (P0) brain shows Ki67 + cells (arrows) in the ventricular zone and served as the control. DAPI labels the nuclei. Scale bar, 100 µm.
Figure 3 with 3 supplements
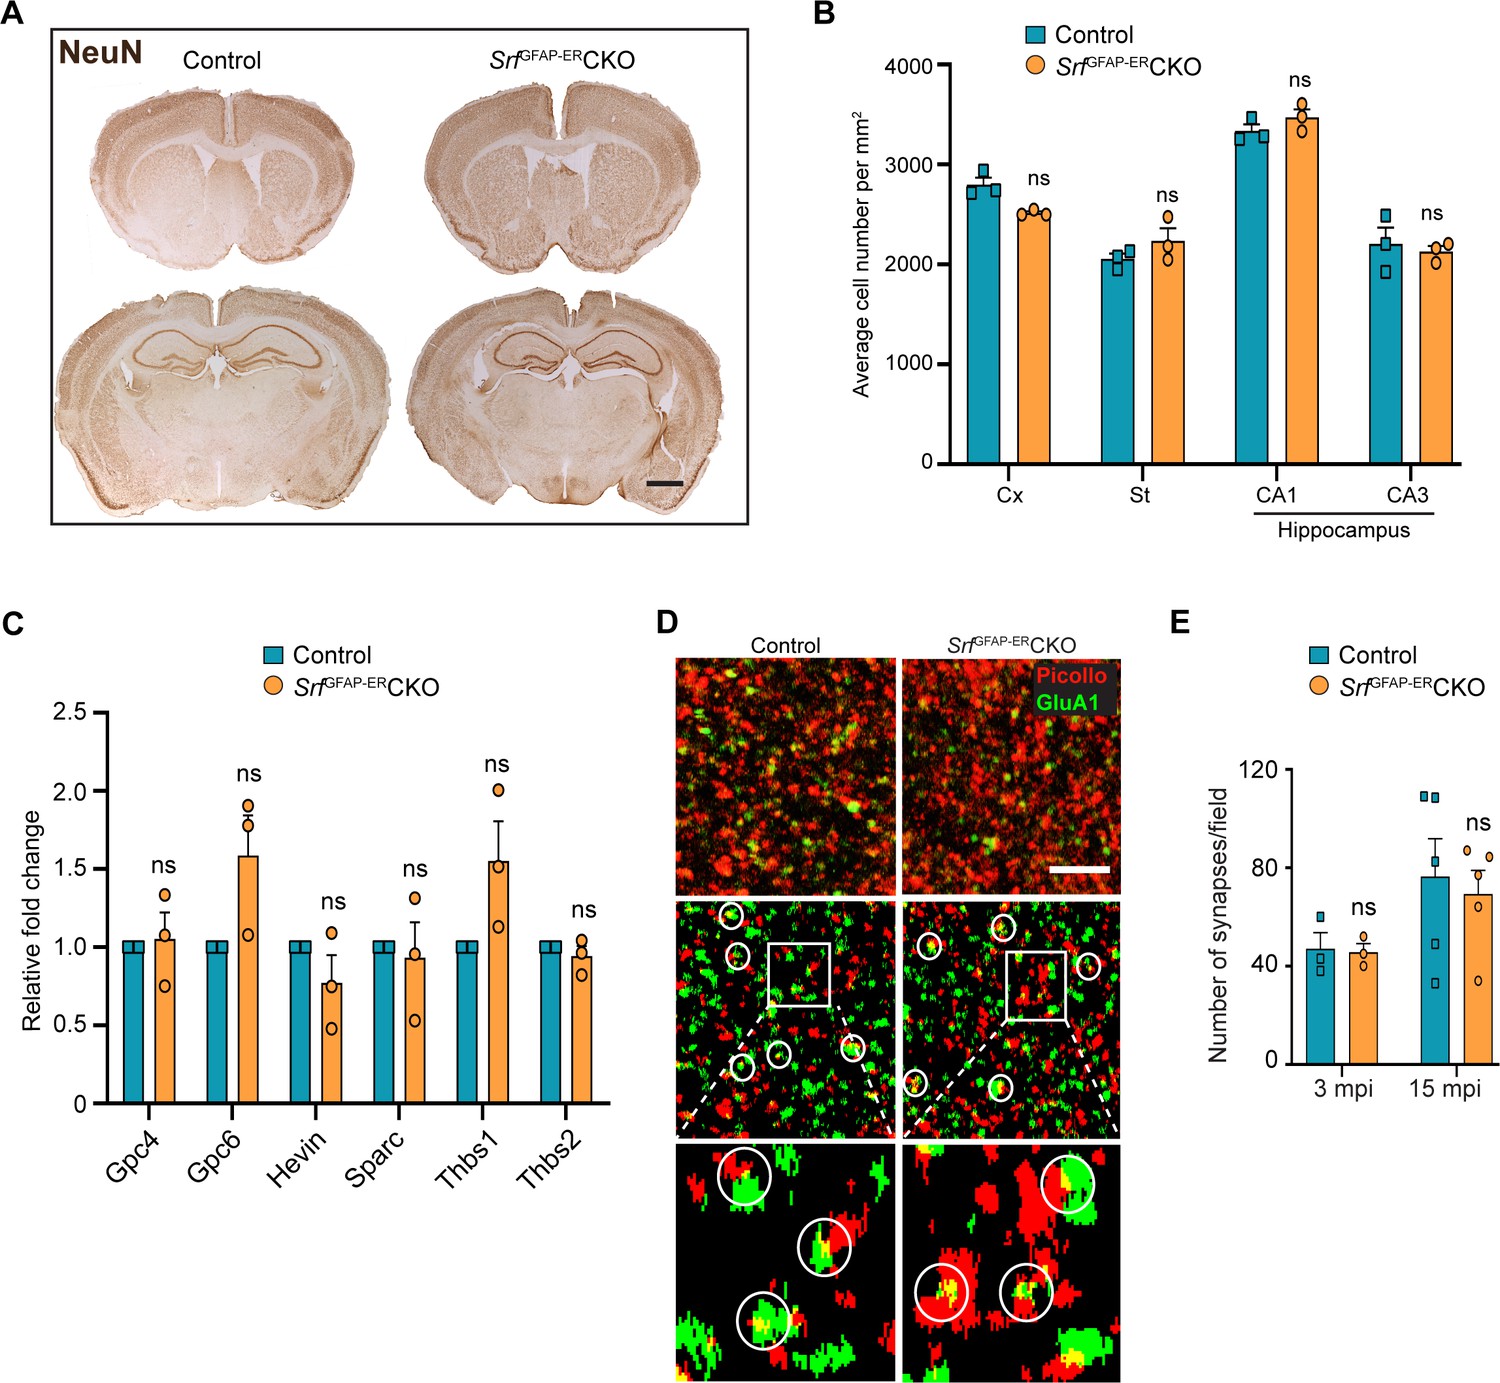
Srf-deficient astrocytes do not affect neuronal survival and synapse numbers.
(A) Coronal sections showing NeuN immunostaining in control and Srf mutant mice at 12 mpi. (B) Quantification of NeuN+ cell numbers in the neocortex and striatum, and DAPI+ cell numbers in the CA1 and CA3 regions of the hippocampus. (C) Quantitative PCR of astrocyte-secreted synaptogenic factors shows no difference in their expression in the mutant mice when compared to control mice. n=3 mice. (D) Representative images of neocortical sections immunostained for the presynaptic marker, piccolo (red) and postsynaptic marker, GluA1 (green). Co-localization of staining (yellow puncta) was counted as a synapse. Scale bar, 10 µm. (E) Quantification of the number of synapses in the neocortex in control and SrfGFAP-ERCKO mutant mice at 3 and 15 mpi. n=3 mice. Unpaired t-test. Data are represented as mean ± SEM. ns, not significant.
Figure 3—figure supplement 1
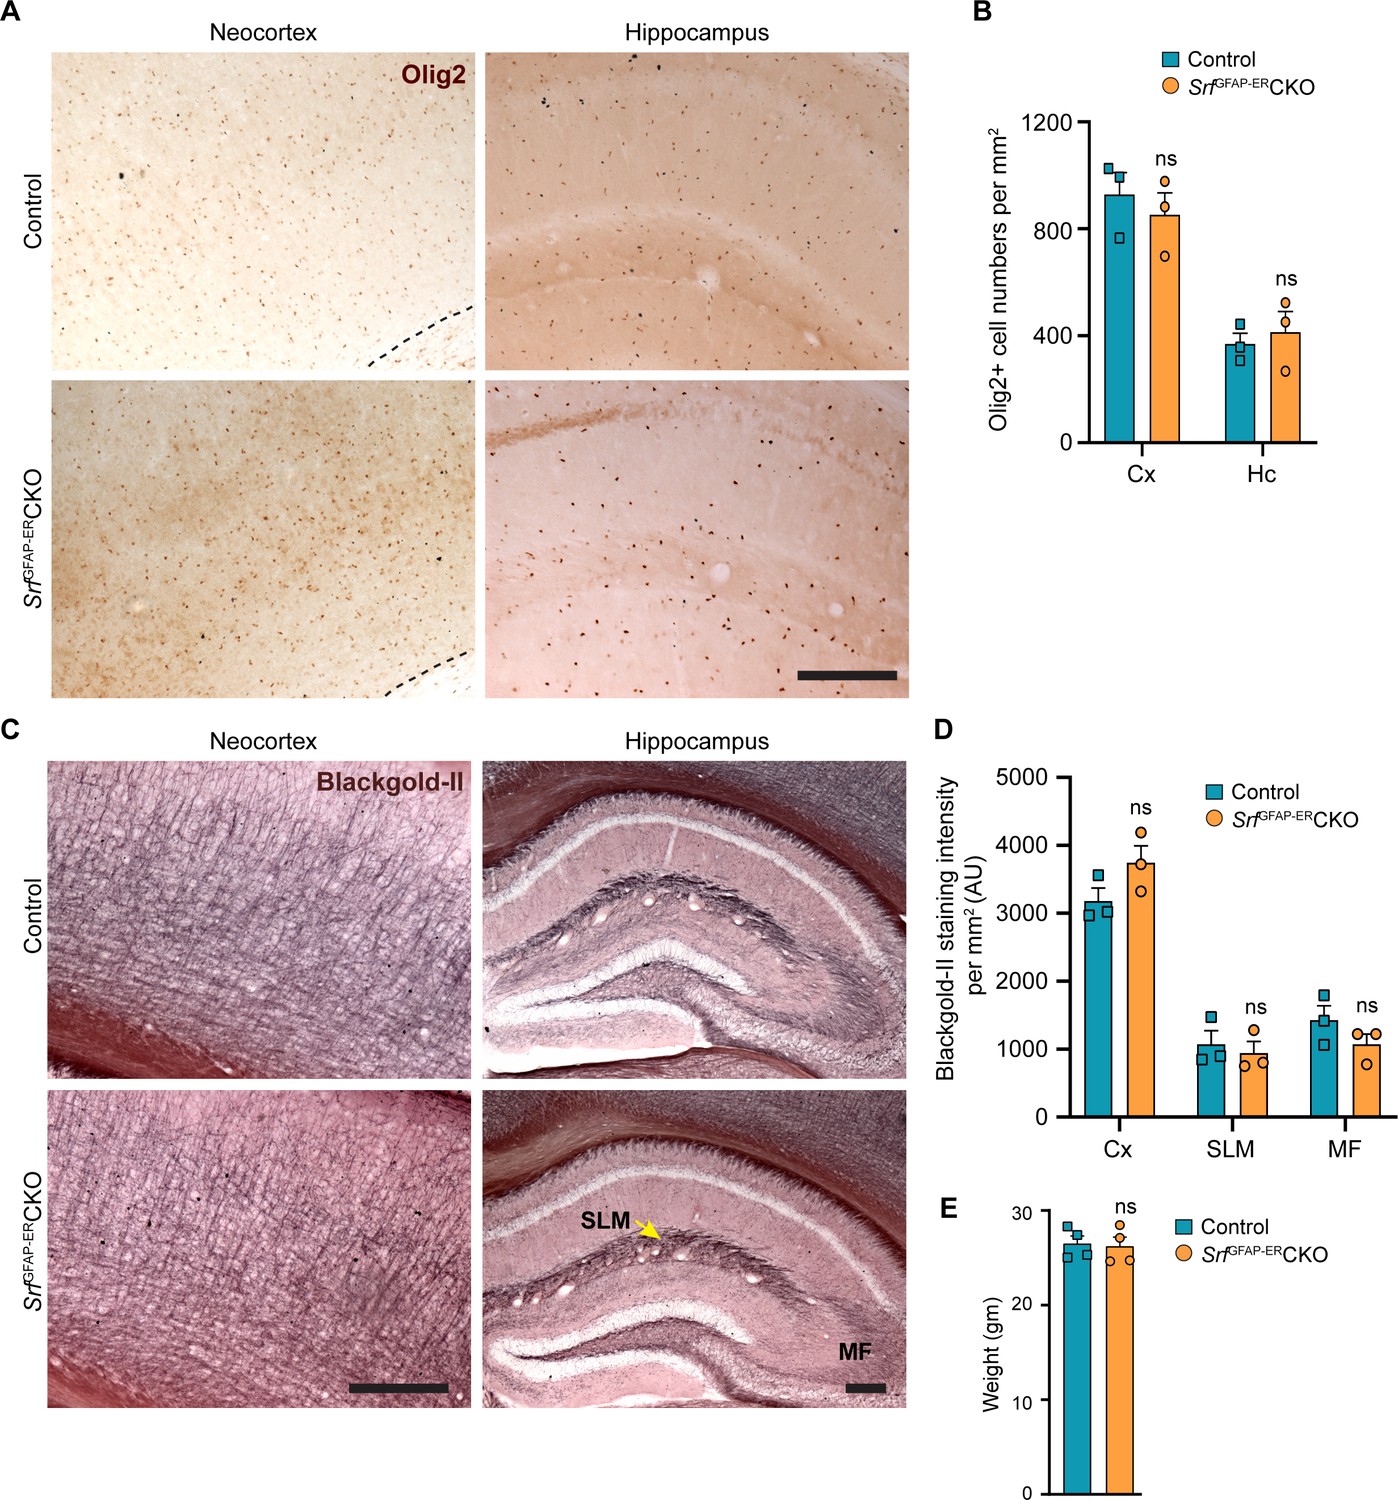
Oligodendrocyte lineage cells and myelination in SrfGFAP-ERCKO mice.
(A) Coronal sections showing immunostaining for Olig2 in neocortex and hippocampus in control and Srf mutant mice at 12 mpi. Scale, 200 µm. (B) Quantification of number of Olig2 + cells in (A). n=3 mice. (C) Black-Gold II myelin staining of coronal sections of control and Srf mutant mice at 12 mpi. Scale, 200 mm. (D) Quantification of myelin staining intensity from the neocortex (Cx), Stratum lacunosum moleculare (SLM) and mossy fibers (MF) and in (C). n=3 mice. (E) Measurement of body weights of control and SRF mutant mice at 12 mpi. No difference in body weight was seen between the two groups. n=4 mice. ns, not significant. Unpaired t-test. Data are represented as mean ± SEM. AU, arbitrary units.
Figure 3—figure supplement 2
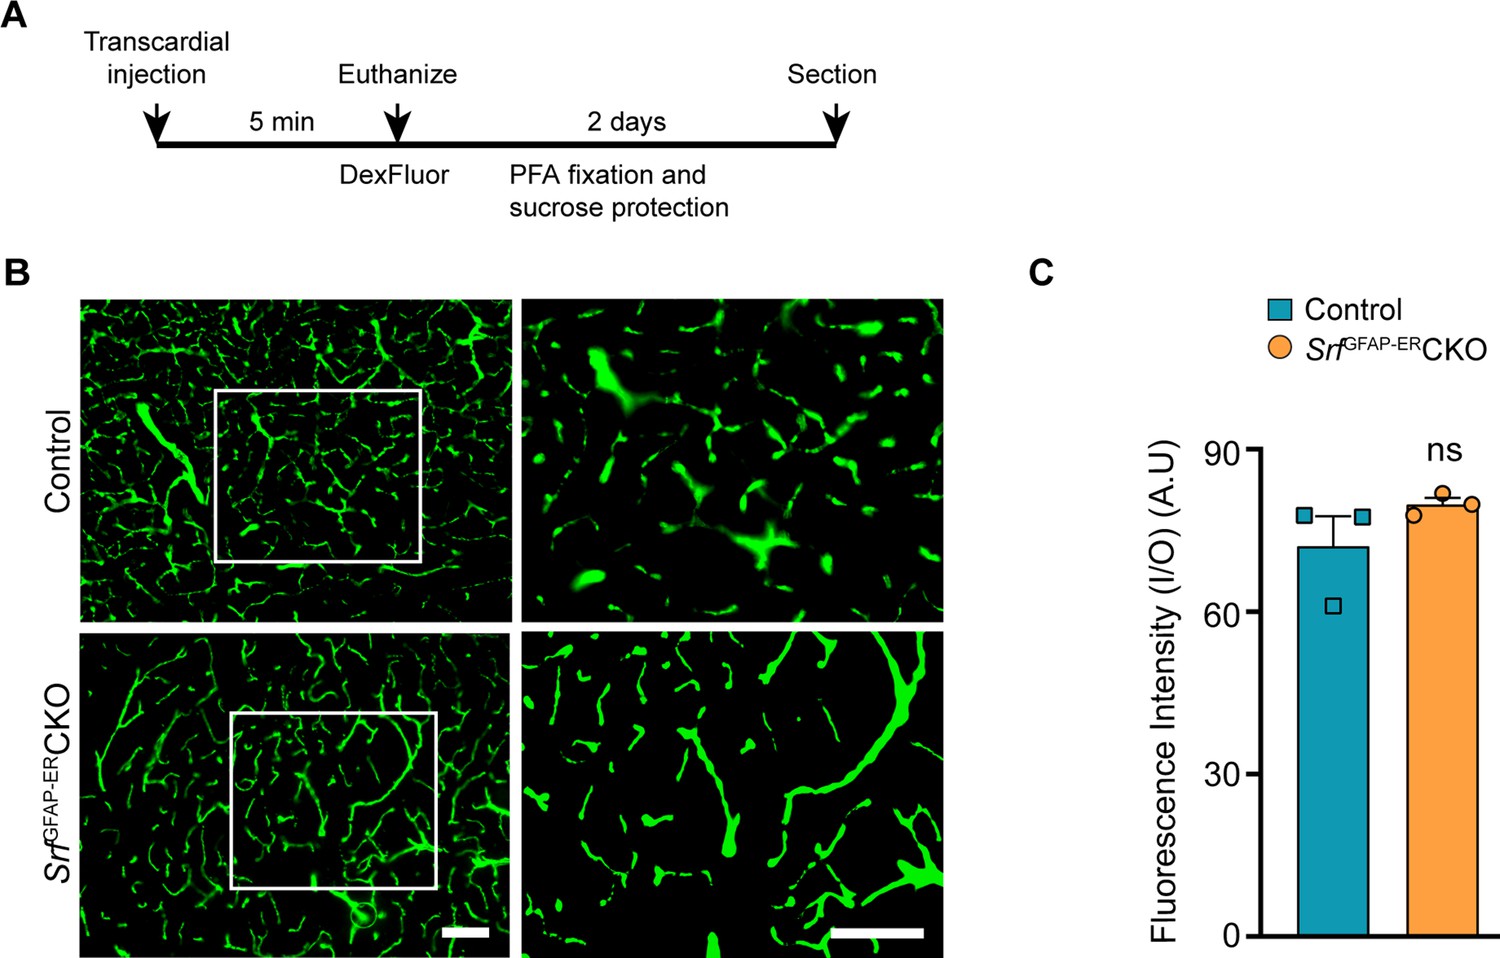
BBB integrity is not compromised in SrfGFAP-ERCKO mutant mice.
(A) Schematic of dextran fluorescein (DexFluor) injection. (B) Visualization of dextran fluorescein (10 kDa) in coronal sections of the neocortex. (C) Quantification of ratio of fluorescence intensity inside versus outside of blood vessels in (B). n=3 mice. ns, not significant. Unpaired t-test. Data are represented as mean ± SEM. Scale bar, 50 µm. AU, arbitrary units.
Figure 3—figure supplement 3
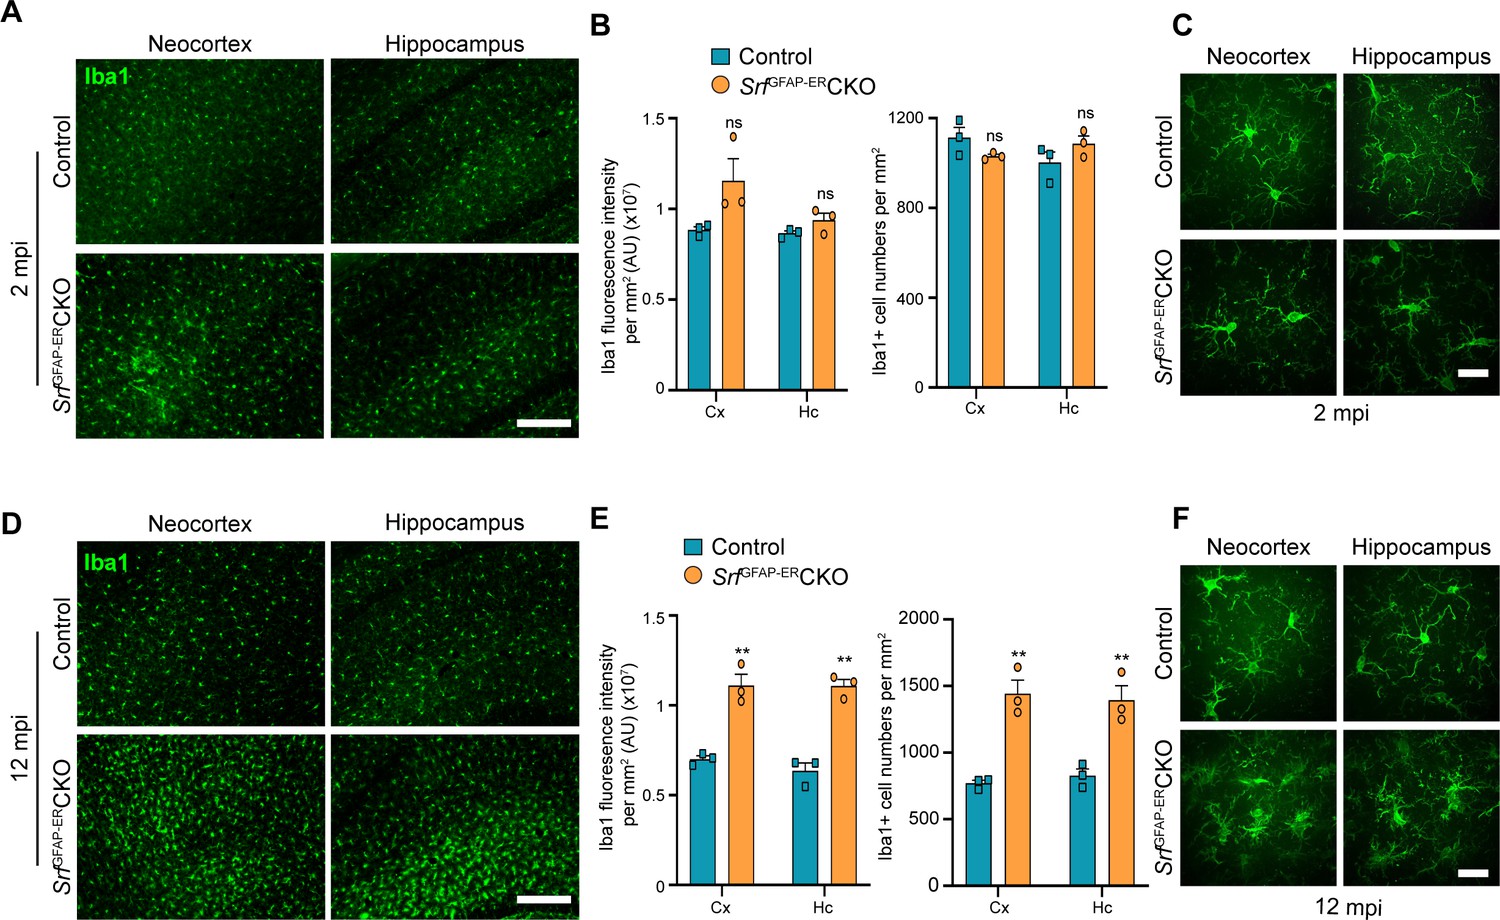
Increase in IbaI intensity and cell numbers in older but not younger Srf mutant mice.
(A) Immunostaining of coronal sections showing Iba1+ microglia in the neocortex and hippocampus in control and mutant mice at 2 mpi. Scale bar, 100 µm. (B) Quantification of Iba1+ cell number and relative Iba1 fluorescence intensity in the neocortex and hippocampus shown in A. (C) Magnified images of Iba1+ microglia in control and knockout mice at 2 mpi. Scale bar, 100 µm. (D) Immunostaining of coronal sections showing Iba1+ microglia in the neocortex and hippocampus in control and mutant mice at 12 mpi. Scale bar, 100 µm. A magnified image is shown on the right. Scale bar, 25 µm. (E) Quantification of Iba1+ cell number and relative Iba1 fluorescence intensity in the neocortex and hippocampus shown in B. (F) Magnified images of Iba1+ microglia in control and knockout mice at 12 mpi. Scale bar, 100 µm. mpi, months post-tamoxifen injection, Cx, neocortex; Hc, hippocampus; St, striatum. AU, arbitrary units. n=3 mice. Data are represented as mean ± SEM. * p<0.05, ** p<0.01, ns, not significant. Unpaired t-test.
Figure 4 with 1 supplement
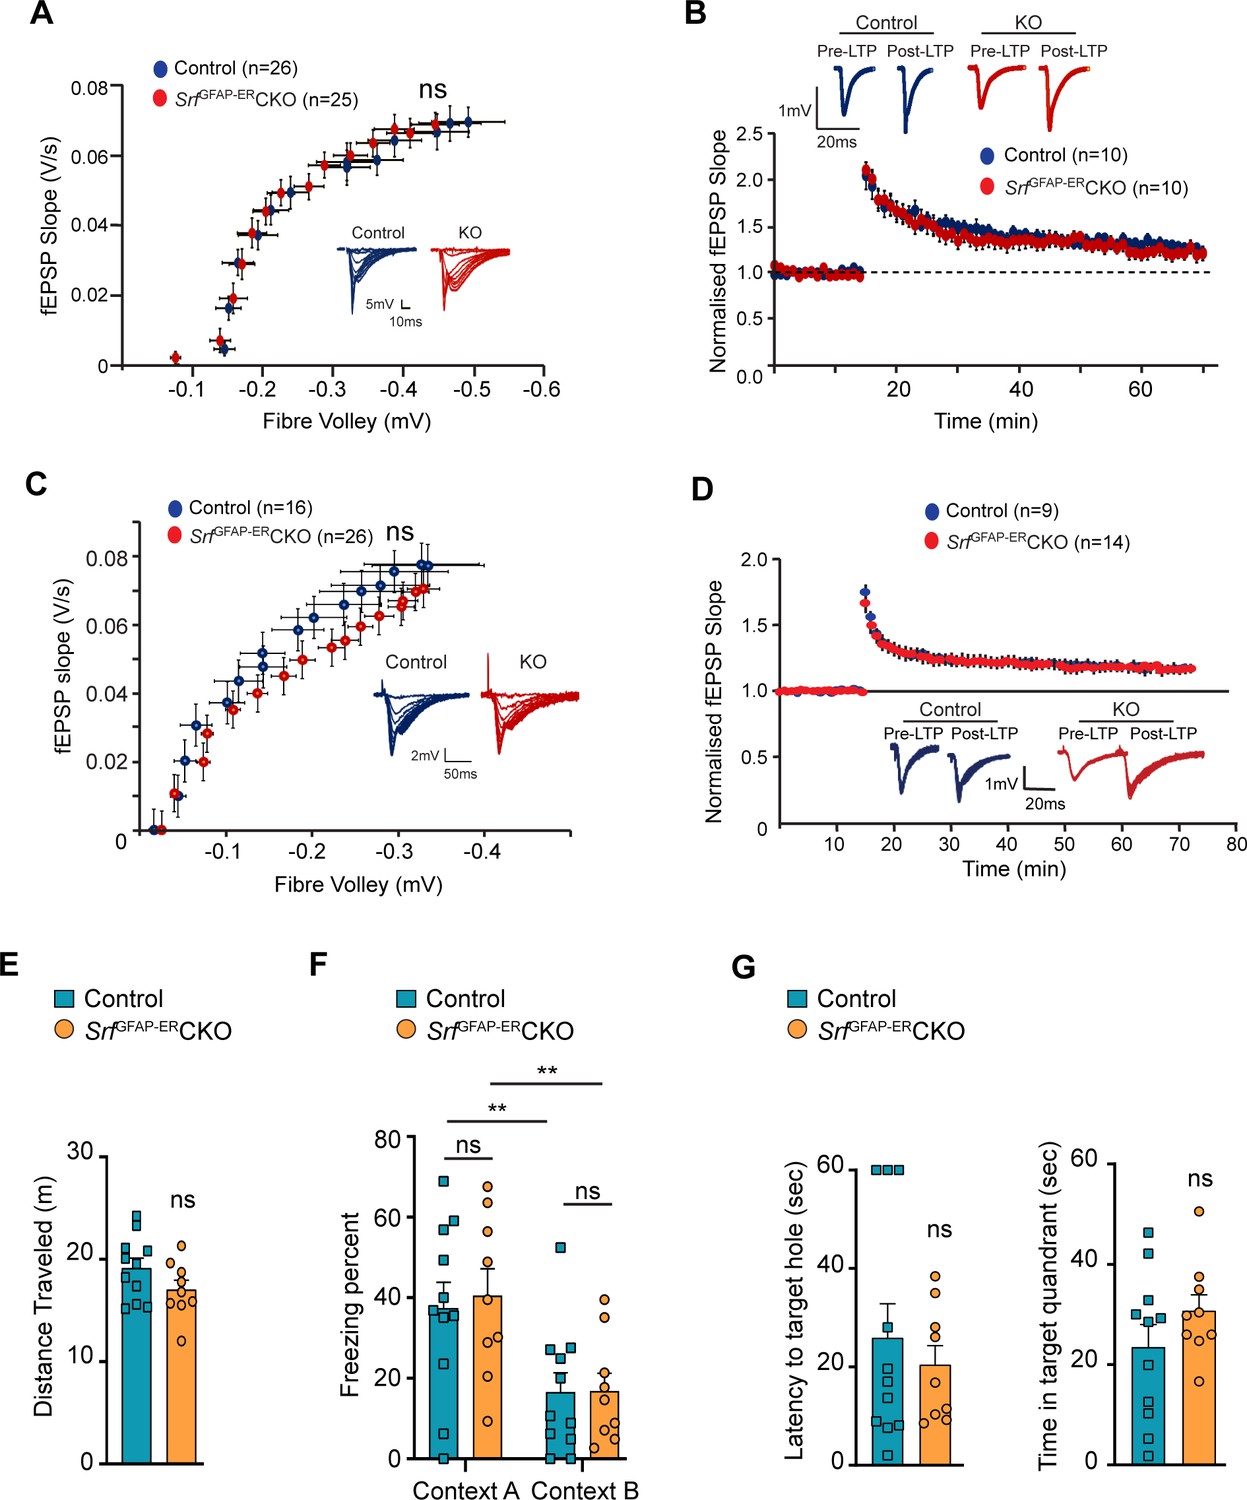
SRF-deficient astrocytes support normal synaptic plasticity, learning and memory.
(A–D) Electrophysiological measurements showed no significance between control and mutant mice. (A) Basal synaptic transmission, (B) LTP in the hippocampus at 3 mpi, (C) Basal synaptic transmission, (D) LTP in the hippocampus at 15 mpi. Example traces are those recorded for 1–2 min around the time point indicated by I and II in the graph. The number of slices recorded from are indicated in parentheses. (E–G) Behavioral analyses. (E) Open-field test, (F) contextual fear conditioning at recent and remote time points in context A (shock context) and context B (no-shock context), and (G) Barnes maze test at 9 mpi in control and mutant mice. n=7 (control), n=5 (mutant) mice. Data are represented as mean ± SEM. ns, not significant. Unpaired t-test; two-way ANOVA, Sidak’s post hoc test (F).
Figure 4—figure supplement 1
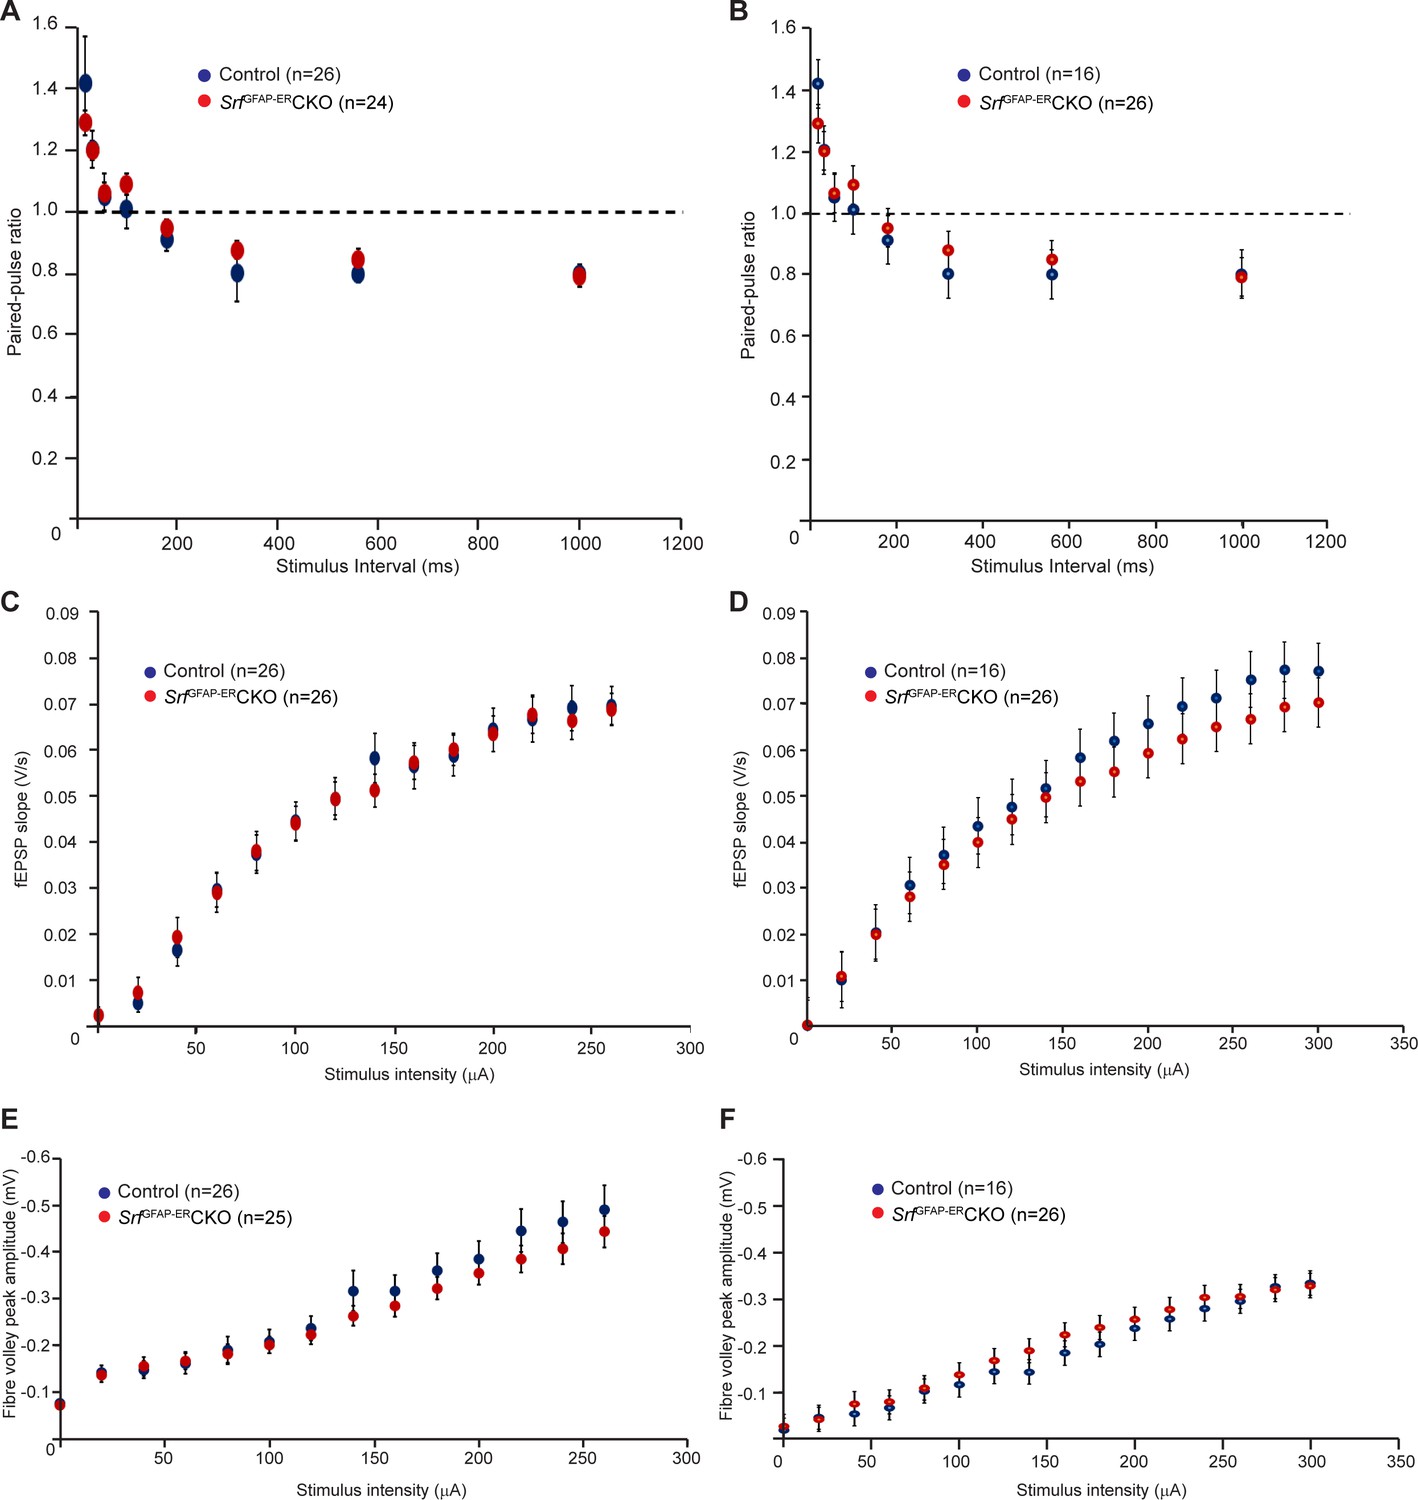
Normal synaptic functions in SrfGFAP-ERCKO mice.
Basal synaptic properties in the Schaeffer-Collateral pathway in hippocampus were measured in SrfGFAP-ERCKO mice and control littermates at 3 mpi (A, C, E) and 15 mpi (B, D, F). Analyses of paired-pulse ratio (A, B), post-synaptic response to stimulus intensity (C, D) and summated action potential (E, F) did not show any significant difference between the two groups of mice. The number of slices recorded from are indicated in parentheses. (n=8 control; n=5 mutant mice per group). Unpaired t-test. Data are represented as mean ± SEM.
Figure 5 with 1 supplement
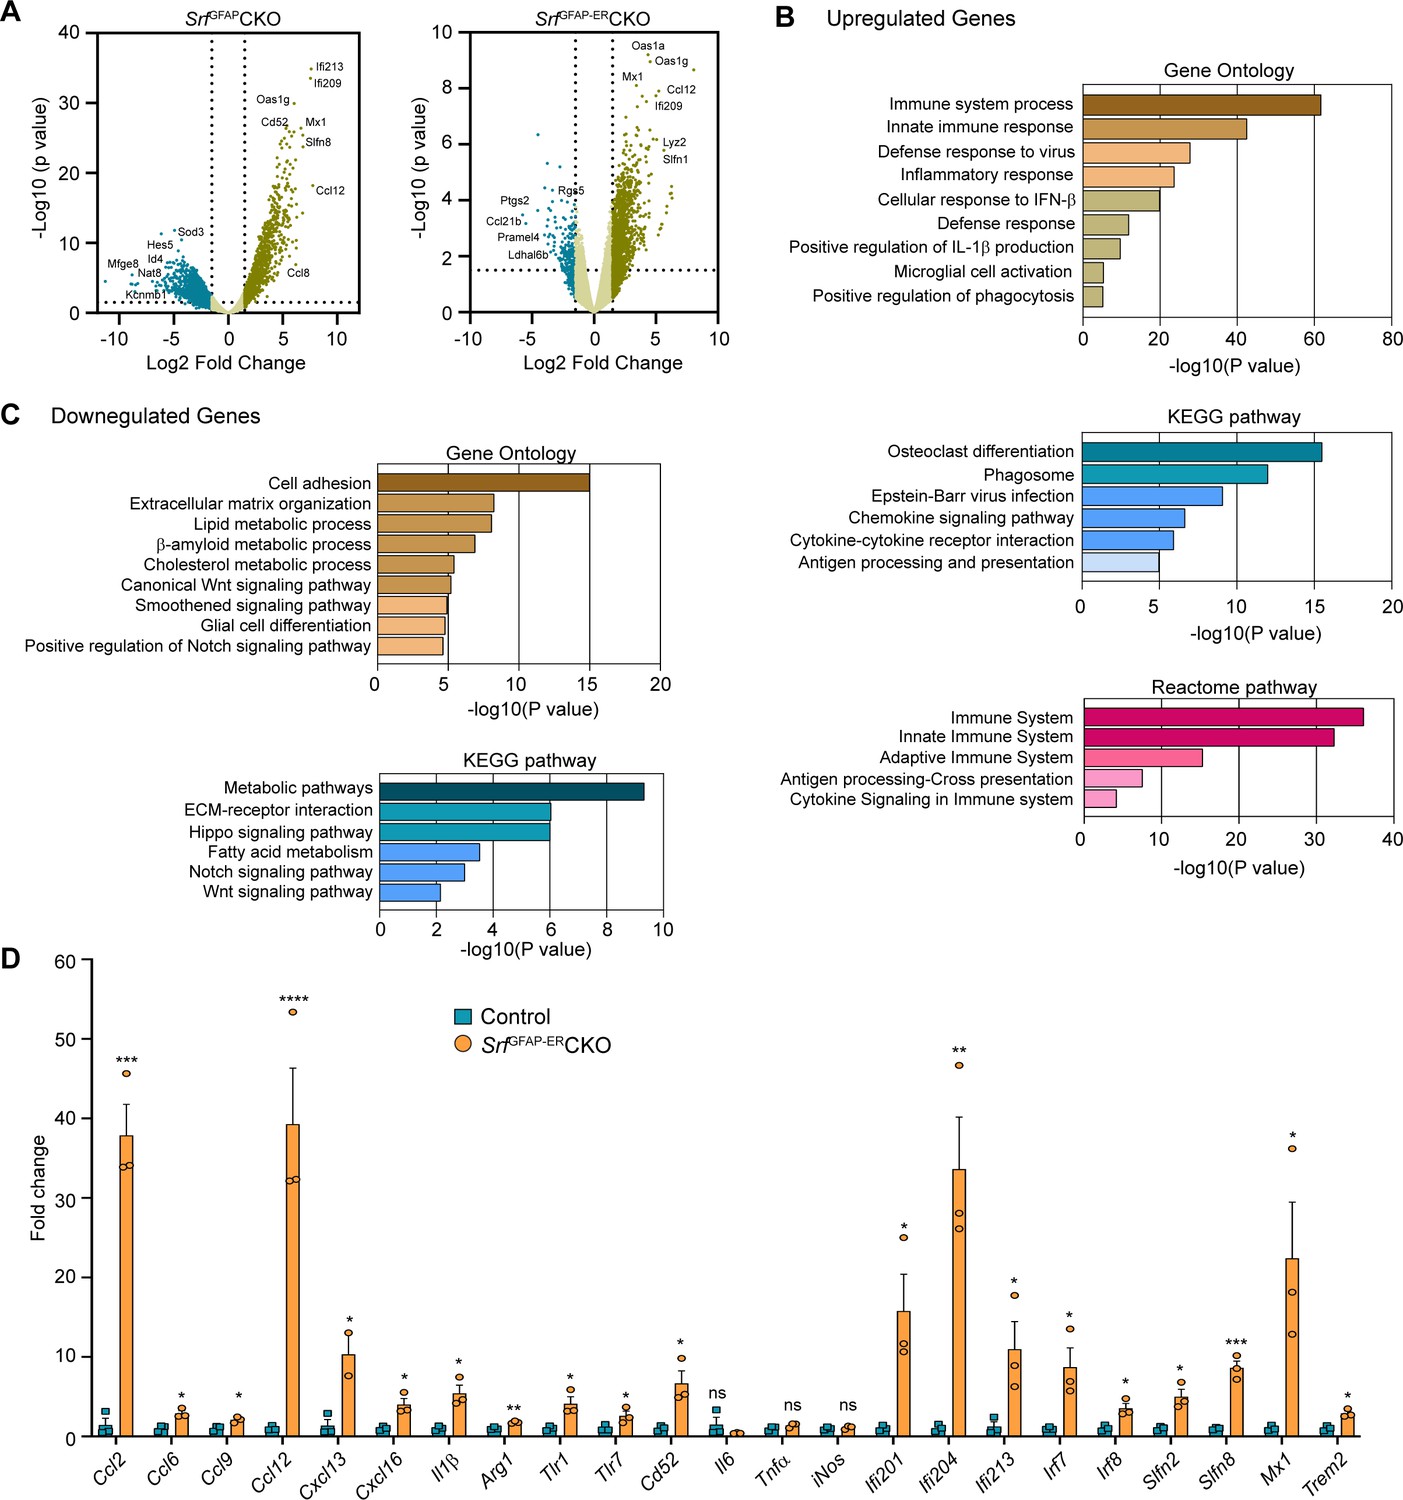
Transcriptome profile of Srf-deficient astrocytes.
(A) Volcano plots of differentially expressed genes in control and Srf-deficient astrocytes from RNA sequencing. (B) Gene Ontology, KEGG pathway and Reactome pathway analysis of upregulated genes in Srf-deficient astrocytes. (C) Gene Ontology and KEGG pathway analysis of downregulated genes in Srf-deficient astrocytes. (D) Quantitative PCR analysis of interferon, inflammatory and defense response genes in reactive astrocytes identified in Gene Ontology analysis. n=3 mice. Data are represented as mean ± SEM. * p<0.05, ** p<0.01, *** p<0.005, ****p<0.001, ns, not significant. Unpaired t-test.
-
Figure 5—source data 1
Top 25 genes up- and downregulated in SrfGFAPCKO astrocytes.
- https://cdn.elifesciences.org/articles/95577/elife-95577-fig5-data1-v3.docx
-
Figure 5—source data 2
Top 25 genes up- and downregulated in SrfGFAP-ERCKO astrocytes.
- https://cdn.elifesciences.org/articles/95577/elife-95577-fig5-data2-v3.docx
-
Figure 5—source data 3
KEGG pathway analysis of Srf-deficient astrocytes.
(A) Table showing KEGG pathway and genes upregulated in Srf-deficient astrocytes. (B) Table showing KEGG pathway and genes downregulated in Srf-deficient astrocytes. (C) Expression of genes involved in neurotoxicity of reactive astrocytes in Srf-deficient astrocytes. Genes with fold change of >2.0 and adjusted p-value < 0.05 were considered significant. Dotted lines indicate cut-off fold change of 1.5.
- https://cdn.elifesciences.org/articles/95577/elife-95577-fig5-data3-v3.zip
Figure 5—figure supplement 1
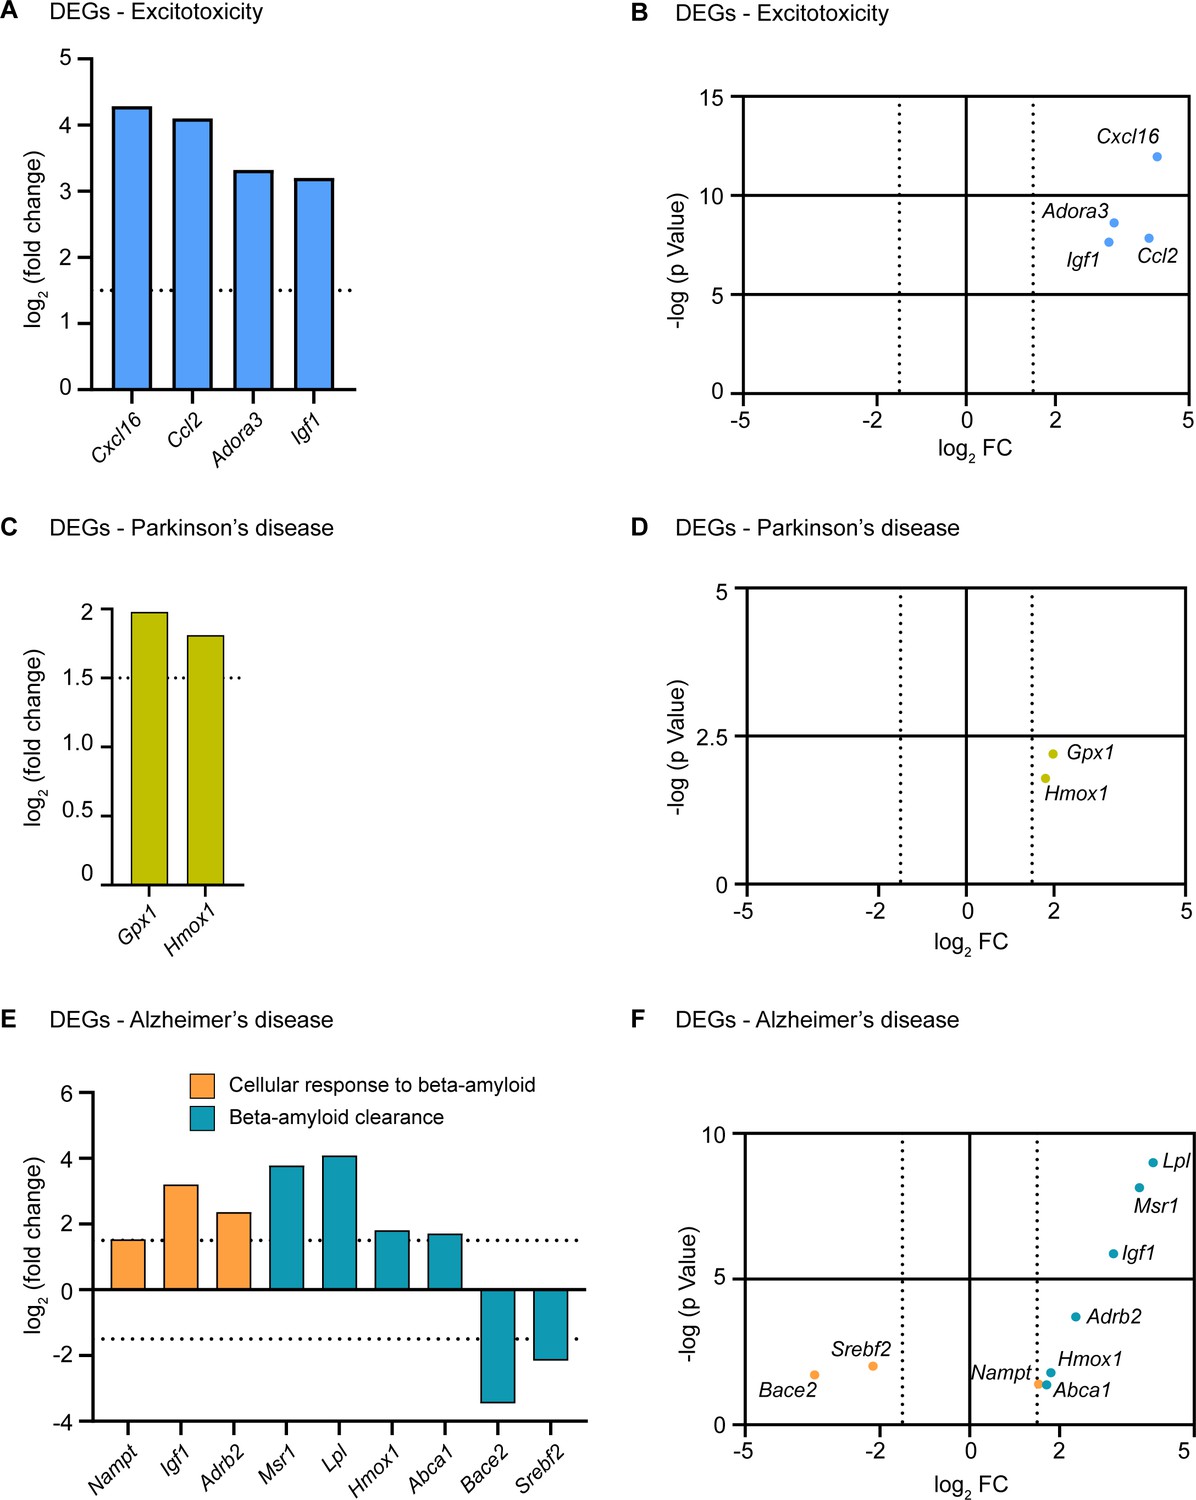
Differential expression of genes involved in neuroprotection in Srf mutant astrocytes.
(A) Bar graph showing the differentially expressed genes (DEGs) from RNA-Seq analysis upregulated in Srf-deficient astrocytes that may confer neuroprotection in kainic acid-induced excitotoxicity. (B) Scatter plot of DEGs that could protect neurons from kainic acid-induced excitotoxicity. (C) Bar graph showing genes upregulated in Srf-deficient astrocytes that protect dopaminergic neurons in Parkinson’s disease. (D) Scatter plot of neuroprotective genes in PD that are upregulated in Srf-deficient astrocytes. (E) Bar graph showing the upregulated and downregulated genes involved in beta-amyloid cellular response and clearance in Srf-deficient astrocytes. (F) Scatter plot of DEGs involved in beta-amyloid cellular response and clearance.
Figure 6 with 2 supplements
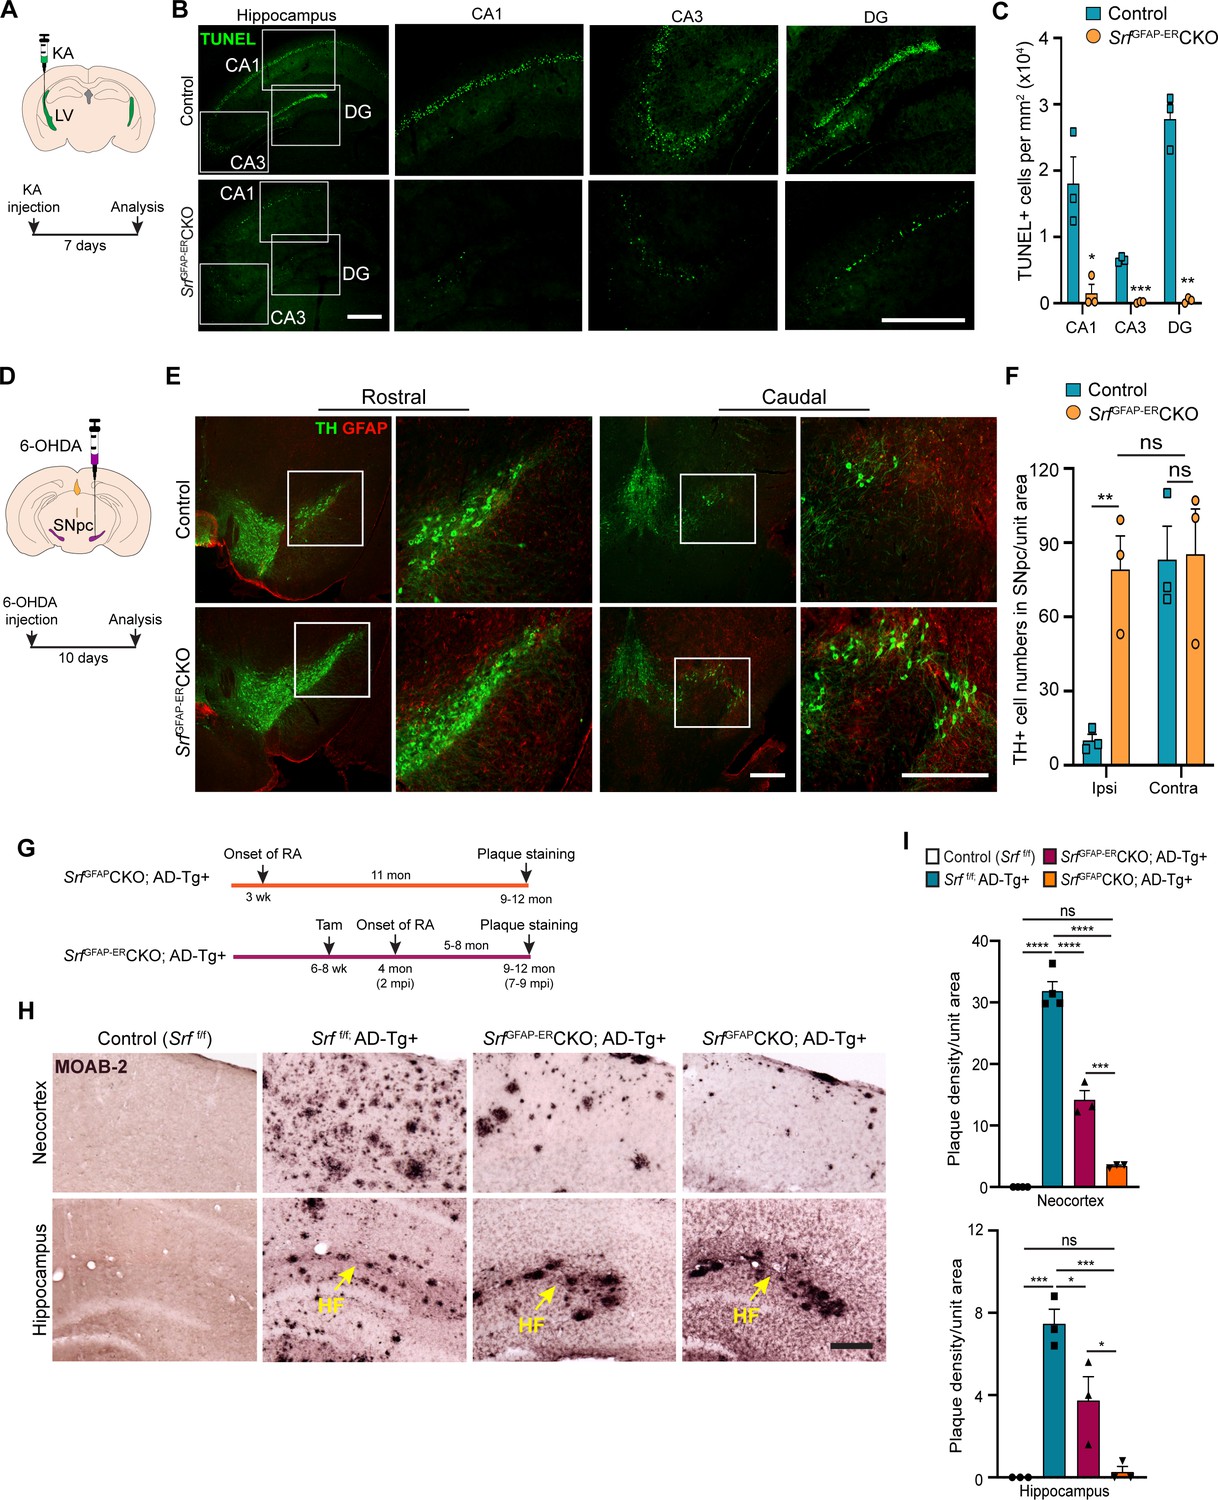
Srf-deficient reactive astrocytes confer neuroprotection in the brain.
(A) Schematic of stereotaxic intracerebroventricular (ICV) injection of kainic acid (KA) (top) and timeline of experiment (bottom) in 4 mpi mice. (B) Coronal brain sections showing TUNEL (terminal deoxynucleotidyl transferase dUTP nick end labeling) staining at 7 days post-kainic acid injection shows cell death in hippocampal regions CA1, CA3 and DG. Scale bar, 200 µm. (C) Quantification of TUNEL+ cells in the hippocampal regions in B. n=4 mice. (D) Schematic of stereotaxic injection 6-hydroxydopamine (6-OHDA) in the substantia nigra pars compacta (SNpc) (top) and timeline of experiment (bottom) in control and mutant mice at 9 mpi. (E) Immunostaining of coronal sections showing tyrosine hydroxylase (TH+) dopamine neurons and GFAP+ astrocytes in the rostral and caudal regions of substantia nigra at 10 days following 6-OHDA injection. Magnified image of the white boxed region is shown on the right. Scale bar, 200 µm. (F) Quantification of TH+ neurons in the ipsilateral (ipsi) and contralateral (contra) side of (E). n=3 mice. (G) Schematic showing the timeline of reactive astrocyte (RA) induction and amyloid plaque staining in AD mice. (H) Coronal sections showing MOAB2-immunostained β-amyloid plaques. Scale bar, 200 µm. (I) Quantification of plaque density from (H). RA, reactive astrocytes, LV, lateral ventricular, SNpc, Substantia nigra pars compacta, SR, Stratum radiatum. Yellow arrows show hippocampal fissure, HF. n=3 mice. Data are represented as mean ± SEM. * p<0.05, ** p<0.01, *** p<0.005, **** p<0.001, ns, not significant. Unpaired t-test (C, F), One-way ANOVA with Tukey post-hoc test (I).
Figure 6—figure supplement 1
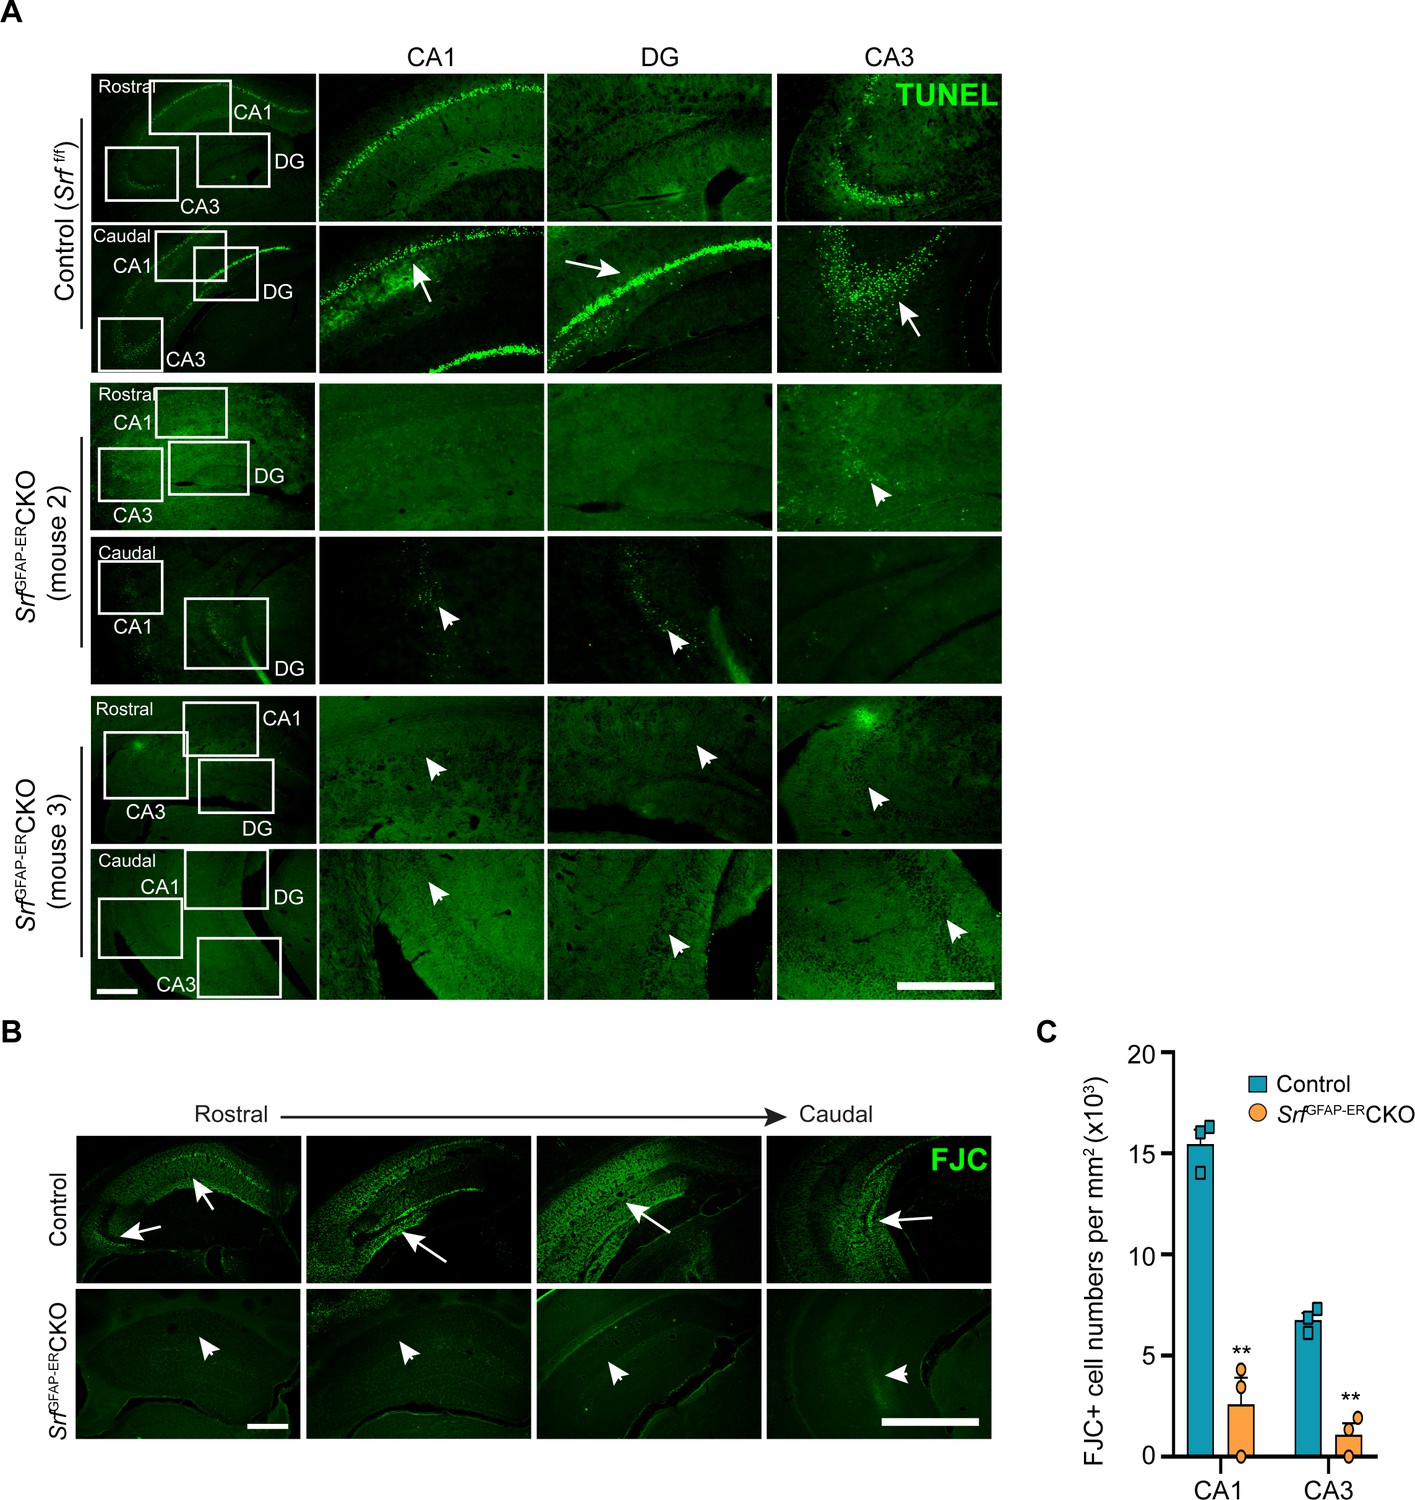
Neuroprotection from kainic acid-induced excitotoxicity.
(A) Coronal sections showing TUNEL staining of apoptotic cells in the hippocampus of control and Srf mutant mice at 4mpi. Representative images from two additional mutant mice are shown. Enlarged images of boxed regions of CA1, CA3 and DG are shown. White arrows and arrowheads show TUNEL + cells in the control and mutant mice, respectively. (B) Coronal sections showing FluoroJade-C (FJC) staining of degenerating neurons and neuronal processes in the hippocampus of control and Srf mutant mice at 7 days post-kainic acid administration and at 4 mpi. Shown are the rostral to caudal hippocampal regions. Arrows and arrowheads show the region of degenerating neurons in the control and mutant mice, respectively. (C) Quantification of FJC + cells in the hippocampal CA1 and CA3 regions. n=4 mice. ** p<0.01. Unpaired t-test. Data are represented as mean ± SEM. Scale bar, 200 µm.
Figure 6—figure supplement 2
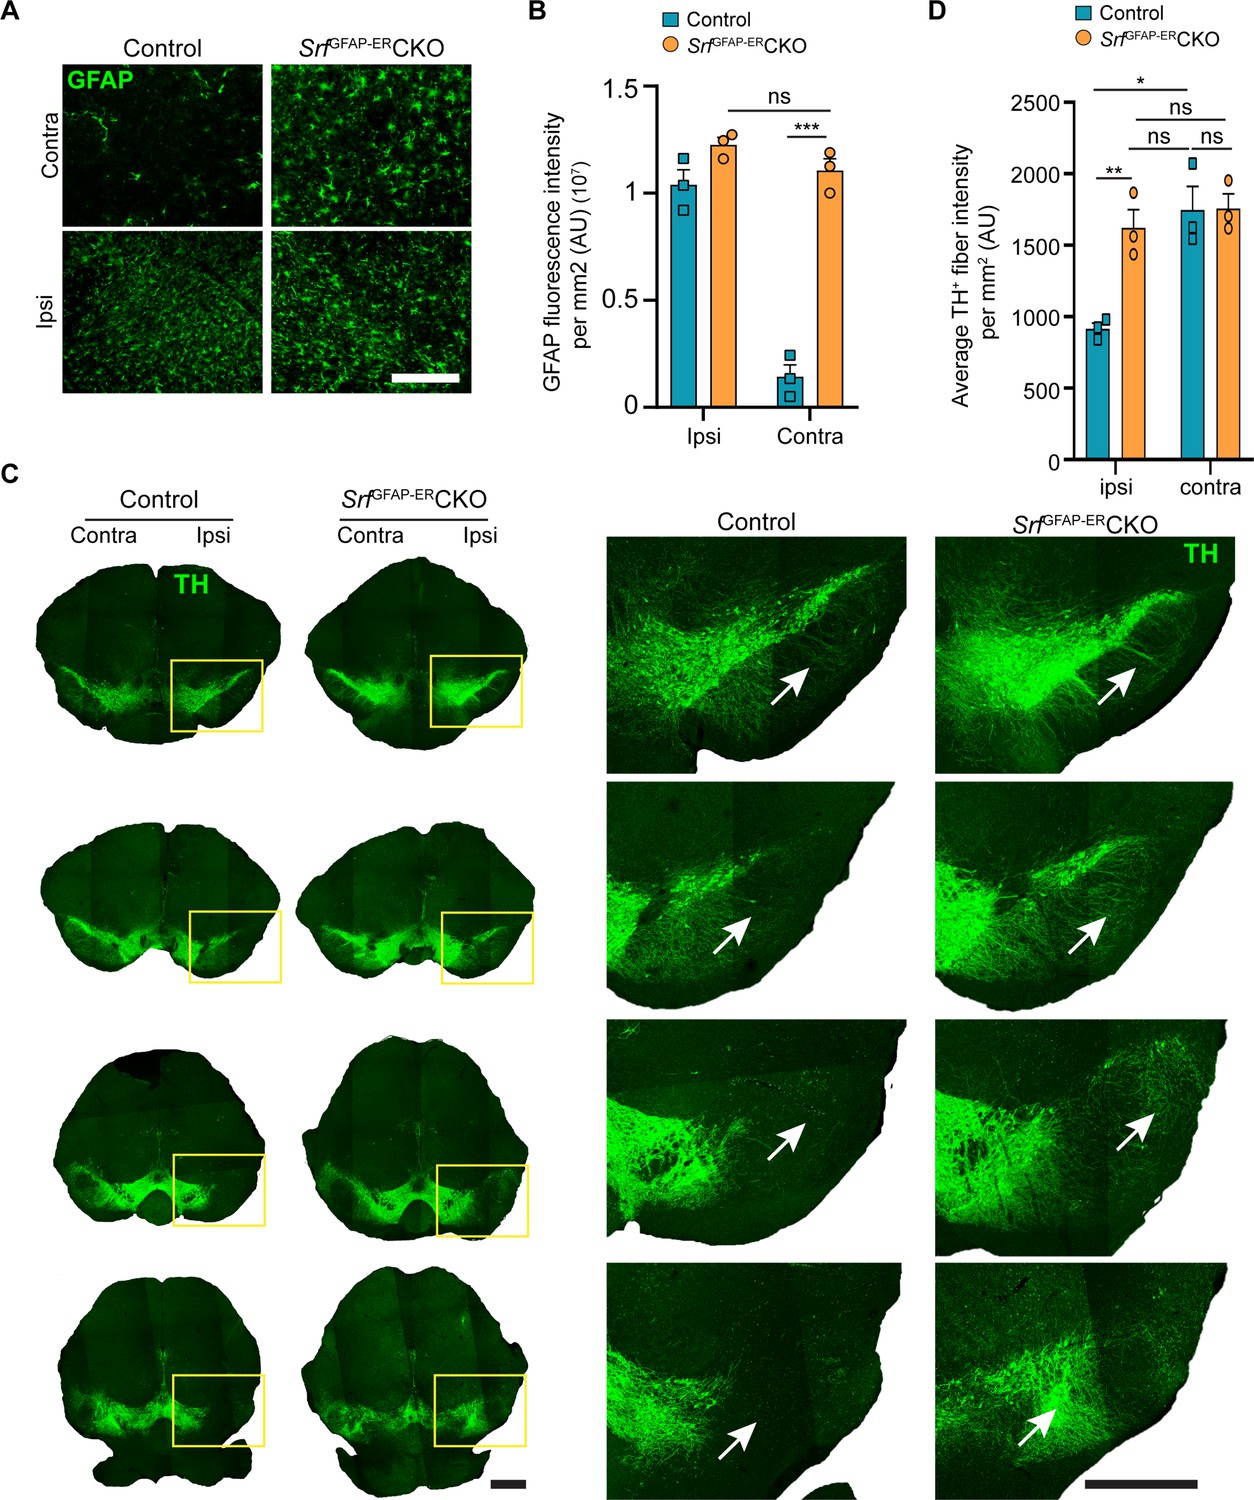
Neuroprotection in Parkinson’s disease mouse model.
(A) Tiled confocal images of coronal sections showing immunostaining for tyrosine hydroxylase (TH) in the substantia nigra in control and SrfGFAP-ERCKO mice at 10 days post-6-OHDA administration and at 9 mpi. The magnified view of the yellow boxed regions is shown on the right. The white arrows indicate the TH +fibers from dopaminergic neurons. Scale bar, 500 µm (left panels), 200 µm (right panels). (B) Quantification of fluorescence intensity of TH +fibers in ipsilateral (ipsi) and contralateral (contra) regions of substantia nigra in A. (C) Coronal sections showing immunostaining of GFAP in the substantia nigra in control and SrfGFAP-ERCKO at 10 days post-6-OHDA administration and at 9 mpi. (D) Quantification of GFAP fluorescence in the ipsilateral (ipsi) and contralateral (contra) sides in the substantia nigra in (C). * p<0.05, ** p<0.01, ns, not significant. Unpaired t test. Data are represented as mean ± SEM. AU, arbitrary units.
Additional files
Download links
A two-part list of links to download the article, or parts of the article, in various formats.
Downloads (link to download the article as PDF)
Open citations (links to open the citations from this article in various online reference manager services)
Cite this article (links to download the citations from this article in formats compatible with various reference manager tools)
SRF-deficient astrocytes provide neuroprotection in mouse models of excitotoxicity and neurodegeneration
eLife 13:e95577.
https://doi.org/10.7554/eLife.95577


