Visualizing sarcomere and cellular dynamics in skeletal muscle to improve cell therapies
- Translational Cardiology and Functional Genomics, Max Delbrück Center for Molecular Medicine, Germany
- DZHK (German Centre for Cardiovascular Research), Partner Site, Germany
- Charité Universitätsmedizin, Germany
- Berlin Institute for Medical Systems Biology, Max Delbrück Center for Molecular Medicine, Germany
- Computational Biology, Max Delbrück Center for Molecular Medicine, Germany
- Heart Research Center Göttingen, Cellular Biophysics and Translational Cardiology Section, University Medical Center Göttingen, Germany
Figures
Figure 1 with 1 supplement
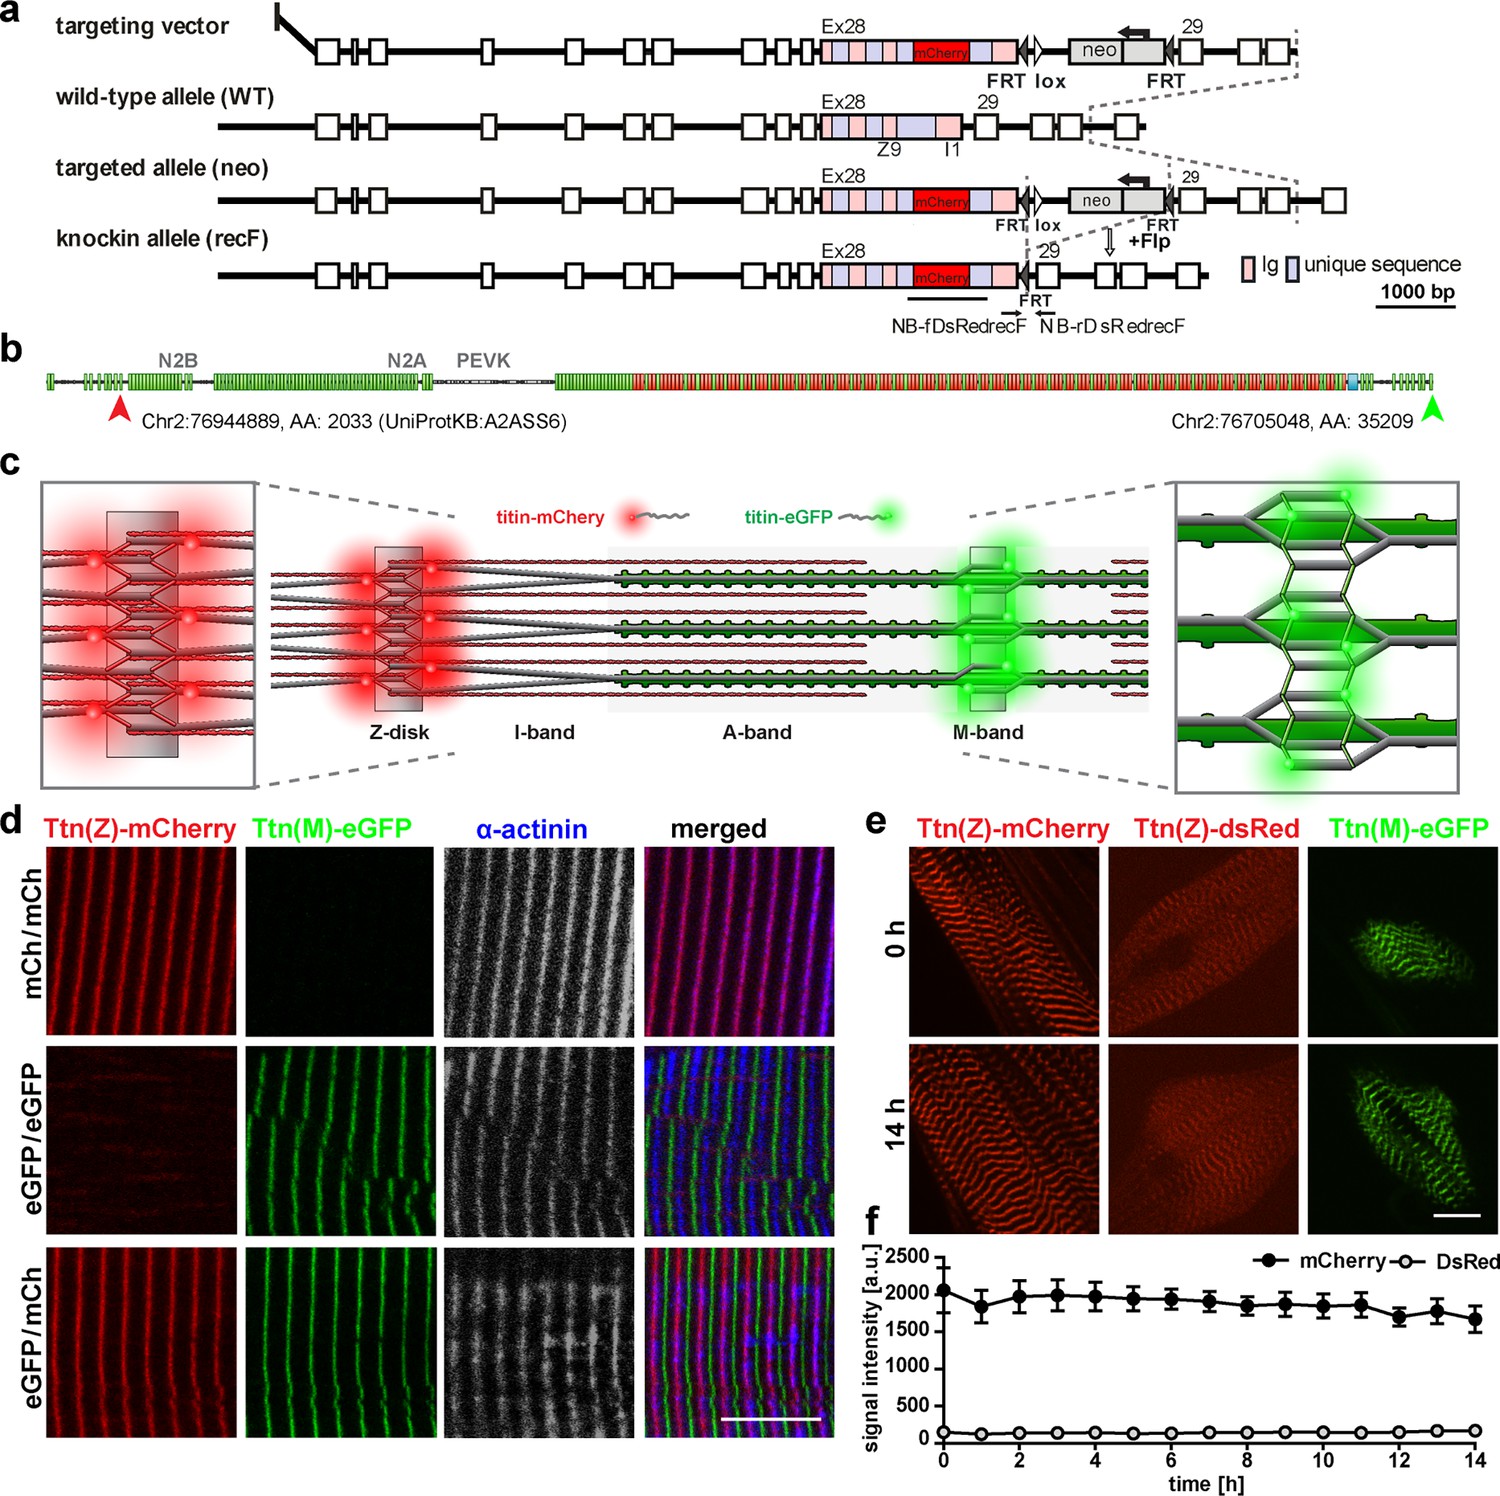
Generation and validation of a titin Z-disk knock-in with enhanced fluorescence.
(a) Targeting strategy to insert mCherry into titin’s Exon 28 (Z-disk). (b) mCherry is integrated outside the Z9 domain (red arrow) and GFP at the c-terminus (green arrow). (c) Sarcomeric structure with titin-mCherry integration flanking the Z-disk and titin-GFP at titin’s C-terminus at the M-band. (d) Alternating red and green fluorescent staining in tibialis anterior (TA) of homozygous titin(Z)-mCherry, homozygous titin(M)-eGFP, and double-heterozygous mice. Co-staining for α-actinin as a marker of the Z-disk confirms a proper localization of the mCherry fluorophore. (e) Simultaneous live imaging of myotubes with dsRed or mCherry fused to titin reveals higher intensity and better signal-to-noise ratio for the mCherry fluorophore. Scale bar 10 µm. (f) Stability of the fluorescent signal with minor changes over 14 hr and higher intensity of the mCherry signal measured in three cells (n = 3) as the average signal at three Z-disks. Difference is significant with p<0.001 for all time points, tested by two-way ANOVA.
-
Figure 1—source data 1
Measured signal intensity of mCherry and dsRed from 0 to 14 hr depicted in panel f.
- https://cdn.elifesciences.org/articles/95597/elife-95597-fig1-data1-v1.xlsx
Figure 1—figure supplement 1
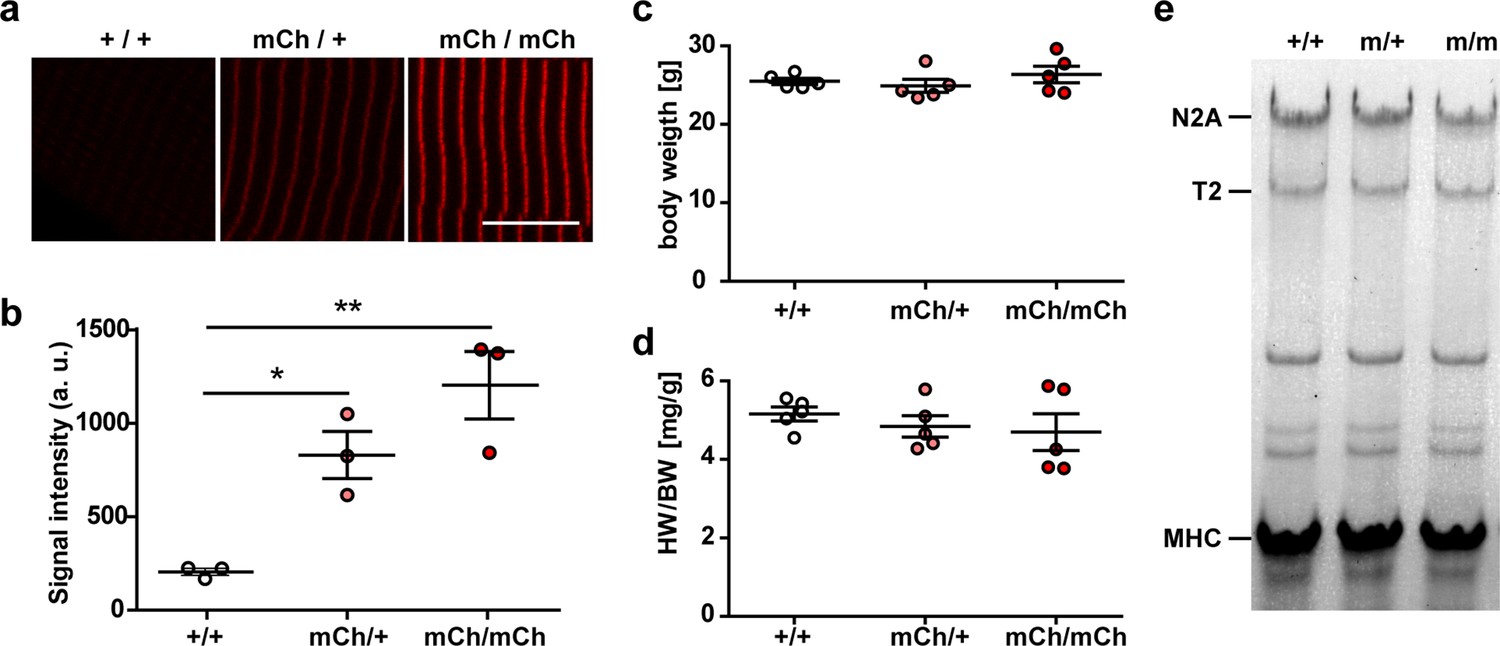
Knock-in of mCherry at titin’s Z-disk.
(a) Representative images of extensor digitorum longus (EDL) sections of homozygous, heterozygous, and WT Ttn(Z)-mCherry mice with significantly different fluorescence intensities (b); one-way ANOVA (n = 3 with five sarcomeres per replicate). Bodyweight (c) and heart-to-bodyweight ratio (HW/BW, d) were not significantly different between genotypes (n = 5 per genotype). Bartlett’s test confirmed that there was no significant difference in variance between samples. (e) Titin isoform expression was unchanged between genotypes (n = 5 per genotype). Scale bar 10 µm. Significance *p<0.05; **p<0.01, Bonferroni post test.
-
Figure 1—figure supplement 1—source data 1
File with values for measured signal intensity at the Z-disk of mCherry in EDL muscle of homozygote (tg/tg), heterozygote (tg/wt), and wildtype (wt/wt) animals, corresponding to panel b; bodyweight (g), corresponding to panel c; heart weight and HW/BW ratio corresponding to panel d.
- https://cdn.elifesciences.org/articles/95597/elife-95597-fig1-figsupp1-data1-v1.tif
-
Figure 1—figure supplement 1—source data 2
Original titin gel for panel e indicating the relevant bands of titin (N2A, T2) and MHC of wildtype (+/+), heterozygote (+/m), and homozygote (m/m) mCherry skeletal muscle.
- https://cdn.elifesciences.org/articles/95597/elife-95597-fig1-figsupp1-data2-v1.tif
-
Figure 1—figure supplement 1—source data 3
Original file for titin gel displayed in panel e.
- https://cdn.elifesciences.org/articles/95597/elife-95597-fig1-figsupp1-data3-v1.xlsx
Figure 2 with 1 supplement
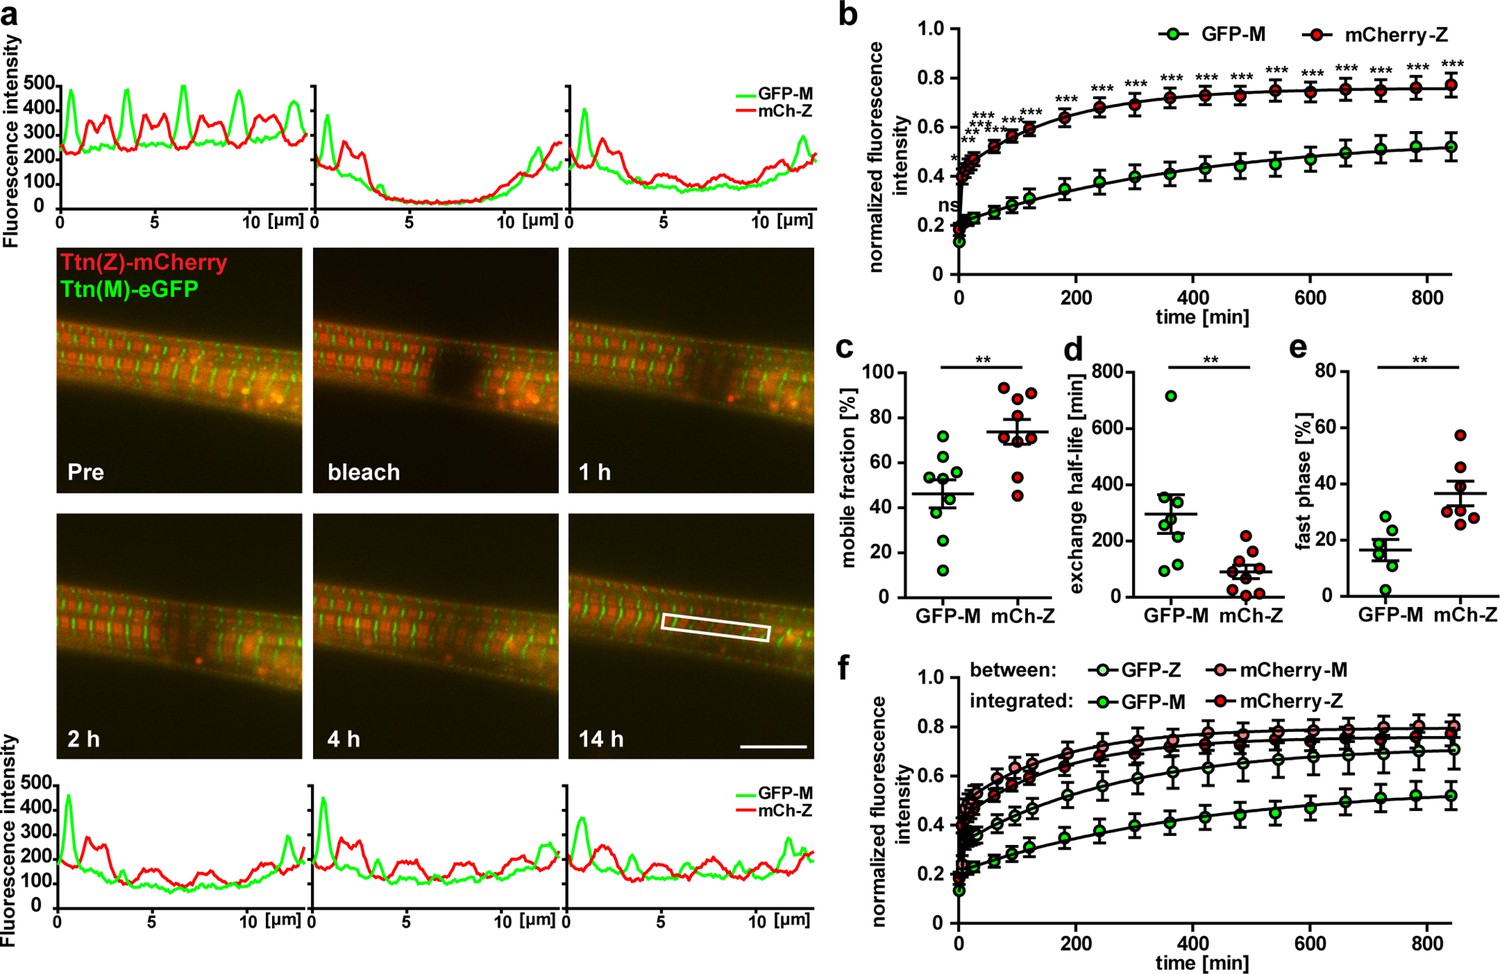
Titin mobility in myotubes at Z-disk and M-band.
(a) Representative recovery of the sarcomeric titin signal within 14 hr. Intensity profiles of the bleached regions (white rectangle). Scale bar 10 µm. (b) The mCherry-labeled Z-disk titin (mCh-Z) recovers significantly faster than the GFP-labeled M-band titin (GFP-M; n = 9; in three independent experiments, two-way ANOVA) with mobile fraction increased (c) and exchange half-life reduced (d). (e) The recovery of fluorescent titin is biphasic with a higher contribution of the fast phase for Z-disk vs. M-band titin. In the fast phase, the signal recovers within <5 min, the slow phase lasts up to 12 hr. (c–e) n = 6–9 cells per group exclusion of one outlier in (d) and of cells without a biphasic recovery in (e); one-way ANOVA for (c, d) and (e). (f) Nonintegrated GFP-labelled titin (GFP signal outside the M-band) recovers faster than M-band integrated GFP-titin. Samples with a obvious decrease in cell quality during imaging were excluded from the analysis.
-
Figure 2—source data 1
Measured intensity of mCherry-Z and GFP-M intensity at different timepoints from prebleached to 8 hr post bleaching, corresponding to panel a.
- https://cdn.elifesciences.org/articles/95597/elife-95597-fig2-data1-v1.xlsx
-
Figure 2—source data 2
Values of normalized intensity of mCherry-Z and GFP-M signal from 0 to 840 min of recovery after bleaching, corresponding to panel b.
- https://cdn.elifesciences.org/articles/95597/elife-95597-fig2-data2-v1.xlsx
-
Figure 2—source data 3
Values of GFP-M and mCh-Z of mobile fraction and mobile fraction (in %) corresponding to panel c, exchange half-life (min) corresponding to panel d, and fast phase (in %) corresponding to panel e.
- https://cdn.elifesciences.org/articles/95597/elife-95597-fig2-data3-v1.xlsx
-
Figure 2—source data 4
Values of normalized fluorescence intensity of integrated (GFP-M and mCh-Z) and between (GFP-Z and mCh-M) from 0 to 840 min of recovery after bleaching, corresponding to panel f.
- https://cdn.elifesciences.org/articles/95597/elife-95597-fig2-data4-v1.xlsx
Figure 2—figure supplement 1
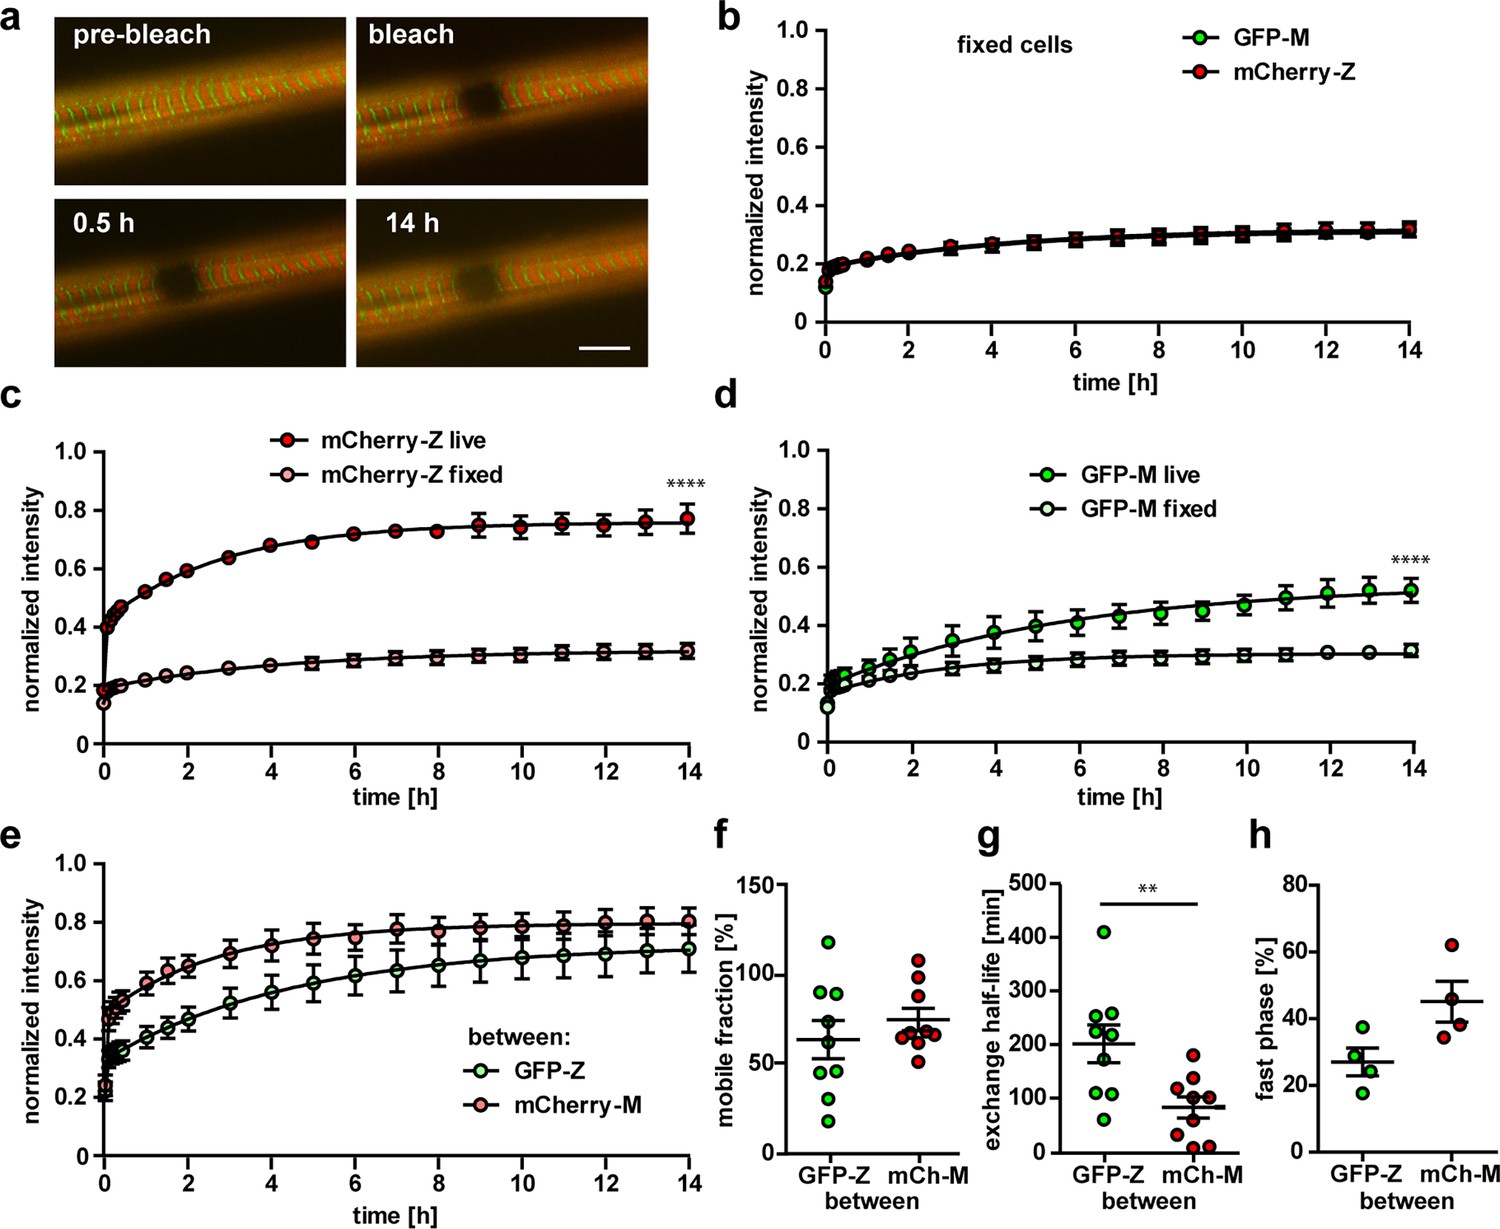
Titin kinetics in double-heterozygous myotubes.
(a) Representative images of FRAP in fixed cells (n = 4) reveal no recovery of titin signal over 14 hr at Z-disk and M-band. Scale bar 10 µm. (b) No difference in the reactivation of the fluorophore for GFP and mCherry, but highly significant difference between the recovery in live and fixed cells. (c, d) Two-way ANOVA, ****p<0.0001. The difference in recovery between mCherry labelled Z-disk titin and GFP-labeled M-band titin is not as pronounced outside their respective integration sites (e). For the titin kinetics outside the integration site measured by mobile fraction (f), exchange half-life (g) and fast phase (h), only half-life is significantly reduced between Z-disk and M-band label (t-test with **p<0.01).
-
Figure 2—figure supplement 1—source data 1
File with values of normalized intensities from 0 to 8 hr of GFP-M and mCherry-Z signal in fixed cells, corresponding to panel b; normalized intensity of mCherry-Z signal in live and fixed cells, corresponding to panel c; normalized intensity of GFP-M signal in live and fixed cells, corresponding to panel d; normalized intensity of mCherry-M and GFP-Z signal, corresponding to panel e; values of mobile fraction (in %) corresponding to panel f; exchange half-life (min) corresponding to panel g; two-phase recovery (in%) corresponding to panel h.
- https://cdn.elifesciences.org/articles/95597/elife-95597-fig2-figsupp1-data1-v1.xlsx
Figure 3 with 1 supplement
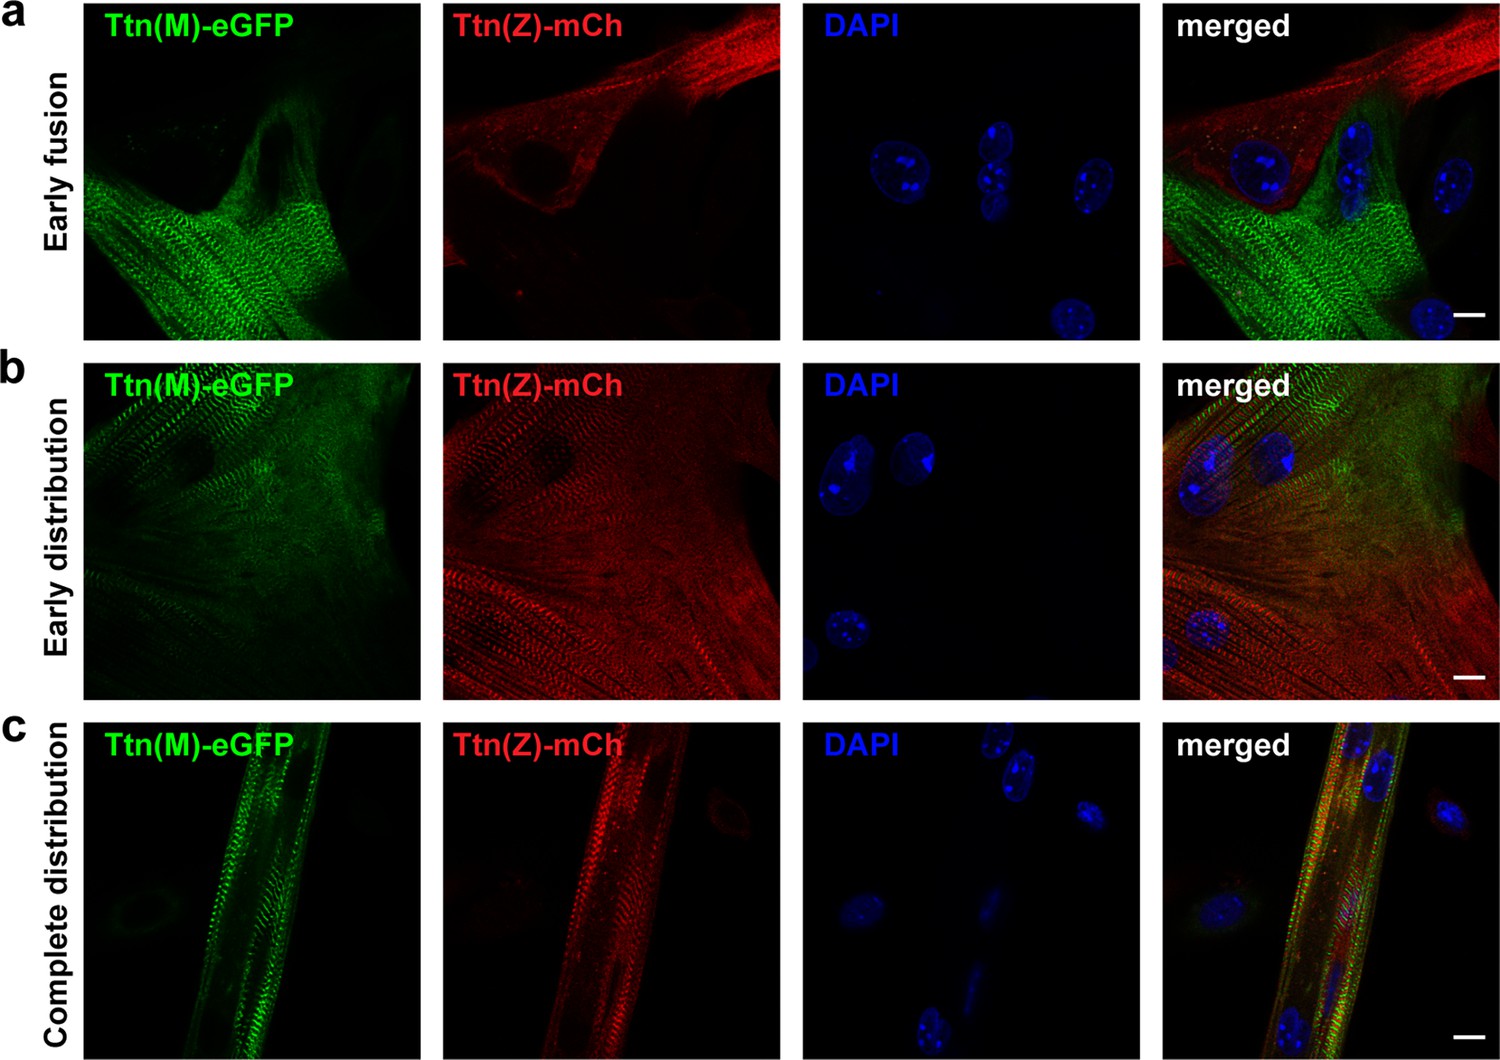
After cell fusion, titin is distributed throughout the myotube.
Satellite cells were isolated from homozygous titin(Z)-mCherry and titin(M)-eGFP mice. After co-cultivation and differentiation to myotubes, cells were fixed at different stages of cell fusion, from first contact and early fusion (a) to early (b) and late (c) distribution of titin proteins. Scale bar 10 µm, experiment was replicated on 4 days with at least five images per staining (over 30 images of fusion events in total).
Figure 3—figure supplement 1
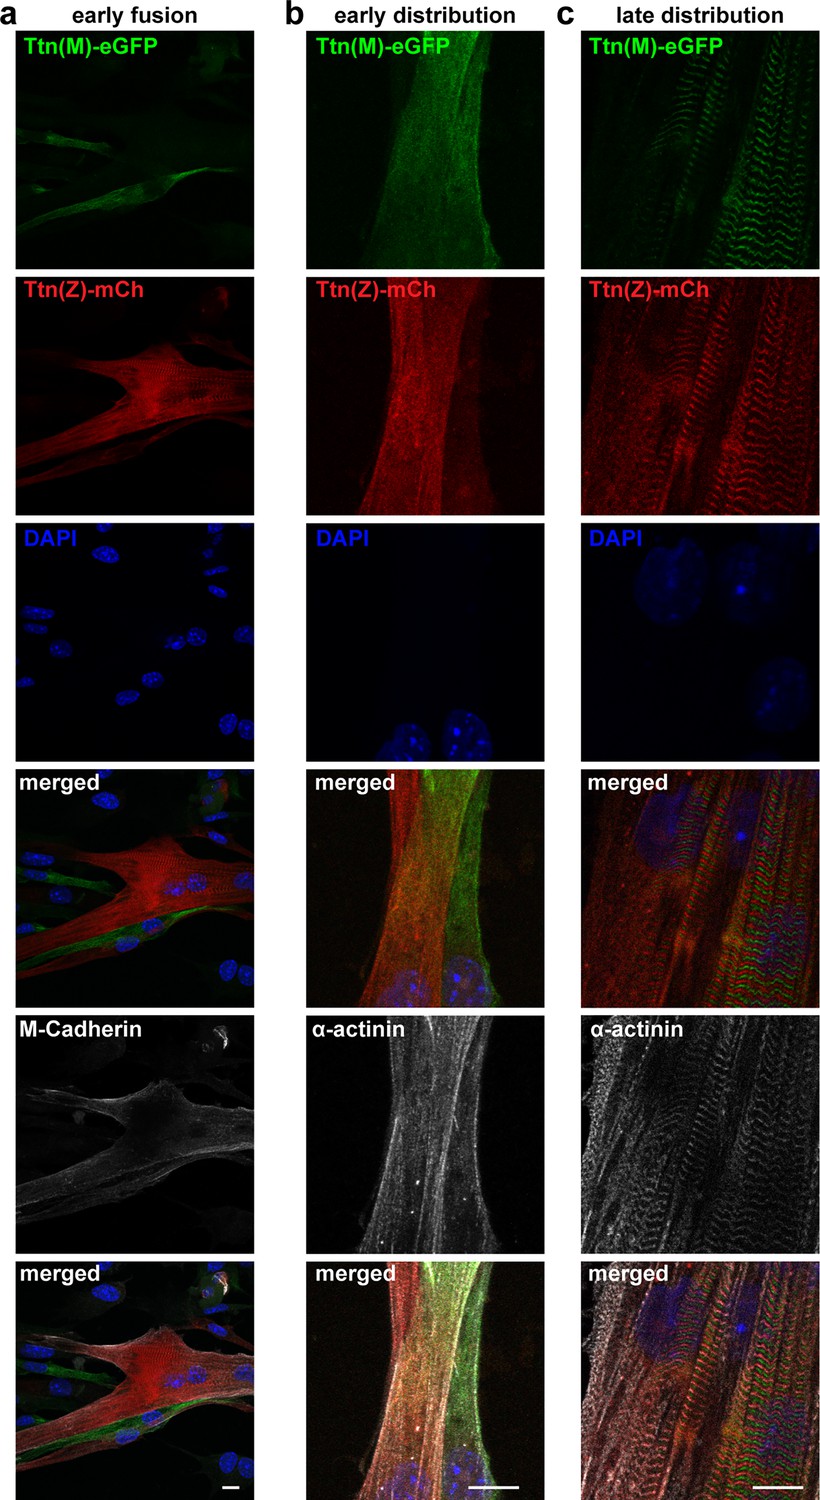
Titin distribution after cell fusion.
Satellite cells isolated from Ttn(Z)-mCherry and Ttn(M)-eGFP animals were co-cultured, fixed at different fusion states (a) early fusion, (b) early distribution, and (c) late distribution and co-stained against M-cadherin or α-actinin. Titin is distributed throughout the fused cells, at early and late stage. Scale bar 10 µm.
Figure 4 with 1 supplement
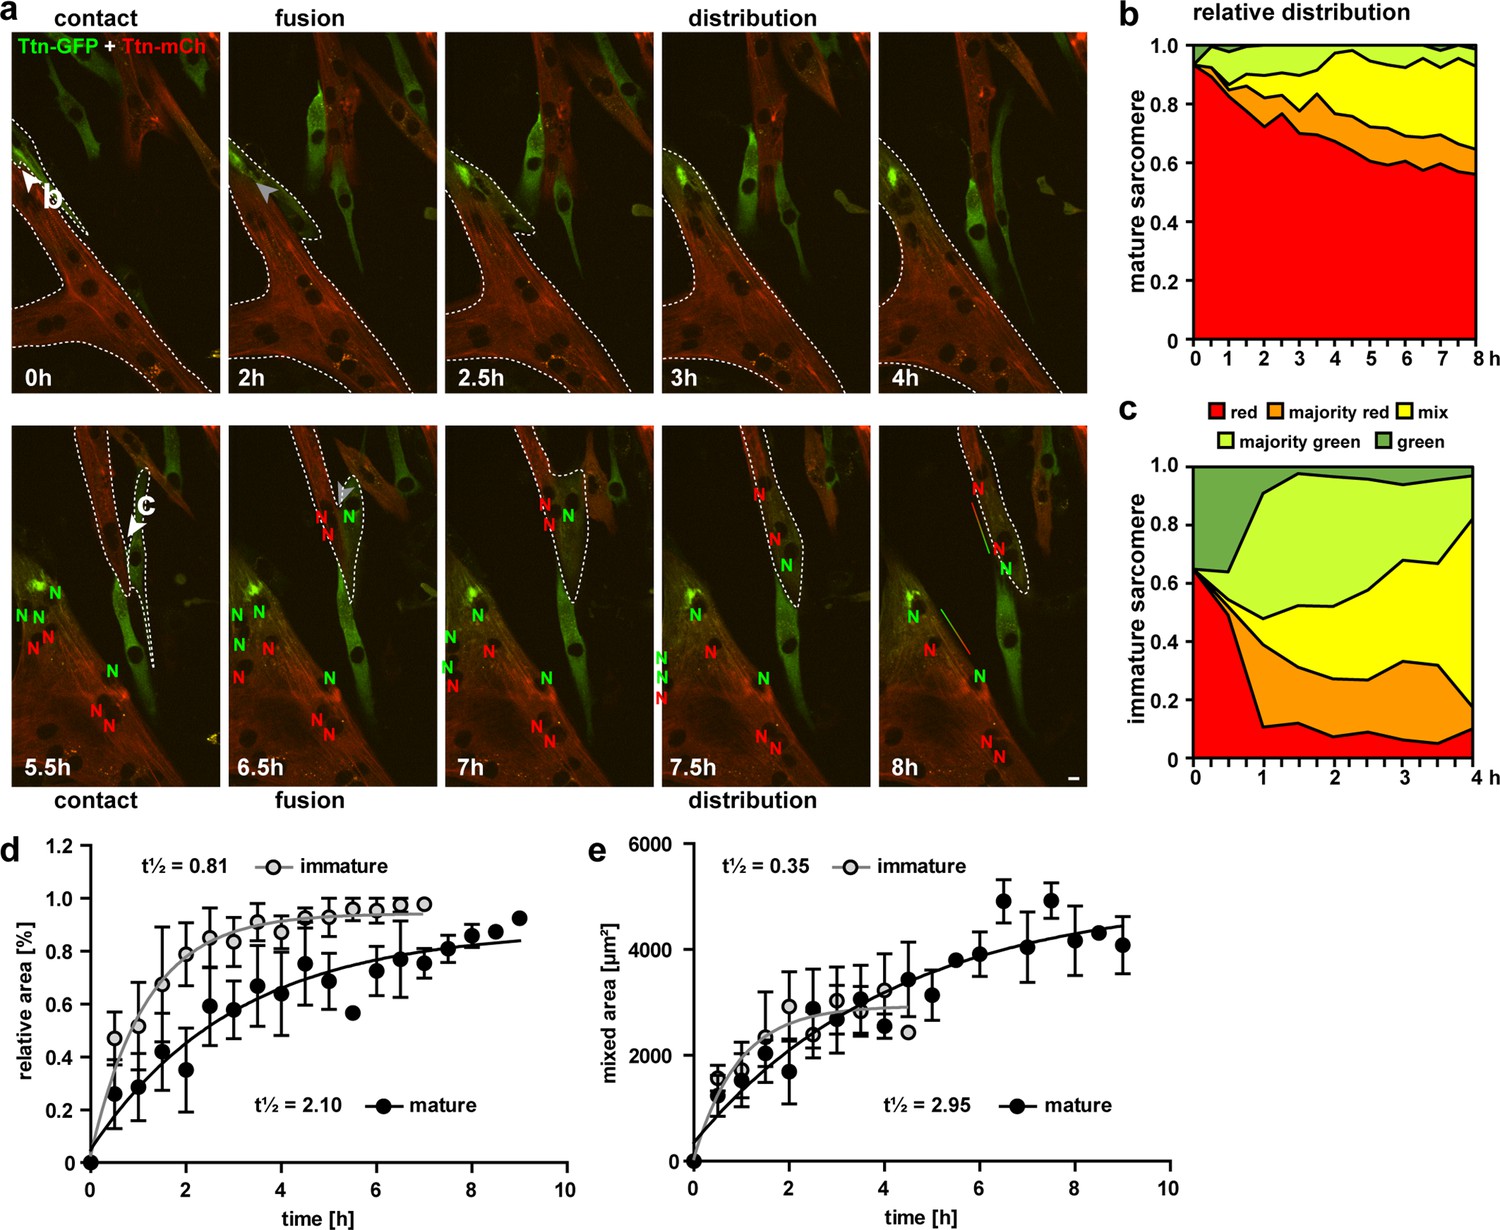
Cell fusion and redistribution of red and green titin in skeletal muscle cells.
(a) Live imaging of cell fusion of homozygous Ttn(Z)-mCherry and Ttn(M)-eGFP myogenic cells (two frames per hour). Arrows indicate the initiation of cell fusion between a small Ttn-eGFP myocyte and a mature myofiber (b) compared to the fusion of two small, immature cells (c). Nuclei expressing red and green fluorescent titin are labeled with red and green ‘N’, respectively. Regions with different fluorescent titin ratios are indicated with dashed outlines. Gradient bar (8 hr) indicates the range of titin spread between two neighboring nuclei. Scale bar 10 µm. (b, c) Titin distribution is measured as the area containing red only, majority red, even mix, majority green, or green only based on thresholds set at 20 and 50% maximal fluorescence intensity as detailed in ‘Methods‘. (b) Fusion between a green immature and large red mature cell leads to a gradual redistribution of green titin to less than half of the resulting syncytium within 8 hr. (c) Fusion between a red and green immature cell leads to a rapid redistribution within the first hour that is almost complete by 4 hr. Relative (d) and absolute (e) increase of the area with mixed red and green titins in immature cells fusing with mature cells (black) vs. immature cells (gray) indicate a >2.5× faster titin distribution when both cells are immature (n = 5 for only immature cells and n = 4 fusion events with one mature cell), two-way ANOVA.
-
Figure 4—source data 1
Area occupied by fluorophore (red and green) from 0 up to 4 or 8 h of myotube maturation, corresponding to panel b and immature myotubes corresponding to panel c.
- https://cdn.elifesciences.org/articles/95597/elife-95597-fig4-data1-v1.xlsx
-
Figure 4—source data 2
Values of mature and immature cells from 0 to 8 hr of relative area (%), corresponding to panel d, and absolute mixed area, corresponding to panel e.
- https://cdn.elifesciences.org/articles/95597/elife-95597-fig4-data2-v1.xlsx
Figure 4—video 1
Fusion movie: time lapse of cell fusion.
Cell fusion and redistribution of red (mCherry) and green (eGFP) titin in skeletal muscle cells from 0 to 8 hr. The same scale applies as in the originals in Figure 4 with the appropriate scale-bar.
Figure 5 with 1 supplement
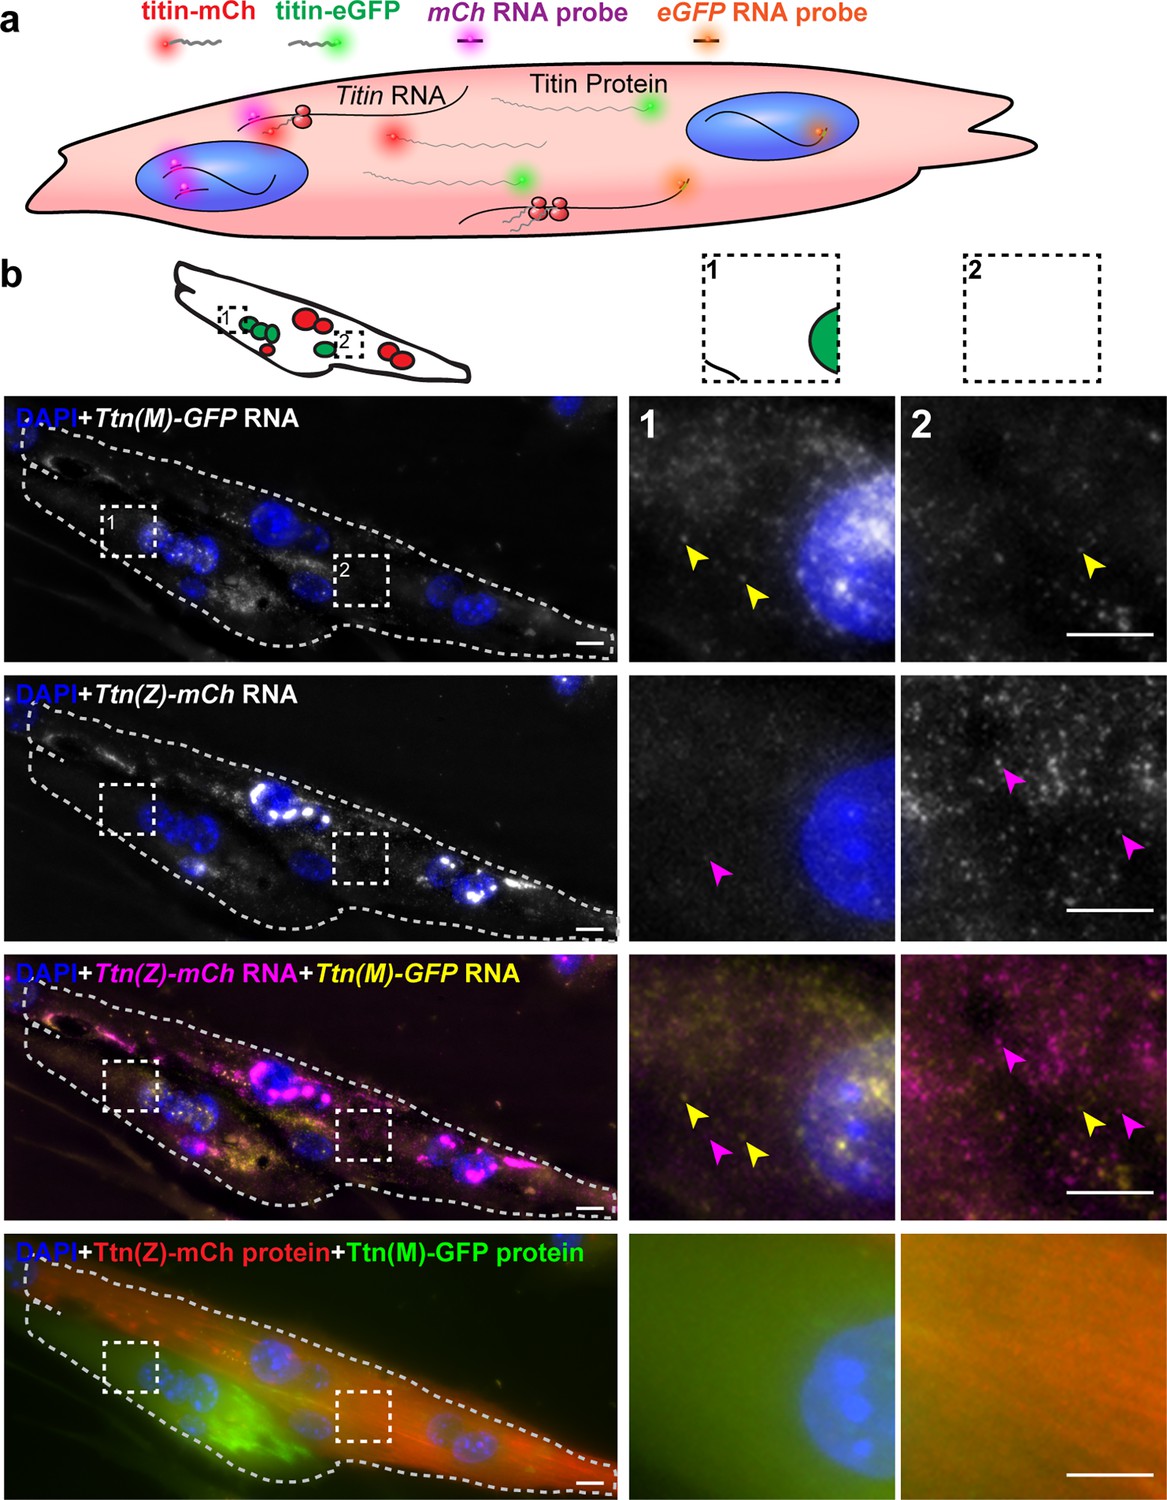
Distribution of titin mRNA in skeletal muscle cells undergoing cell fusion determined by smFISH detecting mCherry and GFP coding region.
(a) Model of titin mRNA and protein synthesis and localization. (b) Representative image of a fusing myotube, where the distribution of titin mRNA has just started. While we find both titin-mCh and titin eGFP mRNA in both the red and green compartments after cell fusion (magenta and yellow arrows), we do not see crossover of green and red titin fusion protein in the same area. Scale bar 10 µm, we replicated the experiment on 2 days with 11 images of fusion events.
-
Figure 5—source data 1
File with values for mRNA and protein of cell fusion events, corresponding to panel b.
- https://cdn.elifesciences.org/articles/95597/elife-95597-fig5-data1-v1.xlsx
Figure 5—figure supplement 1
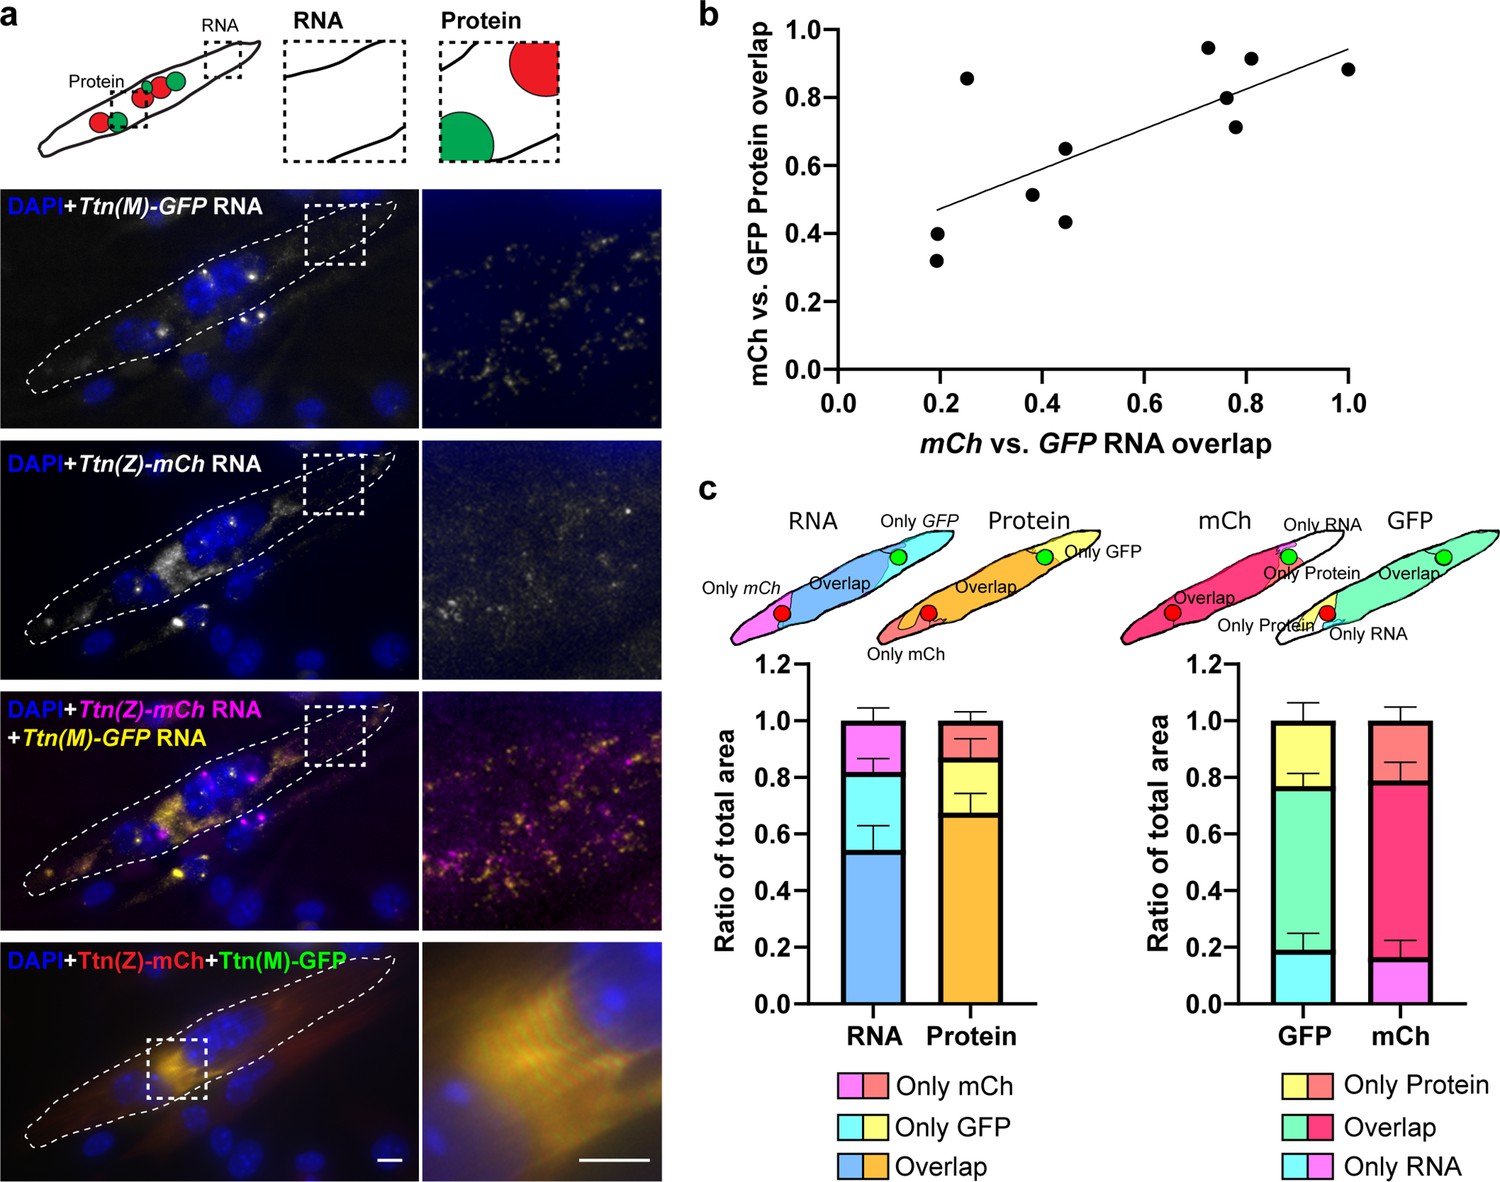
Titin mRNA localization after cell fusion.
Satellite cells were isolated from homozygous Ttn(Z)-mCherry and Ttn(M)-eGFP mice, co-cultured, differentiated to myotubes and fixed after fusion. The cartoon indicates the position of nuclei expressing mCherry vs. GFP titin fusion proteins. (a) Representative image of a fused myotube with intermixed protein and RNA and mature sarcomere structure. Scale bar 10 µm. (b) Quantification of fusion events (n = 11) and correlation (R2 = 0.533) between the relative size of regions where mCh-Ttn and GFP-Ttn protein overlap and the respective regions where RNA overlaps regions depending on the fusion state. (c) The schematic illustration indicates how overlapping regions of the four different channels were quantified (RNA vs. protein and mCh vs. GFP). The mCh vs. GFP overlap region is significantly smaller for the RNA than for the protein signal (p<0.05, two-way ANOVA with correction for matched values).
-
Figure 5—figure supplement 1—source data 1
File with values for RNA and protein overlap correlation of fusion events, corresponding to panel b, and signal localization/overlap of RNA protein of mCherry and GFP in fusion events corresponding to panel c.
- https://cdn.elifesciences.org/articles/95597/elife-95597-fig5-figsupp1-data1-v1.xlsx
Figure 6 with 1 supplement
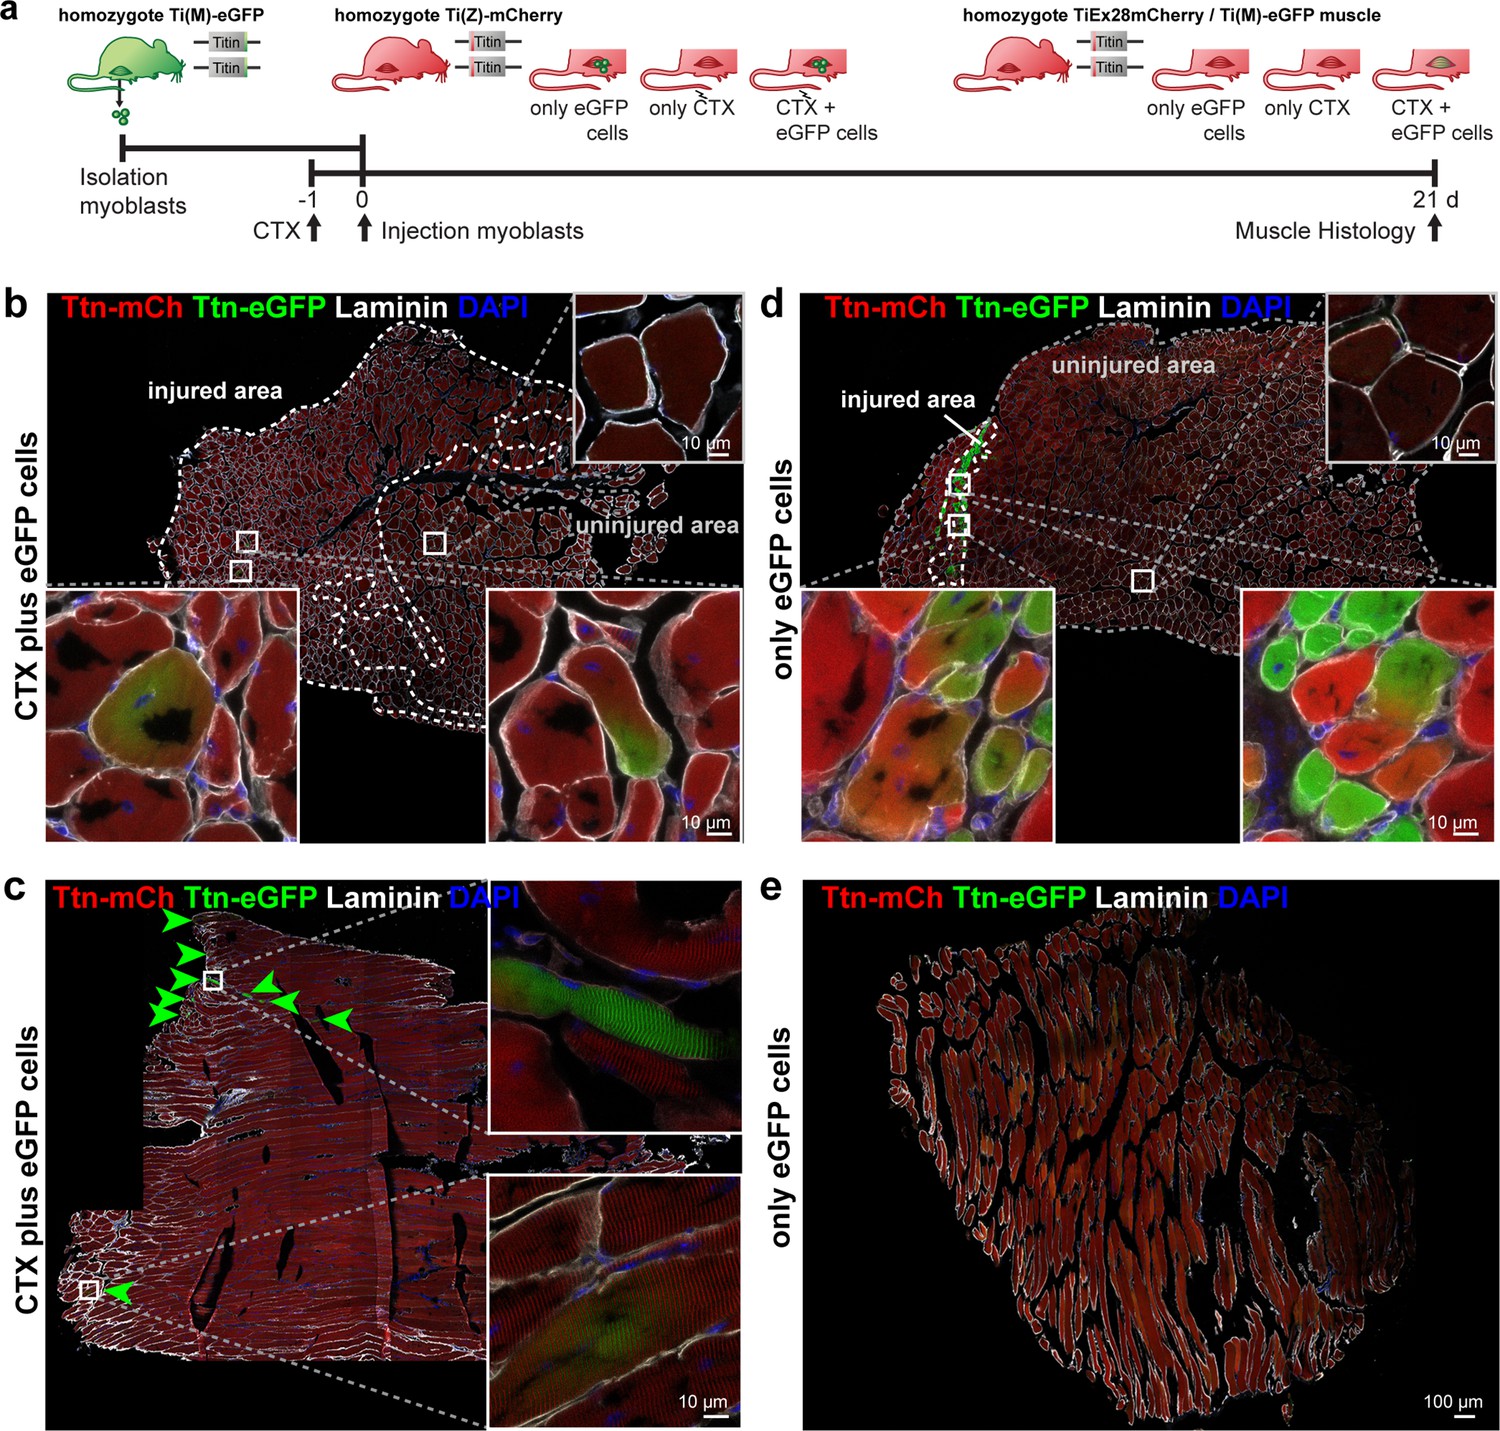
Titin distribution during regeneration.
(a) Tibialis anterior (TA) muscle of Ttn(Z)-mCherry mice was injured by injection of cardiotoxin (CTX) followed by transplantation of Ttn(M)-eGFP myoblasts on the following day (n = 3). Controls comprise CTX injury only (n = 1) and eGFP cell transplantation without injury (n = 4). After 3 weeks of regeneration, muscles (treated and untreated contralateral TA) were dissected and sections stained against laminin to visualize cell boundaries. Centralized nuclei in transversal sections (b, d) are a sign of regenerating cells within injured areas. These areas contain GFP-positive fibers and extend throughout the muscle after CTX injury (b), but are limited to the injection site with cell injection only (d). The longitudinal sections (c, e) provide additional information about the proper integration of titin proteins from the transplanted cells into the regenerating myofibers. After injury, transplanted Ttn(M)-eGFP myoblasts fuse with the Ttn(Z)-mCherry cells of the injured host muscle and titin proteins from both cells contribute to the directionality of myofibers that is maintained along the muscle.
Figure 6—figure supplement 1
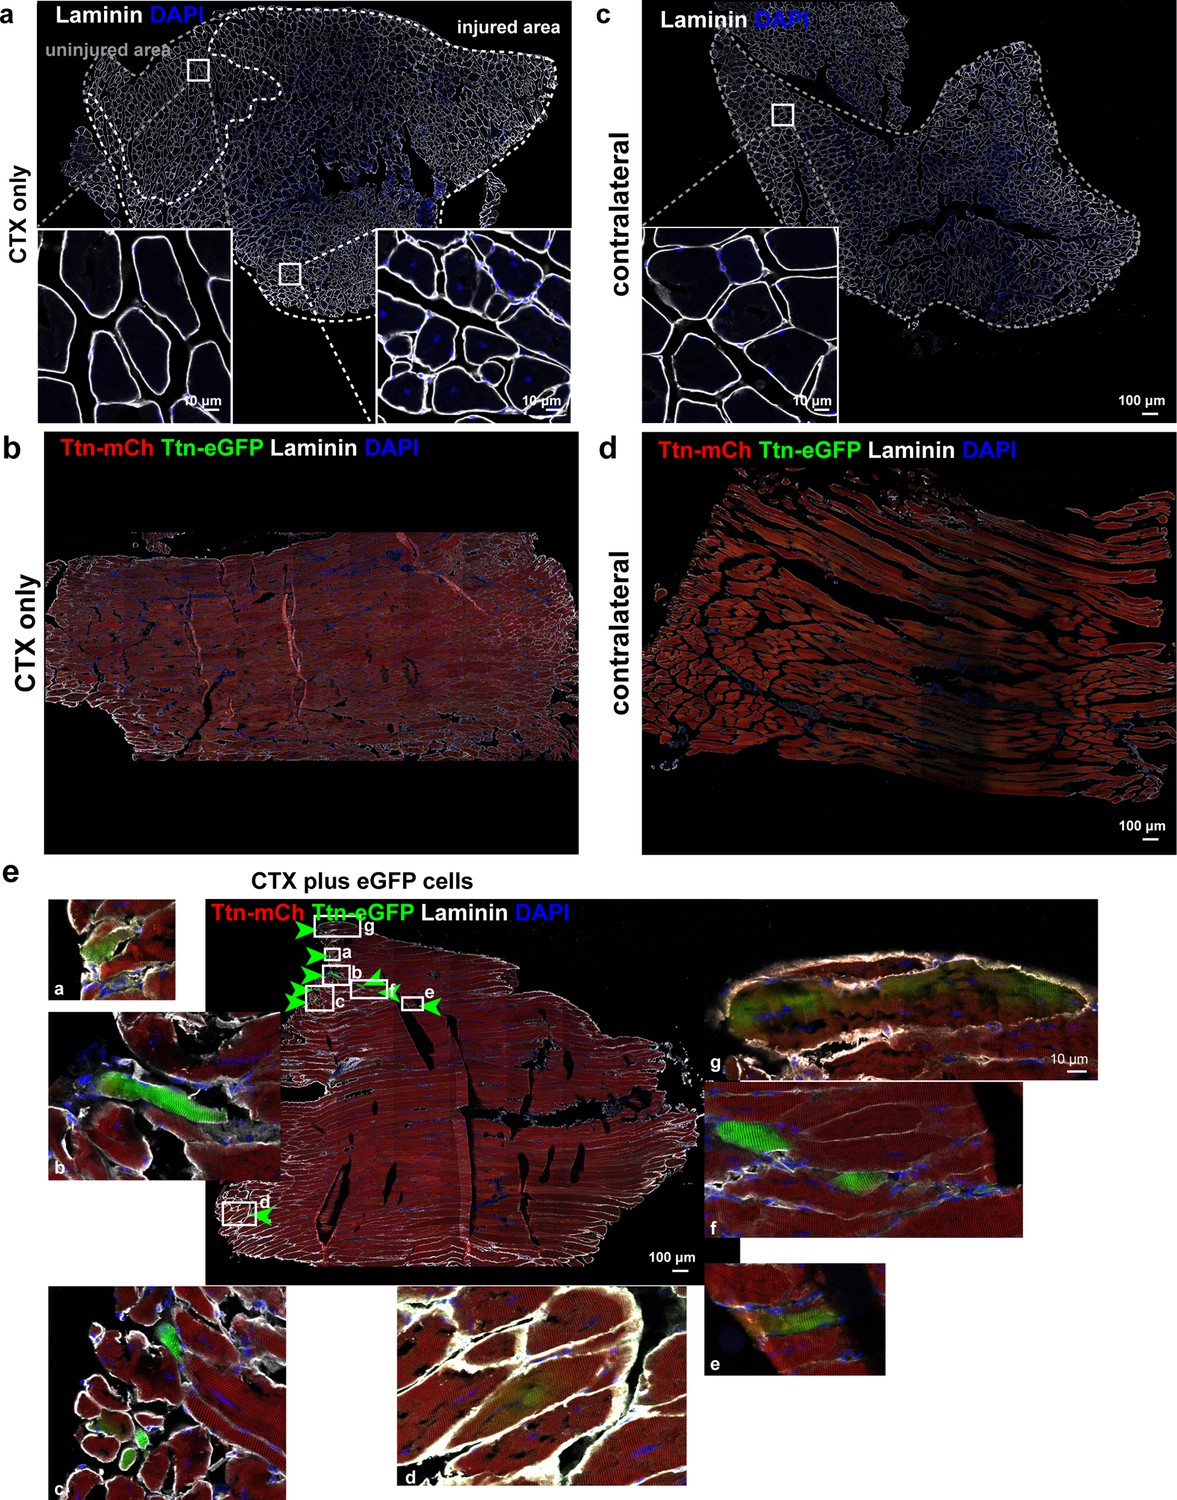
Titin mobility and integration upon in vivo regeneration and cell transplantation.
(a) Transversal sections of tibialis anterior (TA) muscles of the control group (cardiotoxin [CTX] only, n = 1) and the noninjected contralateral muscle (b). (c) Longitudinal sections of TA muscles of the CTX-only group and the contralateral muscle (d). (e) Magnifications of areas with eGFP-positive fibers from the longitudinal section of the CTX injury plus cell transplantation group (n = 6; white letters a–g for seven regions of interest). Scale bar 100 µm.
Additional files
Download links
A two-part list of links to download the article, or parts of the article, in various formats.
Downloads (link to download the article as PDF)
Open citations (links to open the citations from this article in various online reference manager services)
Cite this article (links to download the citations from this article in formats compatible with various reference manager tools)
Visualizing sarcomere and cellular dynamics in skeletal muscle to improve cell therapies
eLife 13:e95597.
https://doi.org/10.7554/eLife.95597


