The neuron-specific IIS/FOXO transcriptome in aged animals reveals regulatory mechanisms of cognitive aging
- Department of Molecular Biology, Princeton University, United States
- Princeton University, United States
Figures
Figure 1 with 2 supplements
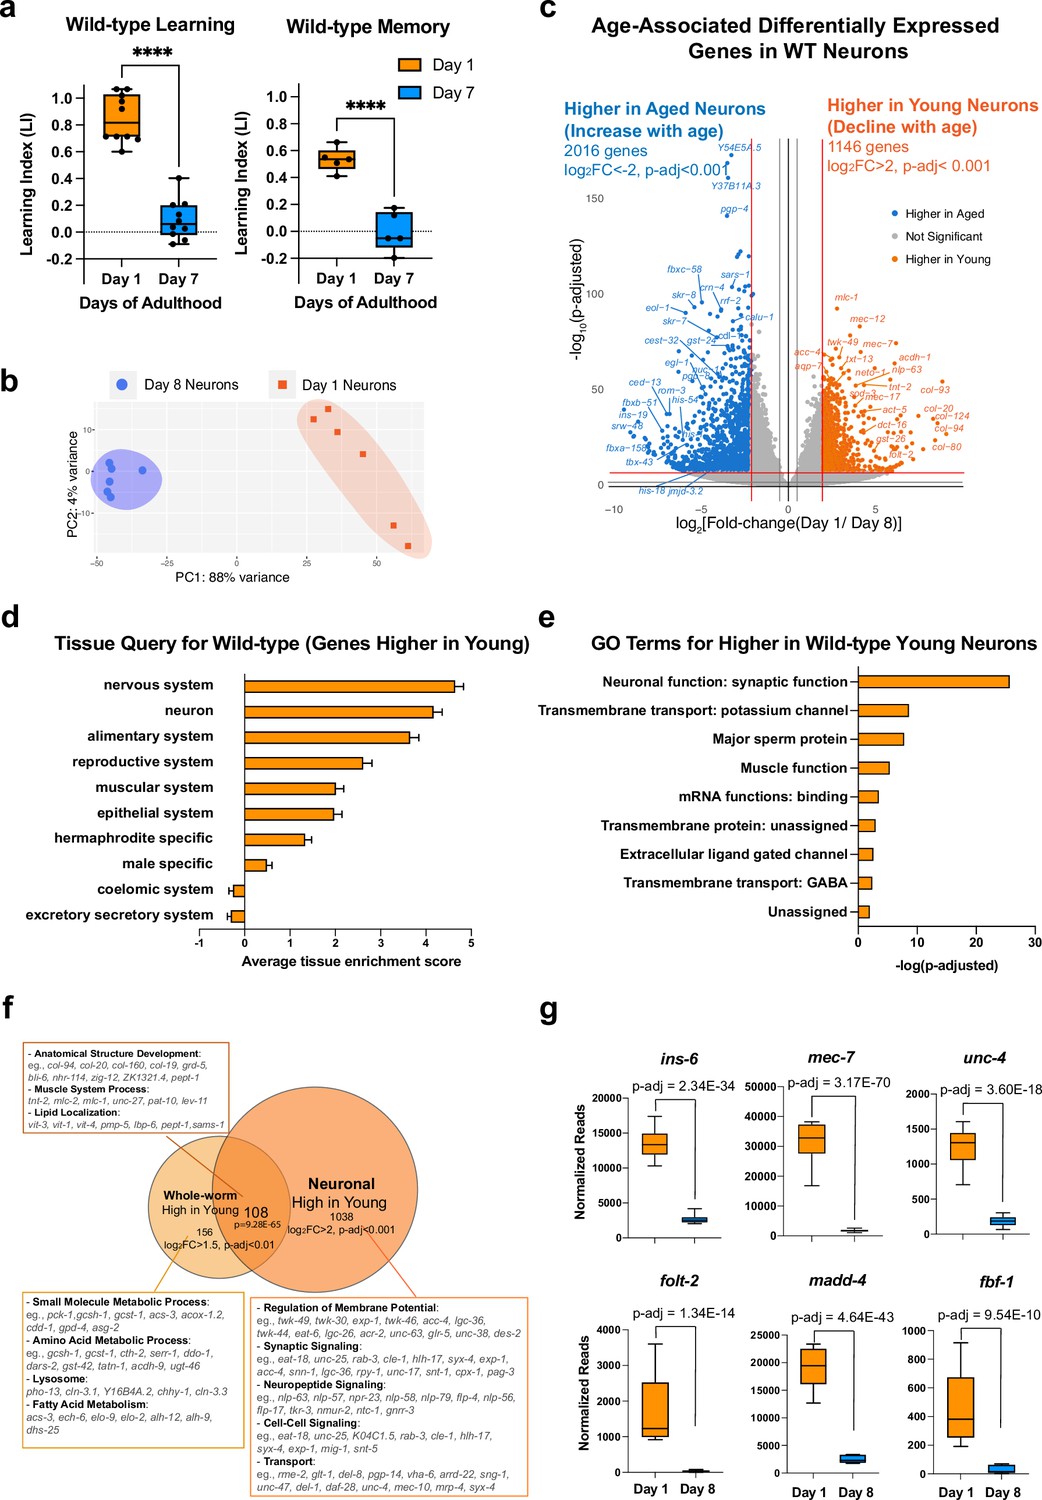
Identifying neuronal aging targets in wild-type (WT) worms using neuron-specific RNA-sequencing.
(a) Wild-type learning and 1 hr memory results on Day 1 and Day 7. Learning and memory results are represented as learning index (LI). Details of the LI calculation are explained in the methods. Learning, n=10, memory, n=5. ****p<0.01. Student’s t-test. (b) PCA plot for Day 1 (orange) and Day 8 (blue) neuronal bulk RNA-seq samples. (c) Volcano plot comparing age-associated differentially-expressed genes in WT neurons. Genes downregulated with age (orange) and upregulated with age (blue) were obtained by neuron-specific RNA sequencing of adult wild-type animals with neuron-specific GFP expression. Adjusted p-value <0.001, log2(Fold-change) >2. n=6 biological replicates per age. 1146 genes were significantly downregulated with age (higher in young neurons) and 2016 genes were upregulated with age (higher in old neurons) (d) Tissue prediction scores for genes higher in young neurons. (e) Gene ontology (GO) terms of genes that decline with age in wild-type neurons. Synaptic and signaling GO terms are enriched in neuronal genes. p-value calculated using hypergeometric distribution probability. (f) Comparison of whole-body higher-in-young genes and neuronal higher-in-young genes. GO Terms and representative genes were performed using g:Profiler software. P-value of overlapping regions were calculated using a hypergeometric calculator. (g) Normalized reads of ins-6, unc-4, mec-7, folt-2, fbf-1, and madd-4, in Day 1 and Day 8 neurons in our dataset. p-adjusted values were calculated from DESeq2 software. Box plots: center line, median; box range, 25-75th percentiles; whiskers denote minimum-maximum values.
Figure 1—figure supplement 1
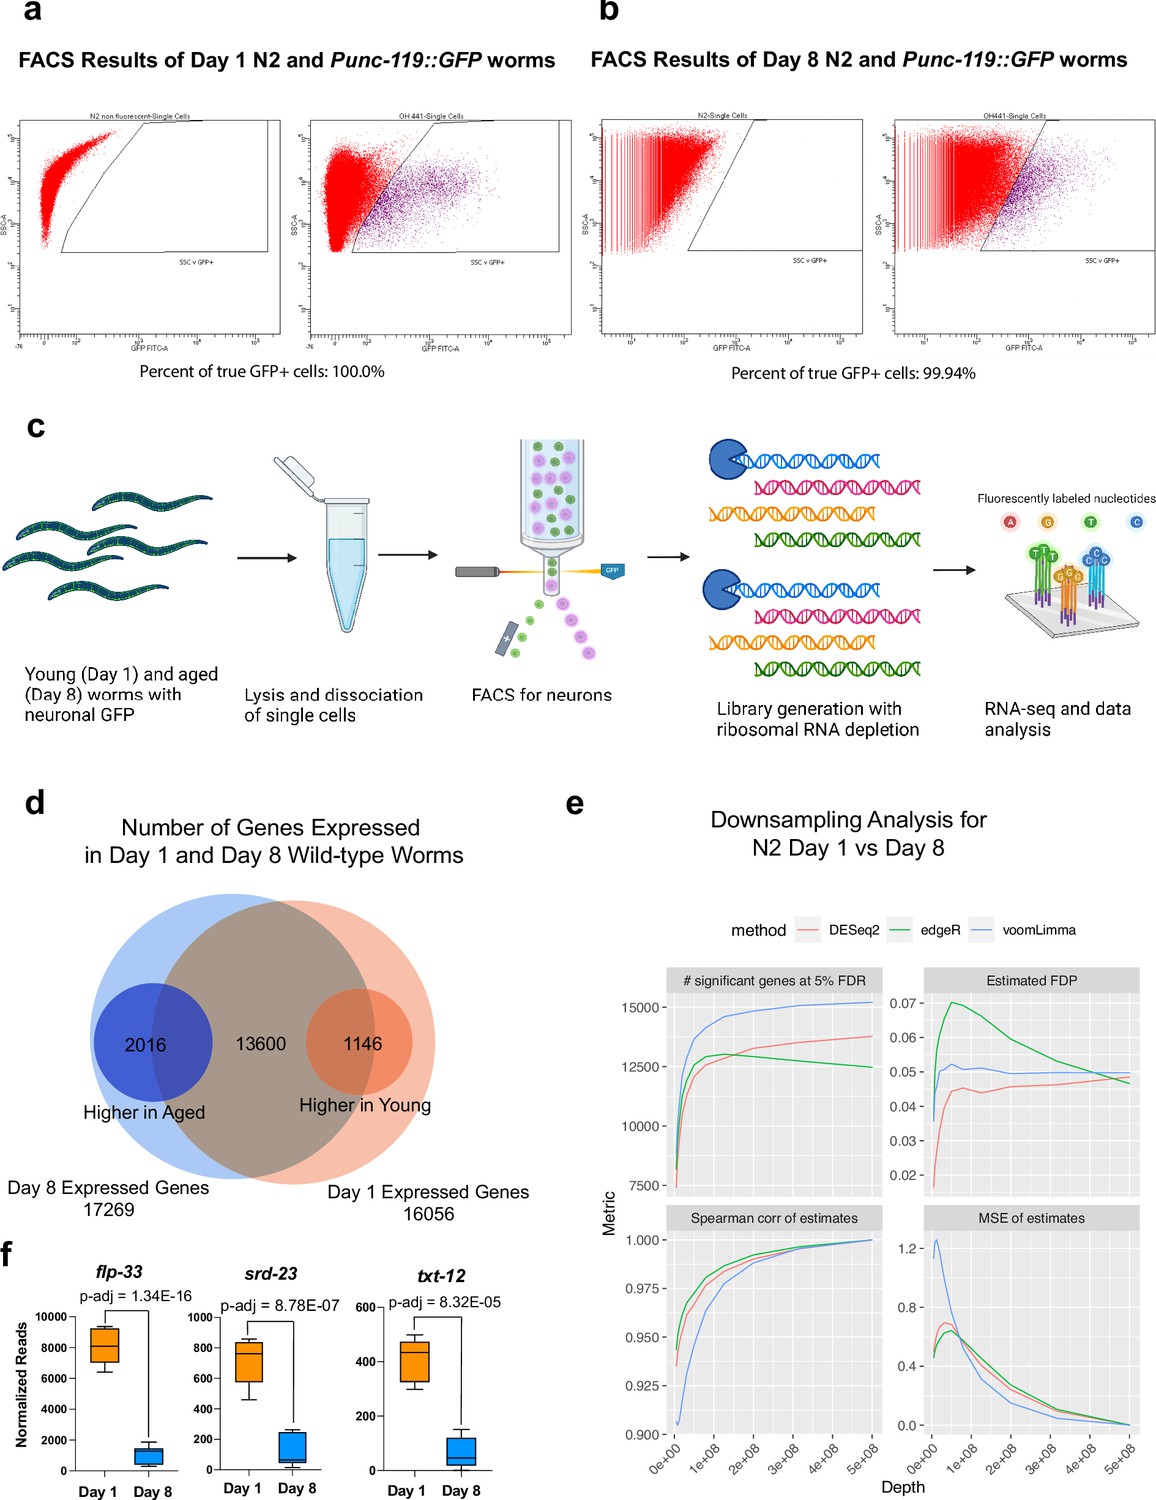
Aged neuron-specific sequencing.
(a–b) FACS results of neuron isolation. Over 99.94% of the cells collected are GFP + neurons. 100,000 cells are collected for each biological replicate, six biological replicates for each condition. (c) Workflow of neuron isolation, library generation, and sequencing. The diagram was generated using Biorender, and published using a CC BY-NC-ND license with permission. (d) Number of genes detected in Day 1 and Day 8 wild-type neurons. Genes with log2(TPM) >0.5 are considered expressed. (e) Down-sampling analysis for N2 Day 1 vs Day 8 indicates downsampling 30% of the data will still yield good results, indicating sufficiency of sequencing depth. (f) Normalized reads of txt-12, flp-33, and srd-23 in Day 1 and Day 8 neurons. p-adjusted values were calculated from DESeq2 software.
© 2024, BioRender Inc. Figure 1—figure supplement 1 was created using BioRender, and is published under a CC BY-NC-ND 4.0. Further reproductions must adhere to the terms of this license.
Figure 1—figure supplement 2
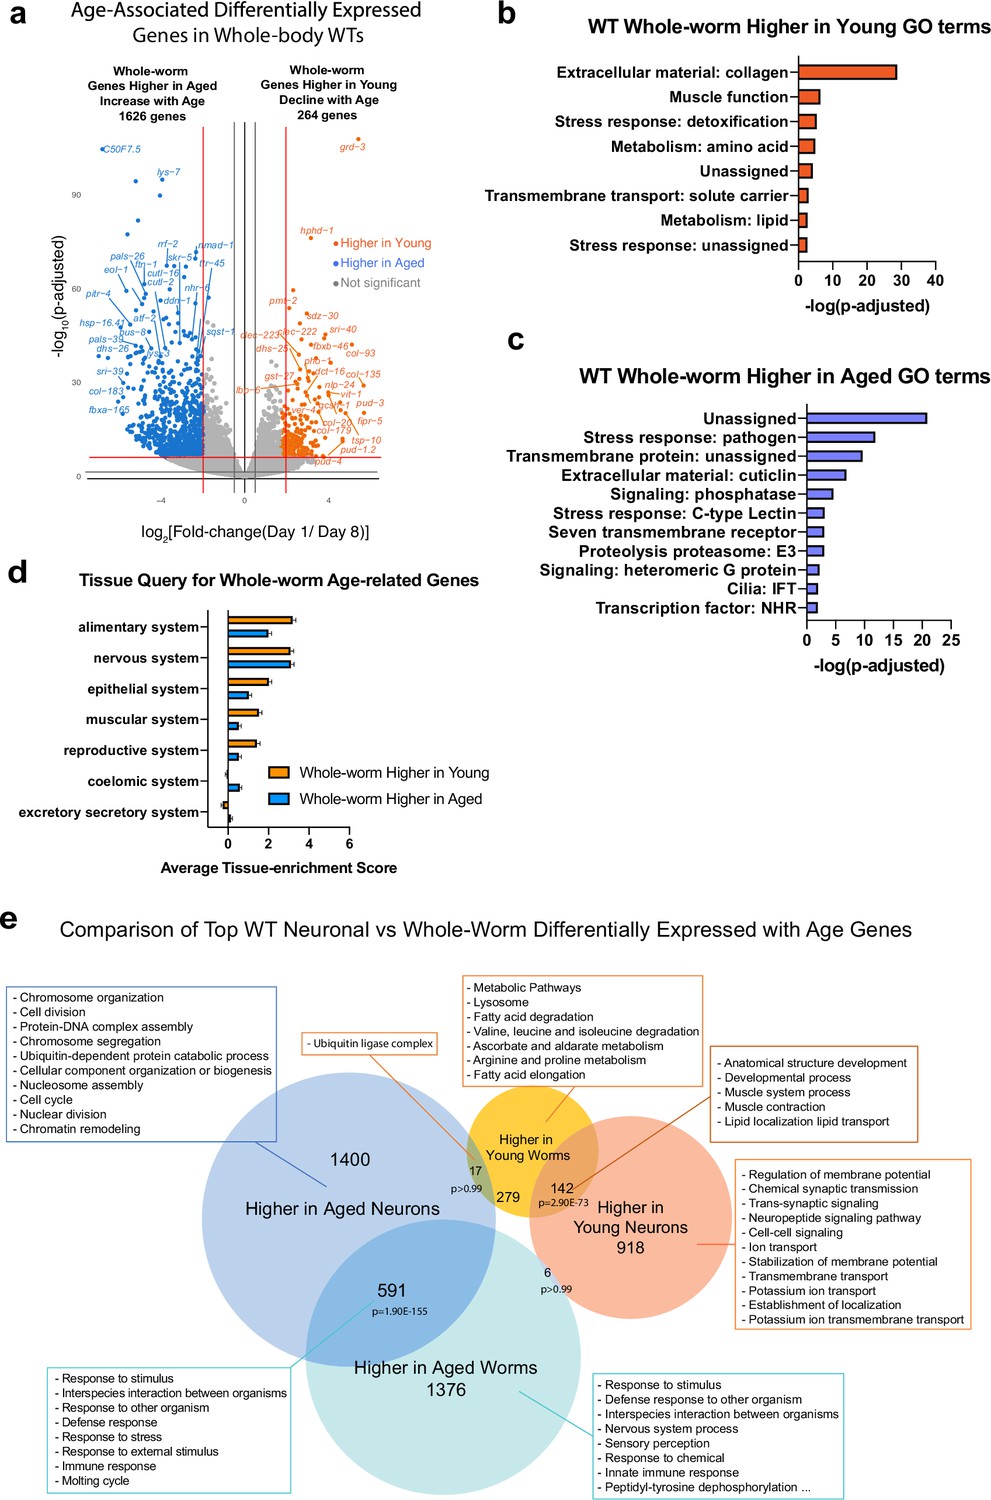
Whole-worm RNA-sequencing identifies whole-body changes during aging.
(a) Volcano plot of Day 1 vs Day 8 differentially-expressed genes during aging. 264 genes are expressed at higher levels in young worms, 1626 genes are higher in aged worms (log2[Fold-change (Day 1 /Day 8)]>2.0, p-adjusted <0.001). (b) Gene ontology (GO) terms of genes that are expressed at higher levels in young (wild-type) whole animals highlight collagen and metabolism. (c) GO terms of genes that are expressed at higher levels in aged (wild-type) whole animals. GO terms were generated using Wormcat 2.0. (d) Tissue query for whole-worm aged-related genes highlights the alimentary system. (e) Full image of comparison of top wild-type neuronal and whole-worm differentially expressed with age genes. Related to Figure 2D.
Figure 2
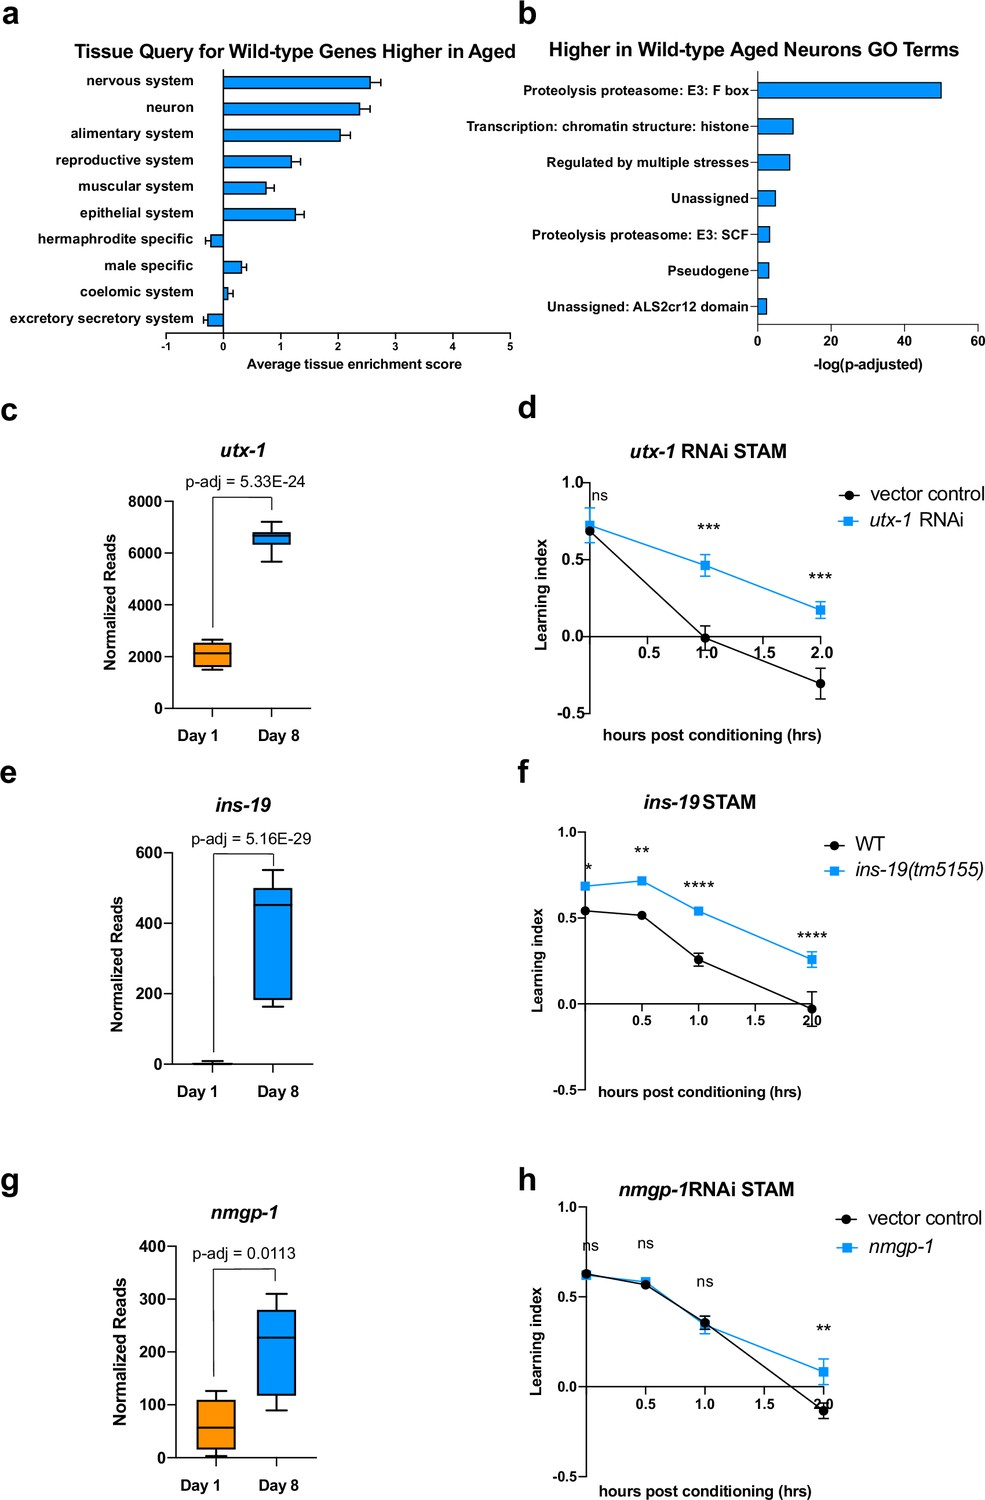
Genes that increase with age cause behavioral defects.
(a) Tissue prediction score for wild-type genes expressed at higher levels in aged worms. (b) Gene ontology (GO) terms of genes expressed higher in aged neurons highlight transcription regulation and proteolysis. GO term analysis was done using Wormcat 2.0. (c) Normalized reads of utx-1 on Day 1 and Day 8. (d) Short-term associative memory (STAM) assay shows that neuron-sensitized adult-only utx-1 knockdown improves 1 hr and 2 hr memory of wild-type worms on Day 2. RNAi was performed using the neuron-RNAi sensitized strain LC108. (e) Normalized reads of ins-19 on Day 1 and Day 8. (f) ins-19 mutation improves learning and memory in STAM on Day 3 of adulthood. (g) Normalized reads of nmgp-1 on Day 1 and Day 8. (h) nmgp-1 neuron-sensitized RNAi knockdown improves memory in STAM on Day 2. RNAi was performed using the neuron-RNAi sensitized strain LC108.P-adj value of normalized count change generated from DEseq2 analysis. (c, e, g) Box plots: center line, median; box range, 25-75th percentiles; whiskers denote minimum-maximum values. Normalized reads and adjusted p-value were calculated using the DESeq2 software. Each dot represents one sequencing replicate. (d, f, h) n=5 plates in each behavioral experiment. Representative result of two biological repeats is shown. *p<0.05. **p<0.01. ***p<0.001. ****p<0.0001. Two-way ANOVA with Tukey’s post-hoc analysis.
Figure 3 with 3 supplements
Identifying neuronal IIS/FOXO targets in aged worms using neuron-specific RNA-sequencing.
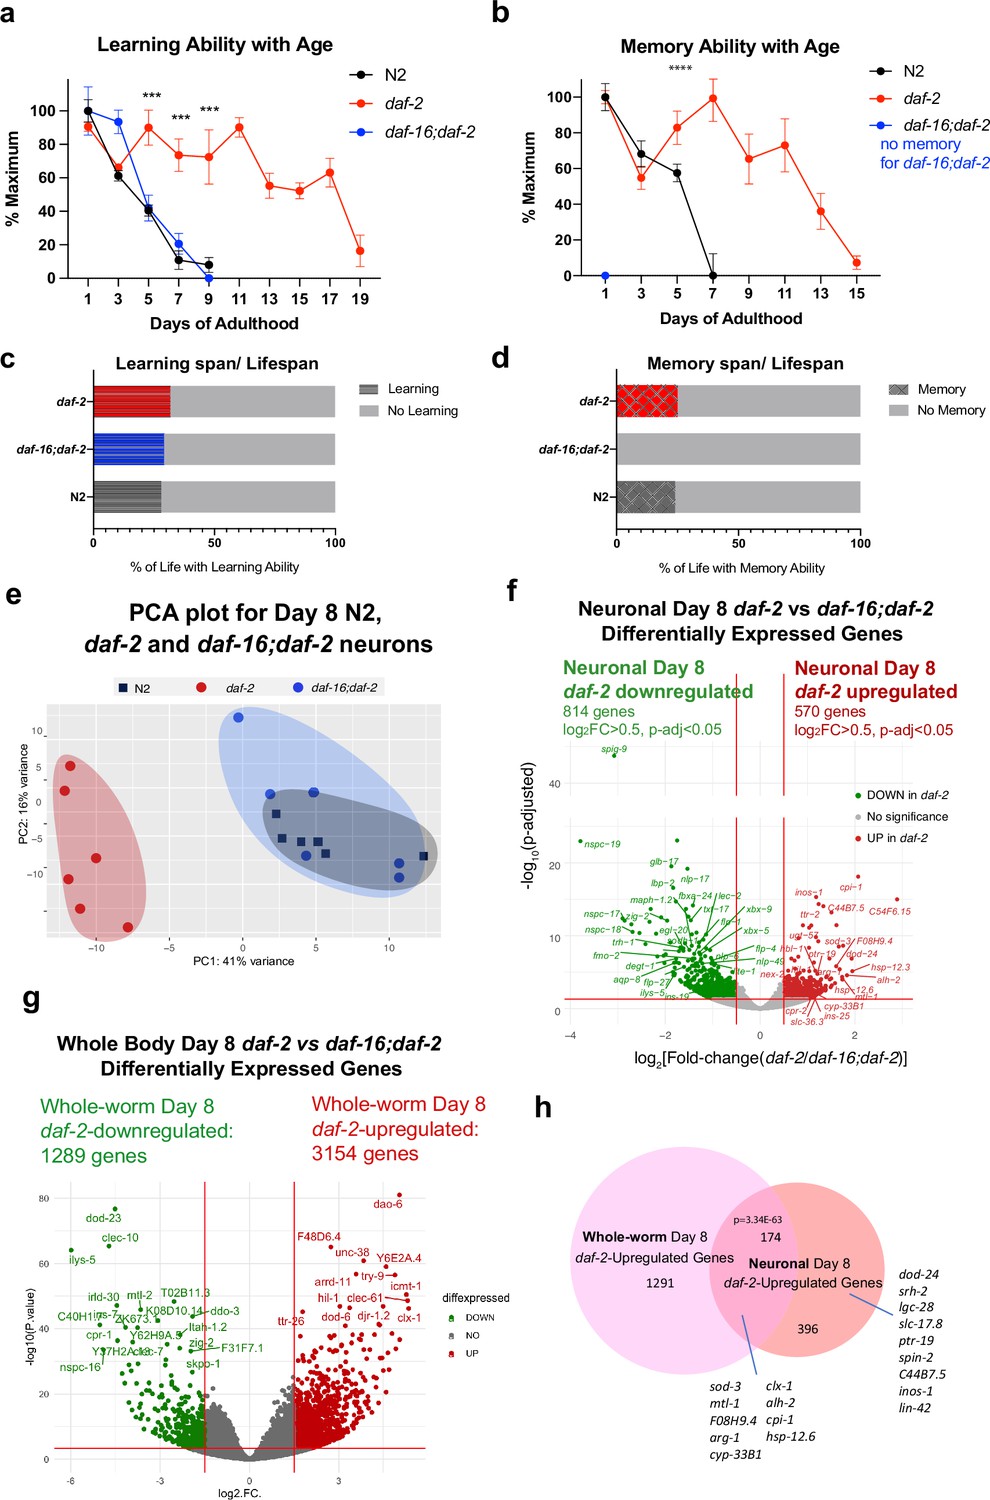
(a) daf-2 mutants show better learning maintenance with age compared to N2 and daf-16;daf-2 worms. n=10 plates in each condition. (b) daf-2 mutants show better memory maintenance with age compared to N2 worms. daf-16;daf-2 worms do not have 1 hr memory on Day 1 of adulthood. N=10 plates in each condition. (c–d) daf-2 mutants have a slightly larger learning span/lifespan ratio and memory span/lifespan ratio than N2 (wild-type). Lifespan shown in Figure 3—figure supplement 1c. (e) PCA plot of Day 8 N2, daf-2, and daf-16;daf-2 neuronal RNA sequencing results. (f) Volcano plot of neuronal daf-2-regulated, daf-16-dependent up- and downregulated genes on adult Day 8 (Adjusted p-value < 0.05, log2(Fold-change) >0.5, n=6 biological replicates per strain). 570 genes were significantly upregulated and 814 genes were downregulated in daf-2 neurons compared with daf-16;daf-2. (g) Volcano plot of whole-worm daf-2 vs daf-16;daf-2 differentially-expressed genes during aging. 3154 genes are higher in daf-2, 1289 genes are higher in daf-16;daf-2 (log2[Fold-change(daf-2 vs daf-16;daf-2)]>1.5, p-adjusted <0.01). (h) Comparison of neuronal and whole-worm Day 8 daf-2 differentially-expressed genes (overlap p=3.34E-63, hypergeometric test). Neuron-specific and shared daf-2 upregulated genes with the highest fold changes are labeled.
Figure 3—figure supplement 1
Neuron-specific sequencing of Day 8 daf-2 and daf-16;daf-2 mutants.
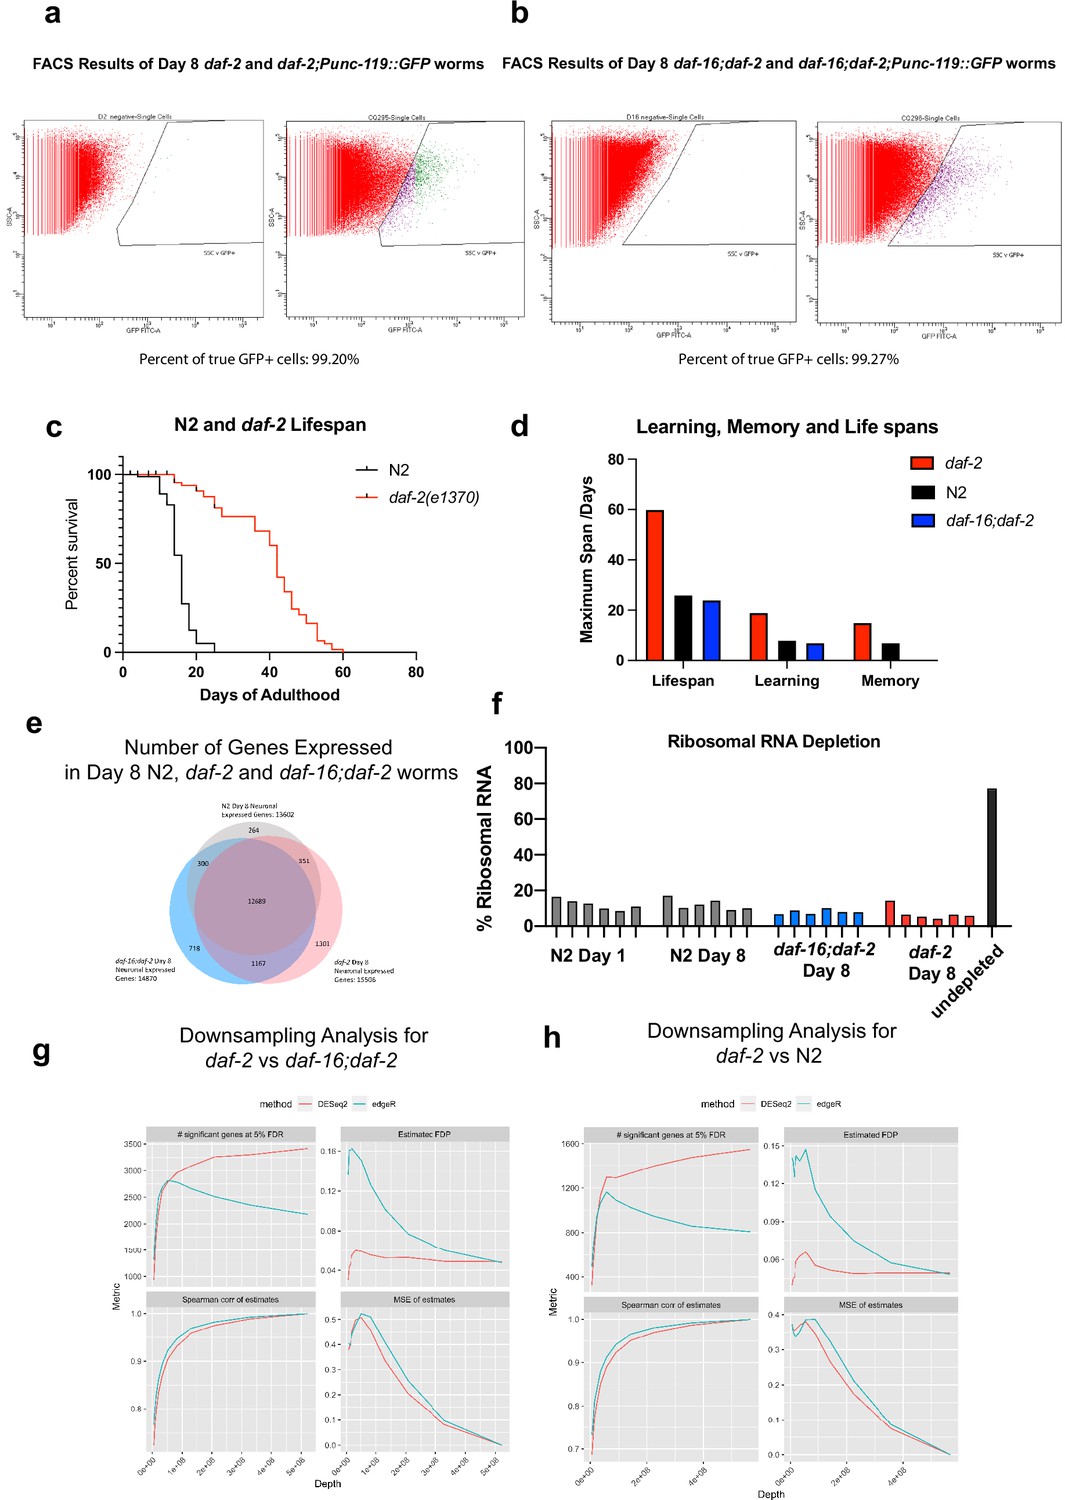
(a–b) FACS results of neuron isolation. Over 99% of the cells collected are GFP + neurons. 100,000 cells are collected for each biological replicate, six replicates for each genotype. (c) Representative image of N2 and daf-2 lifespan. (d) Number graph of lifespan, learning, and memory function. Related to Figure 4C and D. (e) Number of genes detected in Day 8 N2, daf-2, and daf-16;daf-2 neurons. (f) Ribosomal RNA depletion during sequencing. We used the library generation protocol with C. elegans-specific ribosomal RNA depletion kit (Tecan Genomics) successfully depleted rRNA to less than 20% of total reads. (g–h) Downsampling analysis for daf-2 vs daf-16;daf-2 and daf-2 vs N2. Both shows sufficient depth.
Figure 3—figure supplement 2
Whole-worm RNA-sequencing identifies changes in aged daf-2 mutants.
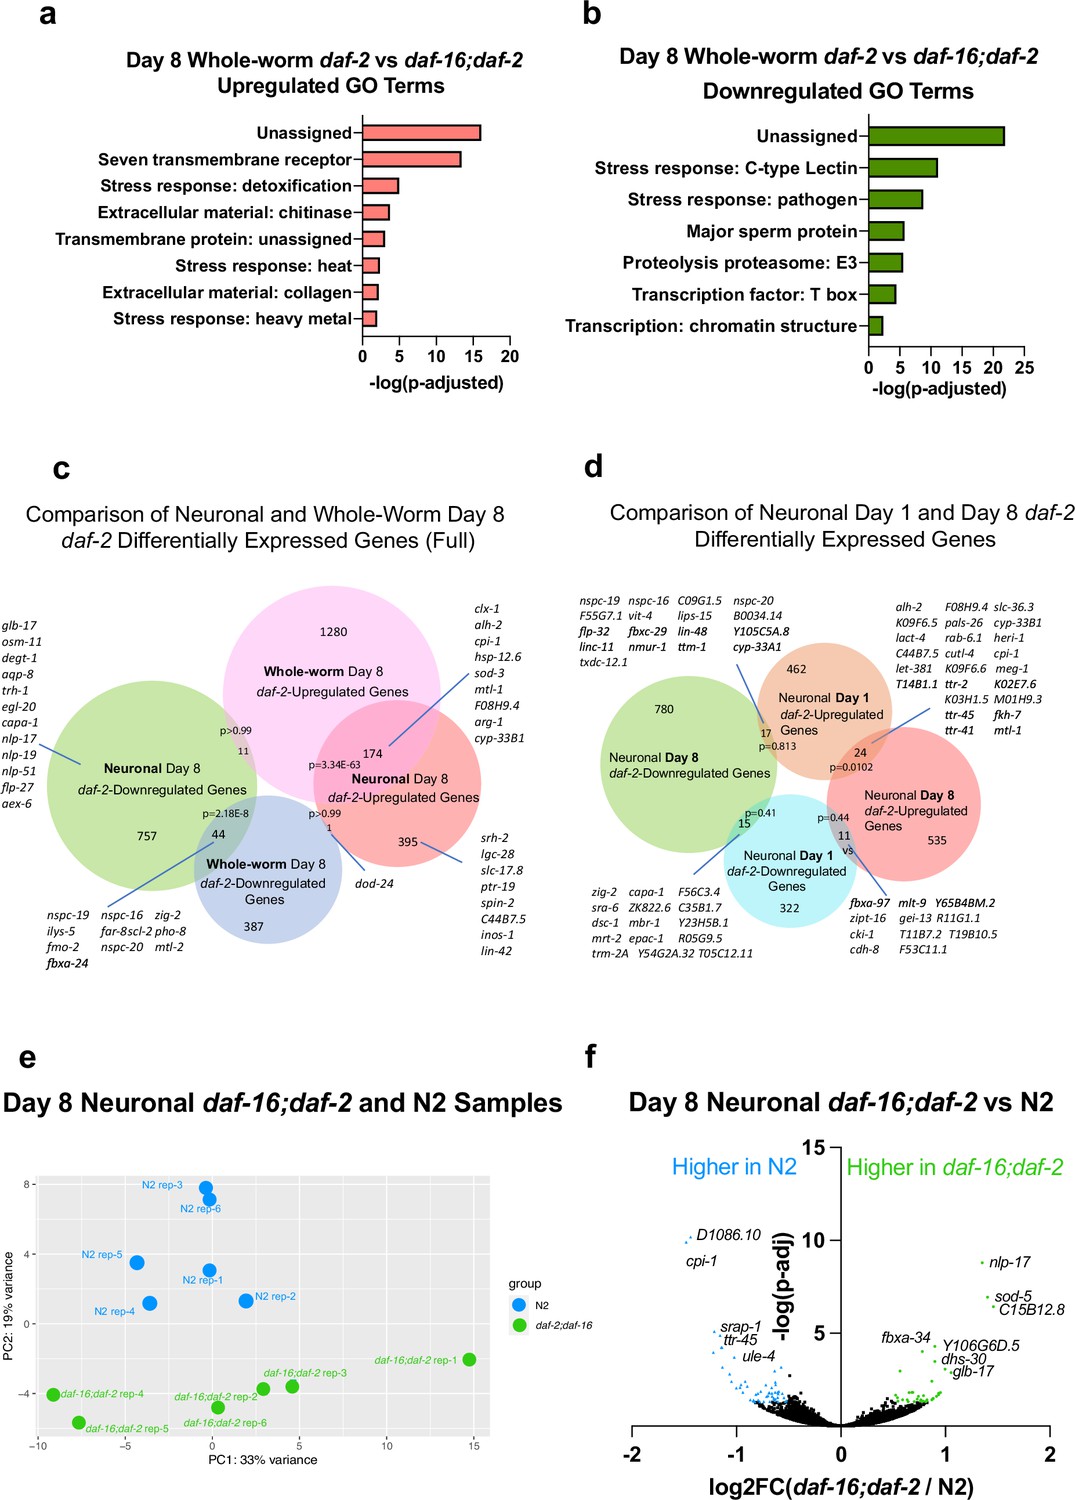
(a–b) Gene ontology (GO) term analysis of whole-worm daf-2-regulated genes shows enrichment in stress-resistant genes. (c) Comparison of neuronal and whole-worm Day 8 daf-2 differentially-expressed genes show high overlap (~30%), but also identify genes specific to neurons and to the whole body. Related to Figure 3h. (d) Comparison of neuronal Day 1 and Day 8 daf-2 differentially expressed genes identifies a set of consistent and sets of changed genes.
Figure 3—figure supplement 3
DAF-16-dependent and -independent daf-2-regulated genes show different features.
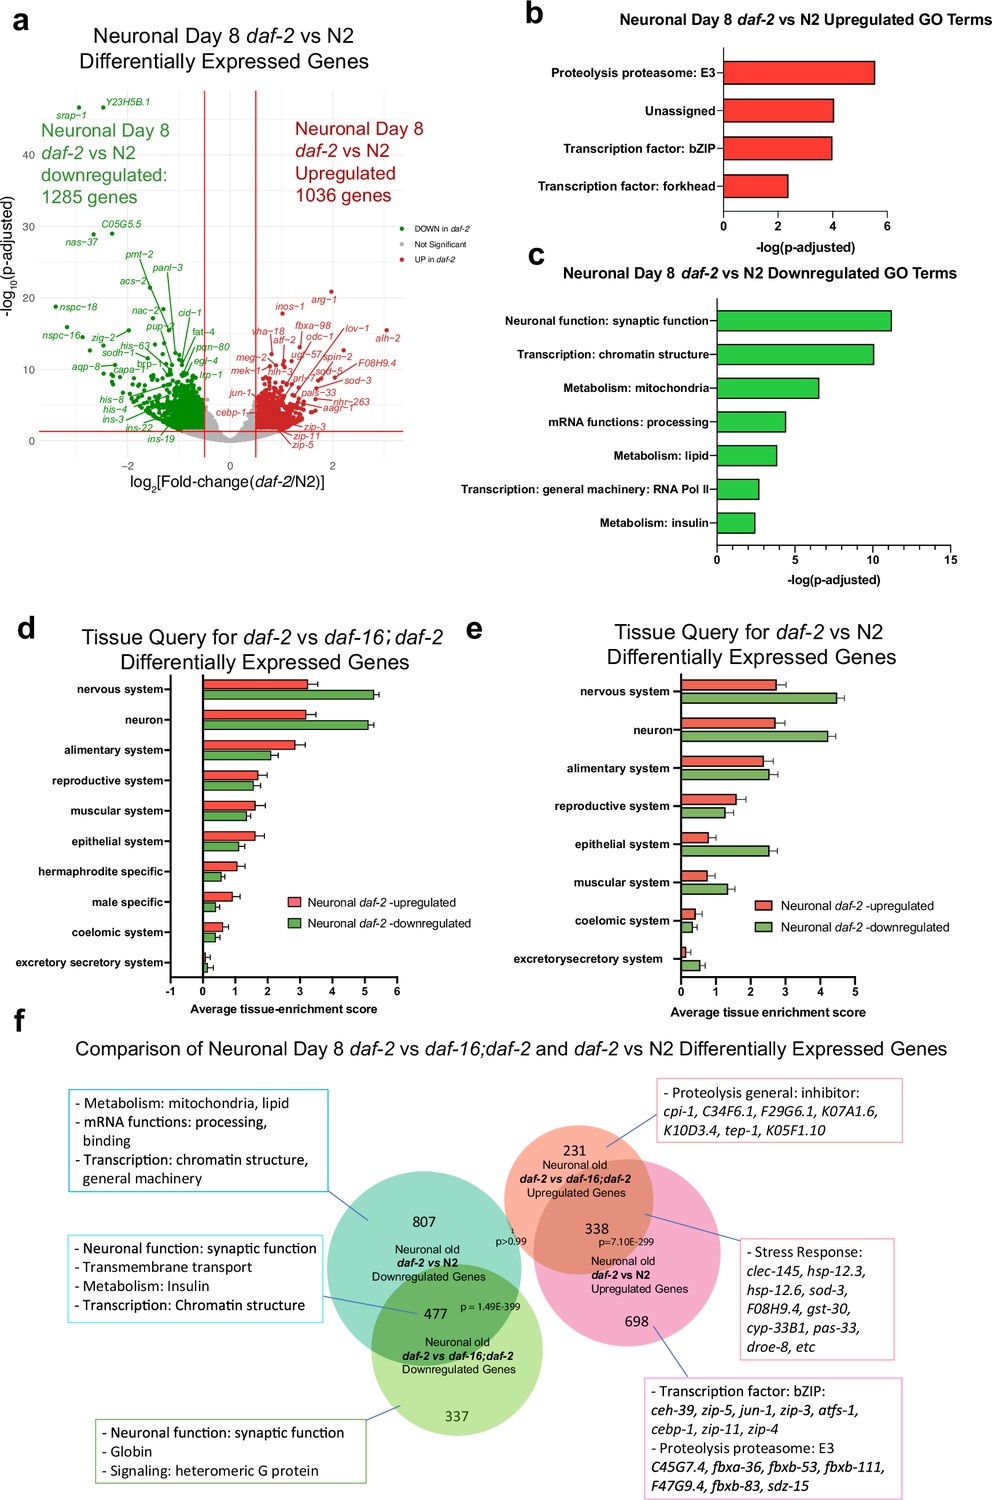
(a) Volcano plot of daf-2 vs N2 differentially expressed genes during aging. 1036 genes are more highly expressed in daf-2 mutants, 1285 genes are higher in N2 (log2[Fold-change(daf-2 vs N2)]>0.5, p-adjusted <0.05). (b–c) Neuronal Day 8 daf-2 vs N2 differentially expressed GO Terms. (d) Tissue query for daf-2 vs daf-16;daf-2 differentially expressed genes. (e) Tissue query for daf-2 vs N2 differentially expressed genes. (f) Full image of comparison of neuronal Day 8 daf-2 vs daf-16;daf-2 and daf-2 vs N2 differentially expressed genes. Related to Figure 5B.
Figure 4
Neuronal IIS/FOXO aging targets regulate memory decline with age in daf-2 worms.
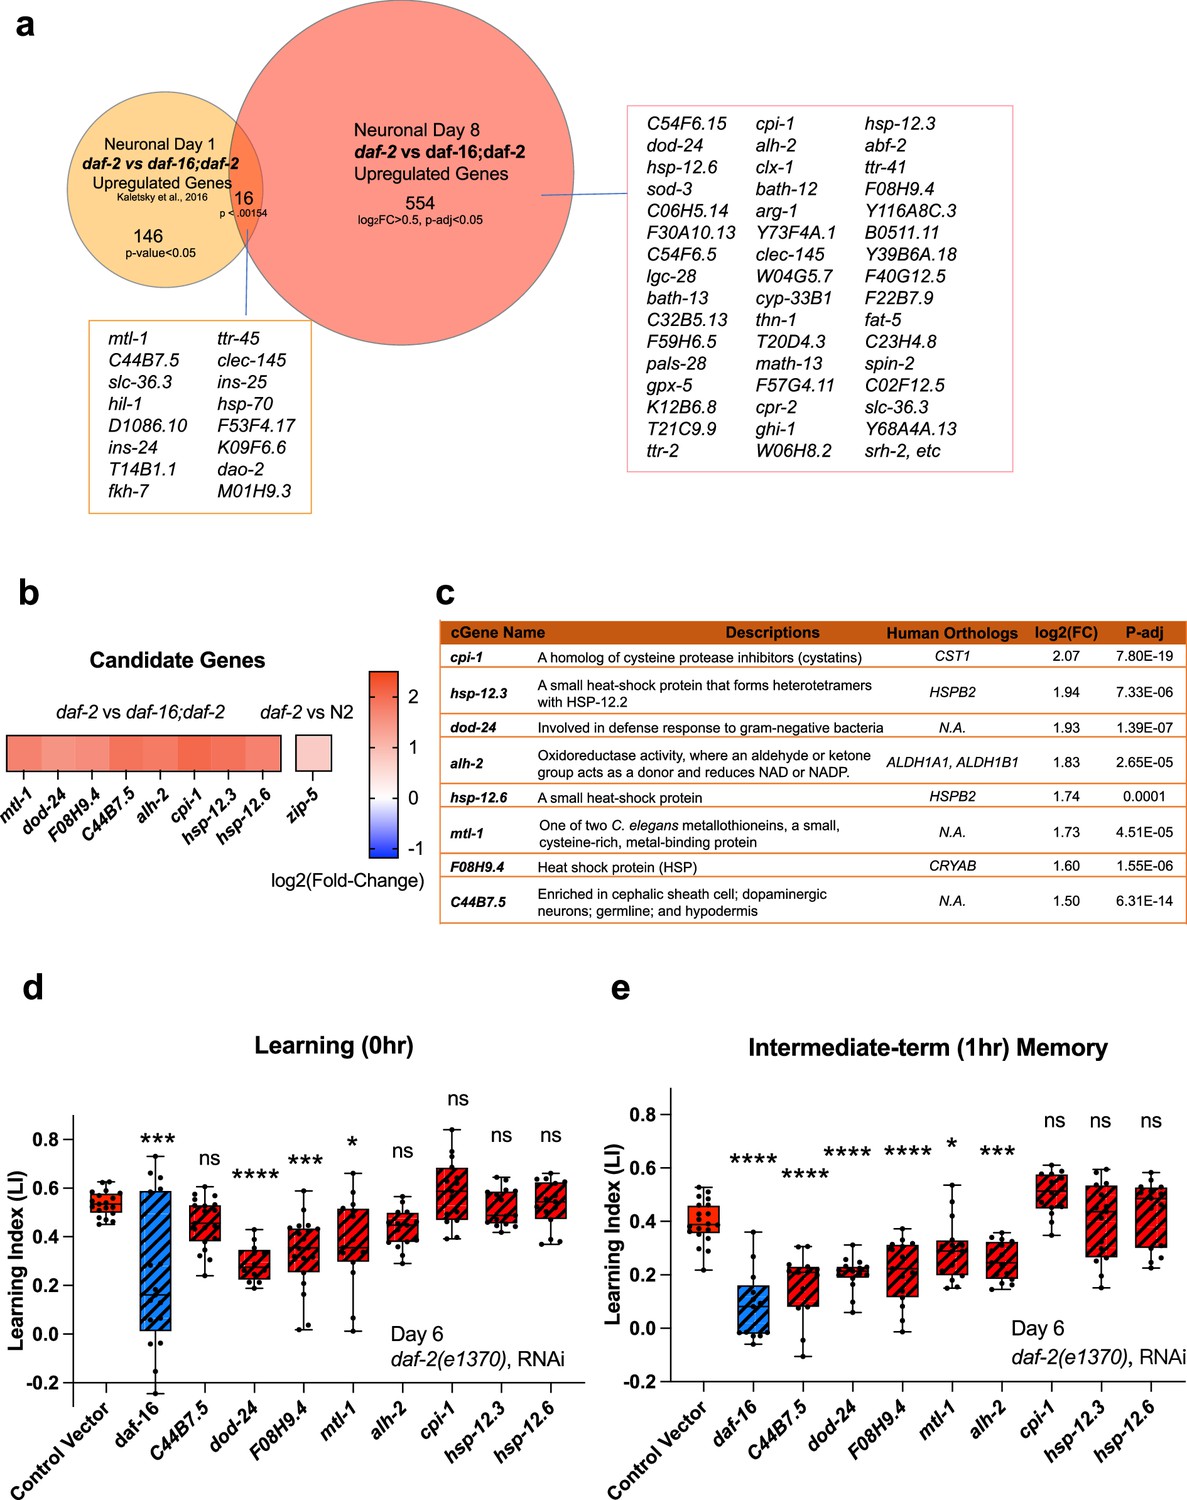
(a) Comparison of neuronal Day 1 and Day 8 daf-2 vs daf-16;daf-2 upregulated genes. All shared genes and top Day 8-specific daf-2 upregulated genes are labeled. (b) daf-2-regulated fold-change profile of candidate genes. All candidates are upregulated in daf-2 mutants. (c) Description of candidate genes. log2(Fold-change) and p-adjusted values from the daf-2 vs daf-16;daf-2 comparison unless stated otherwise. (d) Candidate gene knockdown effects on Day 6 adult daf-2 learning (0 hr after conditioning). Two candidate genes, dod-24 and F08H9.4, show a significant decrease in learning ability. N=5 plates in each condition, merged results of 3 biological repeats shown. (e) Candidate gene knockdown effects on Day 6 adult daf-2 short-term memory (1 hr after conditioning). C44B7.5, dod-24, F08H9.4, mtl-1, and alh-2 showed significant decreases in memory. n=5 plates in each condition, the representative image of three biological repeats shown. (d-e) RNAi was performed using a neuron-sensitized RNAi strain CQ745: daf-2(e1370) III; vIs69 [pCFJ90(Pmyo-2::mCherry +Punc-119::sid-1)] V.*p<0.05. **p<0.01. ***p<0.001. ****p<0.0001. One-way ANOVA with Dunnet’s post-hoc analysis. Box plots: center line, median; box range, 25-75th percentiles; whiskers denote minimum-maximum values.
Figure 5 with 1 supplement
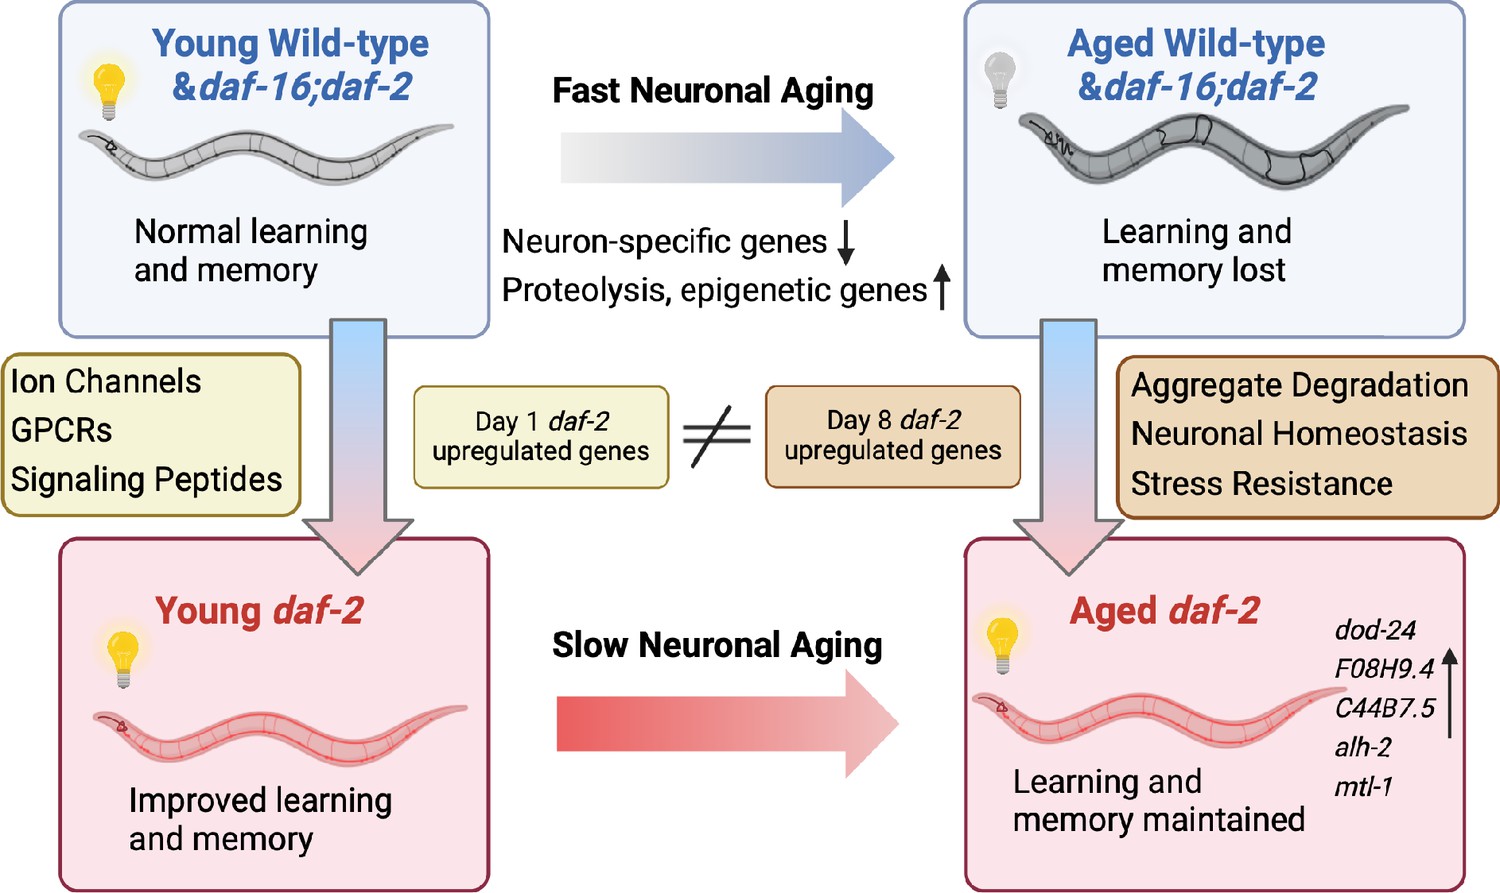
Aged daf-2 neurons upregulate neuroprotective genes to maintain improved cognitive behaviors.
During normal neuronal aging, neuron-specific genes decrease in expression, while proteolysis and epigenetic regulators are upregulated, resulting in neuron dysfunction and cognitive function loss. In aged daf-2 mutants, upregulation of neuroprotective genes including dod-24, F08H9.4, C44B7.5, alh-2, and mtl-1 contribute to daf-2’s improved cognitive function. The diagram was generated using Biorender, and published using a CC BY-NC-ND license with permission.
© 2024, BioRender Inc. Figure 5 was created using BioRender, and is published under a CC BY-NC-ND 4.0. Further reproductions must adhere to the terms of this license.
Figure 5—figure supplement 1
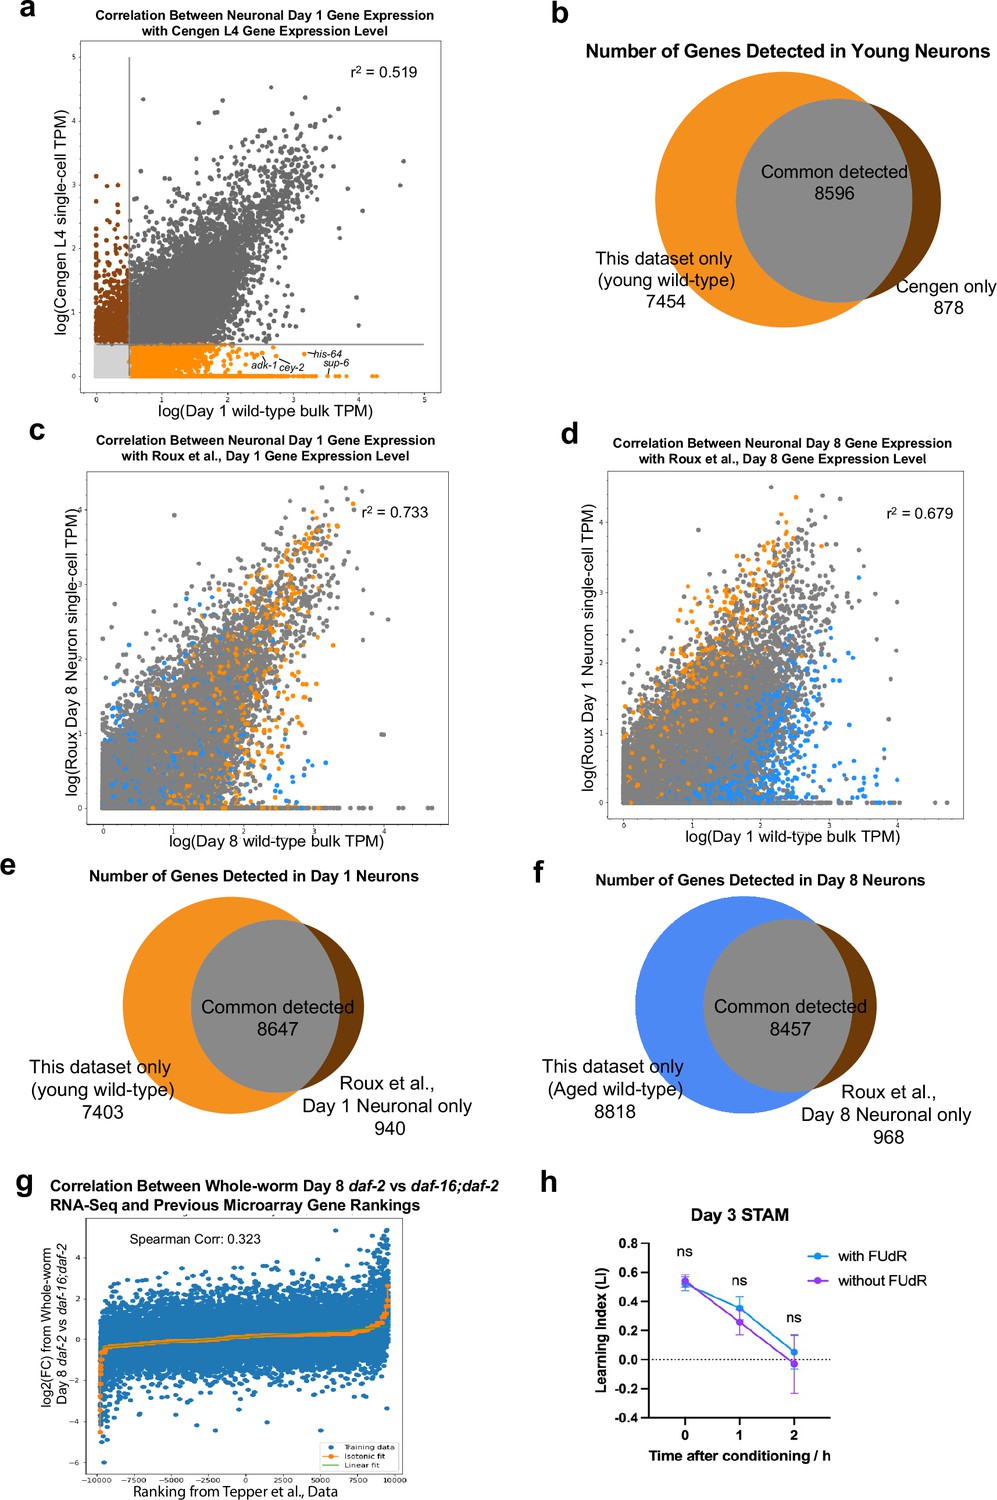
Comparison with recent sequencing datasets.
(a) Comparison with CeNGEN (L4 stage) gene expression data (Taylor et al., 2021) shows a high correlation, with many genes only detected in our isolated neuron bulk-sequencing dataset (orange; wild-type Day 1 neuron sequencing data used in the comparison). Genes with an average log2(TPM) >0.5 are considered detected. (b) Venn diagram showing genes detected in this dataset (orange), CeNGEN dataset (brown) and both (gray); only wild-type Day 1 neuron sequencing data were used in the comparison. (c–d) Comparison with gene expression data from the age-matched neuron cells from the Roux et al., dataset (Roux et al., 2023) shows a high correlation, with many genes only detected in our bulk-sequencing dataset. (e–f) Venn diagram showing genes detected in this dataset (orange or blue), Roux et al., dataset (brown) and both (gray). Only age-matched neuron cells from the Roux et al., dataset was used for gene expression analysis. (g) Correlation between our whole-worm Day 8 daf-2 and daf-16;daf-2 sequencing and Class I and Class II gene rank from Tepper et al., 2013. High correlation indicates consistency between our isolated neuron RNA-sequencing results with former microarray results, despite the differences in approaches and ages. (h) Short-term associative memory (STAM) with and without 5’-fluorodeoxyuridine (FUdR) shows that 3 Days on FUdR does not affect learning and memory ability.
Tables
Table 1
List of top daf-2 vs daf-16;daf-2 upregulated genes with orthologs that have neuroprotective functions.
| Gene name | Full name | log2(FC) | p-adj | Mammalian ortholog | Ortholog full name | Inferred function |
|---|---|---|---|---|---|---|
| Neuroprotective against Neurodegenerative Diseases | ||||||
| cpi-1 | Cysteine Protease Inhibitor 1 | 2.07 | 7.80E-19 | CST3 | Cystatin C | Protease inhibitor, suppresses AD pathology Gauthier et al., 2011 |
| alh-2 | ALdehyde deHydrogenase 2 | 1.83 | 2.65E-05 | ALDH1A1 | Aldehyde dehydrogenase 1 | Expressed in dopaminergic neurons. Regulates dopamine release in Parkinson’s Disease Carmichael et al., 2021 |
| ttr-41,45,2 | TransThyretin-Related family domain 41,45,2 | 1.68 | 3.98E-06 | Inhibits Aβ fibril formation, and suppresses the AD pathology Li et al., 2011 | ||
| cyp-33B1 | CYtochrome P450 family 33B1 | 1.34 | 2.04E-03 | CYP2J2 | Cytochrome P450 2J2 | Protective against Parkinson’s Disease through altered metabolism Li et al., 2018; Ferguson and Tyndale, 2011 |
| spin-2 | SPINster (Dm lysosomal permease) homolog 2 | 1.27 | 6.20E-04 | SPNS2 | Spinster homolog 2 | Sphingosine-1-phosphate Transporter, neuroprotective in AD Zhong et al., 2019 |
| gpx-5 | Glutathione PeroXidase 5 | 1.27 | 3.99E-04 | GPX3,5,6 | glutathione peroxidase 3,5,6 | Protects again lipid peroxidation, protects against neurodegeneration Lee et al., 2020; Hambright et al., 2017 |
| cpr-2 | Cysteine PRotease related 2 | 1.25 | 5.01E-03 | CTSB | Cathepsin B | Lysosomal Protease, Involved in Aβ and APP protein degradation Cermak et al., 2016 |
| djr-1.2 | DJ-1 (mammalian transcript’l regulator) Related 1.2 | 1.09 | 3.90E-03 | PARK7 | Parkinsonism associated deglycase | Neuroprotective against Parkinson’s Disease; Prevents accumulation of harmful metabolites Heremans et al., 2022 |
| Synaptic Organization Maintenance | ||||||
| dod-24 | Downstream Of DAF-16 (regulated by DAF-16) 24 | 1.93 | 1.39E-07 | Cub-like Domain Containing Protein | Clustering of neurotransmitter receptor proteins González-Calvo et al., 2022 | |
| ptr-19,15 | PaTched Related family 19,15 | 1.21 | 1.72E-05 | PTCHD1,3,4 | Patched domain-containing 1,3,4 | Synaptic organization, autism risk factor Ung et al., 2018; Pastore et al., 2022 |
| hbl-1 | HunchBack Like (fly gap gene-related) 1 | 1.16 | 6.47E-06 | hb | Hunchback (fly) | Regulate synapse number and locomotor circuit function Lee et al., 2022 |
| cutl-4 | CUTiclin-Like 4 | 1.08 | 2.74E-02 | pio | Piopio (fly) | ECM protein for axonal growth and synapse formation Broadie et al., 2011 |
| lron-2 | eLRR (extracellular Leucine-Rich Repeat) ONly 2 | 1.06 | 8.70E-05 | LGI1,2 | Leucine-Rich Glioma Inactivated protein 1 | Modulation of trans-synaptic proteins. Protection against seizure Fels et al., 2021 |
| Neuronal Homeostasis Maintenance | ||||||
| mocs-1 | MOlybdenum Cofactor Sulfurase 1 | 1.05 | 1.17E-04 | MOCOS | Molybdenum cofactor sulfurase | Regulation of redox homeostasis and synaptogenesis. Down in ASD Rontani et al., 2021 |
| plep-1 | PLugged Excretory Pore 1 | 1.12 | 2.92E-03 | MFSD11 | Major facilitator superfamily domain 11 | Putative SLC solute carrier protein, involved in brain energy homeostasis Perland et al., 2016 |
| cky-1 | CKY homolog 1 | 1.08 | 1.58E-04 | NPAS4 | Neuronal PAS Domain Protein 4 | Calcium-dependent transcription factor, neuronal homeostasis maintenance Fu et al., 2020; Shan et al., 2018 |
| Neuronal Injury Repair facilitation | ||||||
| F08H9.4, hsp-12.3,12.6 | small HSP domain-containing protein | 1.94 | 7.33E-06 | HSPB2 | Heat-shock Protein Beta 2 | Facilitates PNS injury regeneration, suppresses inflammation Huang et al., 2023 |
| sod-3 | SOD superoxide dismutase 3 | 1.66 | 3.05E-09 | SOD2 | superoxide dismutase2 | Converts superoxide to the less reactive hydrogen peroxide (H2O2). Protects neurons from injury. Flynn and Melov, 2013 |
| Normal Neuronal Activity Maintenance | ||||||
| lgc-28 | Ligand-Gated ion Channel 28 | 1.38 | 7.29E-04 | CHRNA6,3 | Neuronal acetylcholine receptor subunit alpha-6,3 | Nicotinic receptor. Regulates cognitive functions and addiction Koukouli and Changeux, 2020; Zeiger et al., 2008 |
| F22B7.9 | 1.33 | 8.91E-15 | METTL23 | methyltransferase like 23 | Interacts with GABPA; disruption causes intellectual disability Bernkopf et al., 2014; Reiff et al., 2014 | |
| fat-5 | FATty acid desaturase 5 | 1.31 | 3.40E-03 | SCD5 | StearoylCoA Desaturase-5 | Neuronal Cell Proliferation and Differentiation Sinner et al., 2012 |
| slc-36.3 | SLC (SoLute Carrier) homolog 36.3 | 1.25 | 2.88E-03 | SLC36A4 | Solute Carrier Family36 Member4 | amino acid transporter, transports Trp, involved in kynurenic acid pathway Lautrup et al., 2019 |
| lin-42 | abnormal cell LINeage 42 | 1.15 | 1.66E-04 | PER1,2 | Period 1,2 | Phosphorylates CREB, modulates CREB-mediated memory consolidation Smies et al., 2022 |
| ctsa-1.1 | CaThepSin A homolog 1.1 | 1.07 | 4.97E-05 | CTSA | Lysosomal Ser carboxy-peptidase Cathepsin A | Involved in normal neuronal development De Pasquale et al., 2020; Hsu et al., 2018; |
| gsnl-1 | GelSoliN-Like 1 | 1.06 | 2.93E-04 | AVIL | advillin | Facilitates somatosensory neuron axon regeneration Chuang et al., 2018 |
Additional files
-
Supplementary file 1
Whole-worm DEseq2 results.
- https://cdn.elifesciences.org/articles/95621/elife-95621-supp1-v1.xlsx
-
Supplementary file 2
Neuronal WT Day 1 vs Day 8 DEseq2.
- https://cdn.elifesciences.org/articles/95621/elife-95621-supp2-v1.xlsx
-
Supplementary file 3
Neuronal Day 8 daf-2 vs daf-16;daf-2 DEseq2.
- https://cdn.elifesciences.org/articles/95621/elife-95621-supp3-v1.xlsx
-
Supplementary file 4
Neuronal Day 8 daf-2 vs N2 DEseq2.
- https://cdn.elifesciences.org/articles/95621/elife-95621-supp4-v1.xlsx
-
Supplementary file 5
Neuronal Day 8 daf-16;daf-2 vs N2 DEseq2.
- https://cdn.elifesciences.org/articles/95621/elife-95621-supp5-v1.xlsx
-
Supplementary file 6
Number of sequencing reads.
- https://cdn.elifesciences.org/articles/95621/elife-95621-supp6-v1.xlsx
-
Supplementary file 7
Raw behavioral data.
- https://cdn.elifesciences.org/articles/95621/elife-95621-supp7-v1.xlsx
-
MDAR checklist
- https://cdn.elifesciences.org/articles/95621/elife-95621-mdarchecklist1-v1.pdf
Download links
A two-part list of links to download the article, or parts of the article, in various formats.
Downloads (link to download the article as PDF)
Open citations (links to open the citations from this article in various online reference manager services)
Cite this article (links to download the citations from this article in formats compatible with various reference manager tools)
The neuron-specific IIS/FOXO transcriptome in aged animals reveals regulatory mechanisms of cognitive aging
eLife 13:RP95621.
https://doi.org/10.7554/eLife.95621.4


