A single-cell atlas of the miracidium larva of Schistosoma mansoni reveals cell types, developmental pathways, and tissue architecture
- Wellcome Sanger Institute, Wellcome Genome Campus, United Kingdom
- School of Infection and Immunity, College of Medical, Veterinary & Life Sciences, University of Glasgow, United Kingdom
- Josephine Bay Paul Center, Marine Biological Laboratory, United States
- School of Biodiversity, One Health and Veterinary Medicine, College of Medical, Veterinary & Life Sciences, University of Glasgow, United Kingdom
- Department of Life Sciences, Aberystwyth University, United Kingdom
Figures
Figure 1 with 1 supplement
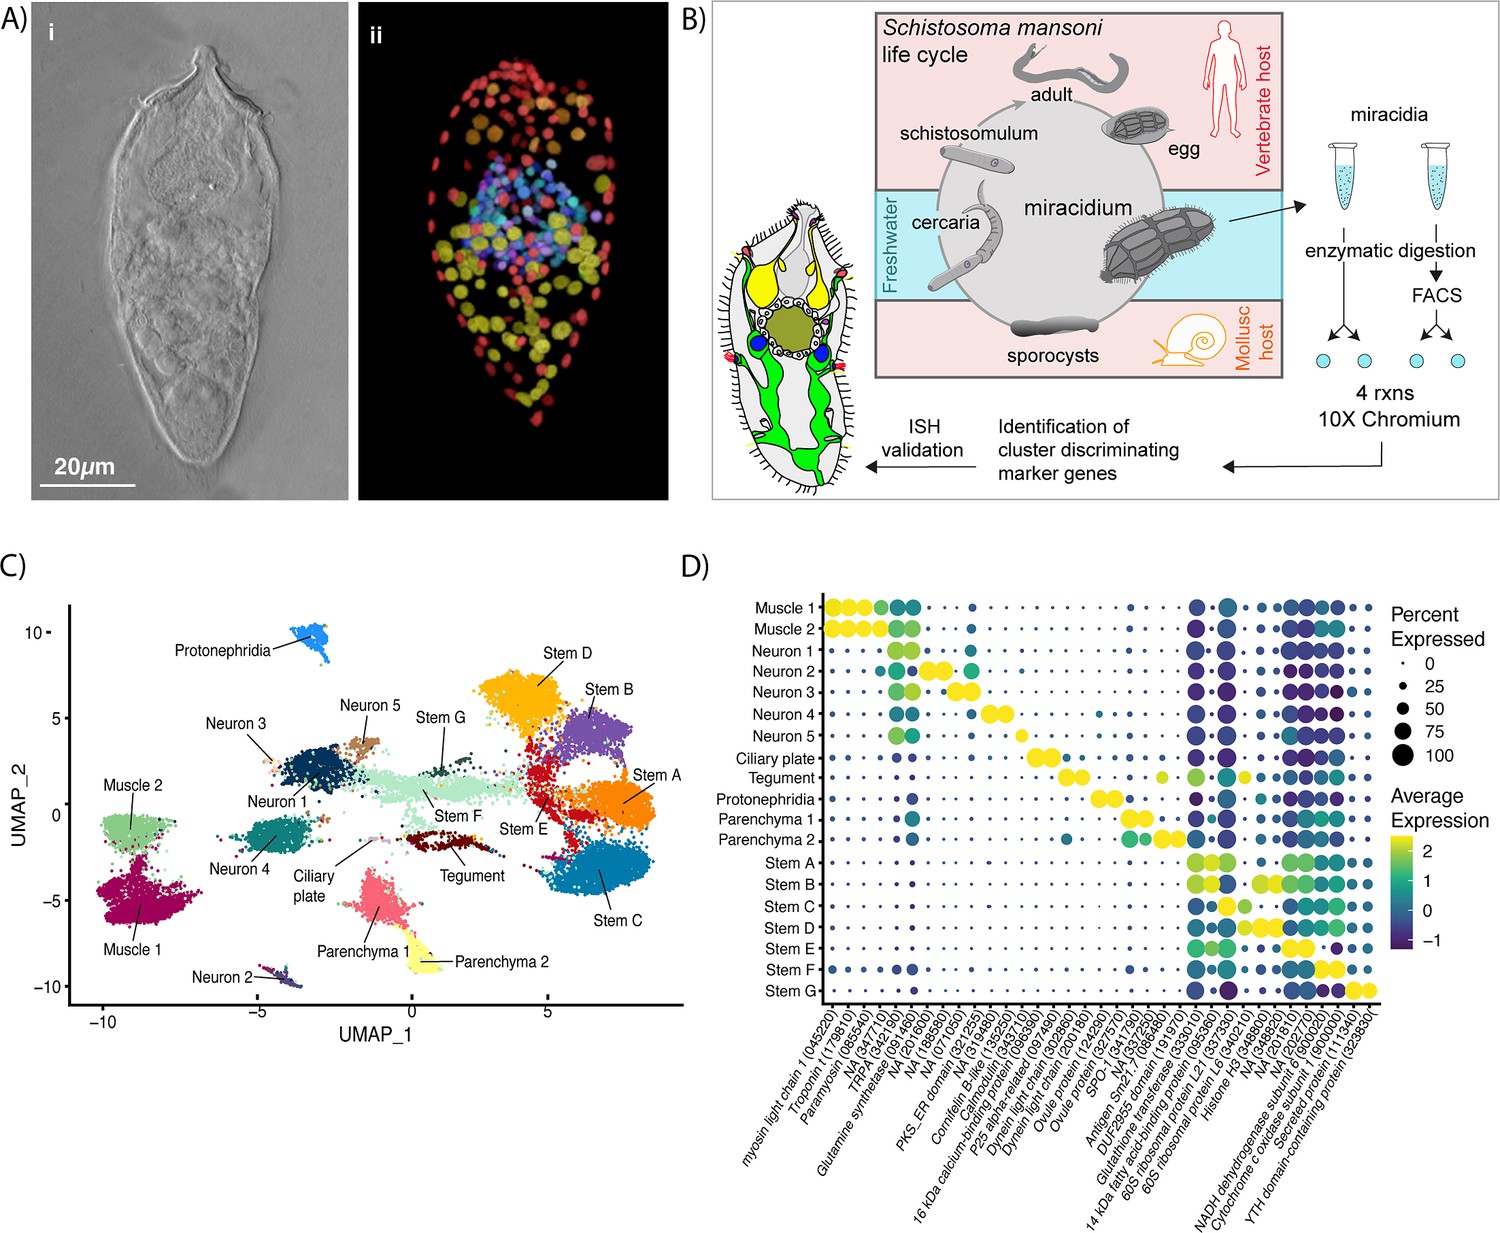
Identification of 19 transcriptionally distinct cell types in the miracidium.
(A) The miracidium is composed of ~365 cells; (i) differential interference contrast (DIC) microscopy image of miracidium, (ii) a maximum intensity projection (MIP) of a confocal z-stack of miracidium, stained with 4′,6-diamidino-2-phenylindole (DAPI), and with nuclei segmented to enable counting (larval anterior pole at the top in all images). (B) Experimental scheme describing the parasite’s life cycle (images of developmental stages not to scale), parasite dissociation, single-cell analysis of miracidium, and validation pipeline. An average of 9975 miracidia per sample were dissociated; two samples were enriched for live cells (propidium iodide negative) using fluorescence-activated cell sorting (FACS), another two samples were unsorted. Cells were loaded according to the 10X Chromium single-cell 3′ protocol. Clustering was carried out to identify distinct populations and population-specific markers. Validation of population-specific markers was performed by in situ hybridisation (ISH). (C) Uniform Manifold Approximation and Projection (UMAP) representation of 20,478 miracidium single cells. Cell clusters are coloured and distinctively labelled by cluster identity. (D) Gene expression profiles of the top population markers identified for each cell cluster (gene identifiers shown in parenthesis but with ‘Smp_’ prefix removed for brevity). The colours represent the expression level from yellow (high expression) to dark blue (low expression). Gene expression has been log-normalised and scaled using Seurat(v. 4.3.0). The sizes of the circles represent the percentages of cells in those clusters that expressed a specific gene.
Figure 1—figure supplement 1
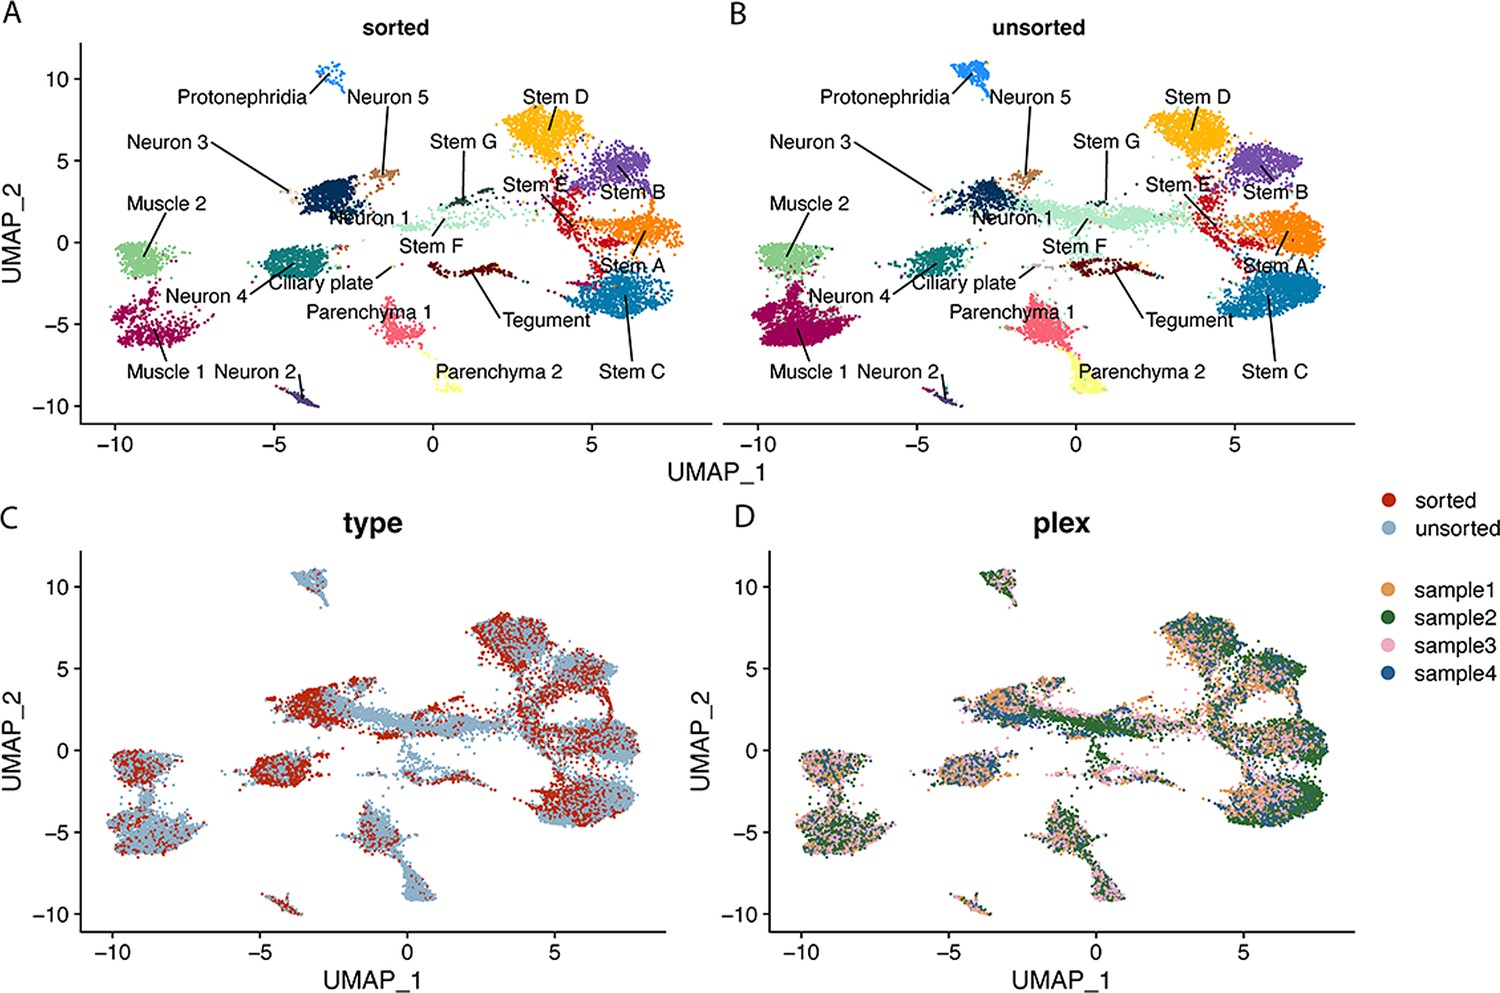
Contributions of sorted and unsorted cells to Seurat clusters.
This figure uses the same UMAP topology as presented in Figure 1C. (A) Shows contribution of sorted cells to labelled clusters, (B) shows contribution of unsorted cells to labelled clusters. (C) UMAP where cells are coloured by sorted and unsorted treatment. (D) UMAP where cells are coloured by sample of origin (samples 1 and 4 are sorted, samples 2 and 3 are unsorted).
Figure 2 with 5 supplements
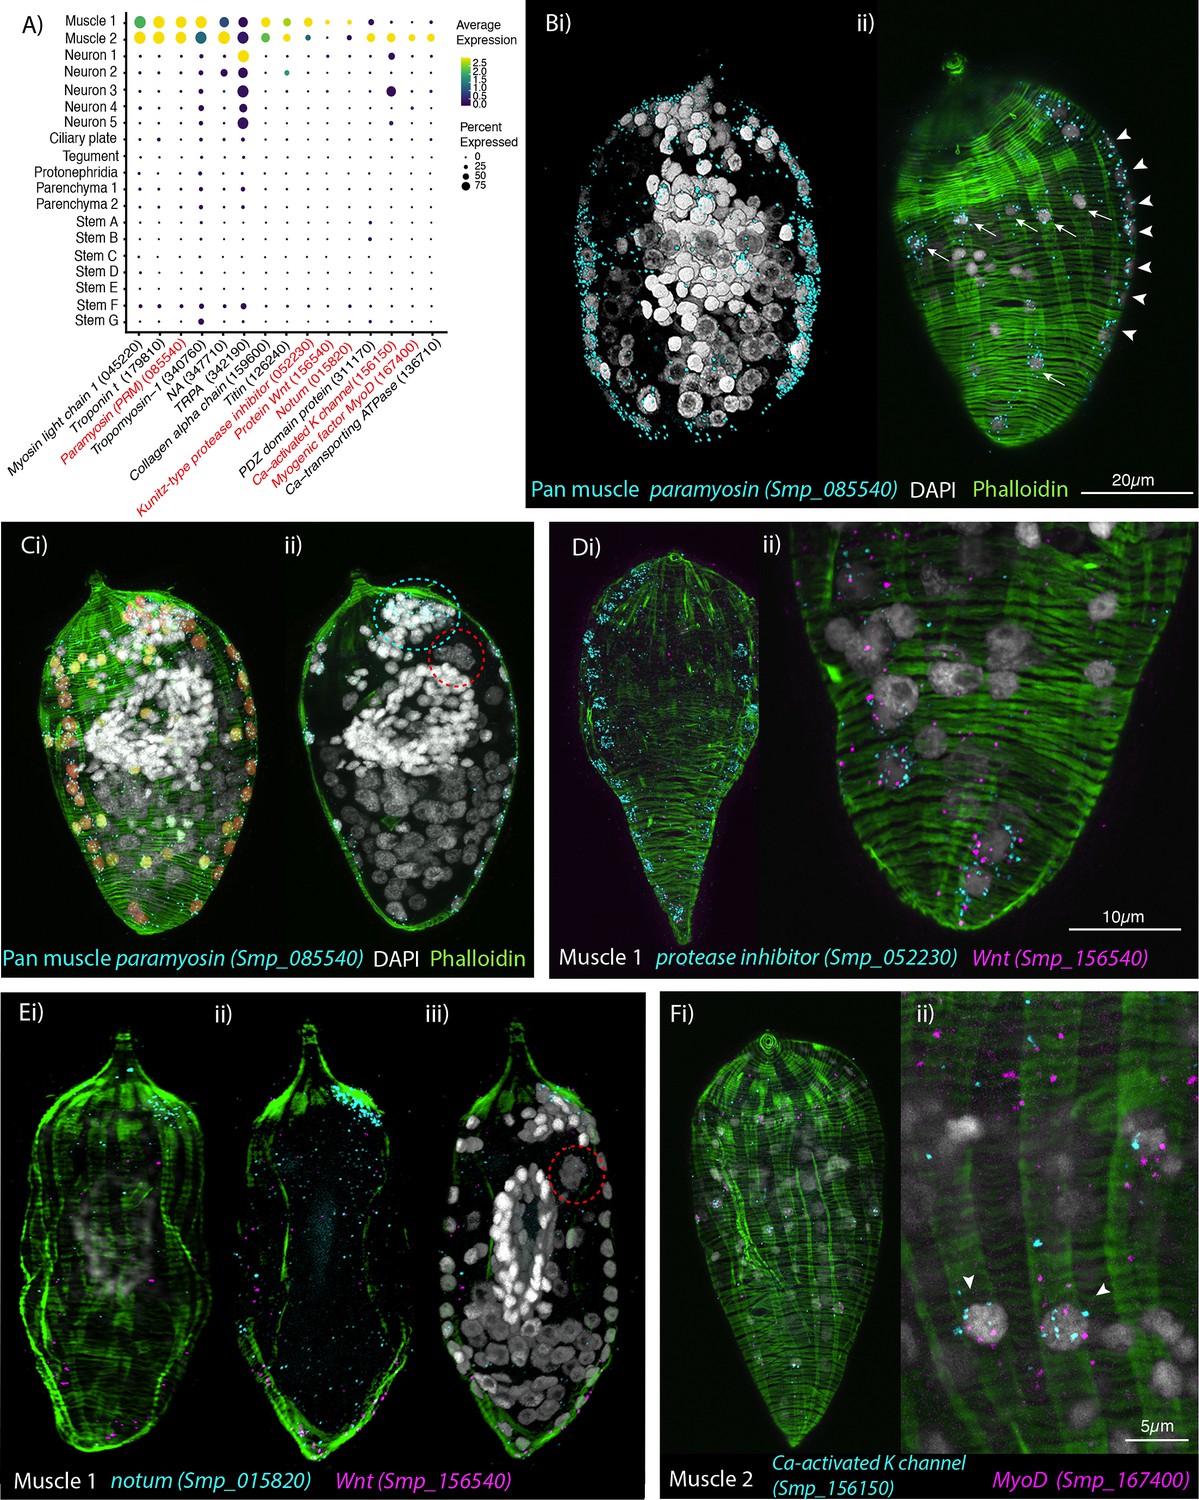
Orthogonal body wall muscles (BWMs) are transcriptionally distinct.
(A) Dot plot depicting the expression profiles of specific or enriched marker genes in the two muscle clusters. Genes validated by in situ hybridisation (ISH) are marked in red. Gene identifiers shown in parenthesis but with ‘Smp_’ prefix removed for brevity. Gene expression has been log-normalised and scaled using Seurat(v. 4.3.0). (B, i, ii) Wholemount ISH (WISH) of paramyosin PRM+ and counterstaining with phalloidin reveals the nuclei of the circular BWMs, which form two distinct bilaterally symmetrical lines that run peripherally from the pole of the larva to the other (arrowheads in ii). The longitudinal BWM nuclei (ii – arrows) are spaced regularly between the lines of the circular BWM nuclei and their actin fibres run orthogonally to the circular muscles. These patterns were seen in 100% of individuals examined, n = 50. (C, i) Segmentation of the PRM+ cells in one miracidium shows 74 muscle cells in total: ~28 circular (segmented in orange), 33 longitudinal (yellow), and (ii) 13 in an anterior unilateral cluster (inside dashed cyan line) adjacent to the apical gland cell (identifiable by its four nuclei, inside dashed red circle). (D) Expression of markers for muscle 1 cluster; (i) Kunitz-type protease inhibitor is expressed in circular BWM and wnt-11-1 is expressed in seven Kunitz-type protease inhibitor+ cells at the posterior pole; (ii) close-up of posterior end of another miracidium showing the co-expression of Kunitz-type protease inhibitor and wnt-11-1. In 100% of individuals examined, n = 30. (E, i–iii) Notum, an inhibitor of wnt signalling, is expressed highly at the opposite pole to wnt-11-1 in the cluster of 13 muscle nuclei adjacent to the apical gland cell (nuclei in dashed red circle). In 100% of individuals examined, n = 30. (F) Expression of markers for muscle 2 cluster; a calcium-activated potassium channel (Smp_156150) and the transcription factor myoD (Smp_167400) show co-expression in longitudinal BWMs (arrowheads). In 100% of individuals examined, n = 30. Scale shown in B also applies to C, Di, E, and Fi.
Figure 2—video 1
Confocal z-stack of wholemount in situ hybridisation (WISH) of pan-muscle marker paramyosin (PRM Smp_085540) (cyan), counterstained with phalloidin (green), and DAPI (white), reveals which PRM+ nuclei belong to the circular and longitudinal body wall muscles.
Scale bar = 10 μm.
Figure 2—video 2
Segmentation of paramyosin (Smp_085540) (cyan) positive cells; the nuclei of the circular body wall muscles are highlighted in orange, the nuclei of the longitudinal body wall muscles are highlighted in yellow.
Scale bar = 10 μm.
Figure 2—video 3
Confocal z-stack of wholemount in situ hybridisation (WISH) of muscle cluster 1 markers Kunitz-type protease inhibitor (Smp_052230) (cyan) and Wnt-11-1 (Smp_156540) (magenta), counterstained with phalloidin (green), and DAPI (white) shows expression in circular body wall muscles.
Scale bar = 10 μm.
Figure 2—video 4
Maximum intensity projection from confocal z-stack of wholemount in situ hybridisation (WISH) of muscle cluster 1 markers notum (Smp_015820) (cyan) and Wnt-11-1 (Smp_156540) (magenta) counterstained with phalloidin (green) showing expression at opposite poles.
Scale bar = 10 μm.
Figure 2—video 5
Confocal z-stack of wholemount in situ hybridisation (WISH) of muscle cluster 2 markers calcium-activated potassium channel (Smp_156150) (cyan) and myoD (Smp_167400) (magenta), counterstained with phalloidin (green) and DAPI (white) shows expression in longitudinal body wall muscles.
Scale bar = 10 μm.
Figure 3 with 12 supplements
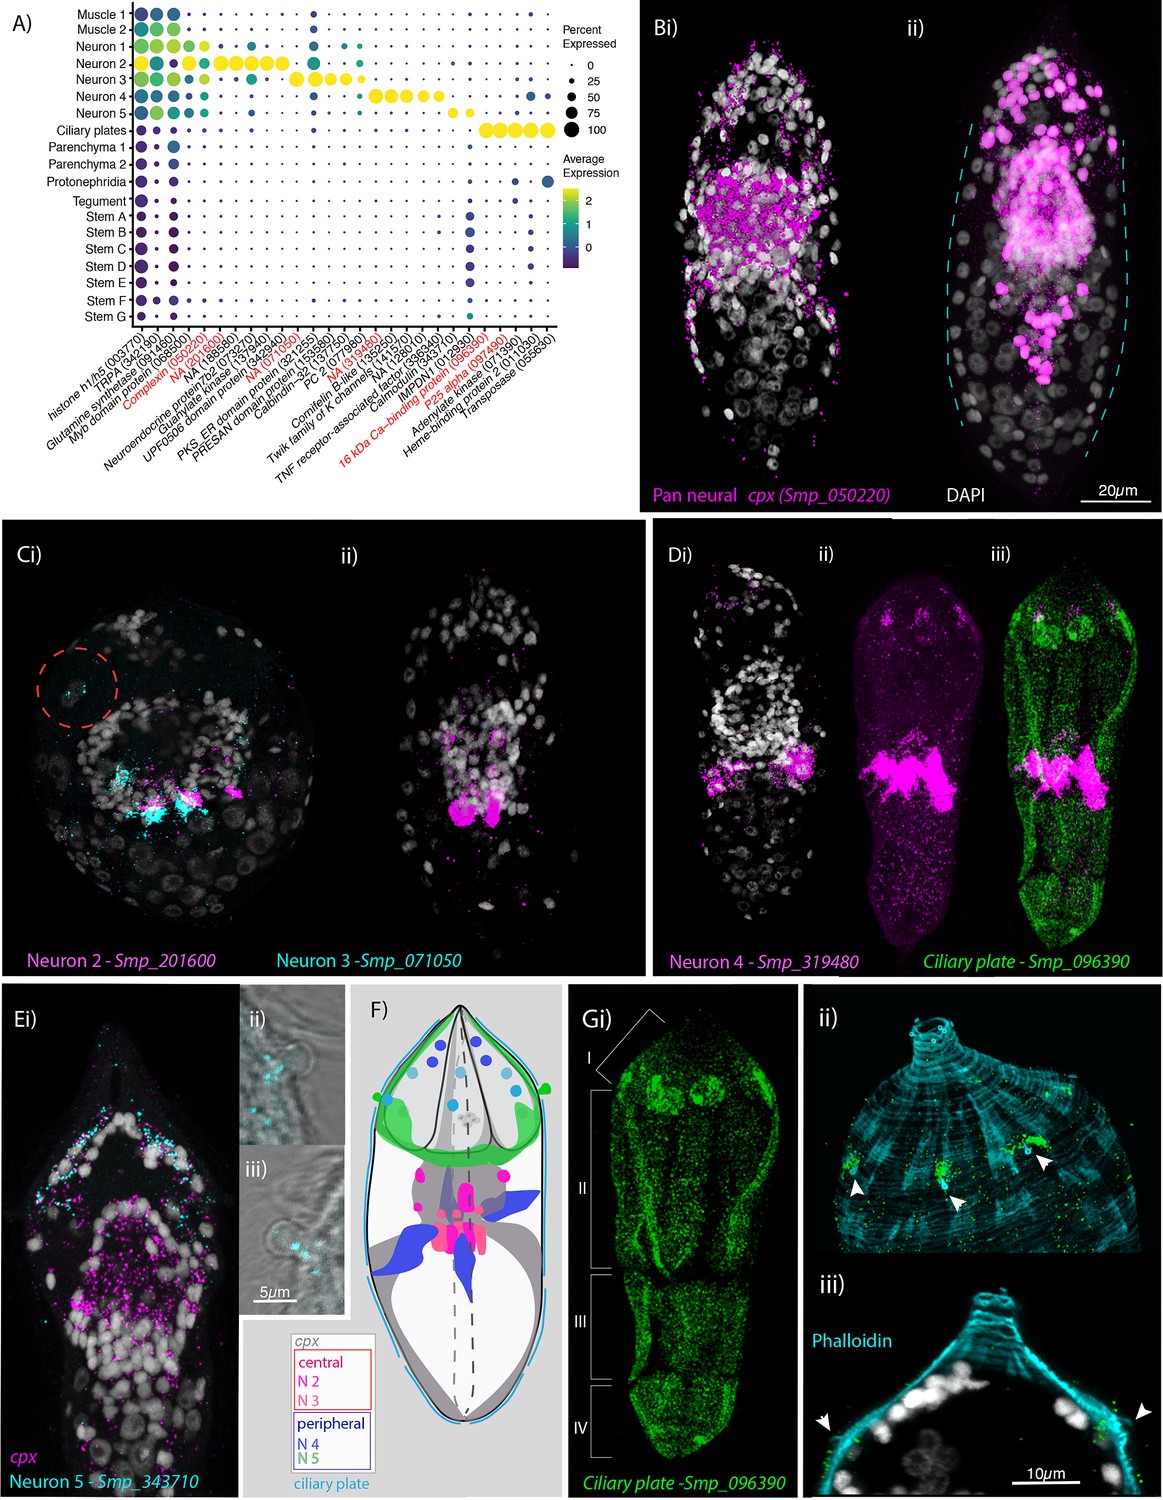
Neural complexity and ciliary plates in a simple larva.
(A) Expression profiles of cell marker genes that are specific or enriched in the five neuronal clusters and ciliary plates. Genes validated by in situ hybridisation (ISH) are marked in red. Gene identifiers shown in parenthesis but with ‘Smp_’ prefix removed for brevity. Gene expression has been log-normalised and scaled using Seurat(v. 4.3.0). Complexin (cpx) is expressed in all five nerve clusters and is a neural marker in the adult (Wendt et al., 2020). (B, i) A dorso-ventral view of wholemount in situ hybridisation (WISH) of cpx shows expression in the brain, to the anterior – with projections around the three gland cells, and in two posterior clusters (100% of individuals examined, n = 50). (ii) Segmentation of cpx+ cells (in magenta) in one miracidium (lateral view) reveals that at least 209 of the 365 cells that make up the larva are neural and that the clusters of cpx cells that are located posterior to the brain, and send projections to the posterior pole, sit perpendicular to the circular muscle cell nuclei (blue dashed lines). (C) Multiplexed ISH for top markers for neuron 2 (NPP 43, Smp_201600) and neuron 3 (NPP 26, Smp_071050) shows expression in multiple cells of the brain, including cells adjacent to each other. NPP 26 (Smp_071050) is also expressed in the apical gland cell (red dashed circle). 100% of individuals examined, n = 30. (D) The top marker for neuron 4, Smp_319480, is expressed in four cells anteriorly (arrows) and ~22 that sit lateral and just posterior to the brain; these later cells send projections into the brain and out to the body wall at the latitude between the second and third tiers of ciliary plates (iii) seen here expressing the ciliary plate marker gene Smp_096390. 100% of individuals examined, n > 30. (E) Neuron 5 marker Smp_343710, an EF-hand domain-containing protein, is expressed in (i) 10–20 cells whose nuclei sit outside of, and anterior to, the brain, in and around the paired lateral glands and their secretory ducts, and (Eii, iii, F) in a pair of bilaterally symmetrical bulbous protrusions. 100% of individuals examined, n = 30. (F) Summary schematic of the in situ expression of marker genes for the neural cell clusters. (G, i) A top marker for ciliary plates, a calcium-binding protein (Smp_096390), shows transcripts expressed in all the ciliary plates of all four tiers (brackets) and in six cells towards the anterior pole. (ii, iii) Counterstaining with phalloidin shows that the nuclei of these anterior cells sit beneath the body wall muscle and send a projection externally between the first and second tiers of ciliary plates (arrowheads). 100% of individuals examined, n > 30. Scale shown in B also applies to C, D, Ei, and Gi.
Figure 3—figure supplement 1
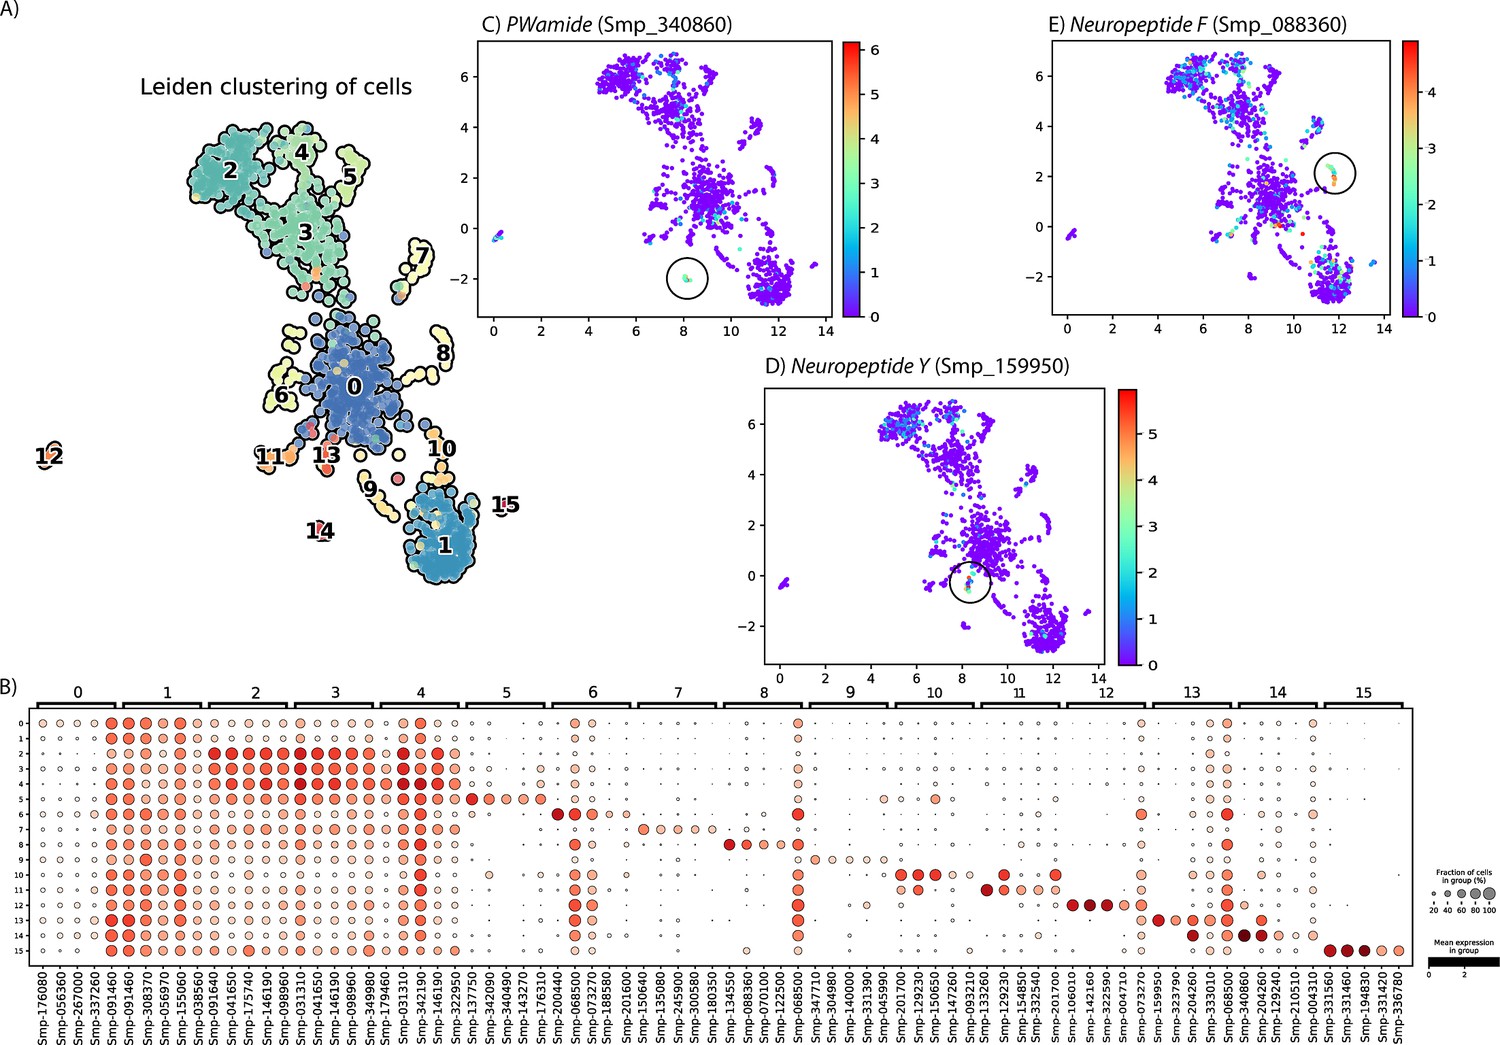
Subclustering the Neuron 1 cluster using self-assembling manifold (SAM) revealed multiple distinct subpopulations.
(A) The Neuron 1 cluster was analysed using SAM algorithm, and Leiden clustering indicated 16 subpopulations. Library size was normalised and gene expression values were log-normalised using SAM (v1.0.1) and Scanpy (v1.8.2). (B) The top 5 marker genes for each of the subpopulations. (C) Expression of NPP PWamide, the top marker for subcluster 14. (D) Expression of neuropeptide Y, the top marker for subcluster 13. (E) Expression of neuropeptide F, the second top marker for subcluster 8. Although this cluster was difficult to define, this analysis suggests that there may be several small neural subpopulations within this cluster.
Figure 3—figure supplement 2
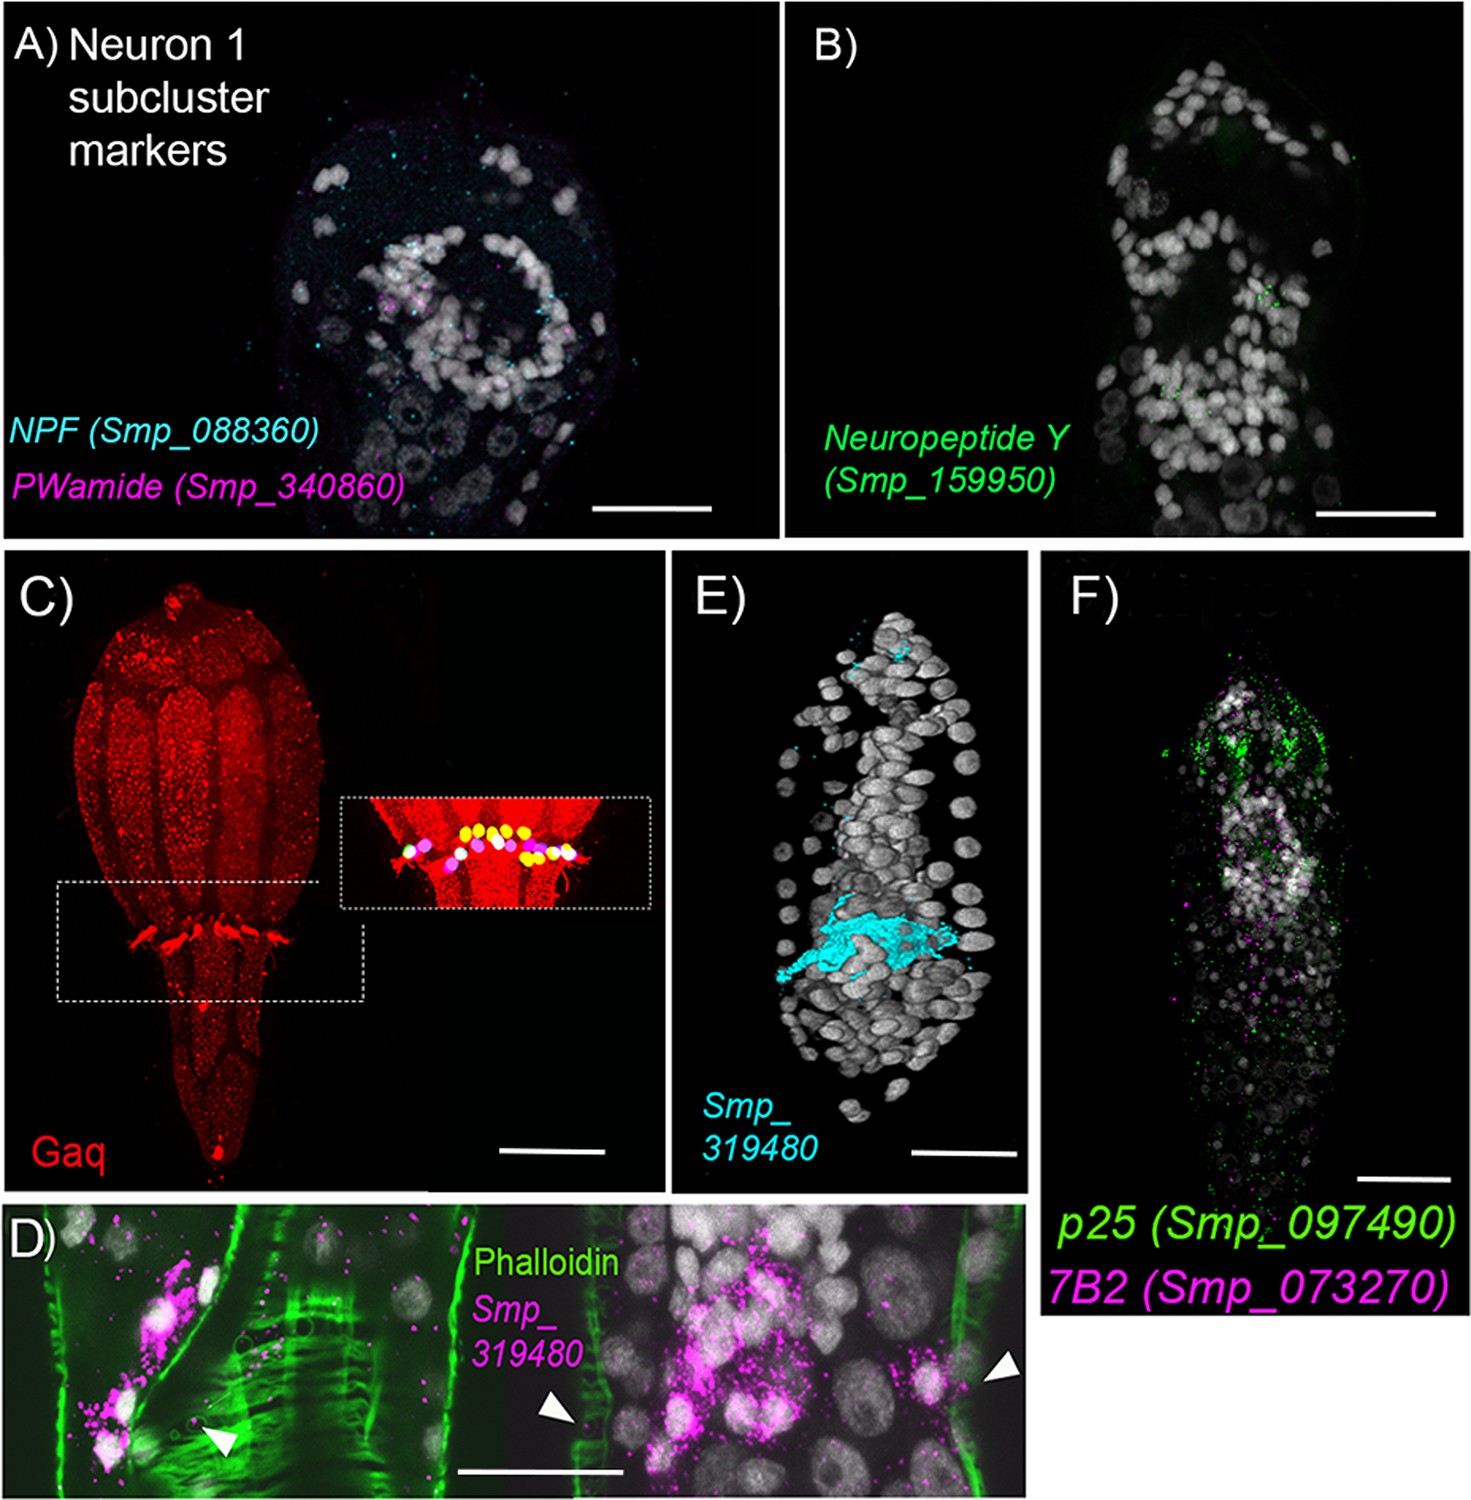
Neurons.
(A, B) Top markers for cell cluster Neuron 1 include the neuropeptides precursor genes for Neuropeptide F, PWamide, and Neuropeptide Y. ISH of these genes shows expression in cells that make up the brain. (C) G-alpha-q antibody staining reveals a girdle of 23 multi-ciliated nerve endings that sit between the second and third tiers of ciliary plates. (D) Neuron 4 marker Smp_319480 (putative mTORC1) transcripts are expressed at the base of these cilia; and (E) some transcripts also reach the nuclei of circular body wall muscles. (F) The expression of p25 alpha which is a marker for ciliated cells in adult worms, Wendt et al., 2020 in the submuscular cells suggest that they may be ciliated. Scale bars = 20 μm.
Figure 3—figure supplement 3
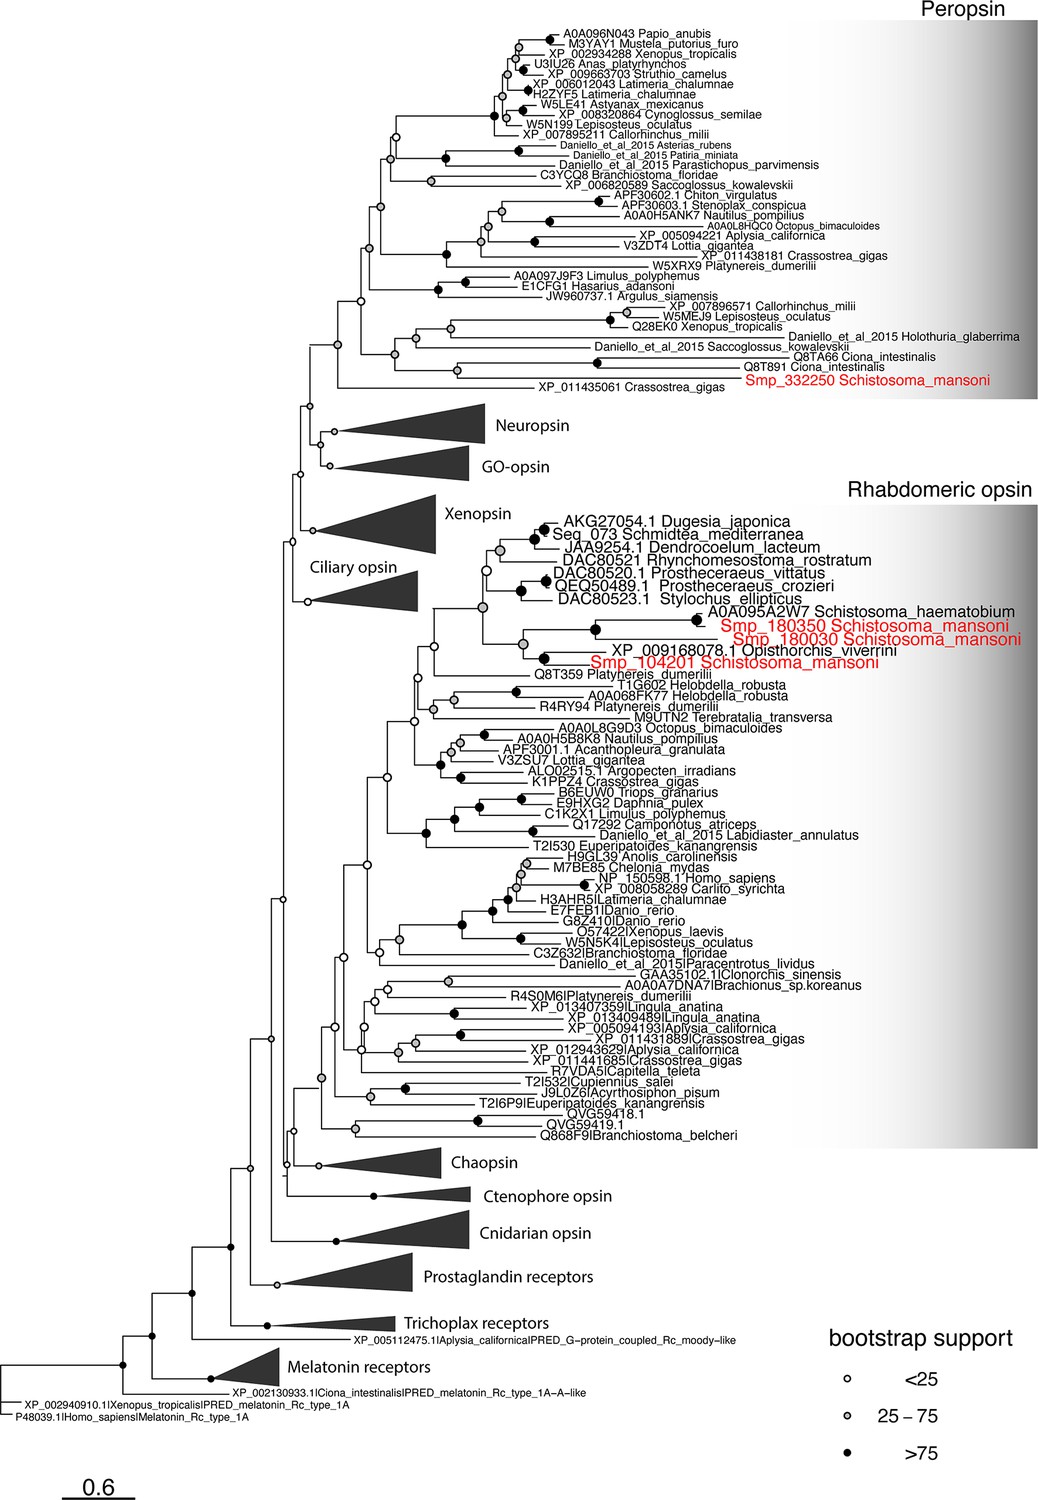
Phylogeny of metazoan opsins.
There are four Schistosoma mansoni opsins that are expressed in two subclusters of Neuron 1; our analysis shows that three belong to the rhabdomeric opsin clade and the fourth is a peropsin. Scale bar shows branch lengths in expected amino acid substitutions per site. Shading of circles at internal nodes shows percentage support for the partition implied by that node from 1000 non-parametric bootstrap samples.
Figure 3—figure supplement 4
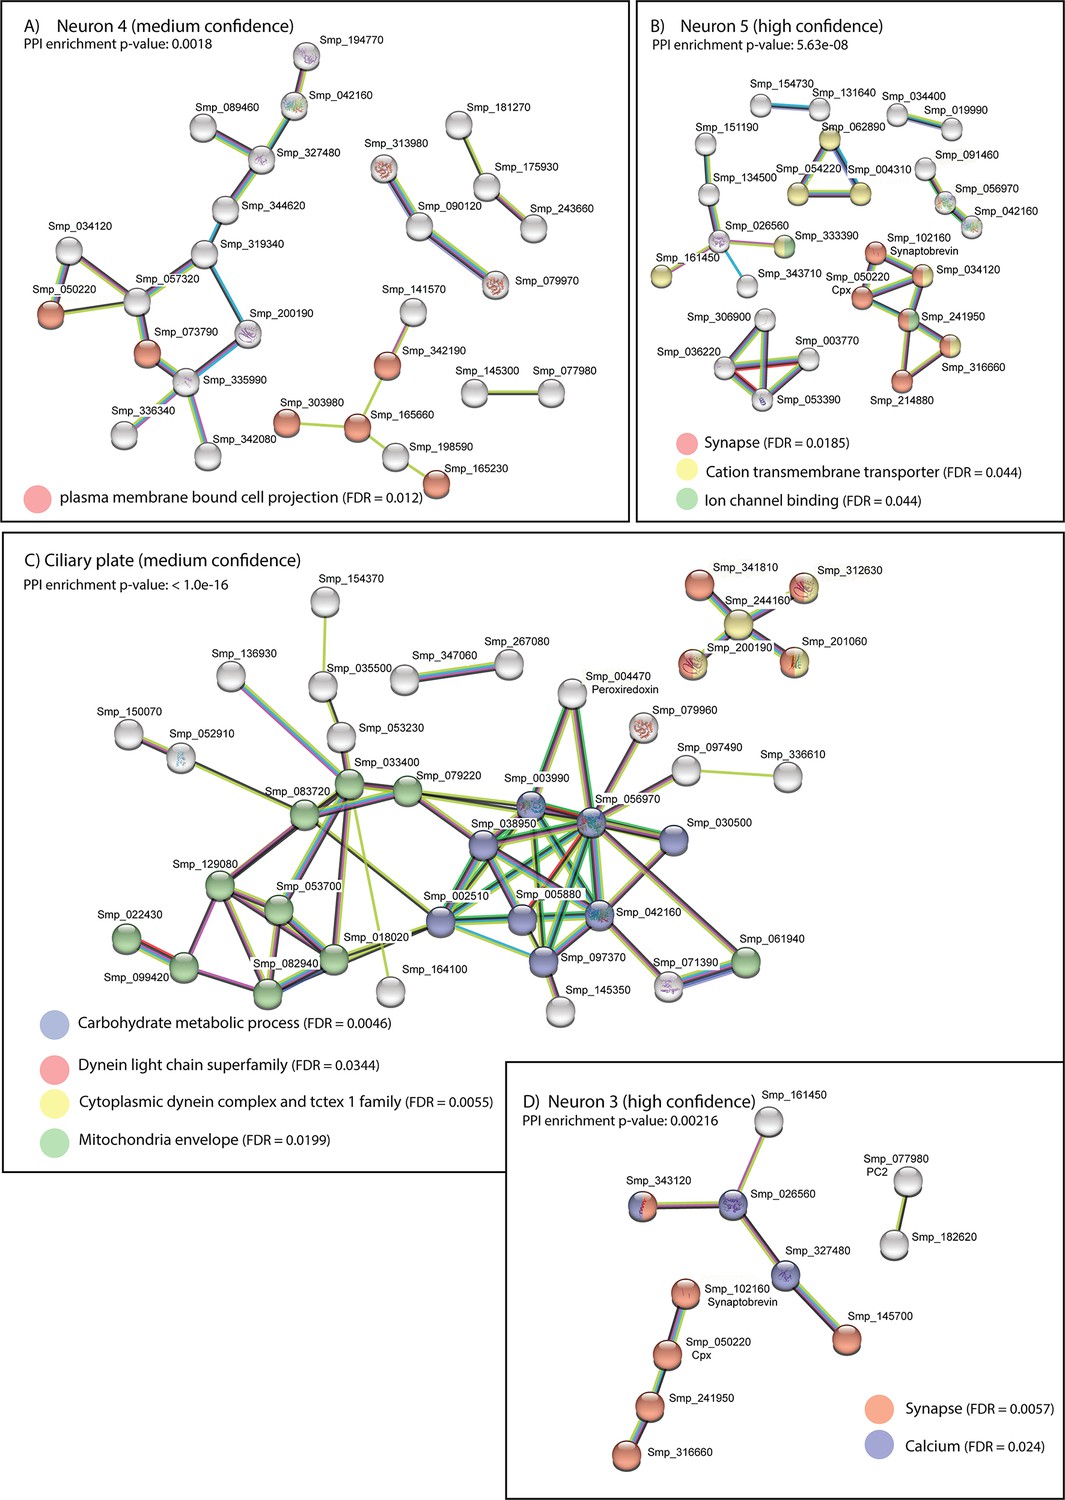
STRING analysis of neural clusters and ciliary plates.
STRING analysis of the top 100 marker genes for each of the neural populations whose predicted networks have functional enrichment. (A) Neuron 4, (B) Neuron 5, (C) Ciliary plates, and (D) Neuron 3. Neuron 1 is not a defined cluster and Neuron 2 showed no functional enrichment. Lines (edges) connecting nodes are based on evidence of the function of homologues. Functional enrichment (FDR = false discovery rate) as provided by STRING (PPI = predicted protein interaction). Minimum interaction (confidence) score of 0.7, corresponding to a high level of confidence, 0.4 medium level of confidence.
Figure 3—figure supplement 5
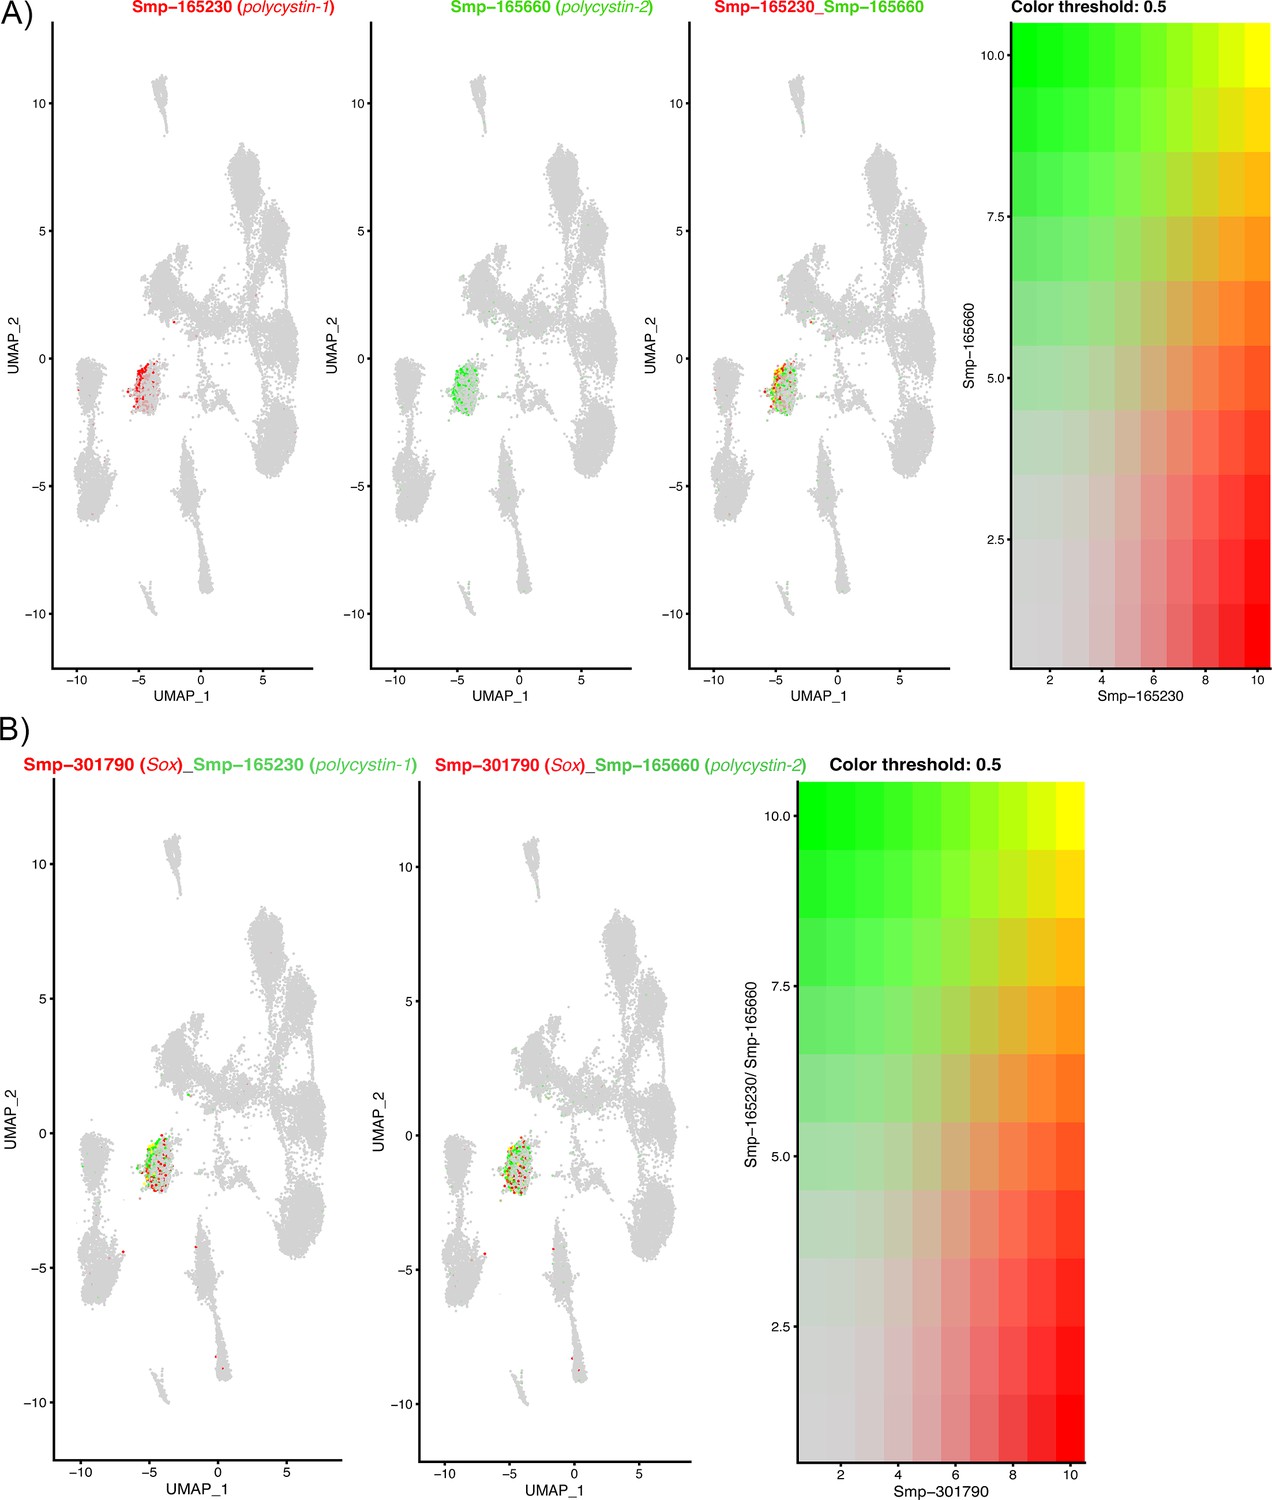
The expression of two polycystin genes and a Sox transcription factor in Neuron 4 cells.
(A) Polycystins 1 and 2 are co-expressed in Neuron 4 cells, orthologues in other animals form heterodimers in ciliated cells that function to detect flow sheer and vibrations (Kim et al., 2016; Bezares-Calderón et al., 2018). Gene expression has been log-normalised and scaled using Seurat(v. 4.3.0). (B) In planaria, a transcription factor Sox B1-2 regulates polycystin genes and together function in sensory neurons that detect flow. The co-expression of polycystin genes with a Sox transcription factor in Neuron 4 cells indicates that this transcription factor may regulate these polycystin genes in the miracidium.
Figure 3—figure supplement 6
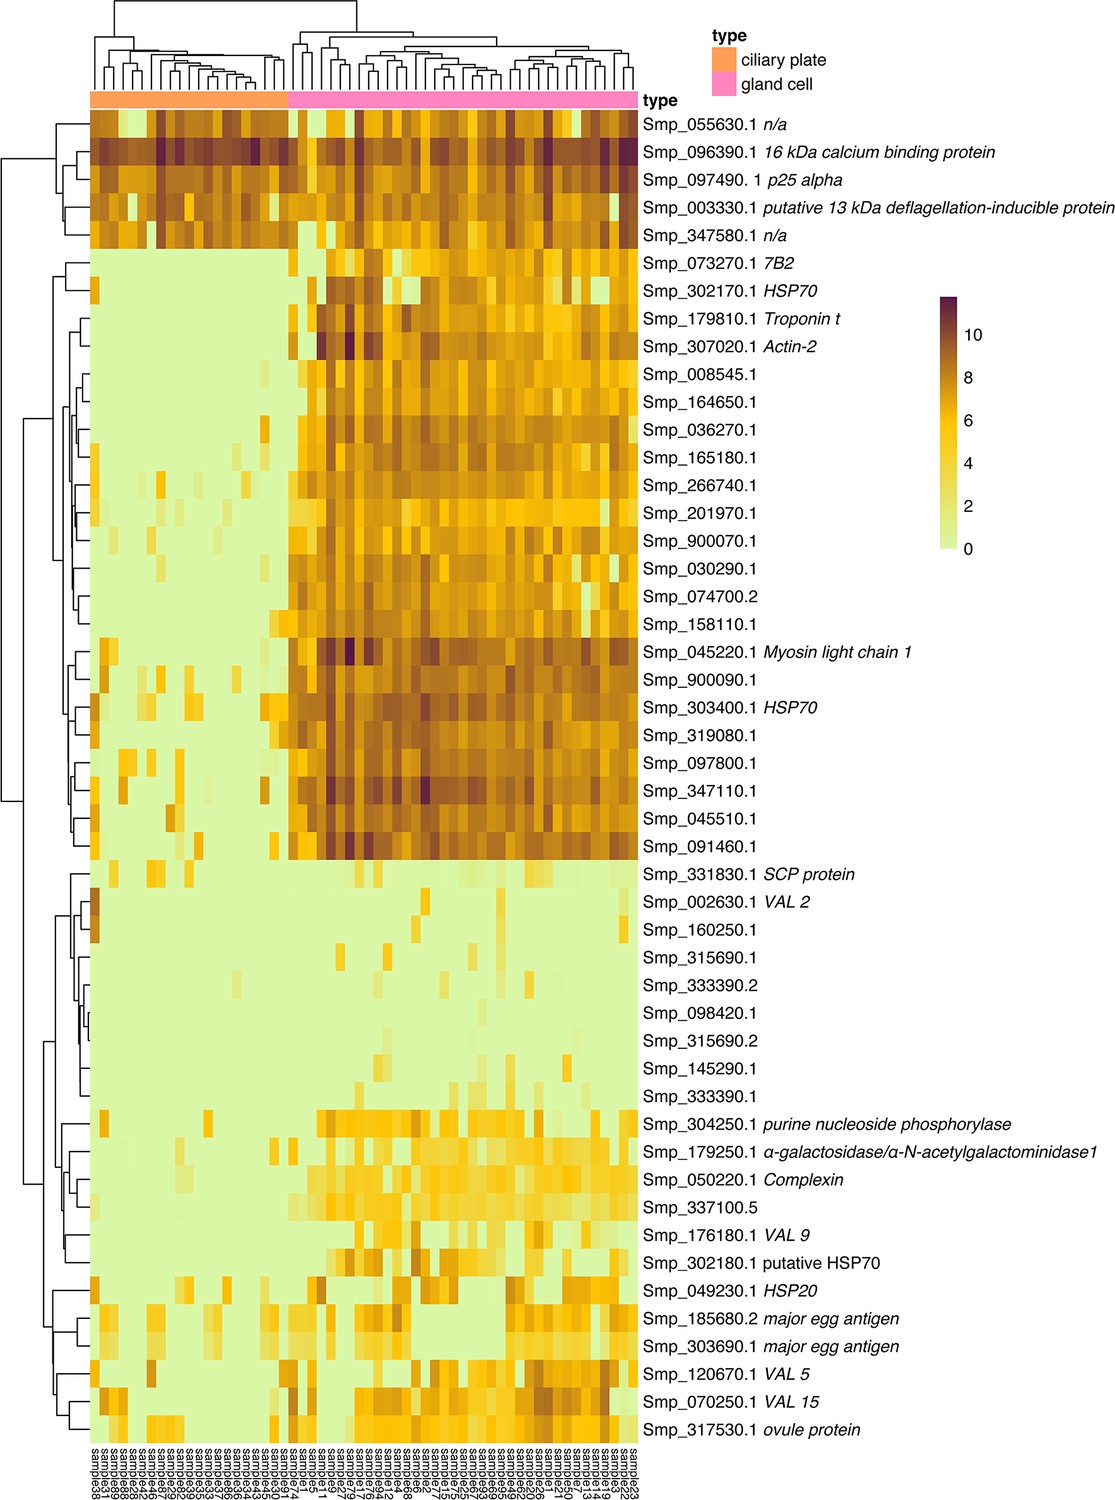
Gene expression by transcripts per million in the ciliary plates and gland cells.
Heatmap showing the gene expression, by transcripts per million, detected in the ciliary plates and gland cells hand-picked for plate-based single-cell RNA sequencing (scRNA-seq). Genes included: the top 20 significant genes between gland cell and ciliary plates, two neural markers, five VAL genes, five significant genes between gland cells and other cells, eight genes previously reported to produce secreted proteins in the miracidia (Wang et al., 2016; Wu et al., 2009), and five top marker genes from the ciliary plate cluster.
Figure 3—video 1
Confocal z-stack of wholemount in situ hybridisation (WISH) of markers for neuron cluster 2 (Smp_201600) (magenta) and neuron 3 (Smp_071050)(cyan), counterstained with DAPI (white) shows expression of both genes in cells whose nuclei form part of the nuclear rind of the brain.
Scale bar = 10 μm.
Figure 3—video 2
Confocal z-stack of wholemount in situ hybridisation (WISH) of ciliary plate marker 16 kDa calcium-binding protein (Smp_096390), counterstained with phalloidin (green) and DAPI (white) shows expression in the ciliary plates and six previously undescribed cells that we term submuscular cells.
The nuclei of the submuscular cells sit beneath the body wall muscles, and each cell has a protrusion (possible cilia) that extends beyond the body wall muscles, between the first and second tiers of ciliary plates, and out to the exterior of the larva. Scale bar = 10 μm.
Figure 3—video 3
Maximum intensity projection of confocal z-stack of wholemount in situ hybridisation (WISH) of ciliary plate marker 16 kDa calcium-binding protein (Smp_096390), counterstained with phalloidin (green) and DAPI (white) shows expression in ciliary plates and submuscular cells.
Scale bar = 10 μm.
Figure 3—video 4
Maximum intensity projection from confocal z-stack of wholemount in situ hybridisation (WISH) of neuron 2 marker Smp_319480 (magenta), counterstained with DAPI (white), showing expression in clusters of cells posterior to the brain that extend into the brain and out to the periphery.
Scale bar = 10 μm.
Figure 3—video 5
Maximum intensity projection from confocal z-stack of wholemount in situ hybridisation (WISH) of neuron 4 marker Smp_319480 (magenta) and ciliary plate marker 16 kDa calcium-binding protein (Smp_096390) (green), counterstained with DAPI (white), showing that the clusters of neuron 4 cells reach the periphery at the latitude between the second and third tiers of ciliary plates.
Scale bar = 10 μm.
Figure 3—video 6
Maximum intensity projection from confocal z-stack of wholemount in situ hybridisation (WISH) of neuron 5 marker Smp_319480 (cyan), counterstained with DAPI (white), showing expression in cells anterior to the brain and in and around the paired lateral glands and their secretory ducts.
Scale bar = 10 μm.
Figure 4 with 7 supplements
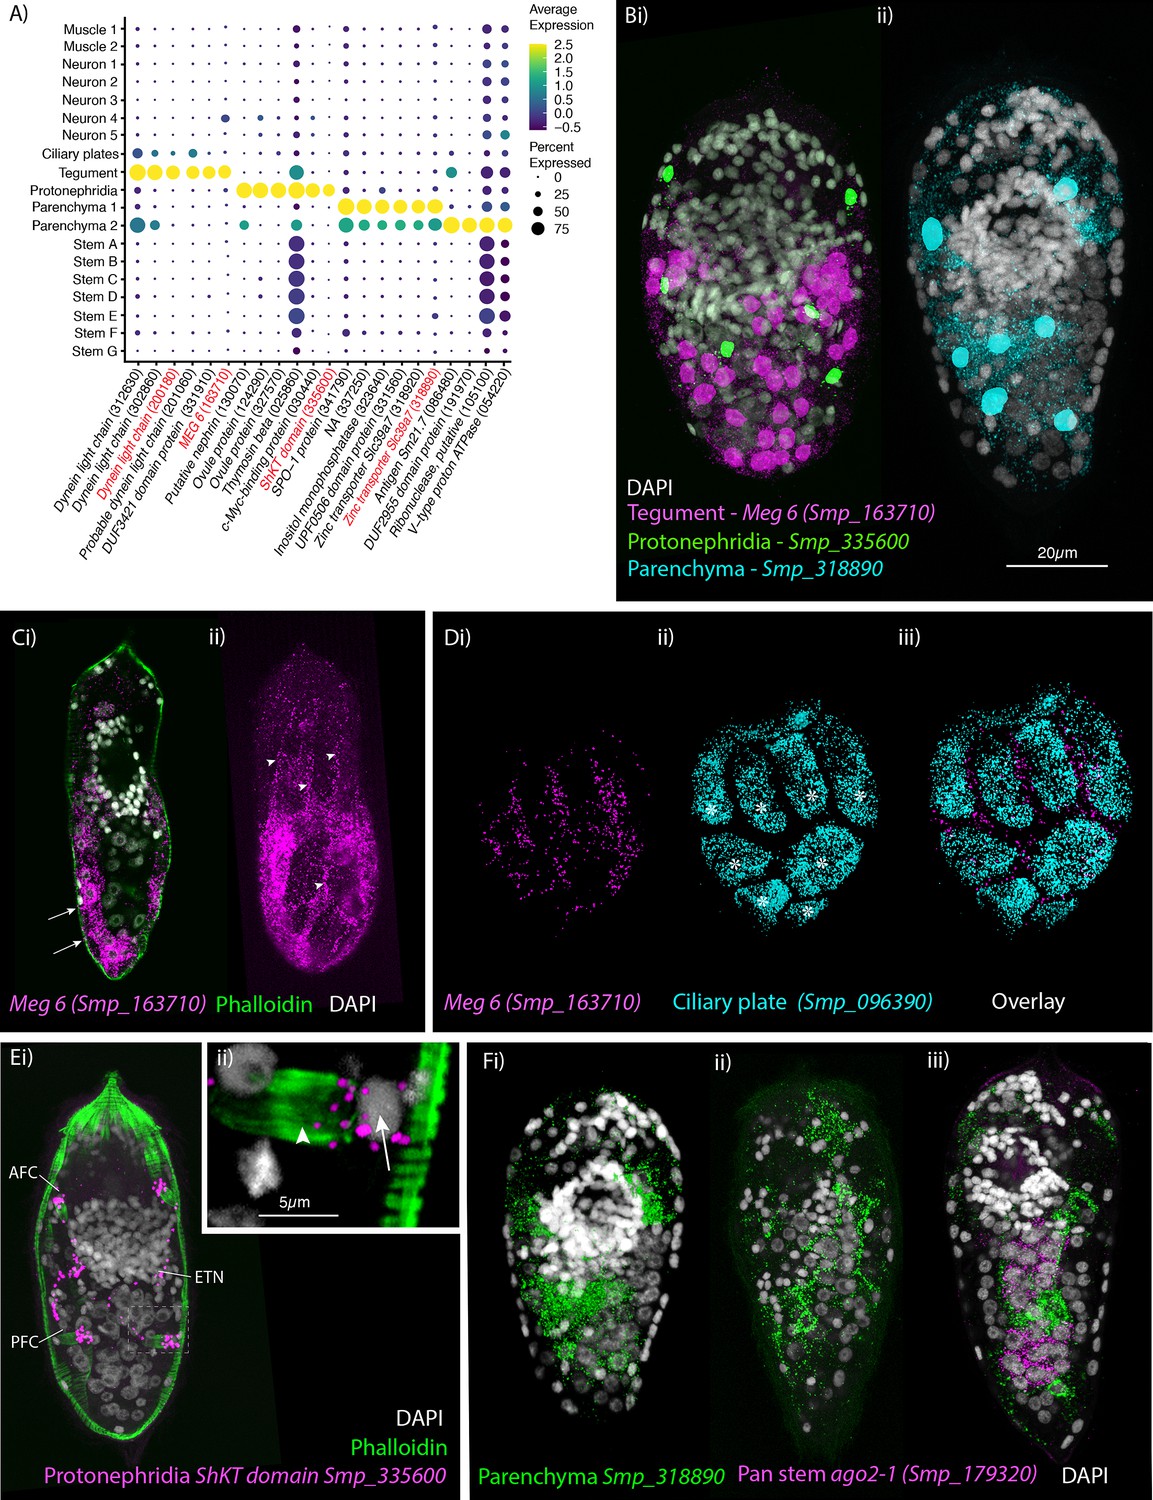
Identification of the tegument, protonephridia, parenchymal cells in the miracidium.
(A) Expression profiles of cell marker genes specific or enriched in these cell-type clusters. Genes validated by in situ hybridisation are in red. Gene identifiers shown in parenthesis but with ‘Smp_’ prefix removed for brevity. Gene expression has been log-normalised and scaled using Seurat(v. 4.3.0). (B) Segmentation of nuclei of the cells expressing the marker genes for: (i) protonephridia and tegument (multiplexed) show that six cells express Smp_335600 (ShKT-domain protein, a marker for protonephridia), 46 cells express Meg-6 (a marker for tegument) (segmentation of 1 larva), and (ii) seven cells that express an uncharacterised gene, Smp_318890 (a marker for parenchymal cells)(segmentation of 1 larva). (C, D) The tegument marker Meg-6 shows expression around nuclei in the posterior two-thirds of the larvae. The nuclei are below the body wall muscle, and cytoplasmic protrusions reach between muscle filaments (arrows) and form the epidermal ridges (arrowheads) between the ciliary plates (which are visible in Dii, iii expressing the ciliary plate marker Smp_096390) (asterisks). 100% of individuals examined, n > 30. (E) The protonephridial marker Smp_335600 shows ‘S’-shaped expression with transcripts extending from the nucleus of the anterior flame cell (AFC) along the excretory tubule and its nucleus (ETN) to the posterior flame cell (PFC), (Eii) it is expressed around the nuclei (arrow) rather than the barrels (arrowhead) of the flame cells. 100% of individuals examined, n > 30. (Fi) The pan-parenchymal marker, Smp_318890, was expressed in two anterior cells (one on either side of the brain) and five to seven cells posterior to the brain. (Fii) These cells have long cytoplasmic protrusions that reach between all the other cells, (Fiii) including the ago2-1+ stem cells. 100% of individuals examined, n > 30. Scale shown in B also applies to C, D, Ei, and F.
Figure 4—figure supplement 1
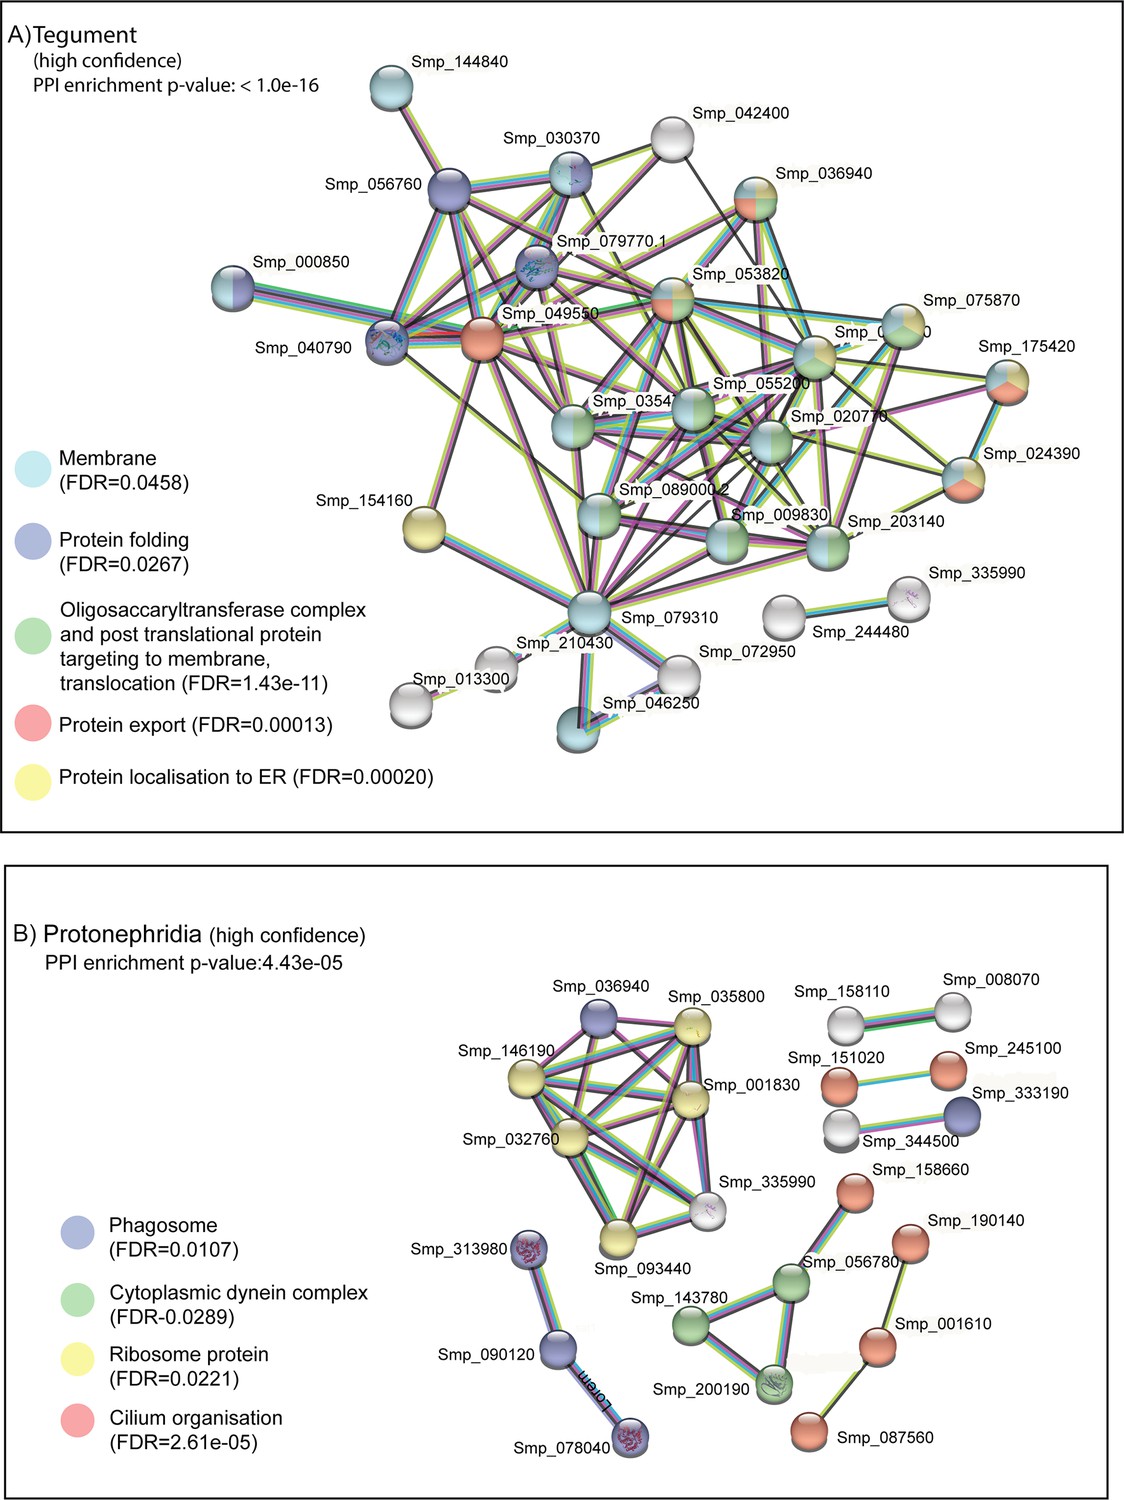
STRING analysis of tegument and protonephridia clusters.
STRING analysis of the top 100 marker genes for (A) tegument and (B) protonephridia. Lines (edges) connecting nodes are based on evidence of the function of homologues. Functional enrichment (FDR) as provided by STRING (PPI = predicted protein interaction). Minimum interaction (confidence) score of 0.7, corresponding to a high level of confidence, 0.4 medium level of confidence.
Figure 4—figure supplement 2
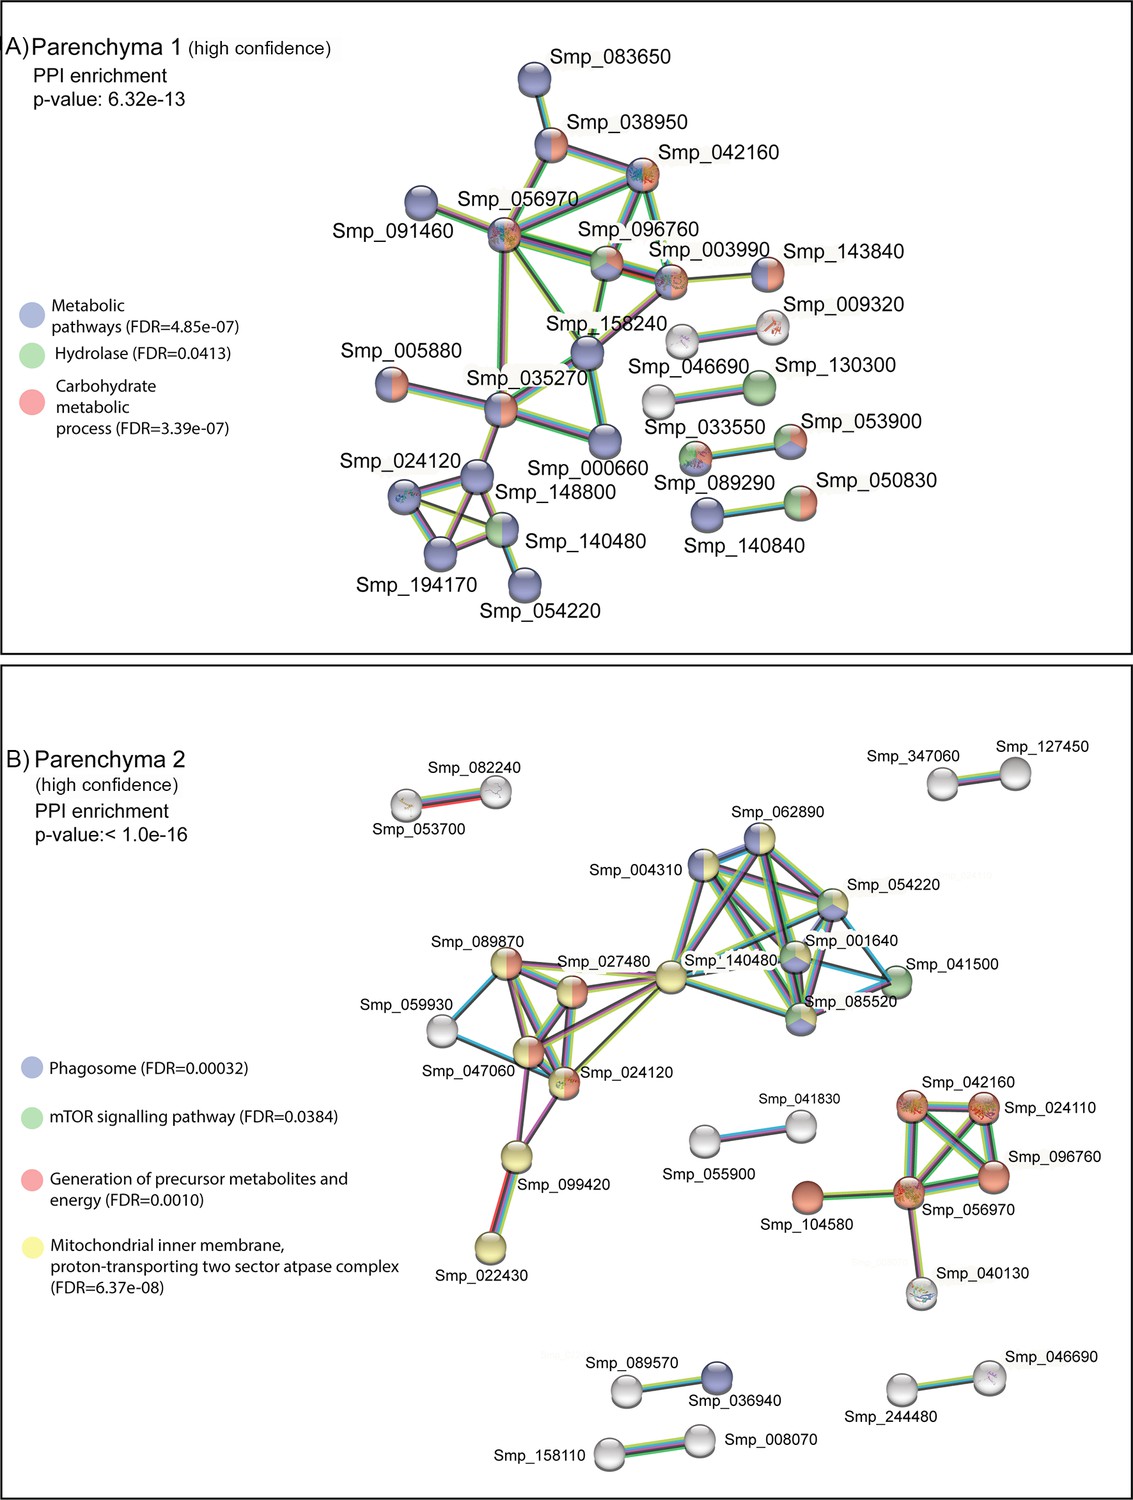
STRING analysis of parenchyma clusters.
STRING analysis of the top 100 marker genes for (A) Parenchyma 1 and (B) Parenchyma 2. Lines (edges) connecting nodes are based on evidence of the function of homologues. Functional enrichment (FDR) as provided by STRING (PPI = predicted protein interaction). Minimum interaction (confidence) score of 0.7, corresponding to a high level of confidence, 0.4 medium level of confidence.
Figure 4—figure supplement 3
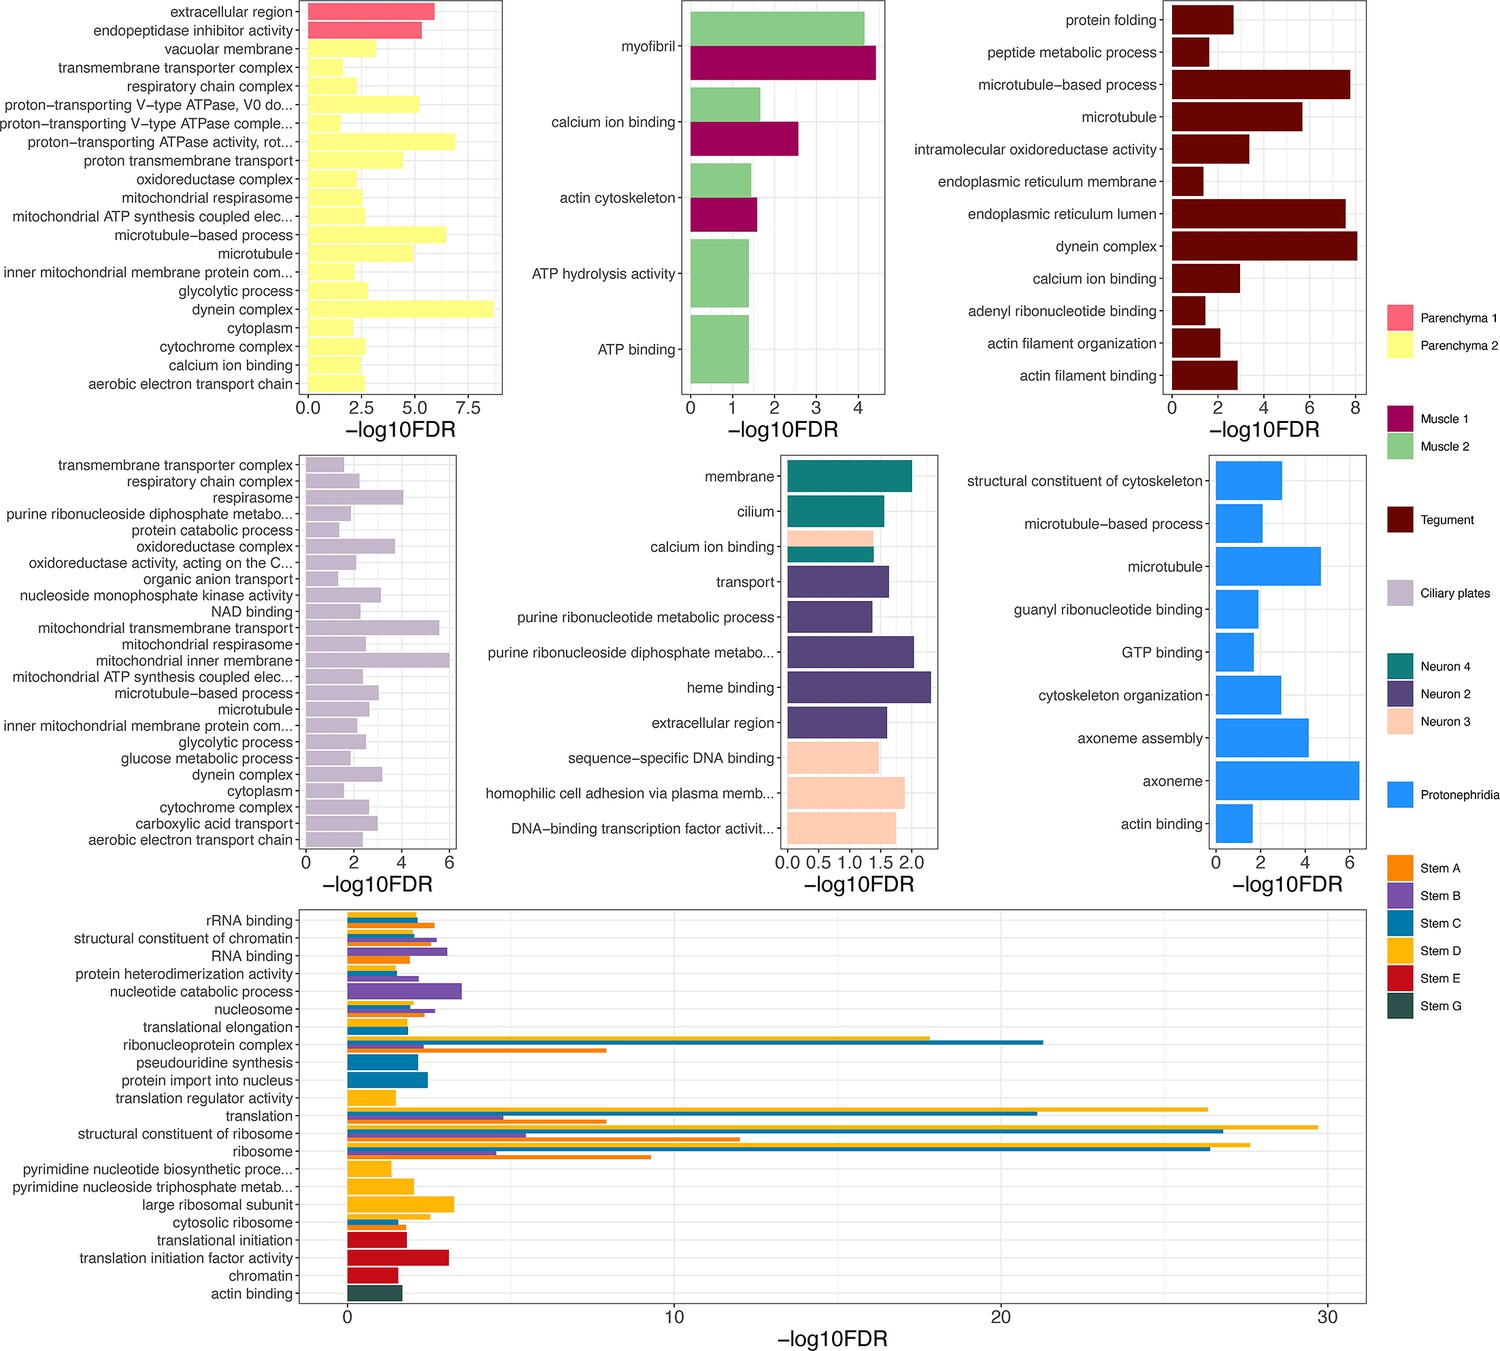
Gene ontology (GO) analysis of marker genes identified in the miracidia cell clusters.
GO analysis was performed on each cluster using genes with a minimum area under curve (AUC) score of 0.7. Enriched biological process (BP) GO terms are shown for each cluster, and have been filtered to only show terms supported by a minimum of two genes. Top panels (left to right) show parenchyma, muscle, and tegument clusters, middle panels (left to right) show ciliary plate, neuron, and protonephridia clusters, and the bottom panel shows stem clusters. Full list of GO terms available in Supplementary file 1g.
Figure 4—video 1
Maximum intensity projection from confocal z-stack of wholemount in situ hybridisation (WISH) of protonephridia marker ShKT-domain-containing protein (Smp_335600) (magenta), counterstained with DAPI (white).
This shows the transcripts in a bilaterally symmetrical pattern distributed along the s-shaped path of an excretory tubule that connects the anterior and posterior flame cells. Scale bar = 10 μm.
Figure 4—video 2
Confocal z-stack of wholemount in situ hybridisation (WISH) of markers for parenchyma 1 and 2 (Smp_318890) (green) and stem cells ago2-1 (Smp_179320) (magenta), counterstained with DAPI (white) shows the long cytoplasmic protrusions of the parenchymal cells reaching between the stem and other cells.
Scale bar = 10 μm.
Figure 4—video 3
Maximum intensity projection from confocal z-stack of wholemount in situ hybridisation (WISH) of marker for parenchyma 1 and 2 (Smp_318890) (green) counterstained with DAPI (white) shows the distribution of the parenchymal cells and their reach in the intercellular space of the larva.
Scale bar = 10 μm.
Figure 4—video 4
Confocal z-stack of wholemount in situ hybridisation (WISH) of markers for tegument Meg6 (Smp_163710) (magenta) and dynein light chain (Smp_200180) (cyan), counterstained with phalloidin (green) and DAPI (white) shows the nuclei sit below the body wall muscle, and cytoplasmic protrusions reach between muscle filaments and form the epidermal ridges between the ciliary plates.
Scale bar = 10 μm.
Figure 5 with 9 supplements
Two defined populations of stem cells cluster by sex.
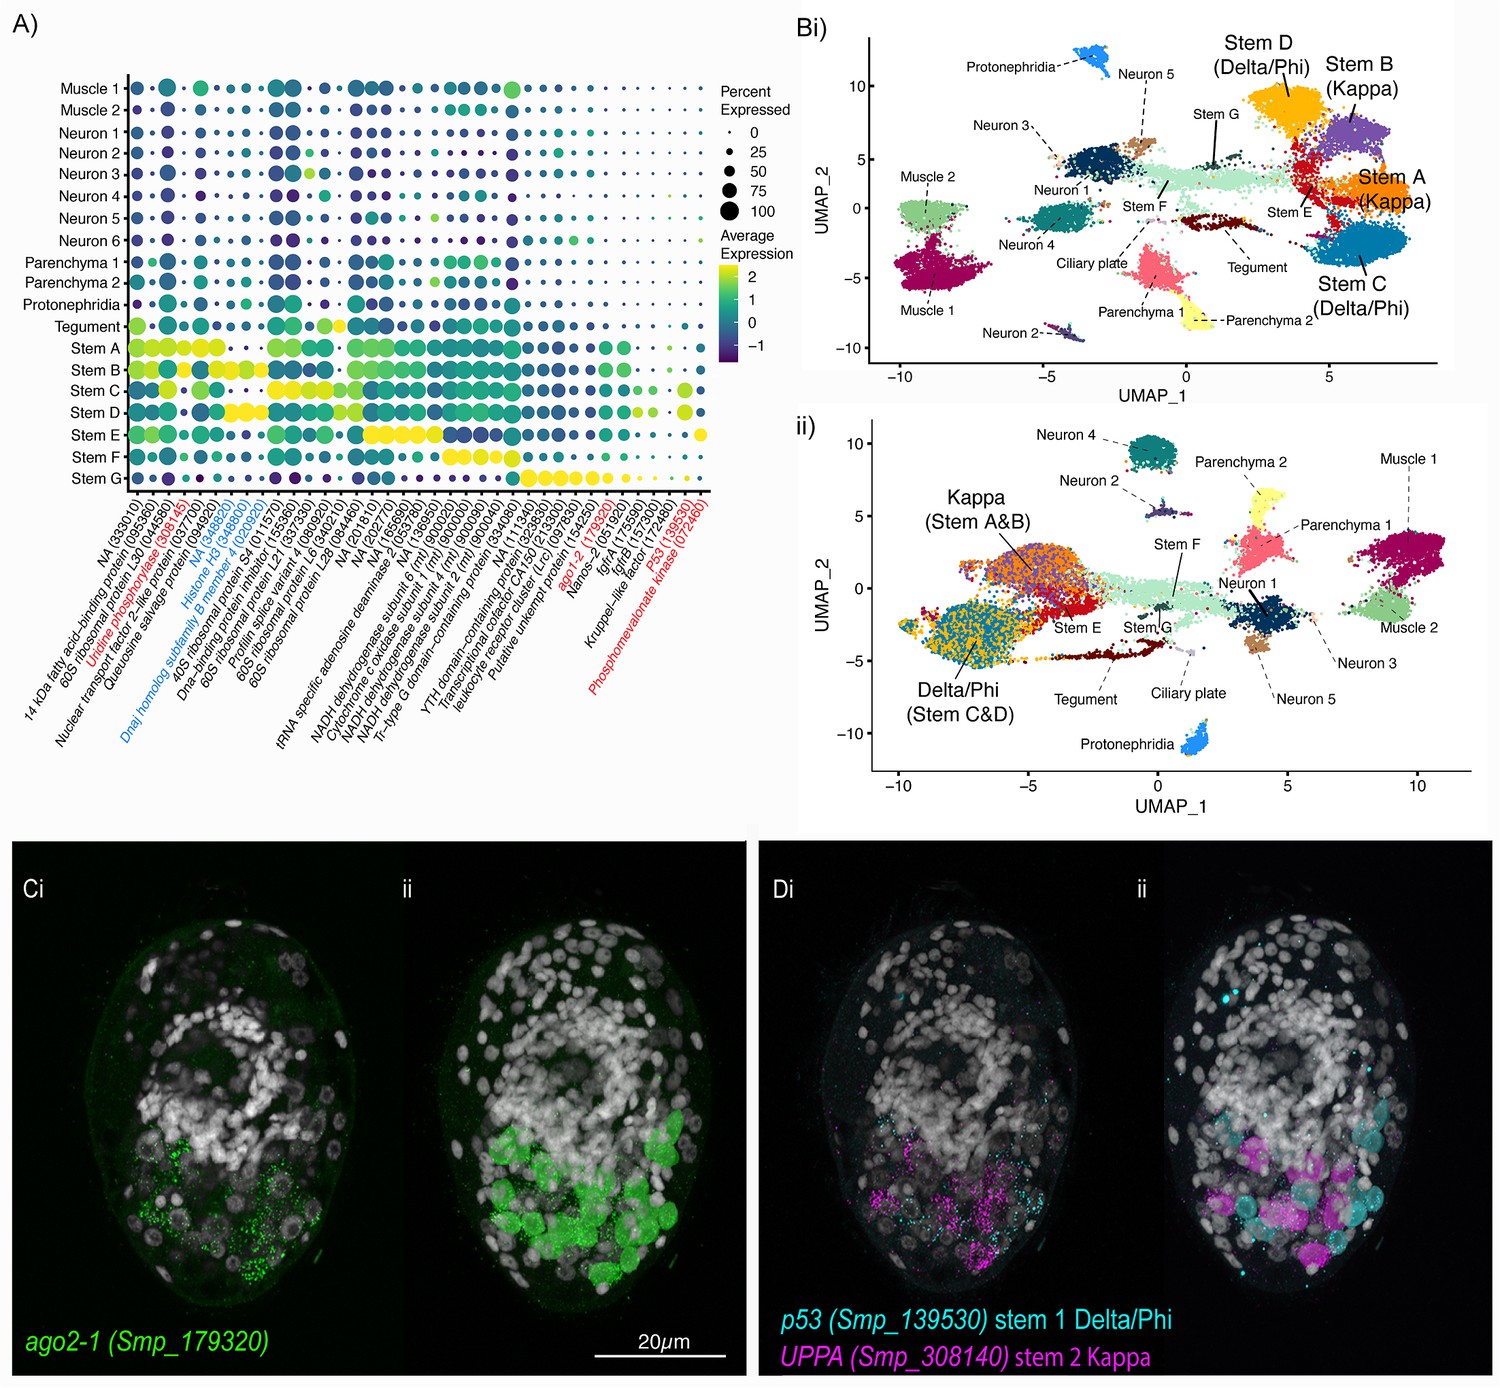
(A) Expression profiles of cell marker genes that are specific or enriched in the stem cell clusters. Genes specific to the W (female-specific) sex chromosome are highlighted in blue. Genes validated by ISH are marked in red. Gene identifiers shown in parenthesis but with ‘Smp_’ prefix removed for brevity. Gene expression has been log-normalised and scaled using Seurat(v. 4.3.0). (Bi) UMAP including all genes shows that there are two Delta/Phi and two Kappa stem clusters, (ii) UMAP showing that removal of all genes specific to the W and Z sex chromosomes results in one Delta/Phi and one Kappa cluster, indicating that the stem cells are transcriptionally different in male and female miracidia due to the expression of sex-linked genes. (C, D) Multiplexed ISH showing three stem cell markers simultaneously in the same individual: ago2-1 (Smp_179320) (pan-stem), p53 (Smp_139530) (Delta/Phi), and Uridine phosphorylase A (UPPA, Smp_308140) (Kappa). (Ci) Ago2-1 expression reveals stem cells lateral and posterior to the brain (Optical section). 100% of individuals examined, n > 30. (ii) MIP with segmentation of the 23 ago2-1+ cells. (Di) P53 and UPPA expression shows the two stem cell populations intermingled in 100% of individuals examined, n > 30. (ii) MIP and segmentation reveal there are more p53+ cells than UPPA+ cells (in this larva,15 are p53+ and 9 are UPPA+). Scale shown in C also applies to D.
Figure 5—figure supplement 1
Expression of known stem cell markers in miracidia cells.
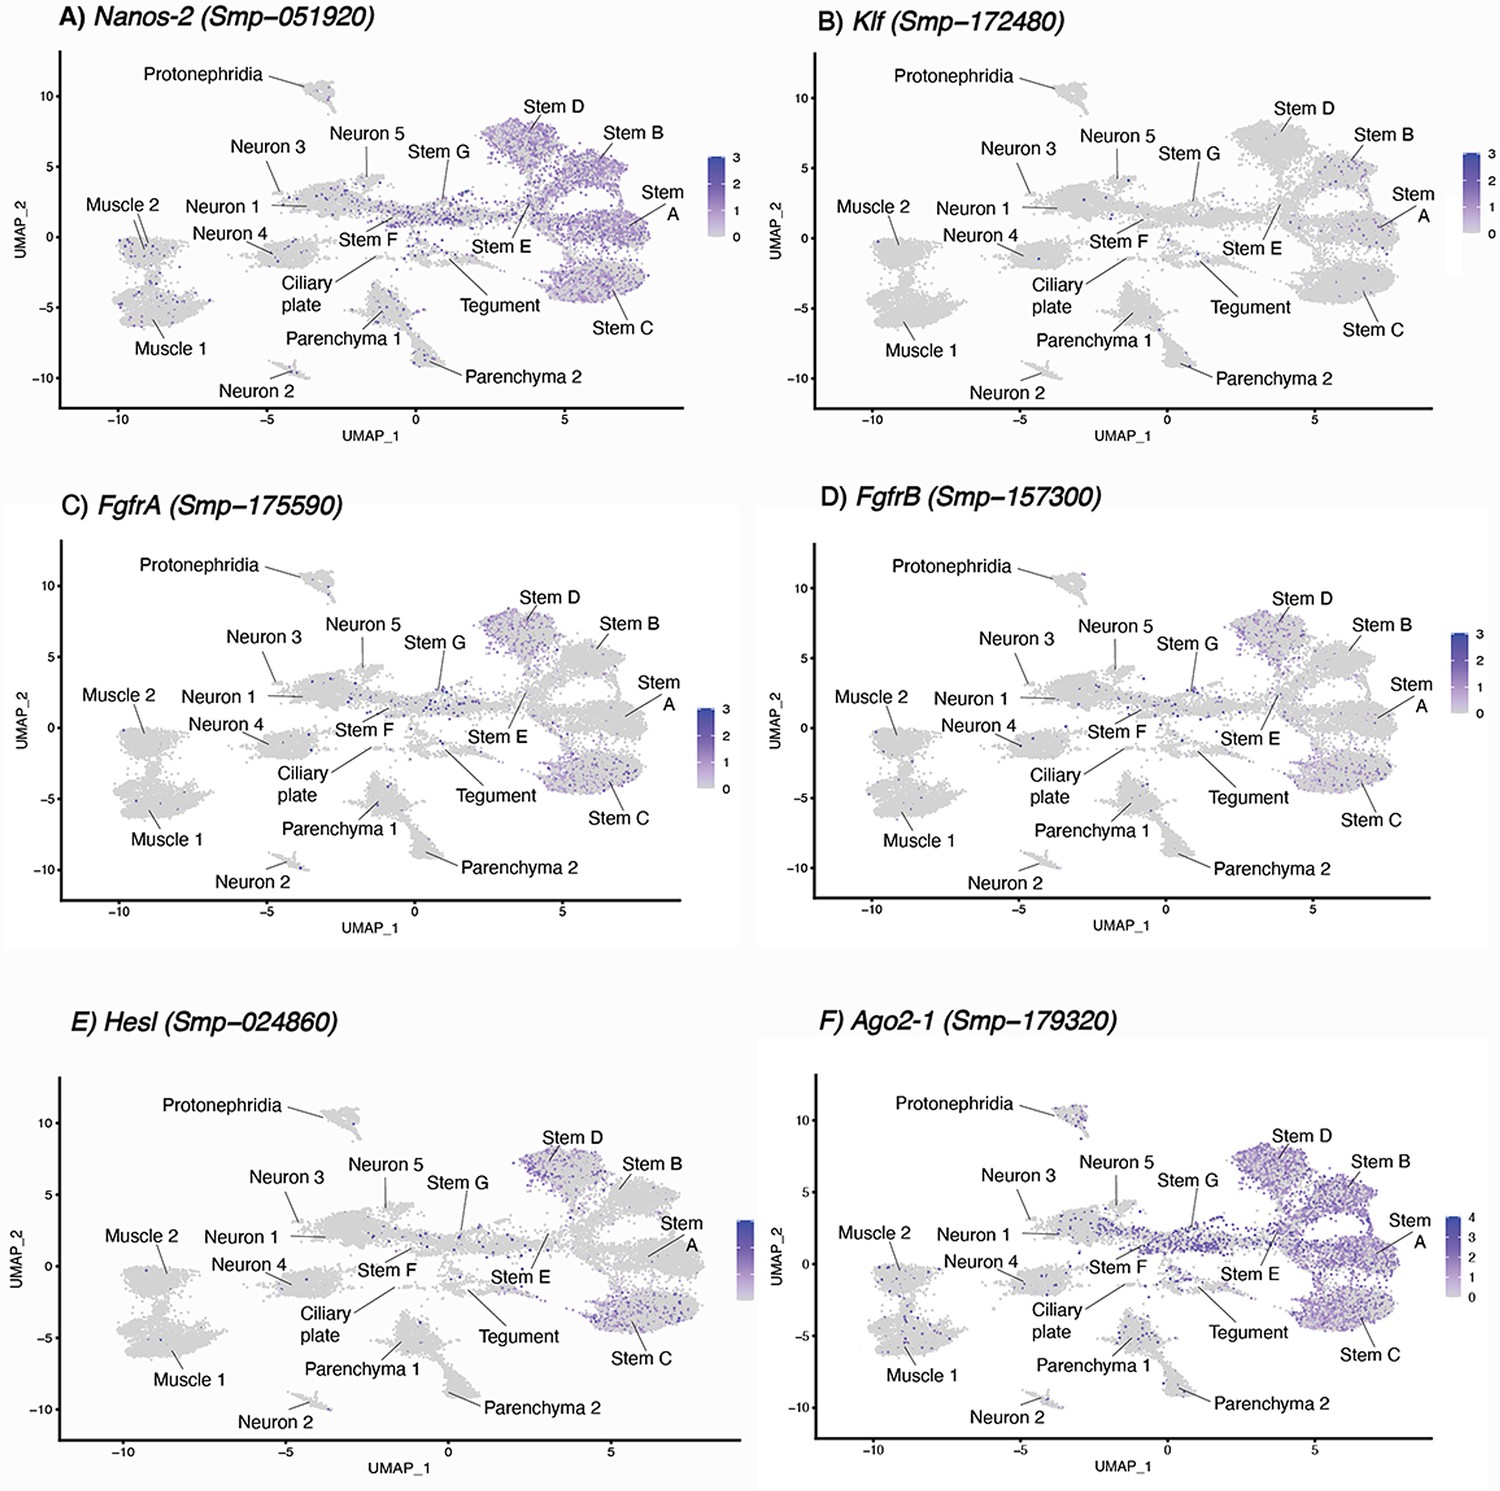
(A–F) Three stem cell classes were identified in the mother sporocyst stage and were named based upon their respective markers: Kappa (klf+, nanos-2+), Delta (nanos-2+ and fgfrA+, fgfrB+ and nanos-2+) and Phi (fgfrA+and, fgfrB+ and hesl+), as well as pan-stem marker ago2-1 (Wang et al., 2018; Nanes Sarfati et al., 2021). In the miracidium, we identified seven stem cell clusters by expression of ago2-1: Stems A and B are klf+ and nanos-2+ (i.e. Kappa-like), Stems C and D are nanos-2+, fgfrA+, fgfrB+, and hesl+ (i.e. they resembled both Delta and Phi). Gene expression has been log-normalised and scaled using Seurat(v. 4.3.0).
Figure 5—figure supplement 2
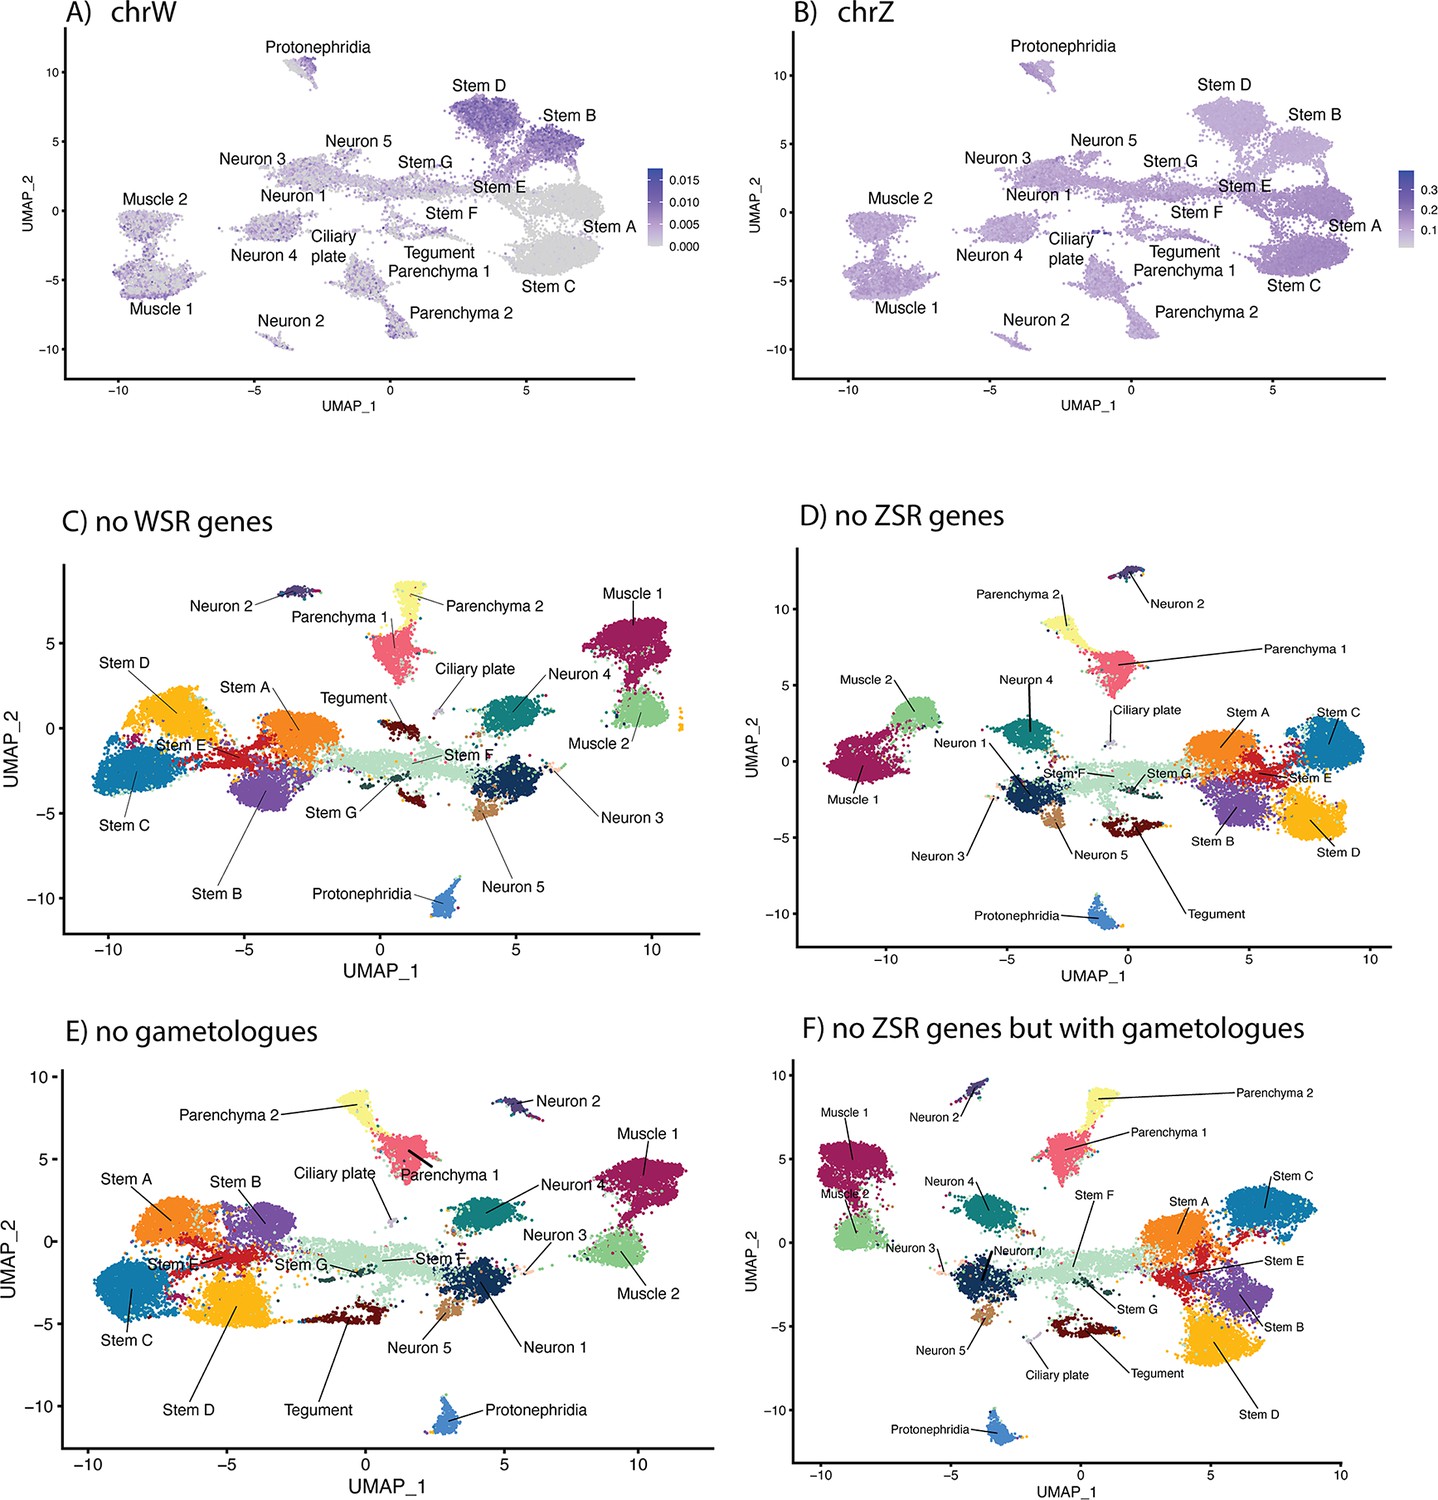
The effect of sex-linked genes on cell clustering.
Schistosoma mansoni has seven pairs of autosomes and one pair of sex chromosomes; males have ZZ and females have ZW (Buddenborg et al., 2021). The sex chromosomes are composed of sex-specific regions that are unique to each chromosome flanked by pseudoautosomal regions that are common to both Z and W. The W-specific region (WSR) is a large, highly repetitive region that contains 38 genes, most of which are gametologs (genes with homologous copies on the WSR and Z-specific region [ZSR]). The ZSR contains 941 genes, of which only 35 are gametologs. The proportion of reads mapping to the WSR and ZSR across all cell-type clusters shows (A) putative male cells (Stems A and C i.e. those that lack WSR gene expression) and (B) evidence of incomplete ZSR gene dosage compensation in the male stem cells. (C) To determine whether any of the WSR genes were responsible for the clustering pattern, we excluded them from the mapping reference. The impact on the overall UMAP clustering was minimal. We repeated this excluding the (D) ZSR genes, (E) gametologues, and (F) ZSR genes, except the gametologues, in turn. In all four scenarios, the stem cell clusters remained separated by sex. ZSR or WSR expression is therefore sufficient on their own to split these stem clusters in two.
Figure 5—figure supplement 3
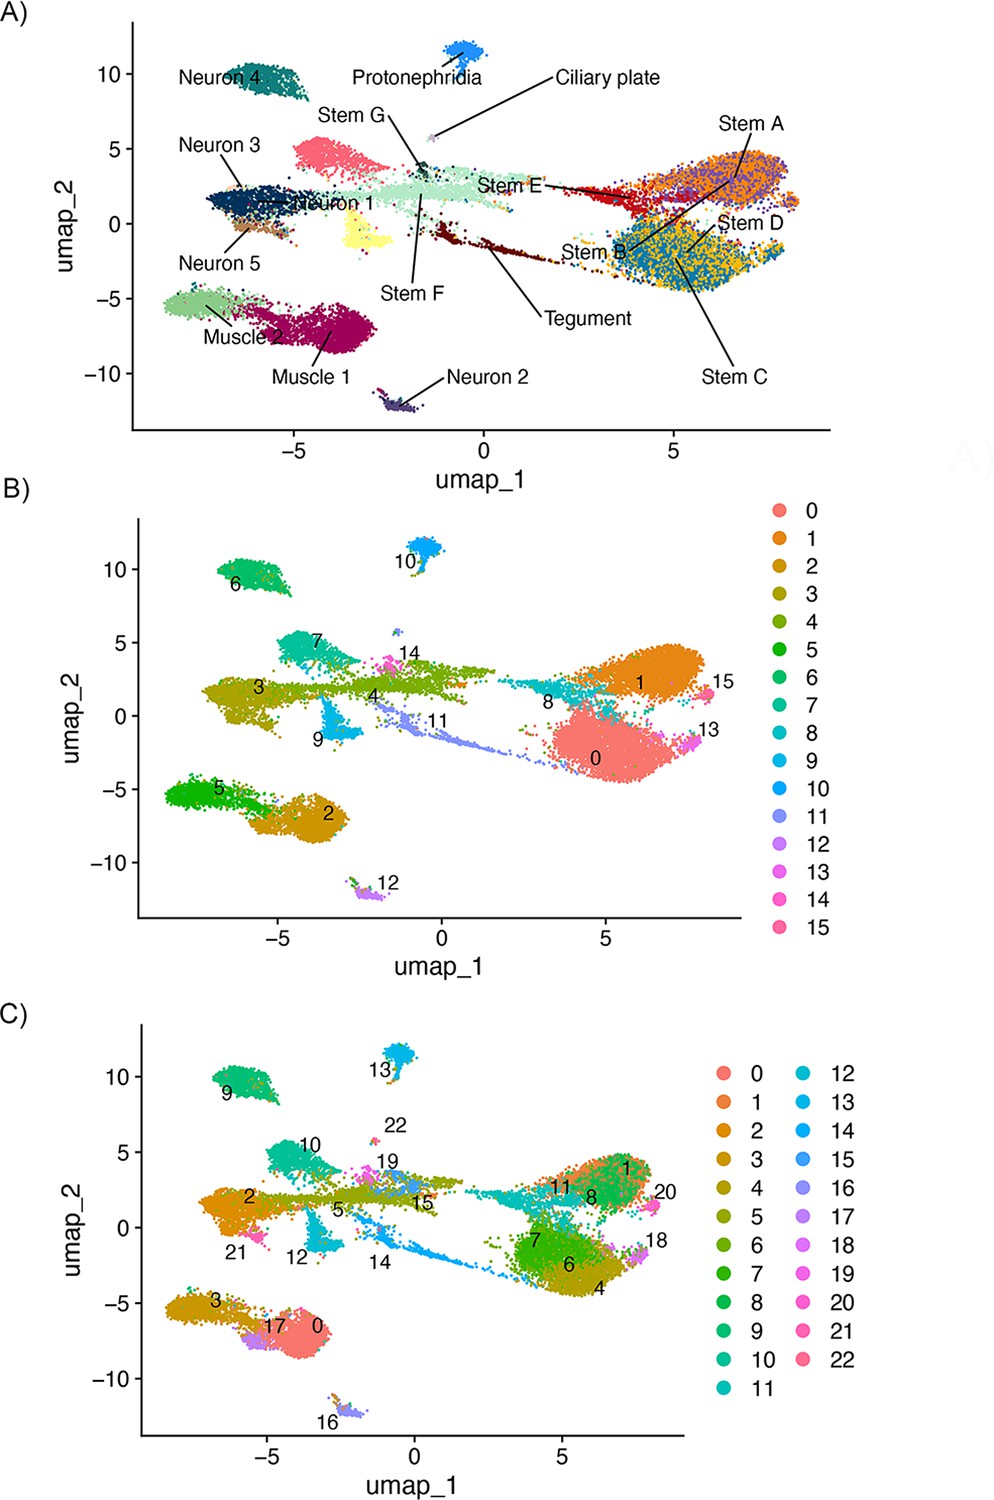
Identification of new clusters after removing Z-specific region (ZSR) and W-specific region (WSR) genes.
To identify whether stem cell clusters A and B, and C and D, still split down A/B and C/D lines despite the apparent collapsing of clusters after removing ZSR and WSR genes, we ran de novo clustering at several resolutions. Even once clusters were oversplitting, there was not a separation between stem cluster A/B and C/D. This was run using Seurat(v5.0.2), so the overall topology is not identical to that shown in Figure 5, though the same number of principal components (PCs) is used. (A) Shows the UMAP topology labelled by original cluster ID, (B) shows the de novo clusters at resolution = 0.6, and (C) shows the de novo clusters at resolution = 1.
Figure 5—figure supplement 4
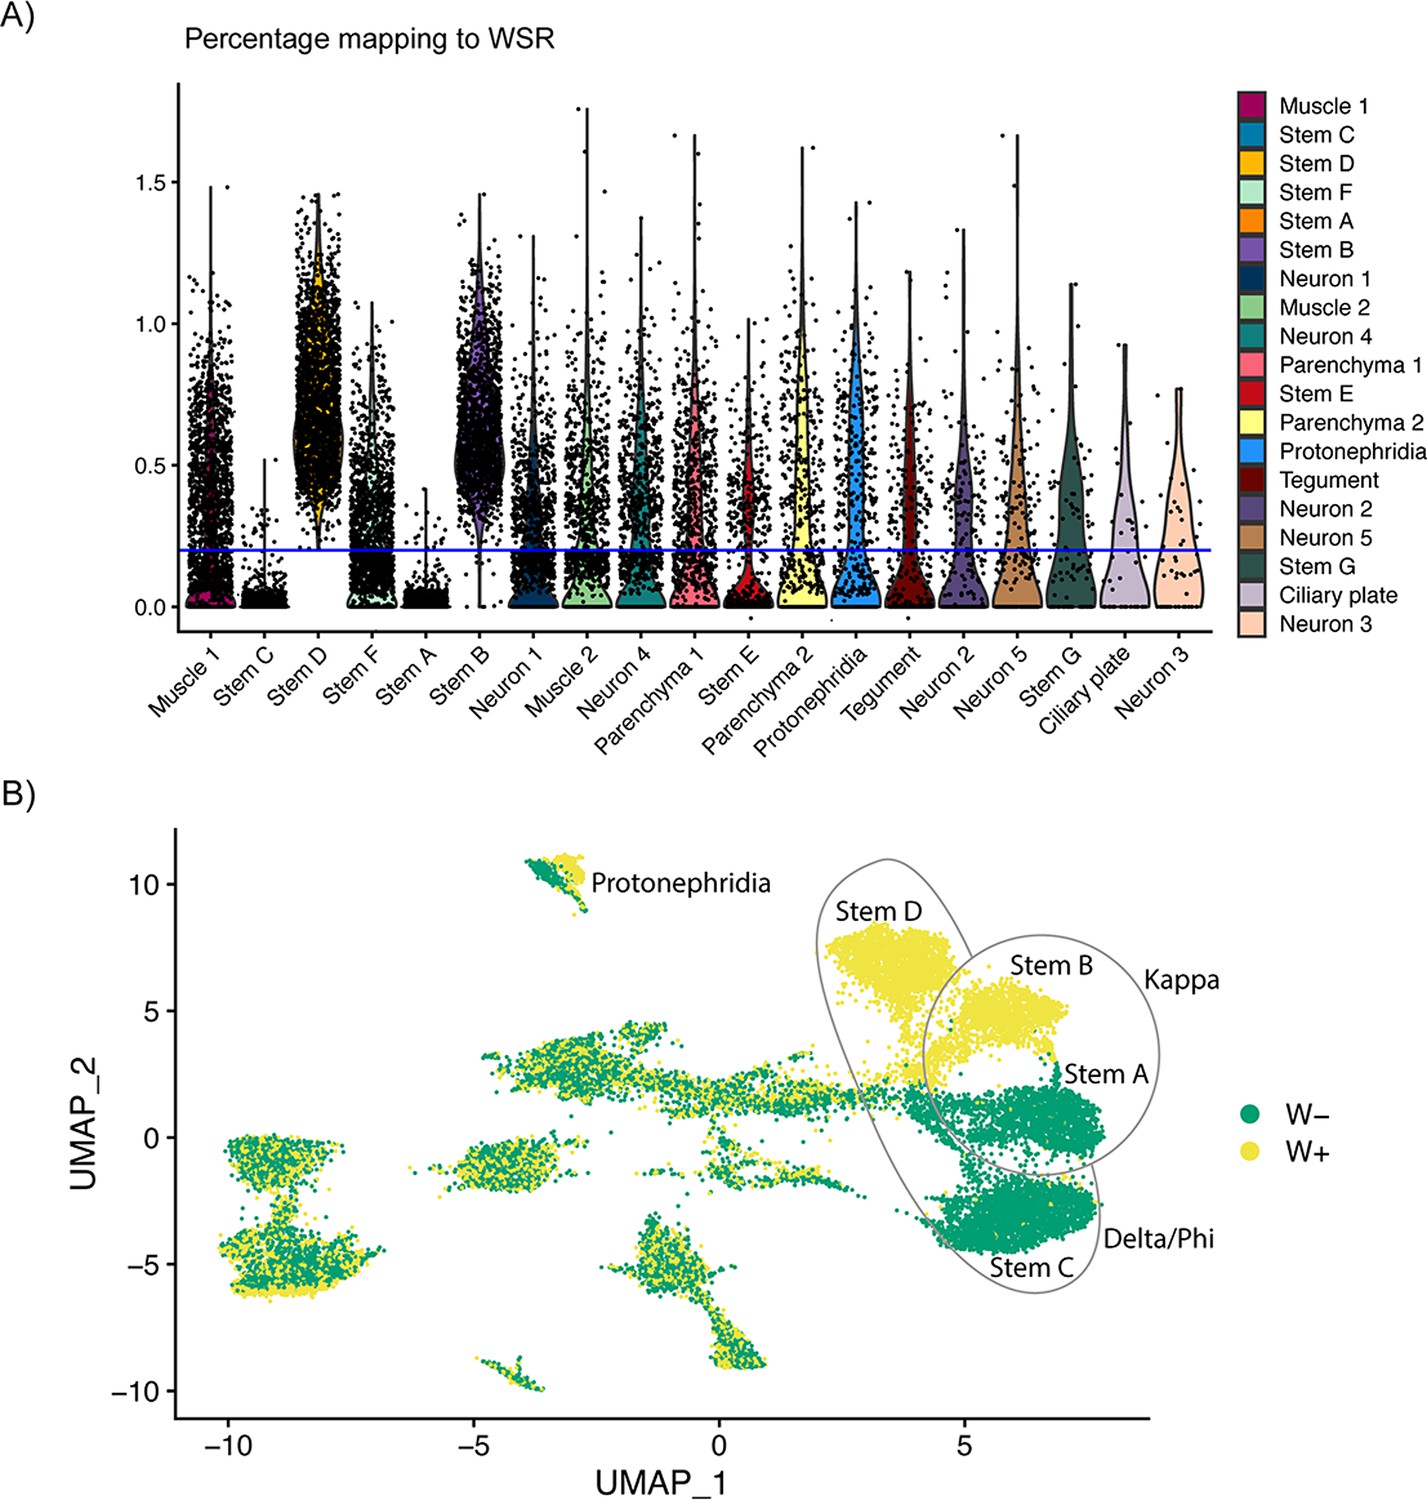
Classification of cells based on percentage of reads mapping to W-specific region indicates incomplete dosage compensation of Z-specific region genes.
(A) The percentage of reads mapping to W-specific genes by cluster. The blue line at 0.2% indicates where the data were split into W+ and W− categories, that is Stems B and D contain cells with reads mapping to W-specific genes (and are likely cells from female miracidia), whereas most cells in Stems A and C do not have reads mapping to W-specific genes (cells from male miracidia). (B) UMAP showing the clusters by W+ and W− categories. Almost complete separation can be seen in the main stem cell clusters, and the categories are mixed in most other clusters.
Figure 5—figure supplement 5

5-ethynyl-2′-deoxyuridine (EdU) labelling shows that there are no dividing cells during the free-swimming miracidia stage.
(A) Four-hour EdU pulse on miracidia 0–6 hr post-hatching shows no EdU incorporation in any cells. (B) Negative control. (C) Positive control, 3-day EdU pulse on freshly transformed mother sporocysts shows many dividing cells incorporating EdU, all treatments n = 30. Scale bar = 10 µm.
Figure 5—figure supplement 6
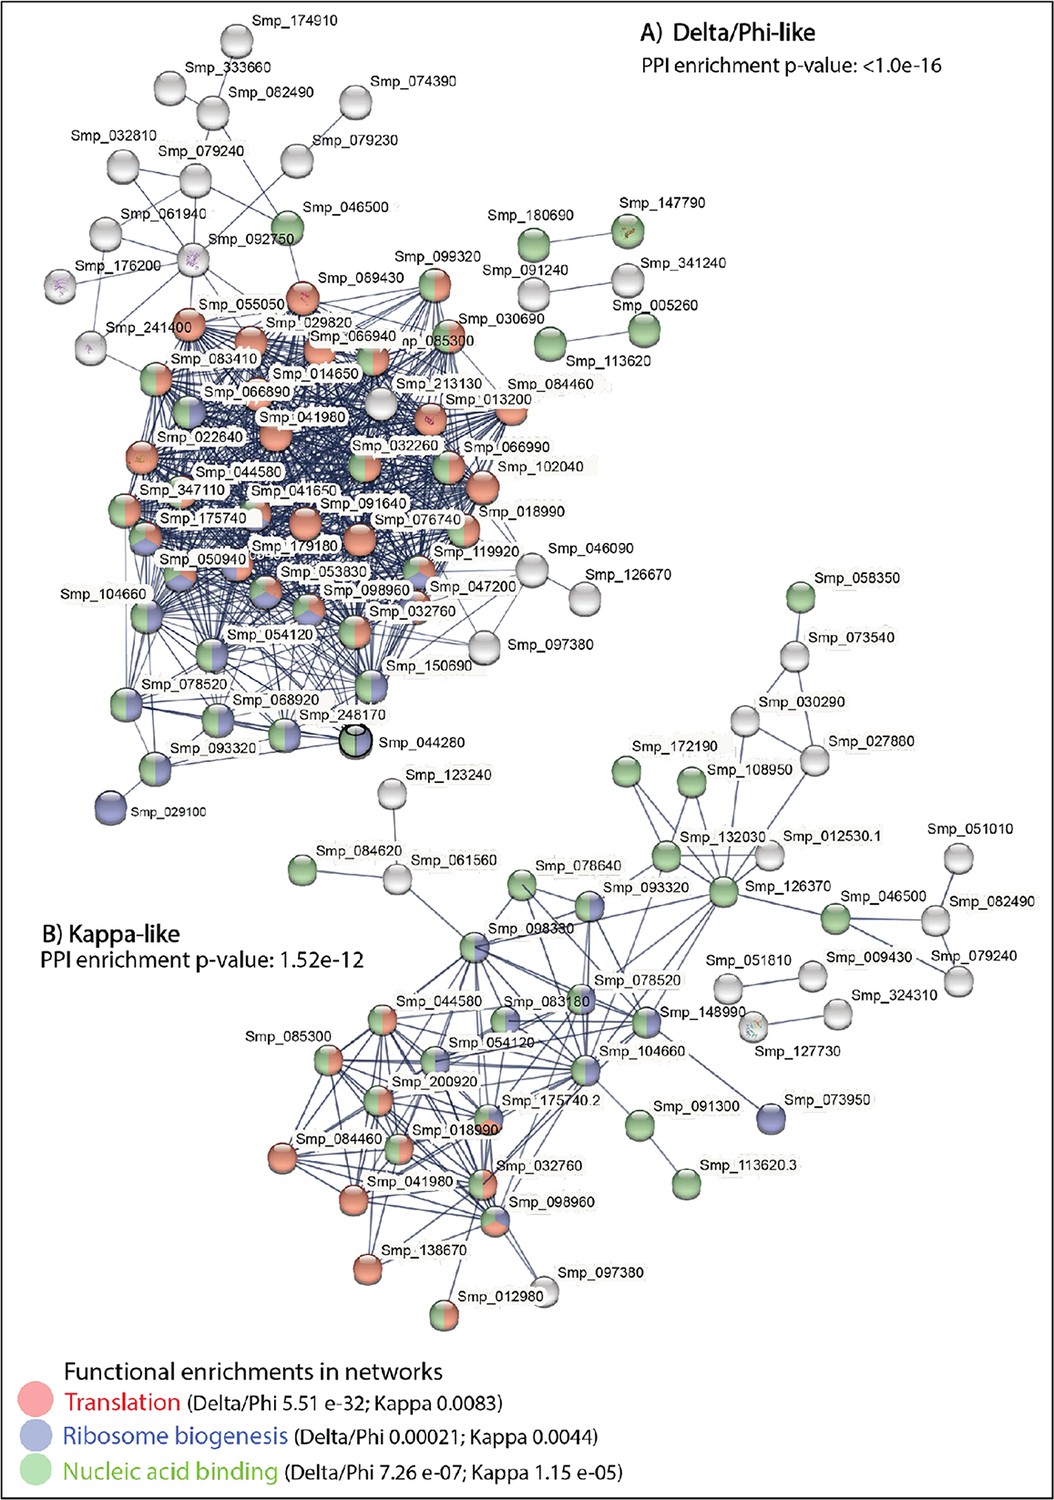
STRING analysis of the top 100 marker genes for the two stem cell populations in the miracidium (combining the female and male cells).
(A) Sixty-one of the top markers of Stems C and D combined (i.e. Delta/Phi-like) and (B) 37 for Stems A and B combined (i.e. Kappa-like) form large predicted interactions enriched for translation, ribosome biogenesis, and nucleic acid binding. Lines (edges) connecting nodes are based on evidence of the function of homologues. Functional enrichment (FDR) as provided by STRING. PPI = predicted protein interaction. Minimum interaction (confidence) score of 0.7, corresponding to a high level of confidence.
Figure 5—figure supplement 7
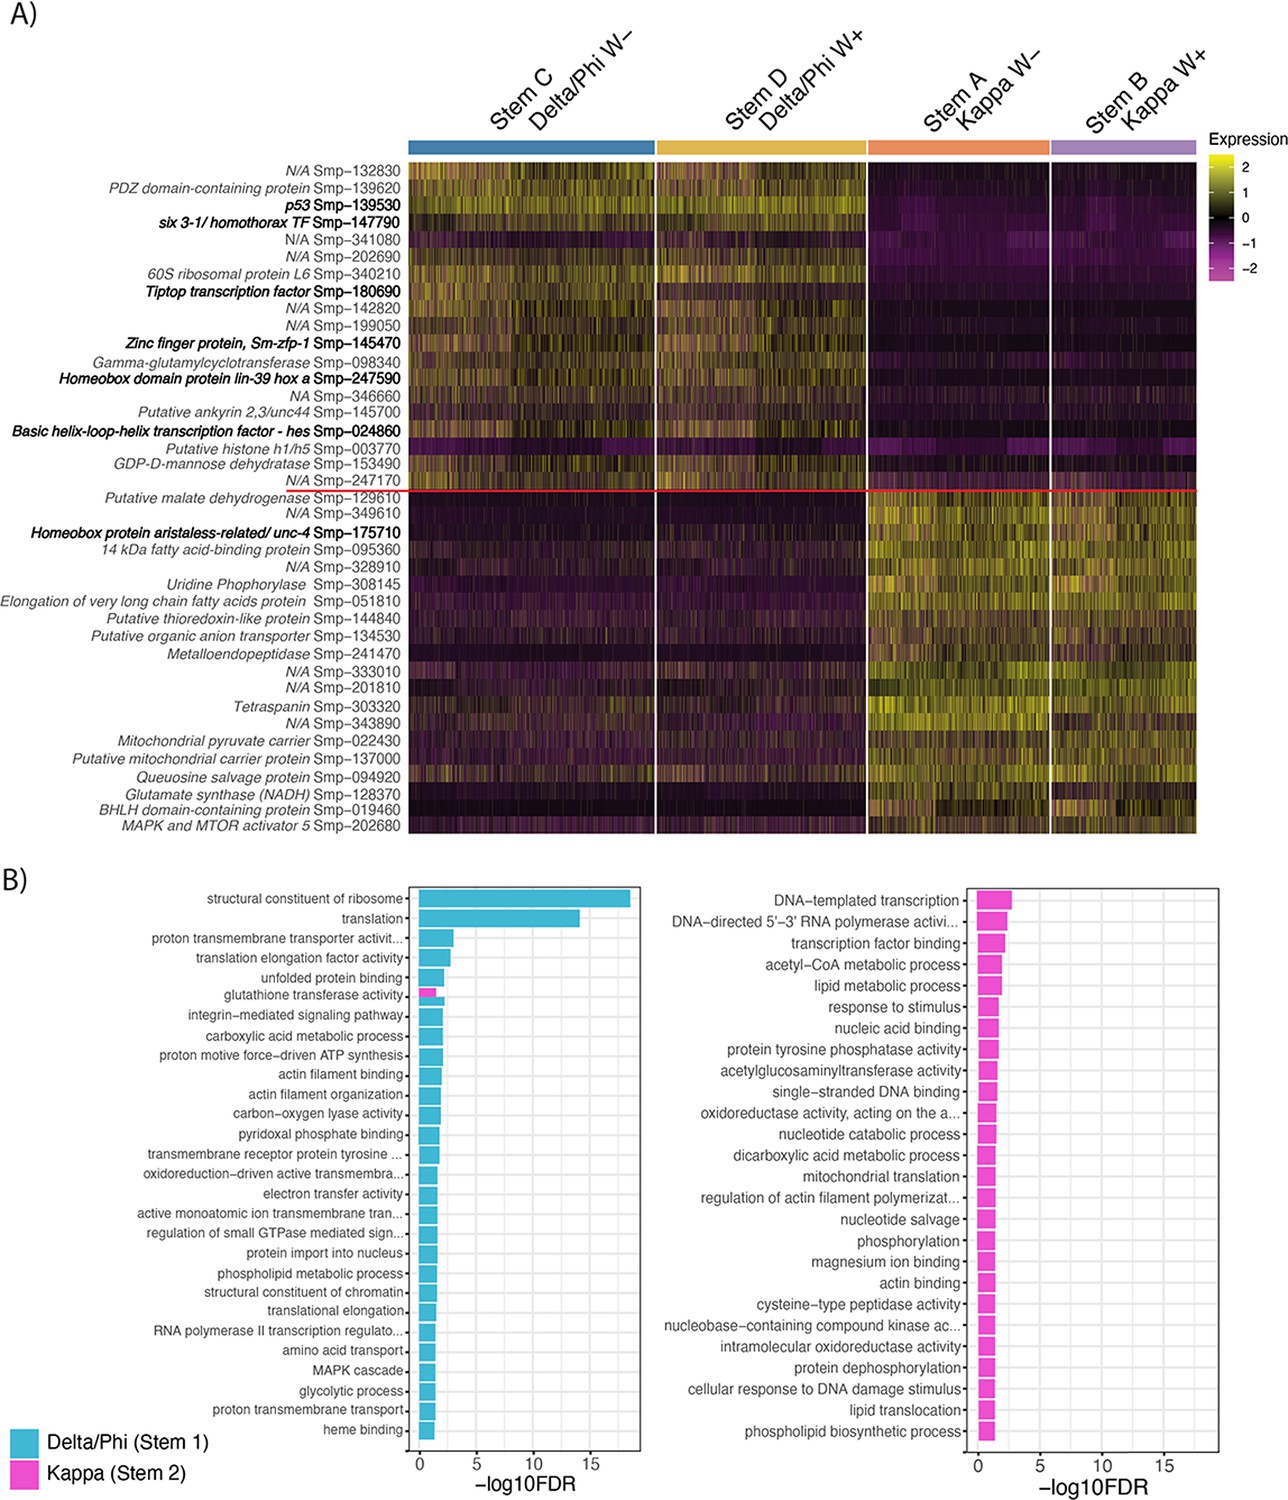
Differential gene expression between the two stem cell populations, Delta/Phi and Kappa.
(A) Heatmap of top differentially expressed genes (by adjusted p-value) from each of Delta/Phi and Kappa populations show a high number of transcription factors (bold) in Delta/Phi and enrichment of lipid and glycolytic metabolism genes in Kappa. Gene expression has been log-normalised and scaled using Seurat(v. 4.3.0). (B) Gene ontology analysis of DEG (adj p < 0.001) revealed that upregulated genes in Delta/Phi were related to the structural constituent of the ribosome and translation, while upregulated genes in Kappa were related to transcription and metabolism.
Figure 5—video 1
Confocal z-stack of wholemount in situ hybridisation (WISH) of markers for stem clusters Delta/Phi p53 (Smp_139530) (cyan), Kappa UPPA (Smp_308145) (green), and stem E Phosphomevalonate kinase (Smp_072460) (magenta), counterstained with DAPI (white), shows there are no cells that are pmk-positive but negative for UPPA and p53.
Stem E cells cannot be validated in situ. Scale bar = 10 μm.
Figure 5—video 2
Confocal z-stack of wholemount in situ hybridisation (WISH) of markers for stem clusters Delta/Phi p53 (Smp_139530) (cyan), Kappa UPPA (Smp_308145) (magenta), and the pan-stem marker ago2-1 (Smp_179320) (green), counterstained with DAPI (white), shows there are no cells that are ago2-1 positive but negative for UPPA and p53 that could be Stem F and G cells.
Scale bar = 10 μm.
Figure 6 with 6 supplements
RNA velocity analysis of stem and tegument cells from the miracidium and sporocyst shows lineage-specific gene dynamics.
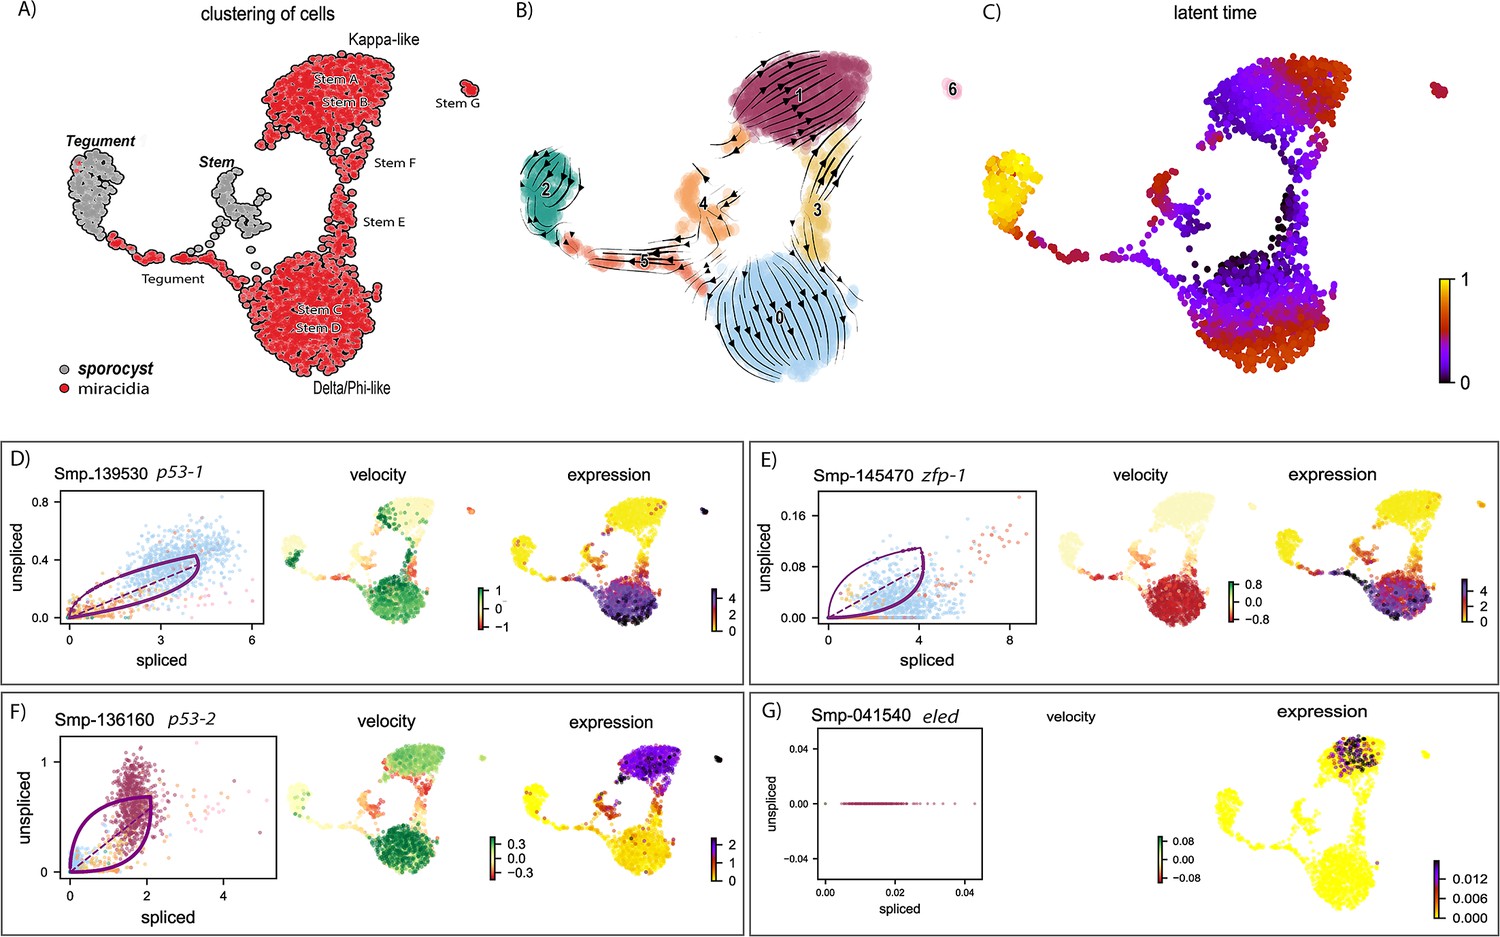
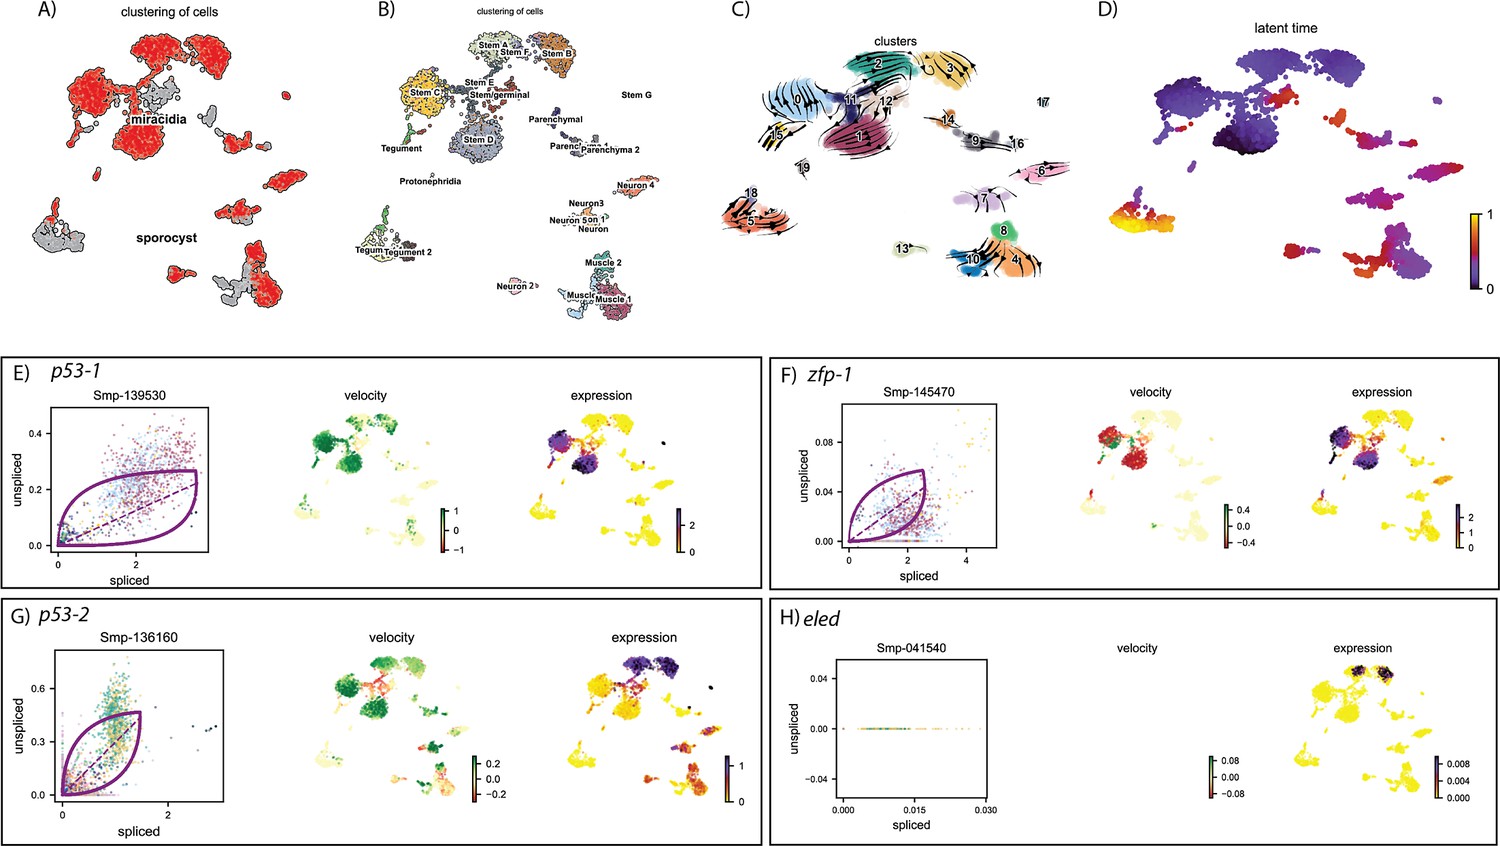
(A) UMAP shows the life cycle stage origin of cells and cell cluster identity from Seurat analysis. (B) RNA velocity analysis flow field shows the generalised direction of RNA velocity. (C) Latent time analysis shows an estimated temporal relationship between cells. (B and C) are based on the expression of both spliced and unspliced transcripts, and their expression dynamics across cells and genes. The phase plot, velocity, and expression were calculated for (D) p53-1, (E) Zfp-1, (F) p-53-2, and (G) eled (no batch correction). Gene expression has been normalised using counts per million (CPM Expanded and re-phrased) and log-transformed using scvelo(v. 0.2.4). For all of (D–G), the phase plot (left plot) shows the proportion of spliced and unspliced transcripts in each cell, where each point is a cell and is coloured by the clusters in (B). The purple almond-shape overlaid represents the processes of transcription, splicing, and degradation, where this can be modelled. The dashed line shows the estimated steady state where RNA transcription is constant. The middle panel shows the RNA velocity, which for each gene is based on how the observations deviated from the estimated steady state towards induction or repression. The right panel shows gene expression. p53-1 and zfp-1 are predominantly expressed in the Delta/Phi-like miracidia stem cells and some miracidia tegument, and velocity indicates active expression of p53-1 but downregulation of zfp-1 in the stem cells. p53-2 is most highly expressed in the Kappa-like miracidia stem cells, and velocity indicates this gene is being actively transcribed. eled expression is very low and only spliced transcripts have been detected, but is generally restricted to the Kappa-like miracidia stem cells.
Figure 6—figure supplement 1
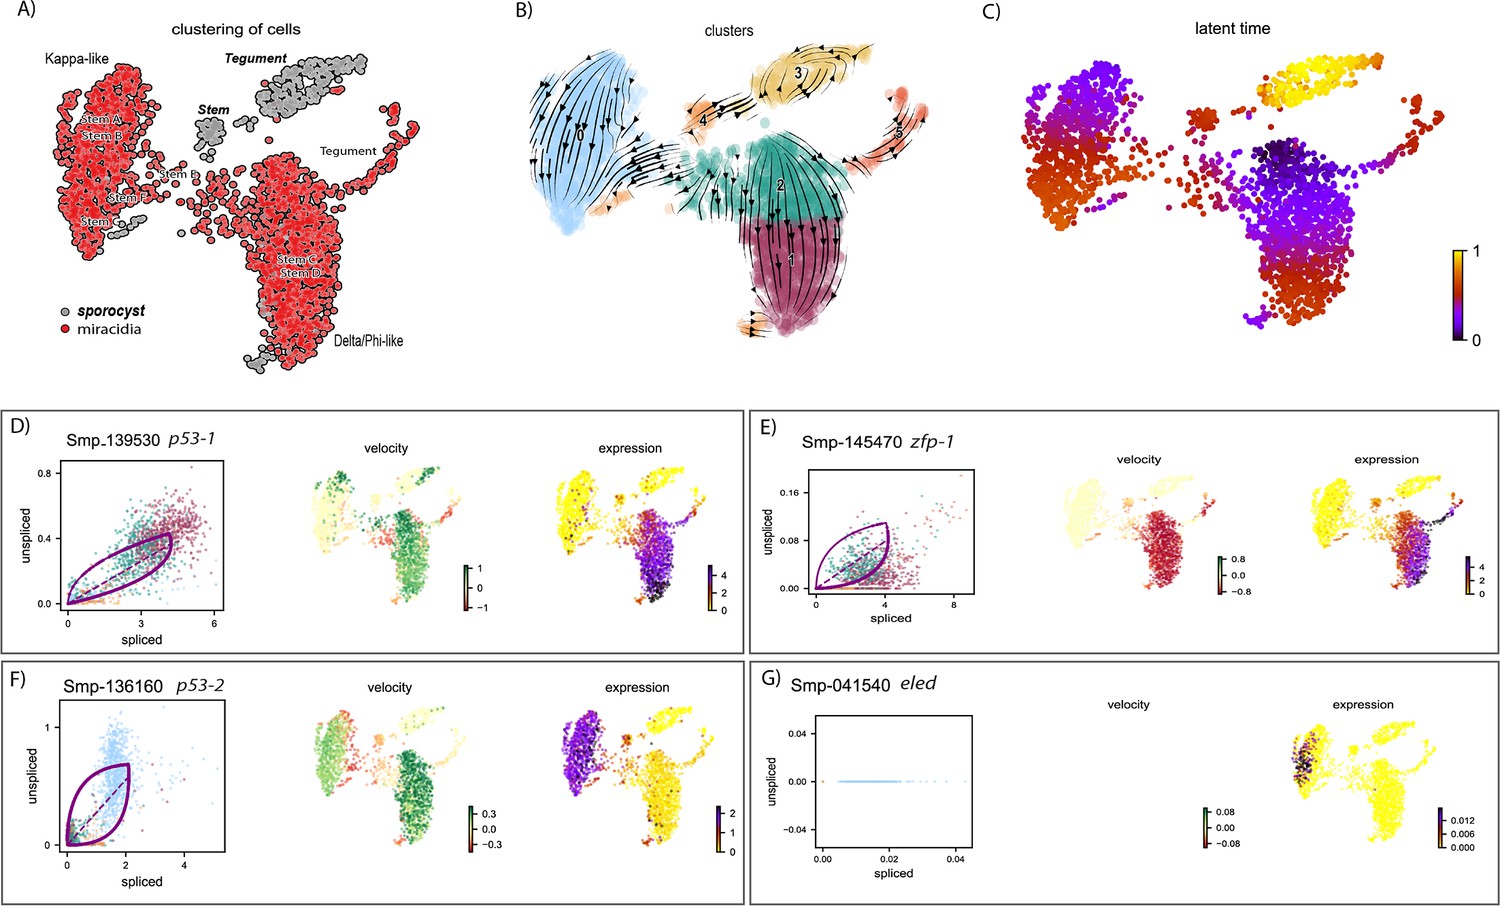
RNA velocity analysis of stem and tegument cells from the miracidium and sporocyst (with batch correction) shows lineage-specific gene dynamics.
(A) UMAP shows the life cycle stage origin of cells and cell cluster identity from Seurat analysis. (B) RNA velocity analysis flow field shows generalised direction of RNA velocity. (C) Latent time analysis shows an estimated temporal relationship between cells. The phase plot, velocity, and expression were calculated for (D) p53-1, (E) Zfp-1, (F) p-53-2, and (G) eled. Gene expression has been normalised (CPM) and log-transformed using scvelo(v. 0.2.4). p53-1 and zfp-1 are predominantly expressed in the Delta/Phi-like miracidia stem cells and miracidia tegument, and velocity indicates active expression of p53-1 butdownregulation of zfp-1 in the stem cells. p53-2 is most highly expressed in the Kappa-like miracidia stem cells, and velocity indicates this gene is being actively transcribed. eled expression is very low and only spliced transcripts have been detected, but is generally restricted to the Kappa-like miracidia stem cells.
Figure 6—figure supplement 2
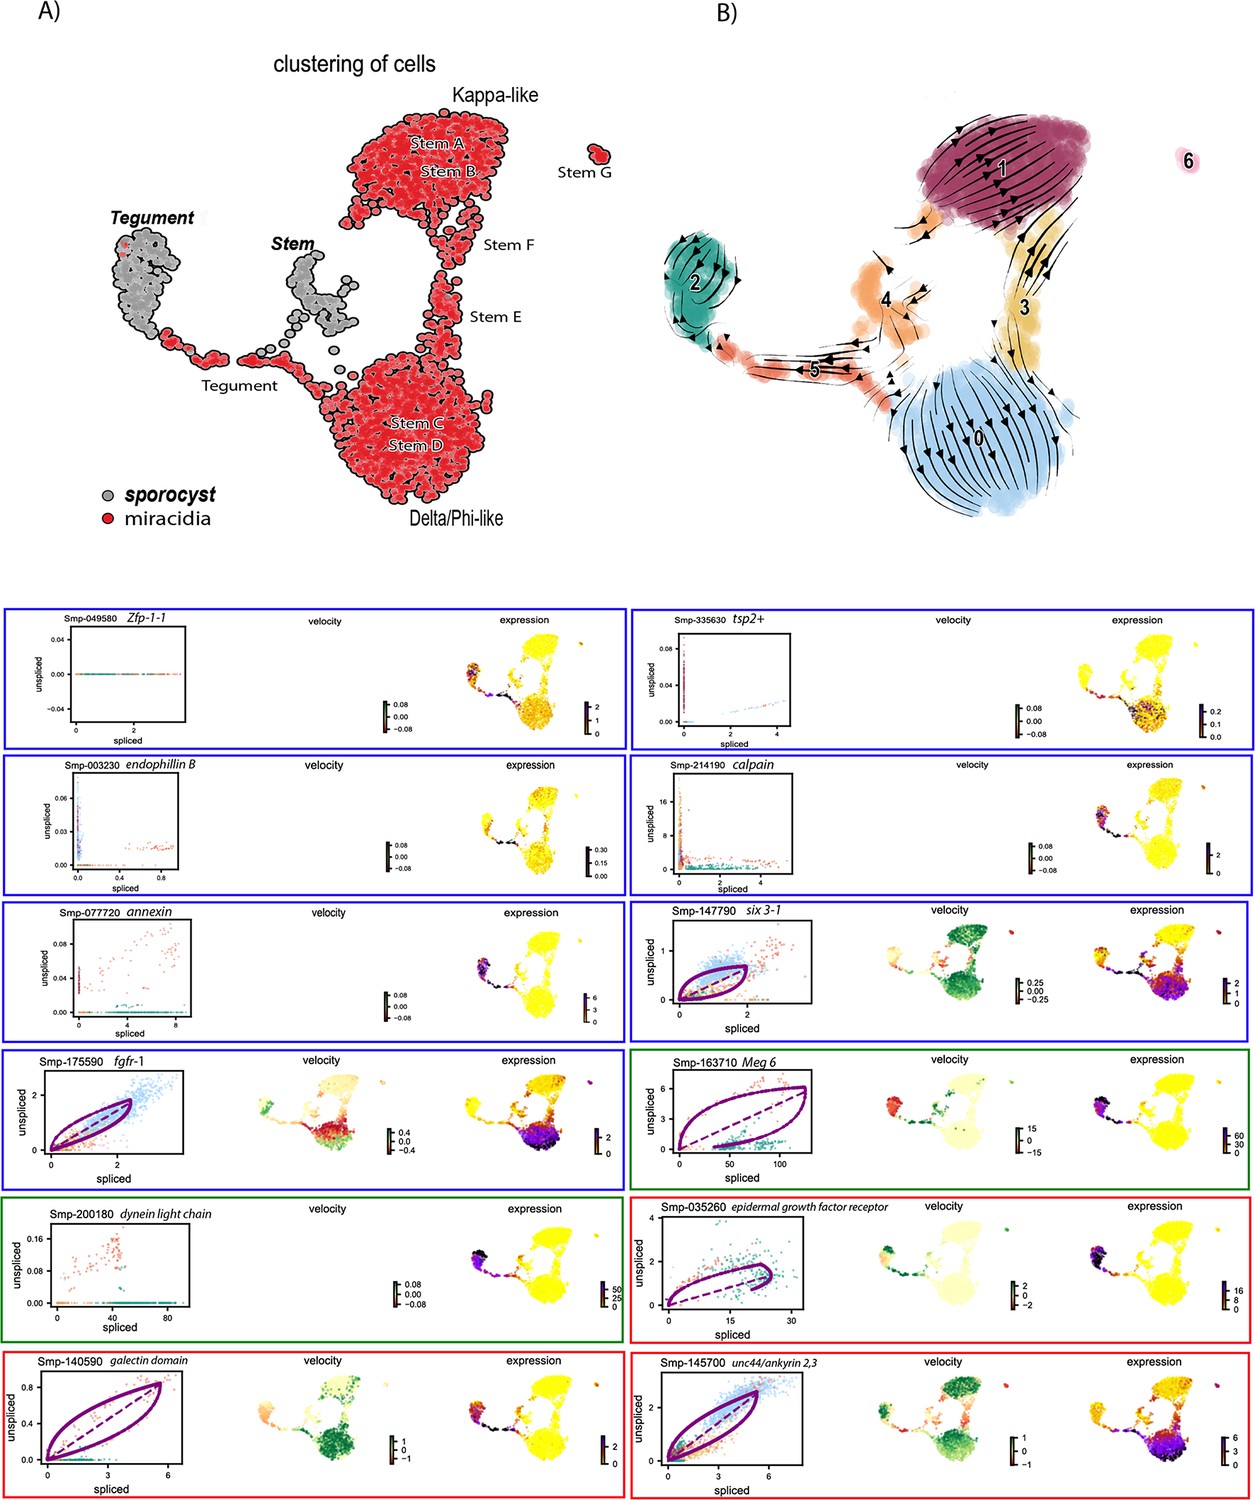
RNA velocity analysis of stem and tegument cells from the miracidium and sporocyst (without batch correction).
(A) UMAP shows the life cycle stage origin of cells and cell cluster identity from Seurat analysis. (B) RNA velocity analysis flow field shows generalised direction of RNA velocity. Phase plot, velocity, and expression as calculated for genes mentioned in text: blue outline = known molecular regulators of tegument development and tegument markers in adult S. mansoni and planaria. Green outline = miracidia and sporocyst tegument marker genes. Red outline = genes revealed by RNA velocity analysis to be highly dynamic in the Delta/Phi, miracidia, and sporocyst tegument cells. Gene expression has been normalised (CPM) and log-transformed using scvelo(v. 0.2.4).
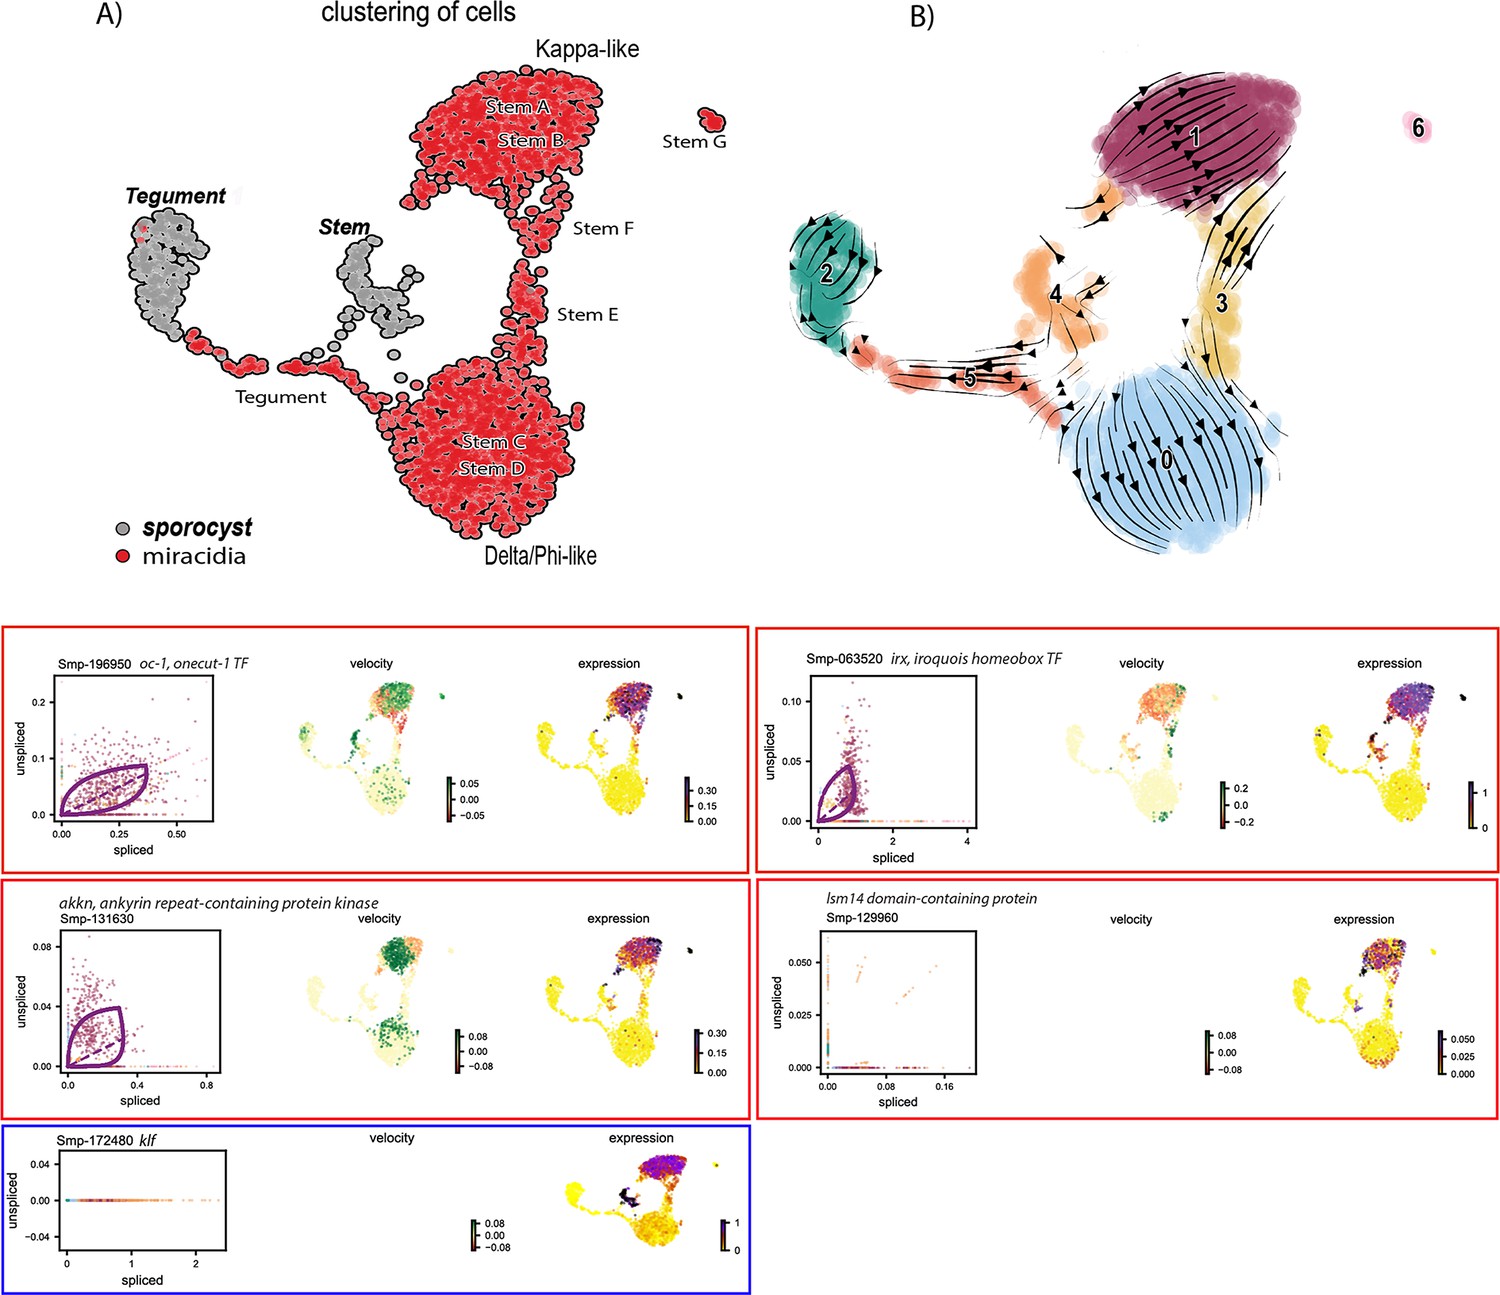
Figure 6—figure supplement 3
RNA velocity analysis of stem and tegument cells from the miracidium and sporocyst (without batch correction).
(A) UMAP shows the life cycle stage origin of cells and cell cluster identity from Seurat analysis. (B) RNA velocity analysis flow field shows generalised direction of RNA velocity. Phase plot, velocity, and expression as calculated for genes that are mentioned in the text: red outline = known molecular regulators of germline stem cells in adult S. mansoni. Blue outline = pluripotency gene. Oc-1 expression is low with little velocity signal, but the expression is predominantly seen in the Kappa-like miracidia stem cells (and Stem G). Irx is also primarily expressed in the Kappa-like miracidia stem cells with velocity results indicating an accumulation of spliced transcripts. Irx transcripts are also detected in Stem G and the sporocyst stem/germinal cells. Akkn expression is low and largely seen in the Kappa-like and Stem G miracidia stem clusters. Lsm14 domain-containing protein transcripts are most consistently expressed in the Kappa-like miracidia stem cells. Klf is most highly expressed in sporocyst stem/germinal cells, and the Kappa-like miracidia stem cluster. Gene expression has been normalised (CPM) and log-transformed using scvelo(v. 0.2.4).
Figure 6—figure supplement 4
RNA velocity analysis of all tissue types from the miracidium and sporocyst shows lineage-specific gene dynamics.
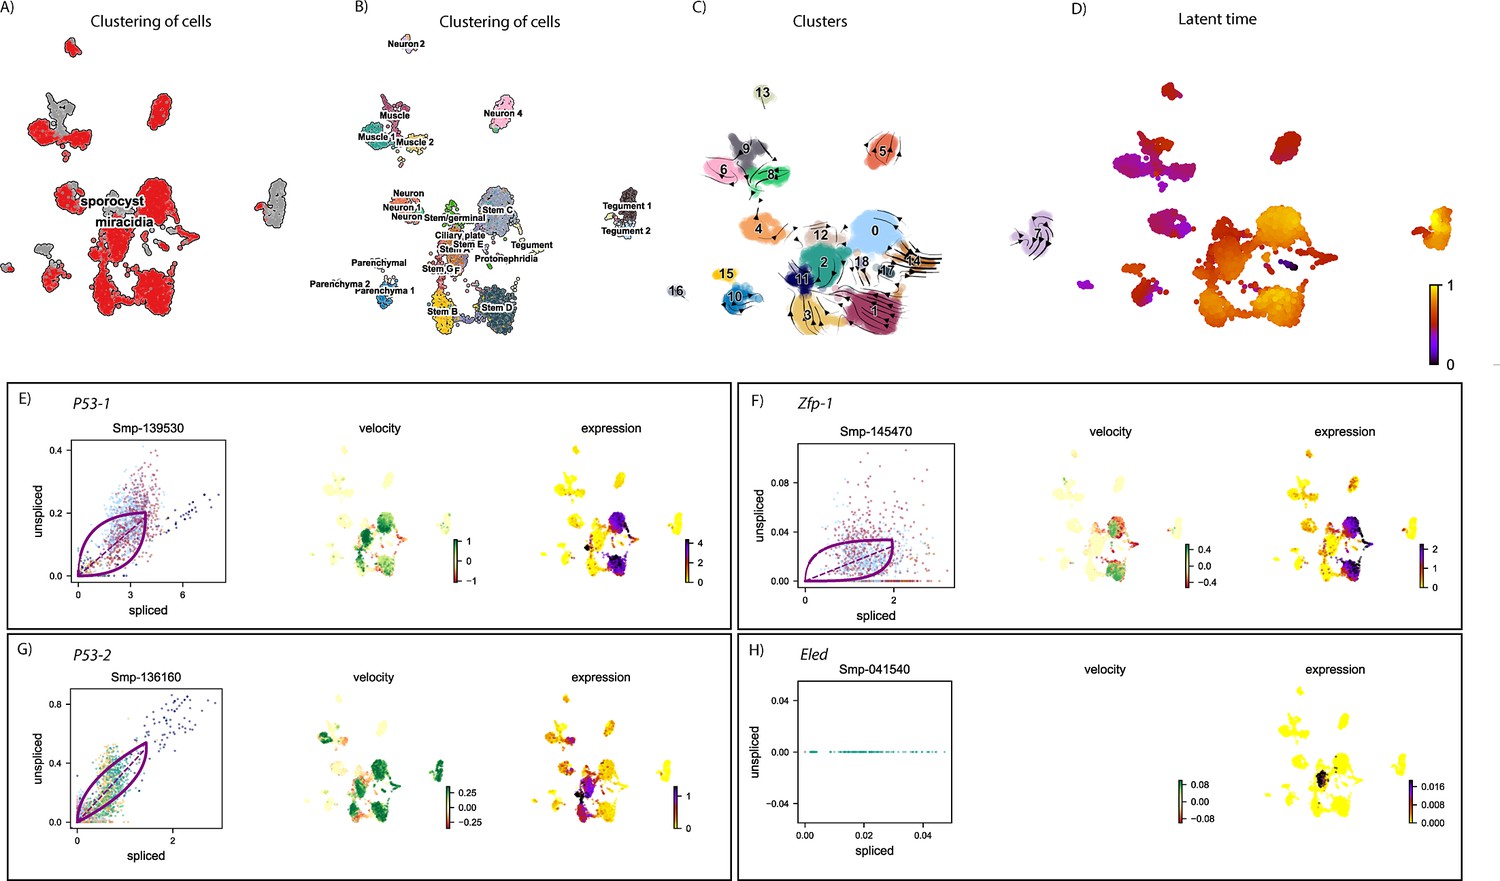
(A) UMAP shows the life cycle stage origin of cells and (B) shows cell cluster identity from Seurat analysis. (C) RNA velocity analysis flow field shows the generalised direction of RNA velocity. (D) Latent time analysis shows an estimated temporal relationship between cells. Phase plot, velocity, and expression as calculated for (E) p53-1, (F) Zfp-1, (G) p-53-2, and (H) eled (no batch correction, sporocyst cells combined with miracidia sample 1 cells). P53-1 is most highly expressed in the Delta/phi-like miracidia stem clusters and some of the miracidia tegument cells, and the velocity indicates active transcription. Zfp-1 is expressed most highly in the same clusters, but velocity suggests that the majority of transcripts are spliced. P53-2 expression is highest in the Kappa-like miracidia stem clusters, but the expression is detected in several other clusters, including muscle, neuron, and other stem clusters. Velocity indicates that this gene is being actively transcribed in the majority of these clusters. Eled expression is very low, but restricted to the Kappa-like miracidia stem clusters. Gene expression has been normalised (CPM) and log-transformed using scvelo(v. 0.2.4).
Figure 6—figure supplement 5
RNA velocity analysis of all tissue types from the miracidium and sporocyst shows the dynamics of described germline-related genes.
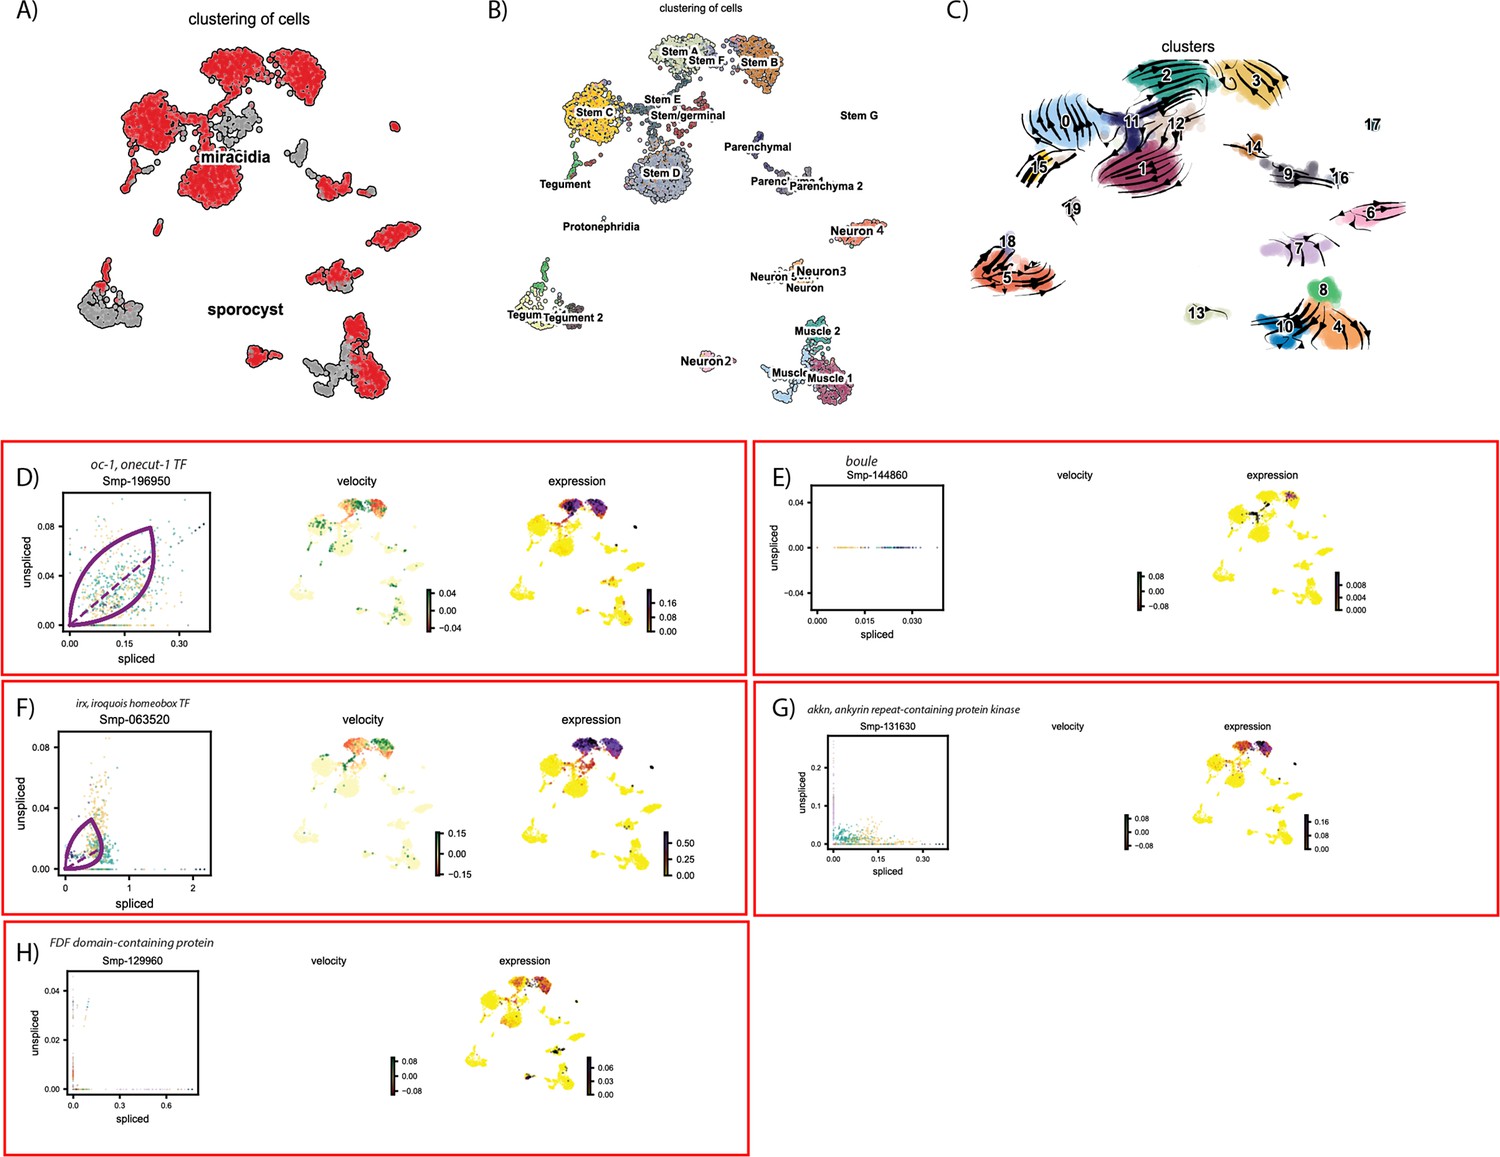
(A) UMAP shows the life cycle stage origin of cells and (B) shows cell cluster identity from Seurat analysis. (C) RNA velocity analysis flow field shows the generalised direction of RNA velocity. Phase plot, velocity, and expression as calculated for (D) oc-1, (E) boule, (F) irx, (G) akkn, and (H) an FDF domain-containing protein (no batch correction, sporocyst cells combined with miracidia sample 1 cells.). Oc-1 expression is low but generally specific to the two Kappa-like miracidia stem cell clusters, and Stem G. Only spliced Boule transcripts were detected, and with low expression, predominantly in the Stem B and E clusters. Irx was most highly expressed in Kappa-like miracidia stem clusters, as well as Stem E, Stem G, and sporocyst stem/germinal cells. Akkn is also largely expressed in the Kappa-like miracidia stem clusters. The FDF domain-containing protein expression is low, but seen most in Kappa-like miracidia stem clusters, Stem G, and several neural clusters. Gene expression has been normalised (CPM) and log-transformed using scvelo(v. 0.2.4).
Figure 6—figure supplement 6
RNAvelocity analysis of all tissue types from the miracidium and sporocyst shows lineage-specific gene dynamics.
(A) UMAP shows the life cycle stage origin of cells and (B) shows cell cluster identity from Seurat analysis. (C) RNA velocity analysis flow field shows the generalised direction of RNA velocity. (D) Latent time analysis shows an estimated temporal relationship between cells. Phase plot, velocity, and expression as calculated for (E) p53-1, (F) Zfp-1, (G) p-53-2, and (H) eled (no batch correction, sporocyst cells combined with miracidia sample four cells). p53-1 and zfp-1 are predominantly in the Delta/Phi-like miracidia stem cell clusters (Stems C and D) and also in the miracidia tegument. Velocity indicates that p53-1 is being induced in the stem cells and repressed in the tegument, while zfp-1 shows a gradient of velocity in the stem cells and repression in the tegument. P53-2 is most highly expressed in the Kappa-like miracidia stem cells (Stems A and B) and Stem F, with velocity results indicating active transcription. eled expression was very low, but primarily in the Kappa-like miracidia stem cells (particularly Stem A). Gene expression has been normalised (CPM) and log-transformed using scvelo(v. 0.2.4).
Figure 7
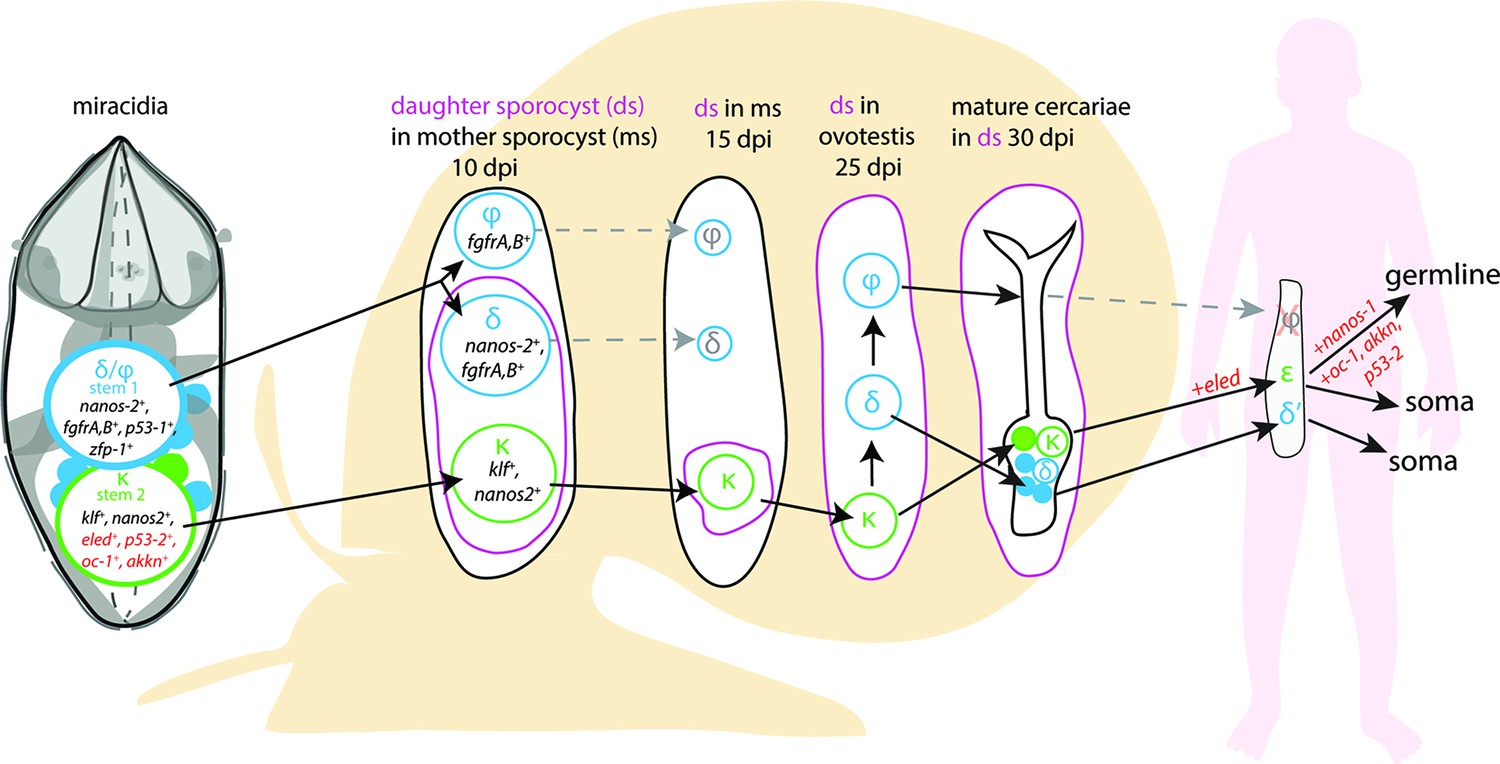
A model for the fate of the two stem populations in the miracidium.
Adding single-cell data for miracidia stem cells (this study) to existing stem cell scenarios on Schistosoma mansoni development (Wang et al., 2018; Li et al., 2021) show the continuum of the Kappa (κ) population from the miracidium, through the intra-molluscan stages to the juvenile and adult stages inside the mammalian host. Wang et al., 2018 proposed that the κ cells give rise to epsilon (ε), eled+, cells in the juvenile primordial testes, ovaries, and vitellaria (germline), as well as in a gradient increasing towards the posterior growth zone (soma). They suggested that germ cells may be derived from ε-cells early in juvenile development, and eled is the earliest germline marker yet identified in schistosomes. This led to the idea that S. mansoni does not specify its germline until the juvenile stage (Wang et al., 2018) and a germline-specific regulatory programme (including eled, oc-1, akkn, nanos-1, boule) was identified in intra-mammalian stages (Wang et al., 2018; Li et al., 2021). We show expression of these genes in κ stem cells in the miracidium. This suggests that after ~6 days of embryogenesis, at hatching of the miracidium, the cells that may contribute to the germline might already be segregated into the κ population and the molecular regulatory programme that differentiates somatic (delta/phi, δ/ᵩ) and germ cell (κ) lineages is present. Furthermore, as p53-2 plays a genotoxic stress response role in adult reproductive cells (Wendt et al., 2022), its expression in κ cells in the miracidia is another line of evidence that indicates that this population may contain the pluripotent stem cells that likely give rise to the germline.
Figure 8 with 3 supplements
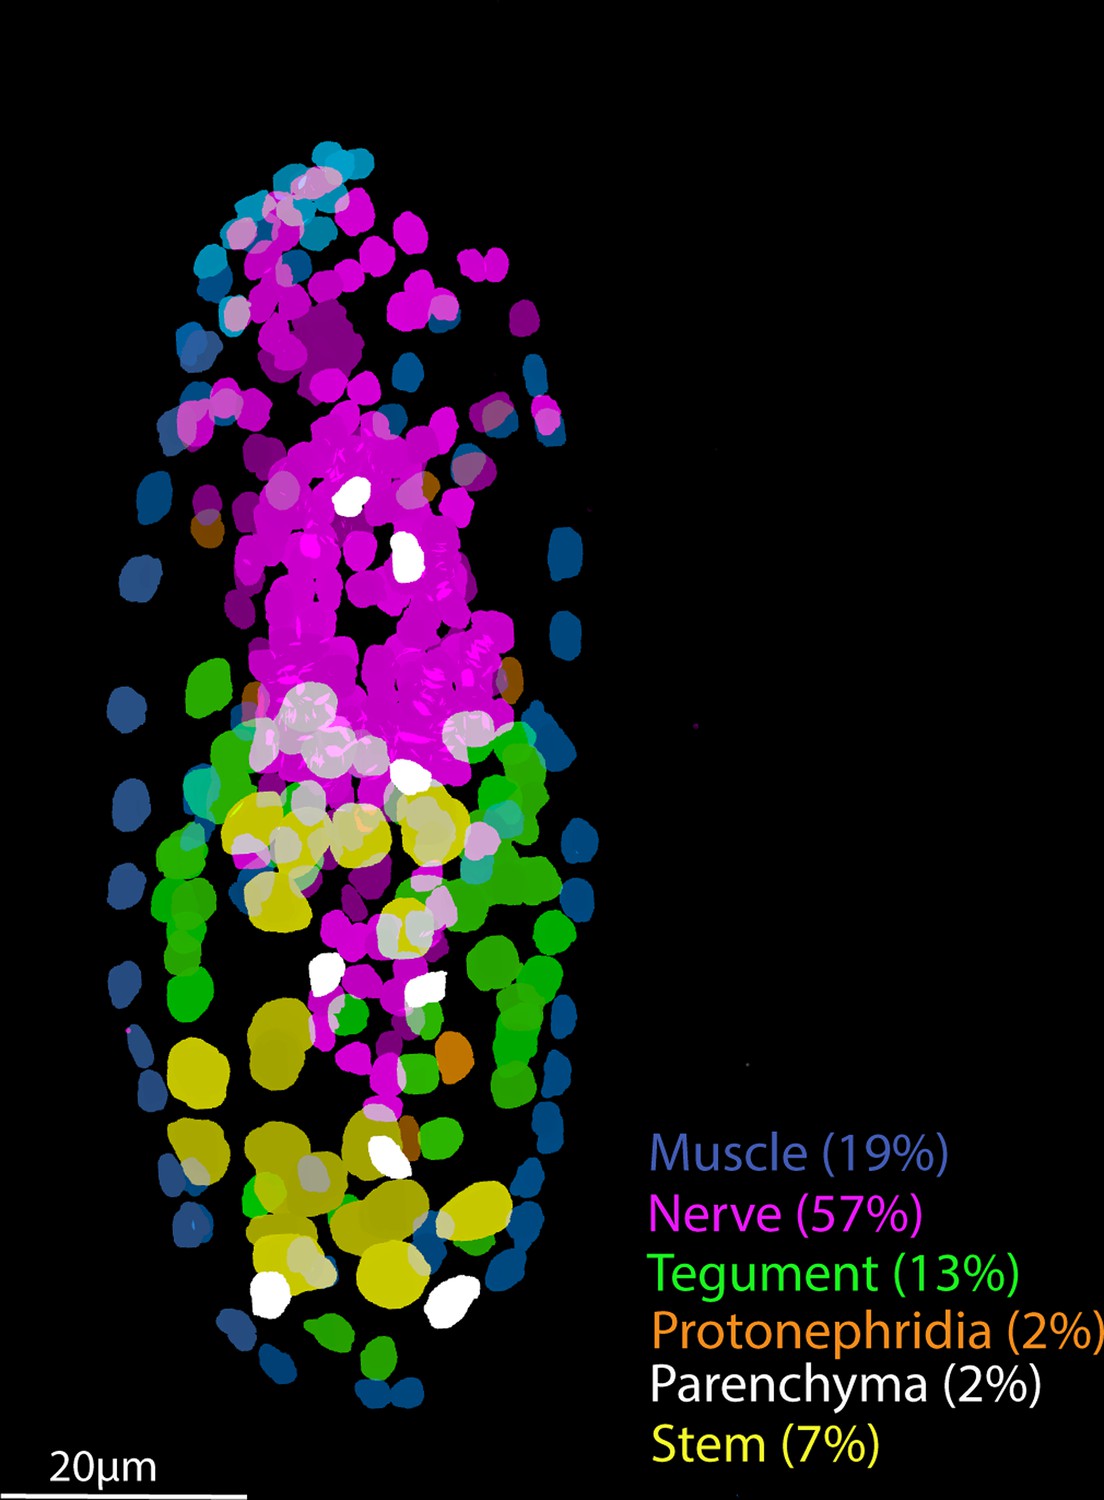
Tissue-level segmentation of a miracidium reveals the contribution of each tissue to this simple larva.
In situ hybridisation using HCR (hybridisation chain reaction) enabled multiple tissue-level marker genes to be visualised simultaneously in the same larva. The nuclei of the cells of each tissue type were manually segmented using TrakEM2 in ImageJ (Cardona et al., 2012).
Figure 8—video 1
Confocal z-stack of multiplexed wholemount in situ hybridisation (WISH) of tissue markers for stem ago2-1 (Smp_179320) (green), muscle paramyosin (Smp_085540) (cyan), and nerve complexin (Smp_050220) (magenta).
Scale bar = 10 μm.
Figure 8—video 2
Confocal z-stack of multiplexed wholemount in situ hybridisation (WISH) of tissue markers for parenchyma (Smp_318890) (green), stem ago2-1 (Smp_179320) (cyan), and tegument Meg6 (Smp_163710) (magenta).
Scale bar = 10 μm.
Figure 8—video 3
Confocal z-stack of multiplexed wholemount in situ hybridisation (WISH) of tissue markers for tegument Meg6 (Smp_163710) (green) and protonephridia ShKT-domain-containing protein (Smp_335600) (magenta).
Scale bar = 10 μm.
Author response image 1

UMAP showing subclustering of Neuron 1 cluster in Seurat (SCT normalisation, PC = 19, resolution = 0.3).
Author response image 2

Coexpression UMAP showing the expression of stem cell marker Ago2-1 and neural marker complexin.
Author response image 3
UMAPs showing the expression five putative neurogenins of S.
mansoni.
Author response image 4

Image showing a maximum intensity projection of a subvolume of a confocal z-stack of a miracidia wholemount in situ hybridisation (by HCR) for paramyosin counterstained with a beta catenin antibody (1:600 concentration of Sigma C2206).
The cell membrane of a lateral gland is clearly labelled, but those of the neurons of the brain and the paramyosin+ muscle cells are not.
Author response image 5

Image showing the diversity of nucleus morphology between tissue types in the miracidium.
Author response image 6
Tables
Key resources table
| Reagent type (species) or resource | Designation | Source or reference | Identifiers | Additional information |
|---|---|---|---|---|
| Strain, strain background (Schistosoma mansoni) | NMRI strain | Wellcome Sanger Institute | ||
| Sequence-based reagent | Probes used for in situ hybridisation | Molecular Instruments | Lot numbers in Supplementary file 1r | |
| Commercial assay or kit | Chromium Next GEM Single Cell 3′ Reagent Kits v3.1, 10X Genomics 4 rxns | 10X Genomics | Cat# PN-1000128 | |
| Chemical compound, drug | Native Bacillus licheniformis Protease | Creative Enzymes | Cat# NATE-0633 | |
| Chemical compound, drug | Liberase TM (Thermolysin Medium) | Roche | Cat# LIBTM-RO | |
| Commercial assay or kit | NEB Next Cell Lysis Buffer | NEB | E6428 | |
| Commercial assay or kit | NEB low input RNA kit | NEB | E6420 | |
| Commercial assay or kit | NEBNext Ultra II FS DNA Library Prep Kit for Illumina | NEB | E7805 | |
| Software, algorithm | ImageJ (Fiji) Version 2.1.0 | Fiji | https://imagej.net/Fiji | |
| Software, algorithm | R 3.6.2 | The R foundation | https://www.r-project.org/ | |
| Software, algorithm | RStudio 1.3.1056 | Rstudio | https://rstudio.com | |
| Software, algorithm | Python 3.8.5 | Python | https://www.python.org/downloads/ | |
| Software, algorithm | Cell Ranger 6.0.1 | Cell Ranger | https://www.10xgenomics.com/support/software/cell-ranger/latest | |
| Software, algorithm | Seurat 4.3.0 | Seurat | https://satijalab.org/seurat/articles/install.html | |
| Software, algorithm | kallisto bustools 0.27.3 | kallisto bustools | https://www.kallistobus.tools/ | |
| Software, algorithm | Scanpy 1.8.2 | Scanpy | https://scanpy.readthedocs.io/en/stable/ | |
| Software, algorithm | scvelo 0.2.4 | scvelo | https://scvelo.readthedocs.io/en/stable/ | |
| Software, algorithm | kallisto 0.44.0 | kallisto; Melsted et al., 2021 | https://pachterlab.github.io/kallisto/ | |
| Software, algorithm | SAM 1.0.1 | SAM; Tarashansky et al., 2019; Zanini and Tarashansky, 2022 | https://github.com/atarashansky/self-assembling-manifold | |
| Other | WormBase ParaSite Release 18 | WormBase ParaSite | https://parasite.wormbase.org/Schistosoma_mansoni_prjea36577/Info/Index/ | Genome version 10 |
| Software, algorithm | Adobe Creative Cloud | Adobe | https://www.adobe.com |
Additional files
-
Supplementary file 1
All supplementary tables relating to this study.
(a) Samples and single cell RNA-seq (scRNA-seq) mapping statistics. (b) Seurat marker genes in all cell clusters. (c) Seurat top 5 marker genes in all cell clusters. (d) Contribution of sorted and unsorted samples to the 19-cell clusters. (e) Muscle clusters 1 and 2 differential gene expression analysis. (f) Marker genes for Neuron 1 self-assembling manifold (SAM) subclusters. (g) Gene ontology (GO) enrichment terms. (h) Top 200 genes by TPM (transcripts per million) in gland cells from plate-based scRNA-seq. (i) GO terms from the top 200 genes by TPM in gland cells and ciliary plates from NEB-seq. (j) Significant gene expression differences between gland cells and ciliary plates from plate-based scRNA-seq. (k) Significant gene expression differences between gland cells and other cells from plate-based scRNA-seq. (l) Top 200 genes by TPM in ciliary plates from plate-based scRNA-seq. (m) GO enrichment terms for W-specific region (WSR), Z-specific region (ZSR), and WSR + ZSR genes. (n) Stem clusters Delta/Phi and Kappa differential gene expression. (o) GO enrichment terms of stem differentially expressed genes. (p) Top 5 dynamical genes from each cluster from stem and tegument RNA velocity analysis. (q) Comparison of tissue-type composition of the miracidium via in situ hybridisation and the scRNA-seq data. (r) In situ hybridisation probes.
- https://cdn.elifesciences.org/articles/95628/elife-95628-supp1-v1.xlsx
-
MDAR checklist
- https://cdn.elifesciences.org/articles/95628/elife-95628-mdarchecklist1-v1.docx
Download links
A two-part list of links to download the article, or parts of the article, in various formats.
Downloads (link to download the article as PDF)
Open citations (links to open the citations from this article in various online reference manager services)
Cite this article (links to download the citations from this article in formats compatible with various reference manager tools)
A single-cell atlas of the miracidium larva of Schistosoma mansoni reveals cell types, developmental pathways, and tissue architecture
eLife 13:RP95628.
https://doi.org/10.7554/eLife.95628.3


