Structural analysis of the dynamic ribosome-translocon complex
- MRC Laboratory of Molecular Biology, United Kingdom
- Department of Molecular Genetics and Cell Biology, The University of Chicago, United States
- Department of Biochemistry and Molecular Biology, The University of Chicago, United States
Figures
Figure 1 with 2 supplements
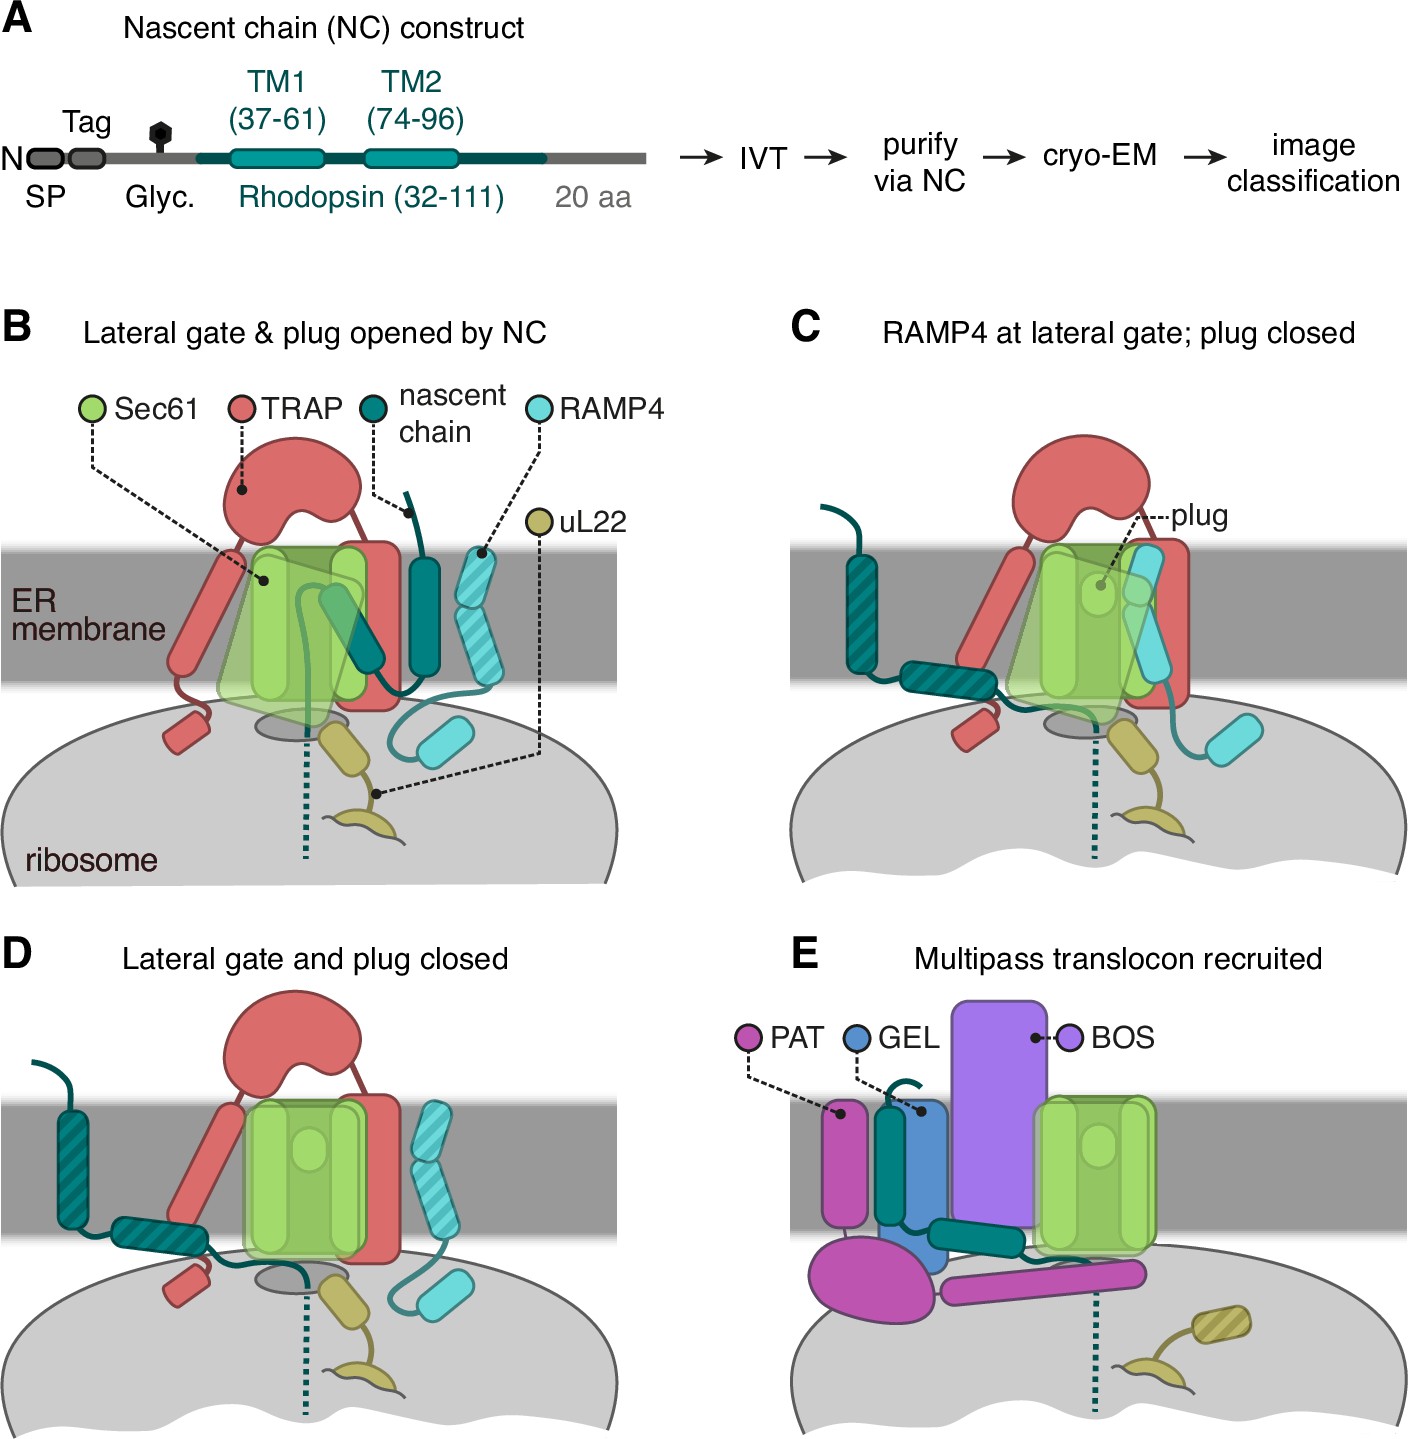
Cryo-electron microscopy (cryo-EM) analysis of ribosome-translocon complexes (RTCs).
(A) Diagram of the Rhoext construct (not to scale) containing the first two transmembrane domains (TMDs) and flanking regions of bovine rhodopsin (amino acids 32–111, Uniprot ID P02699). The rhodopsin region is preceded by a signal peptide (SP), an epitope tag, and a polypeptide of 52 amino acids containing a site for N-linked glycosylation (Glyc.) to monitor translocation. The experimental strategy used in earlier work (Smalinskaitė et al., 2022) to generate and analyse structurally the intermediates of Rhoext is indicated. (B–E) The four major classes of RTCs observed after image classification (Figure 1—figure supplement 1). The multipass translocon class in panel (E) was reported previously (Smalinskaitė et al., 2022). The current work presents RTCs represented in panels (B and C). The closed translocon, which essentially combines the closed Sec61 state seen in panel (E) with the subunit composition seen in panel (B), is not discussed separately here. The hatched RTC elements (e.g. the RAMP4 membrane domain in panel B) indicate regions that are not visible in the cryo-EM maps but are inferred to be present from other data.
Figure 1—figure supplement 1
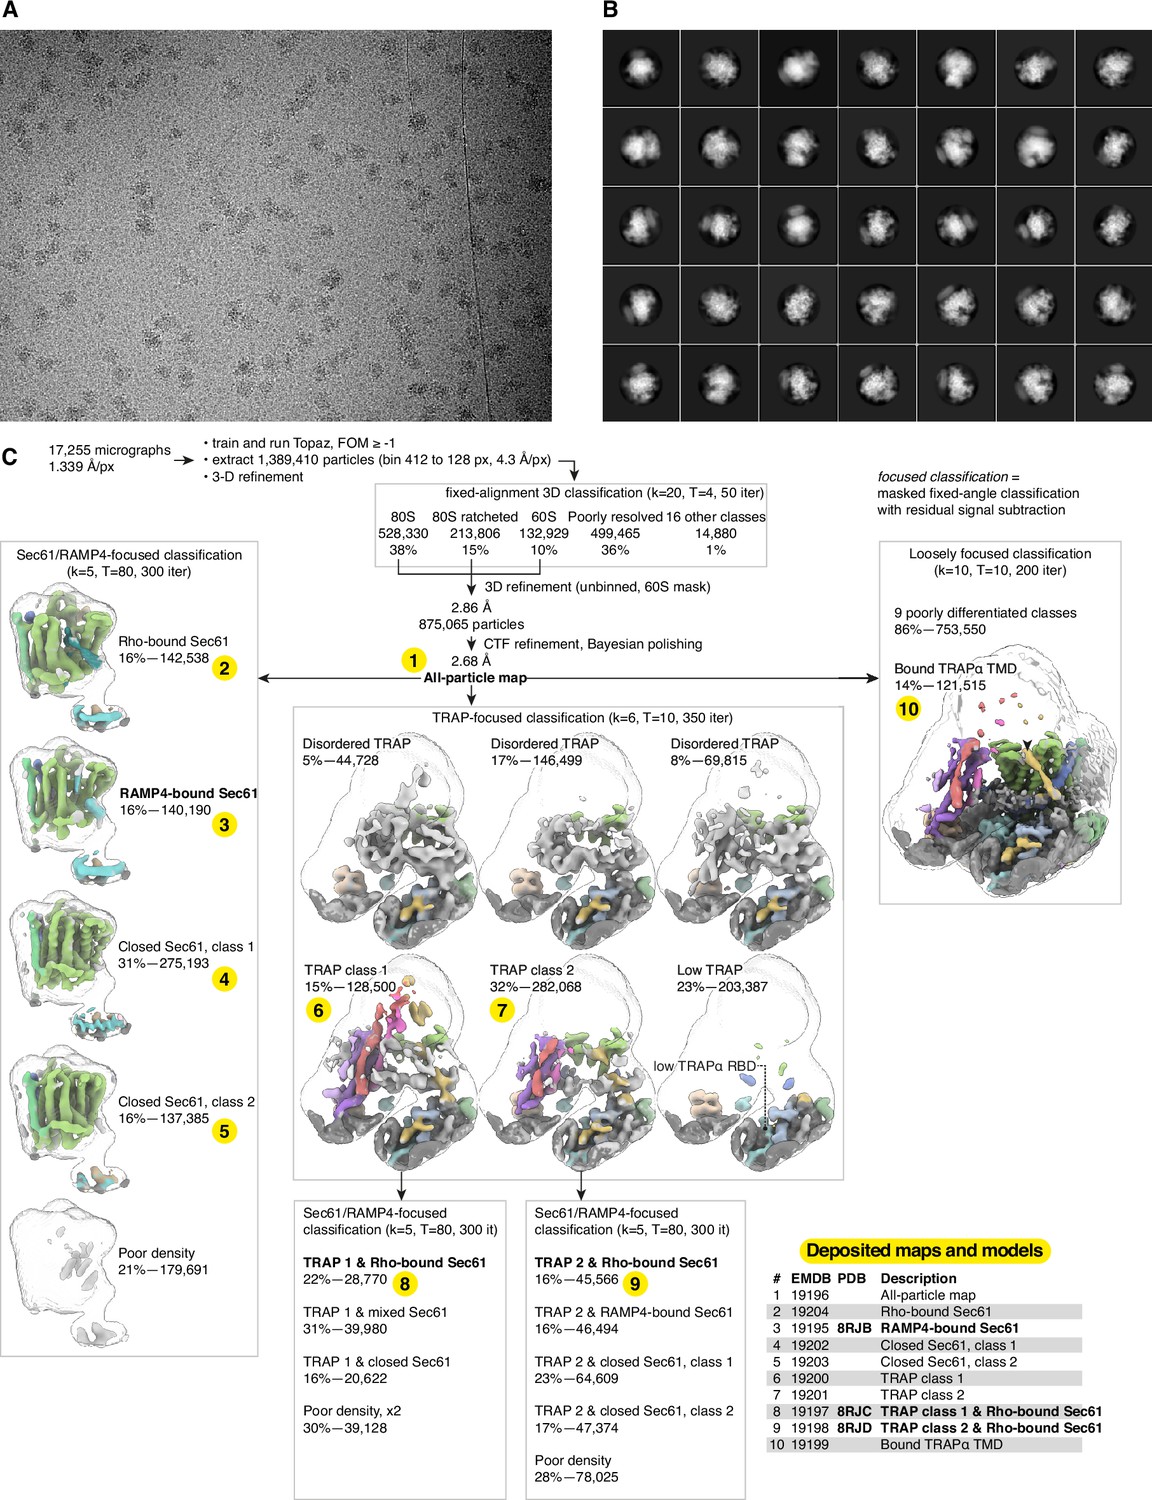
Cryo-electron microscopy (cryo-EM) image processing.
(A) Representative micrograph. (B) Representative 2D class averages. (C) Image processing flowchart with the 10 deposited maps and three models shown in the table and indicated by the numbers highlighted in yellow.
Figure 1—figure supplement 2
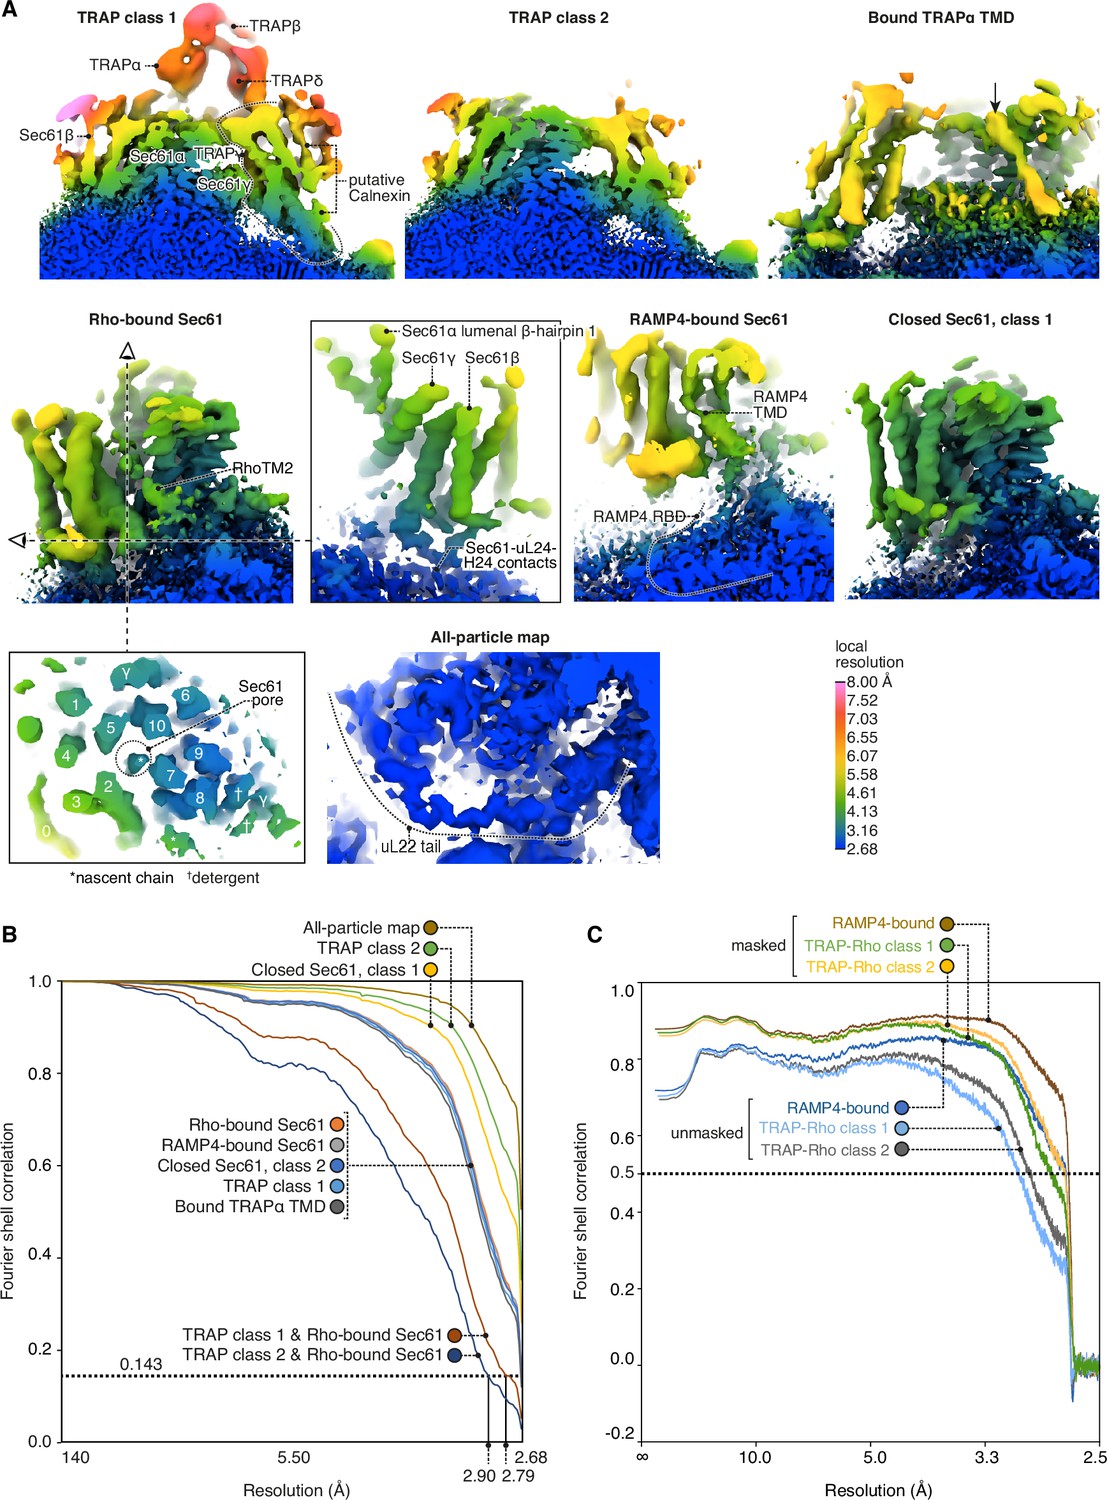
Local and global map resolutions.
(A) Local resolutions estimated by phase randomisation in Relion shown for several key regions discussed in this study. (B) Fourier shell correlations (FSCs) for each deposited map. (C) Map-to-model FSCs.
Figure 2 with 1 supplement
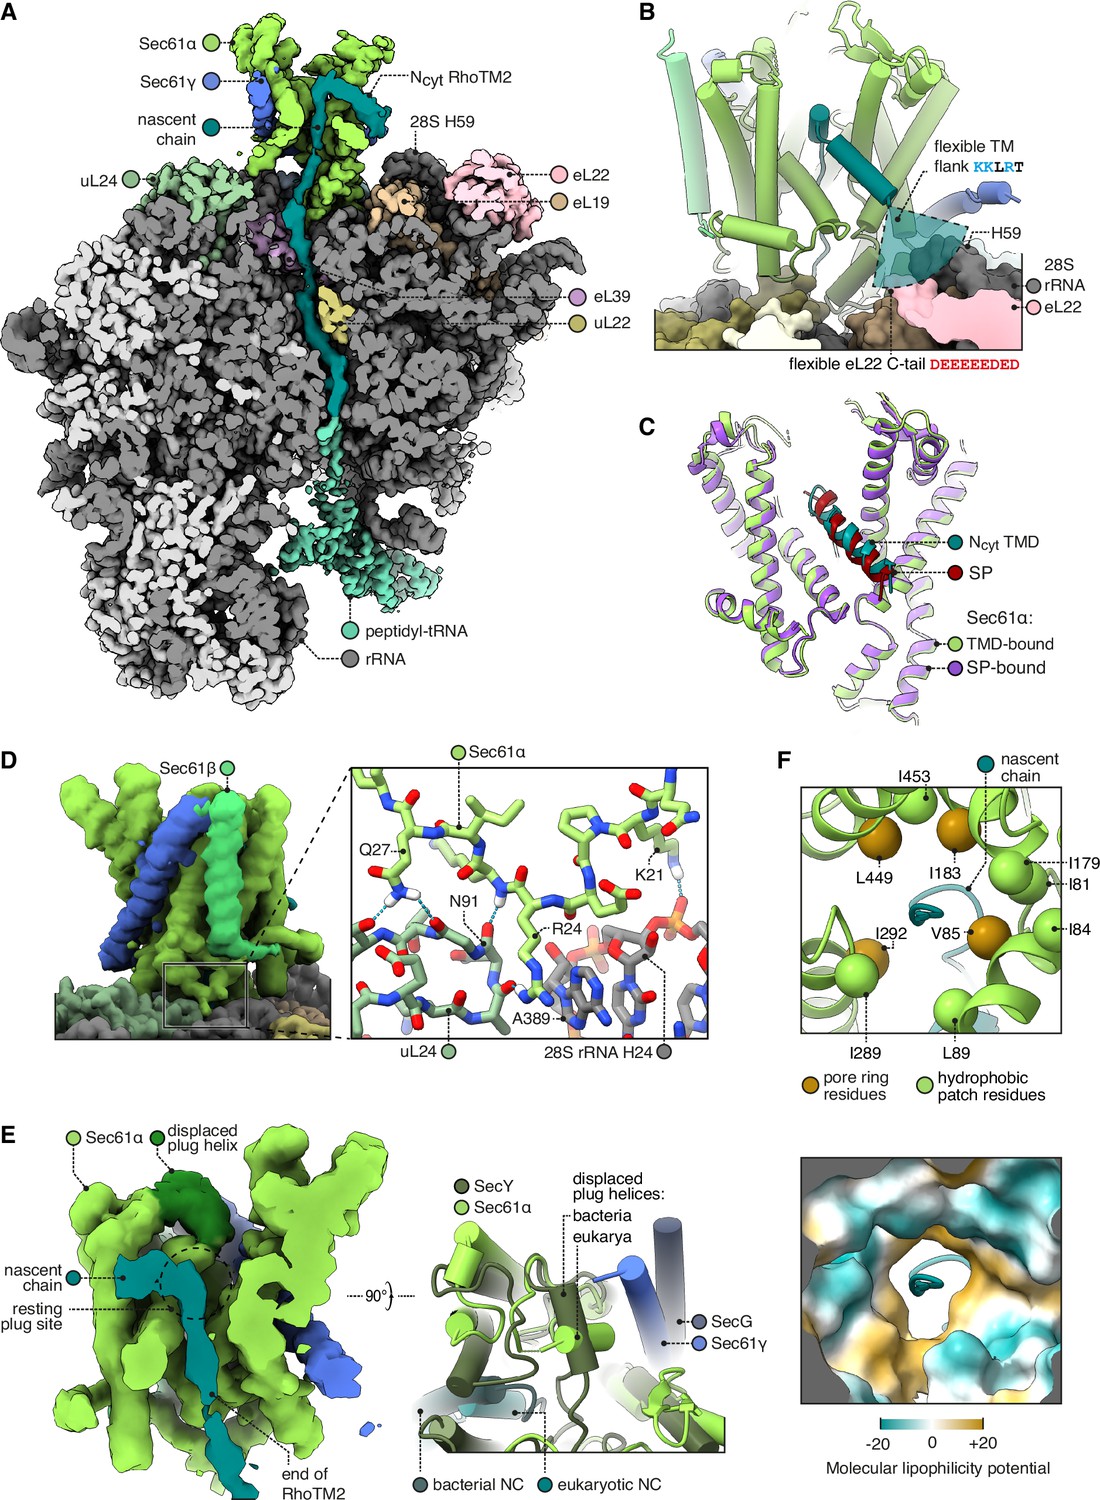
Structure of Sec61 bound to an Ncyt transmembrane domain (TMD).
(A) Overview of the Ncyt RhoTM2-bound Sec61 complex. For display, the density map was filtered using DeepEMhancer and clipped in plane with the ribosomal exit tunnel. (B) Close-up view of the Sec61-RhoTM2 complex. A semitransparent circular sector stands in for the flexible TM-flanking loop, which contains basic residues likely to interact with two nearby polyacidic parts of the ribosome: 28S rRNA helix 59 and the C-tail of eL22. (C) Ncyt TMD-bound Sec61 is structurally similar to signal peptide (SP)-bound Sec61. The SP is preprolactin (PDB 3JC2 rebuilt into EMD-3245 using restraints from AF2). (D) The Sec61 N-half binds the ribosome. (E) When displaced by a translocating nascent chain, the plug helix relocates to a lumenal site near Sec61γ in eukaryotes and SecG in bacteria, but its orientation is not conserved. For display, the density map was filtered using DeepEMhancer and clipped in plane with the channel pore. (F) Structure of the pseudosymmetric pore ring residues V85, I183, I292, and L449.
Figure 2—figure supplement 1
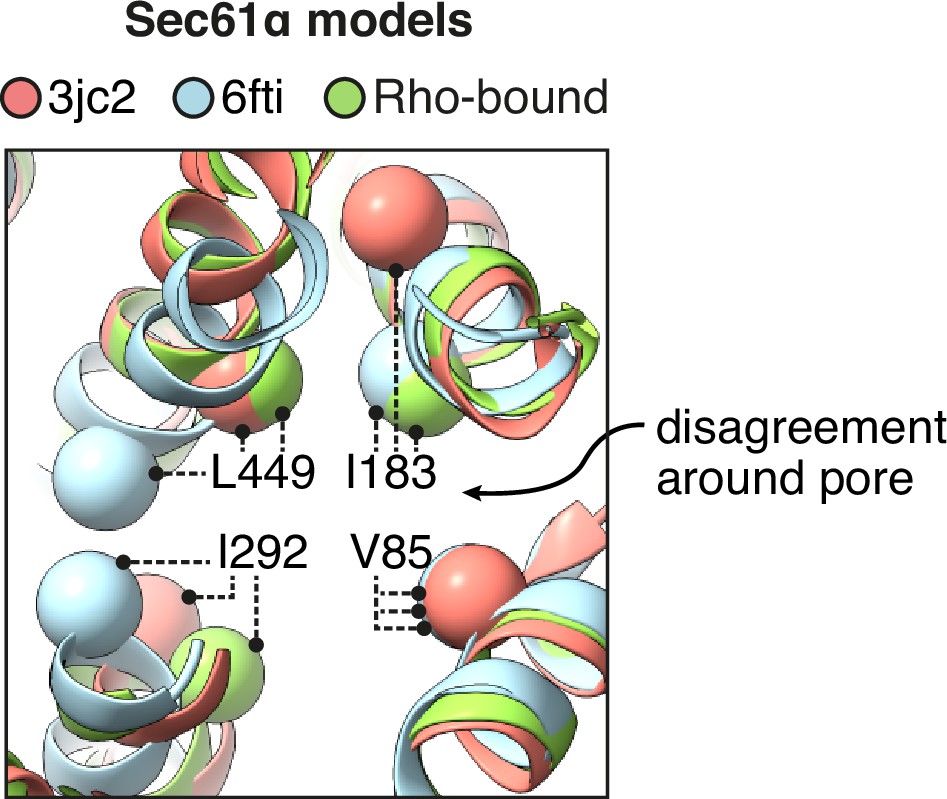
Comparison of the pore ring across different models of Sec61.
Prior models of open Sec61 disagree about the structure of its central pore. The positions of four aliphatic residues that contribute to the pore ring are indicated.
Figure 3 with 2 supplements
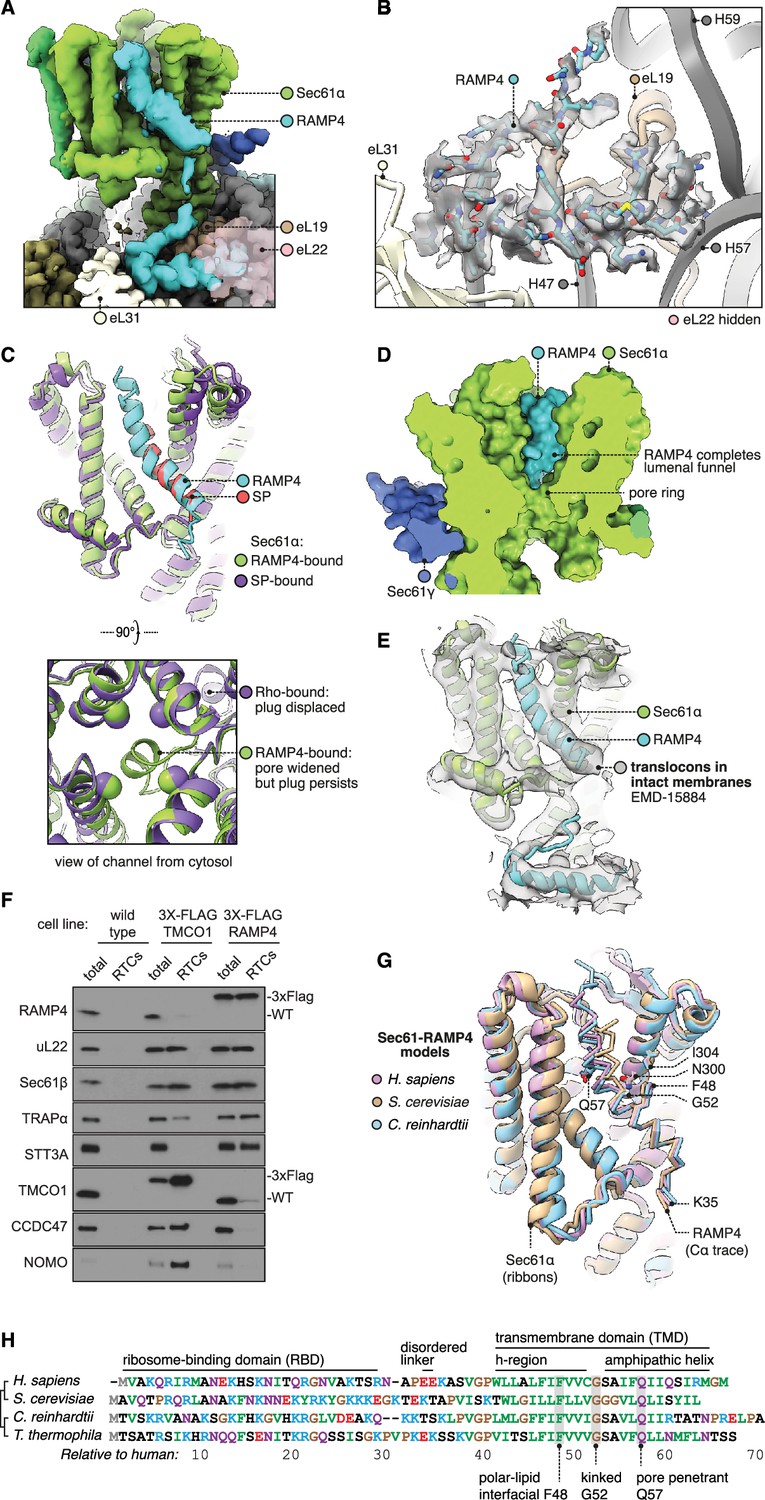
Structure of Sec61 bound to RAMP4.
(A) Overview of the RAMP4-bound Sec61 complex. For display, the density map was filtered using DeepEMhancer and clipped along a plane adjacent to RAMP4. eL22 is shown at 70% opacity to avoid occluding RAMP4. (B) The RAMP4 ribosome-binding domain (RBD) fit to density. For display, the density map was supersampled at half its original pixel size. eL22 is hidden to avoid occluding RAMP4. (C) RAMP4-bound Sec61 is structurally similar to signal peptide (SP)-bound or transmembrane domain (TMD)-bound Sec61, except RAMP4 does not displace the plug helix, whereas SPs and TMDs do. The SP is preprolactin (PDB 3JC2 rebuilt into EMD-3245 using restraints from AF2). (D) RAMP4 contributes to the lumenal funnel of Sec61. (E) Alignment of the RAMP4-Sec61 model to a cryo-ET map of the Sec61-TRAP-OSTA translocon in intact membranes (EMD-15870; Gemmer et al., 2023b). (F) Immunoblotting analysis of ribosome-translocon complexes (RTCs) affinity purified from the indicated HEK293 cell lines. 1% of total microsomes isolated from the cells ('total') is shown for comparison. Note that expression levels of 3X-FLAG-tagged TMCO1 and RAMP4 are comparable to their native levels seen in wild-type cells. Similar results were observed in two biological replicates. (G) Superposition of AF2-predicted RAMP4-Sec61 structures from different species. (H) Alignment of select RAMP4 sequences.
-
Figure 3—source data 1
Uncropped full gel images of the immunoblots shown in Figure 3F.
- https://cdn.elifesciences.org/articles/95814/elife-95814-fig3-data1-v1.zip
Figure 3—figure supplement 1
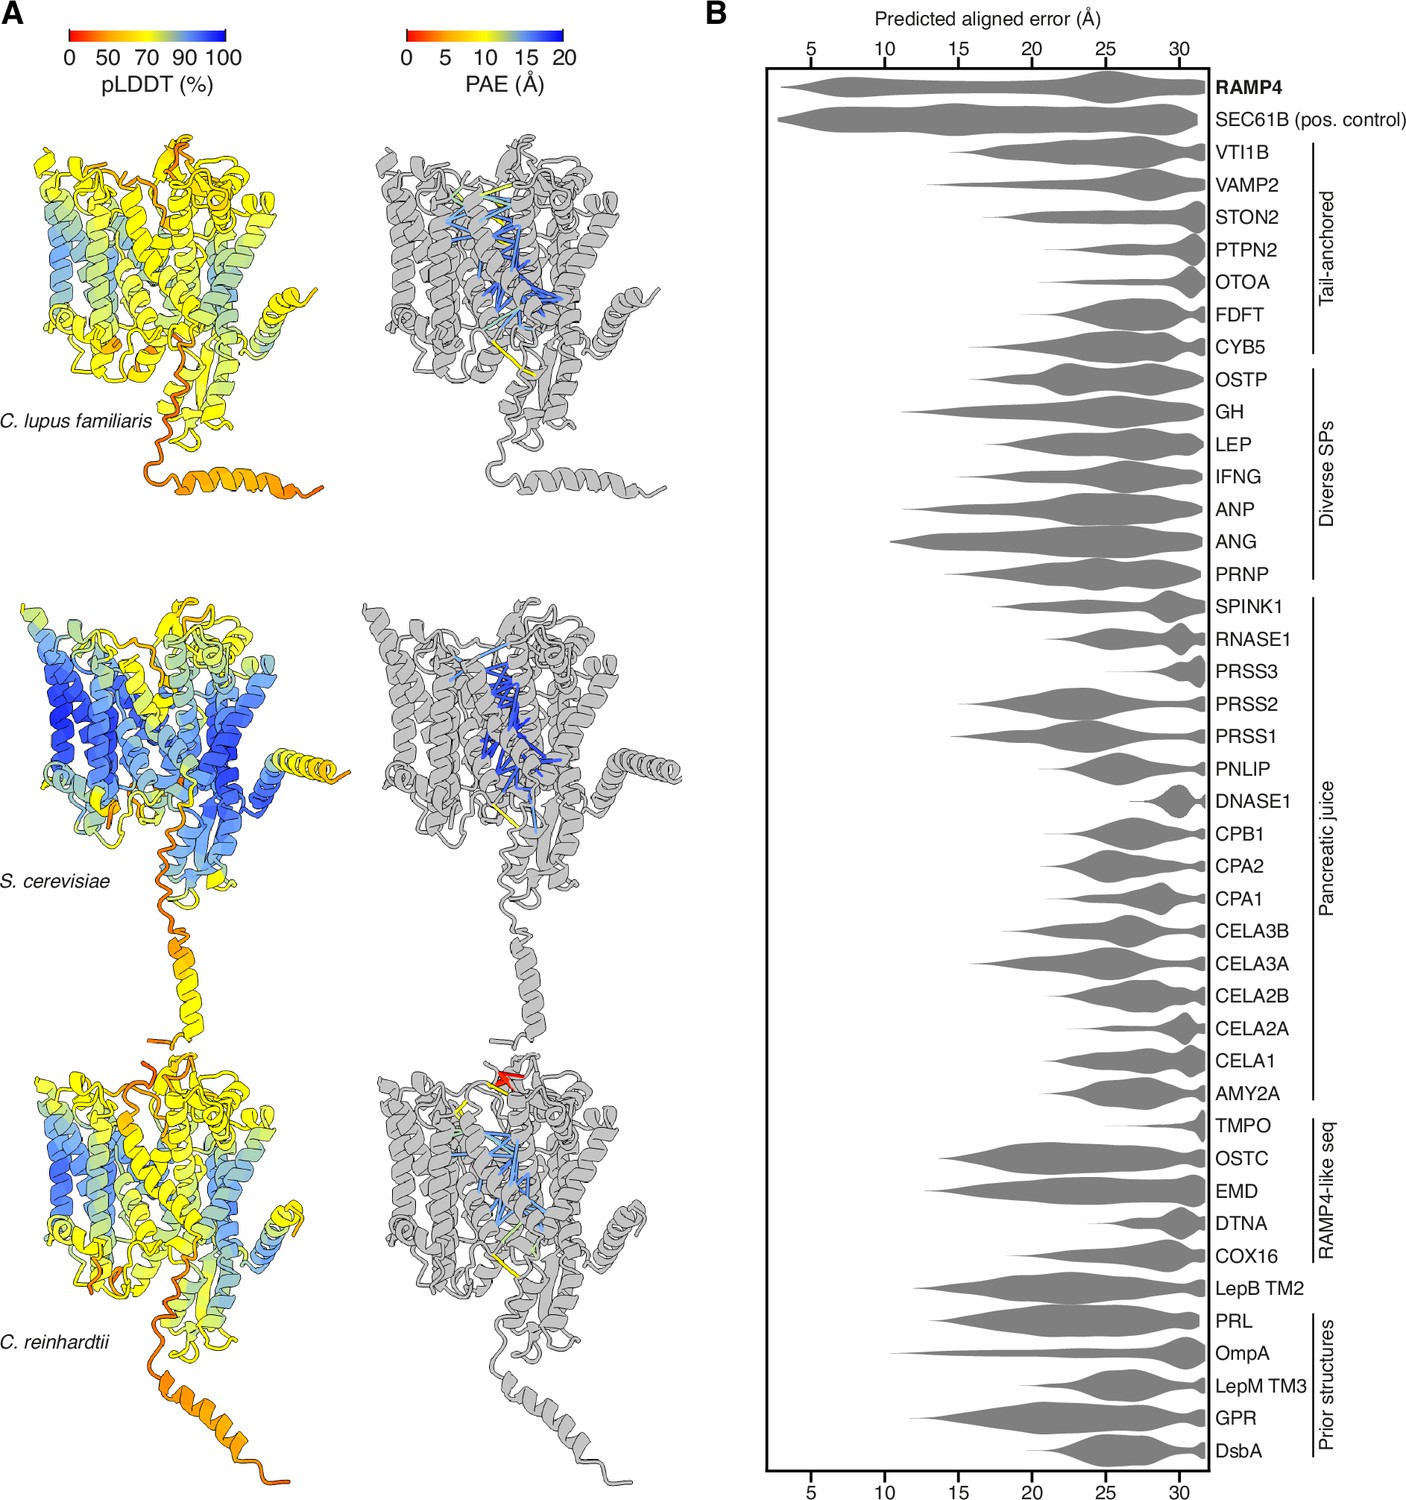
Predicted structures of Sec61-RAMP4 complexes.
(A) Predicted structures of Sec61αβγ-RAMP4 complexes from Canis lupus familiaris, Saccharomyces cerevisiae, and Chlamydomonas reinhardtii, colour-coded by predicted local distance difference test (pLDDT) (left) or with pseudobonds connecting Sec61 to RAMP4 colour-coded by predicted aligned error (PAE) (right). (B) Violin plot of the intersubunit PAEs between Sec61α and a panel of hydrophobic helices. These represent transmembrane domains (TMDs) and signal peptides (SPs) that are known to interact with Sec61α as either a constitutive subunit (Sec61β) or substrate (various secretory proteins, including those from pancreatic juice, and substrates in prior structures). A number of unrelated tail-anchored proteins and several small RAMP4-like sequences were also tested. Among all of these, only RAMP4 shows PAE scores lower than 10 Å, comparable to the constitutive subunit Sec61β.
Figure 3—figure supplement 2
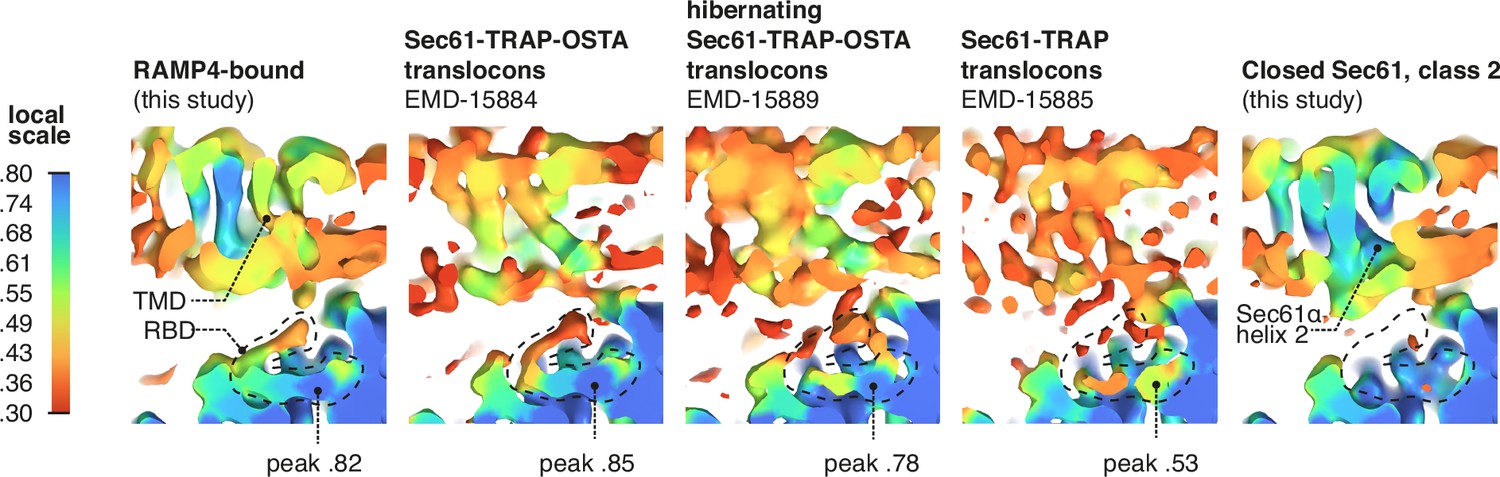
RAMP4 occupancy in different maps.
Occupancy of RAMP4 in various density maps was estimated by OccuPy. For display, maps were lowpass-filtered at 8 Å. The positions of the transmembrane domain (TMD) and ribosome-binding domain (RBD) of RAMP4 are indicated, with the peak local occupancy in the RBD shown below each map containing RAMP4.
Figure 4 with 1 supplement
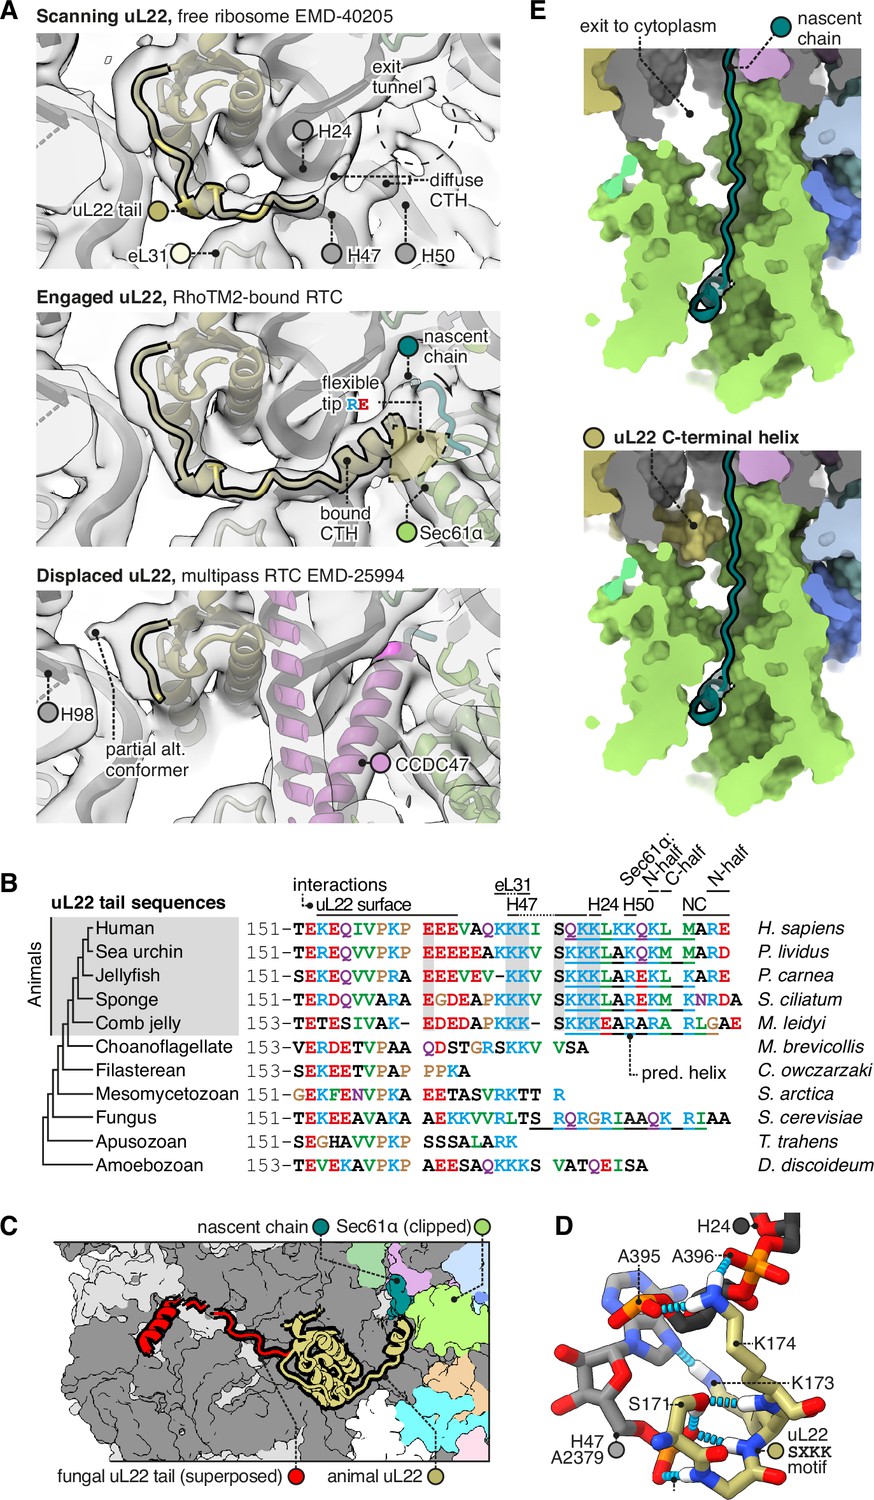
The C-terminal helix of animal uL22 binds the ribosome-translocon junction.
(A) uL22 has three discernible states: scanning, engaged, or displaced. The maps shown are as follows: for the scanning state, the highest-resolution map available of a cytoplasmic ribosome from eukarya (EMD-40205); for the engaged state, the RAMP4-bound Sec61 map from this study, and for the displaced state, the multipass translocon (MPT)-bound map previously reported from this dataset (EMD-25994). For display, the maps were lowpass-filtered at 8 Å. (B) Alignment of select uL22 tail sequences. Underlines indicate the C-terminal helices annotated in the AF2 database. (C) Superposition of the animal and fungal uL22 tails (PDB 8AGX). (D) Structure of the uL22 SXKK motif, with hydrogen bonds indicated in cyan. (E) Comparison of the ribosome-translocon junction in the absence (top) and presence (bottom) of an ordered uL22 C-terminal helix. Note that the helix occludes the gate-side exit towards the cytoplasm.
Figure 4—figure supplement 1
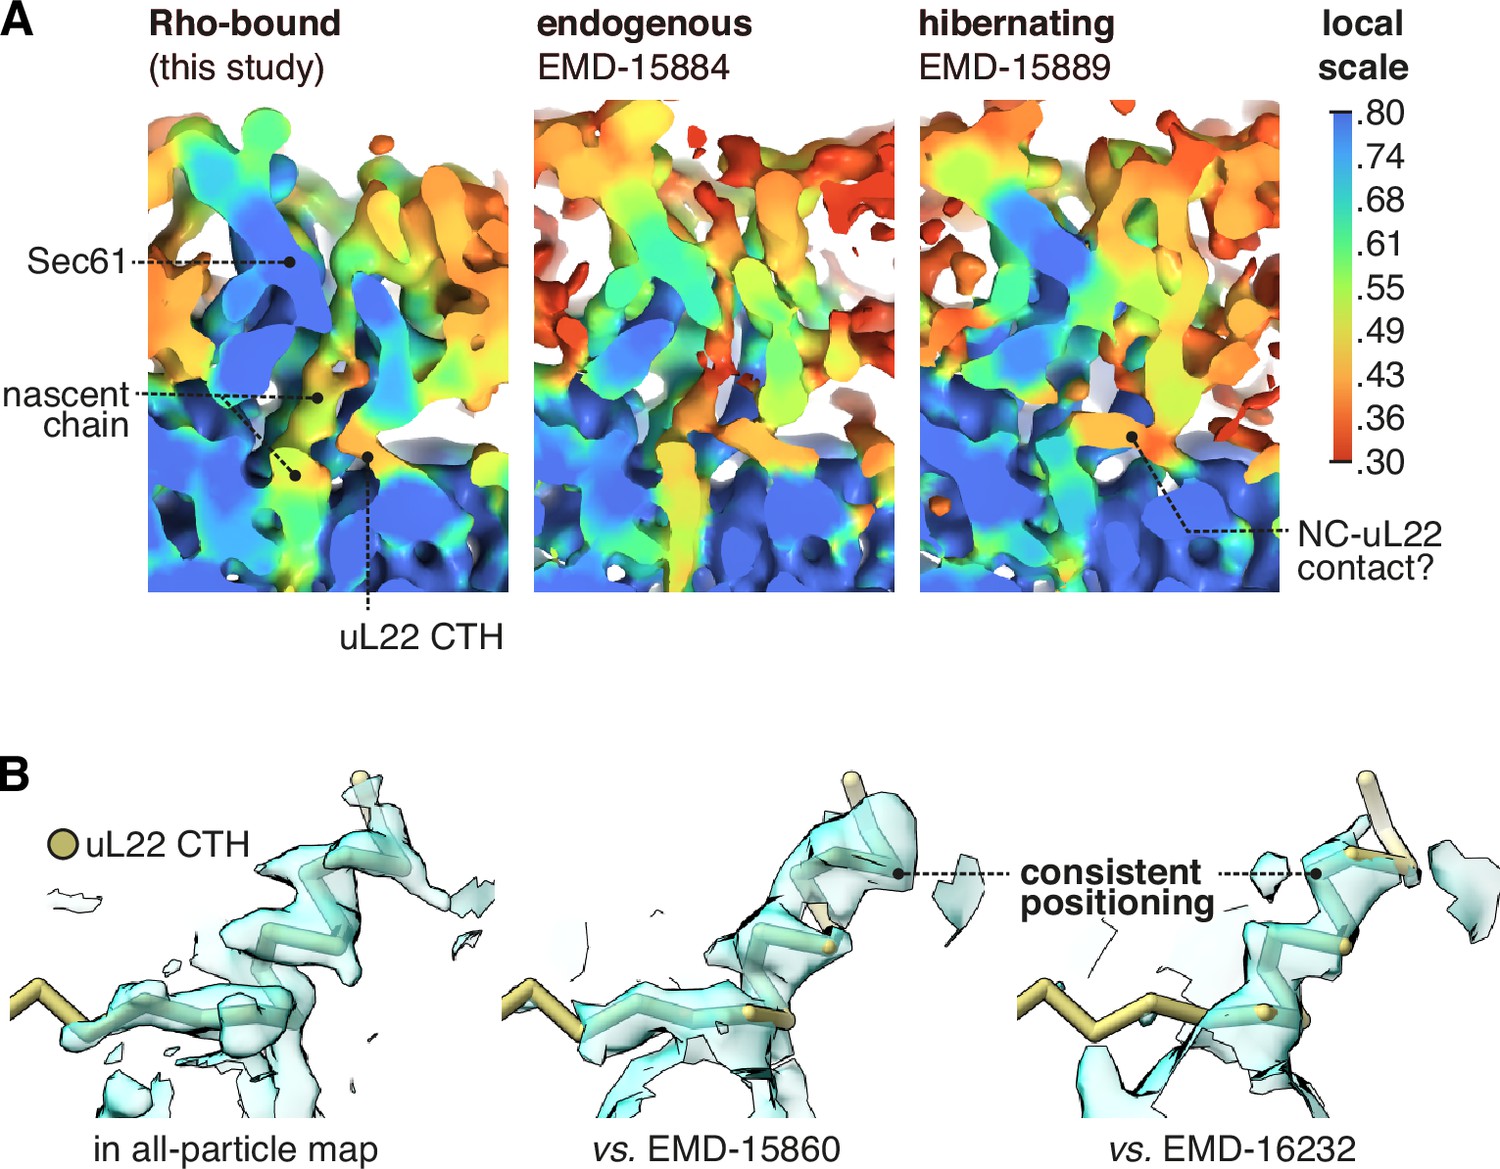
Occupancy of the uL22 C-terminal helix (CTH) in different maps.
(A) The uL22 CTH is observed in a reported cryo-ET average from intact membranes, EMD-15884, and at a similar occupancy to the present dataset. A similar average of hibernating ribosomes (EMD-15889) contains abundant nascent chain-like density despite the lack of a P-site tRNA, and this density appears to compete with the uL22 CTH. (B) The uL22 CTH binds with a similar tilt and register in the two other reported structures where those details are discernible. For display, the Sec61-RAMP4 map was supersampled at half the original pixel size.
Figure 5
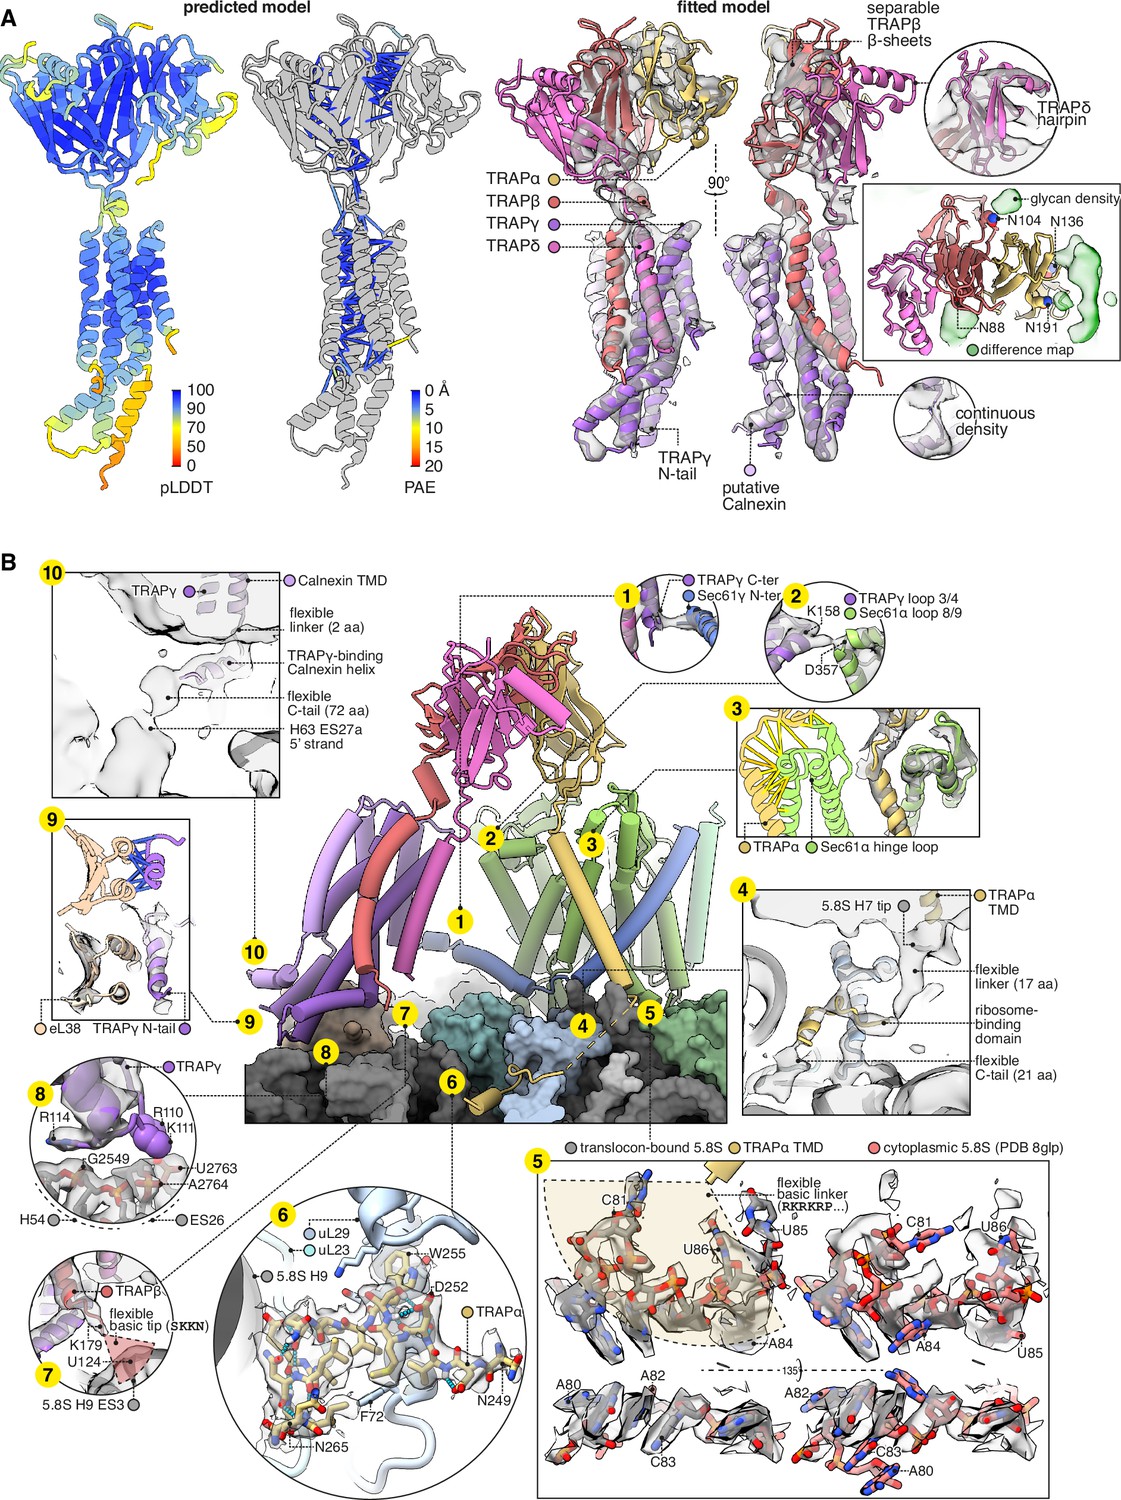
Structure of the translocon-associated protein (TRAP) complex and its contacts with the ribosome and Sec61.
(A) The predicted structure of the TRAP complex (left) fitted into the EM density shown with a semitransparent isosurface (right). For display, the density map was lowpass-filtered at 8 Å. The structural model at left is coloured by the predicted local distance difference test (pLDDT). Colour-coded pseudobonds indicating the predicted aligned error (PAE) between pairs of residues are shown at subunit interfaces, and reflect the confidence with which AF2 predicts intersubunit contacts. In the density-fitted structure, the chain putatively assigned to Calnexin is also shown, where it was fitted to an additional density on the surface of TRAPγ. (B) TRAP’s contacts with the ribosome and Sec61. The 5.8S rRNA in subpanel 5 is shown in two conformations, both fit to the same density map, to illustrate the conformational change induced by association with the translocon. For display, the density map in subpanels 1–4, 7, 9, and 10 was lowpass-filtered at 8 Å; in subpanel 6, the map was supersampled at half the original pixel size; in subpanel 8, the map was filtered by DeepEMhancer. Models shown in flat lighting are AF2 predictions with pseudobonds colour-coded by PAE as in panel (A).
Figure 6 with 1 supplement
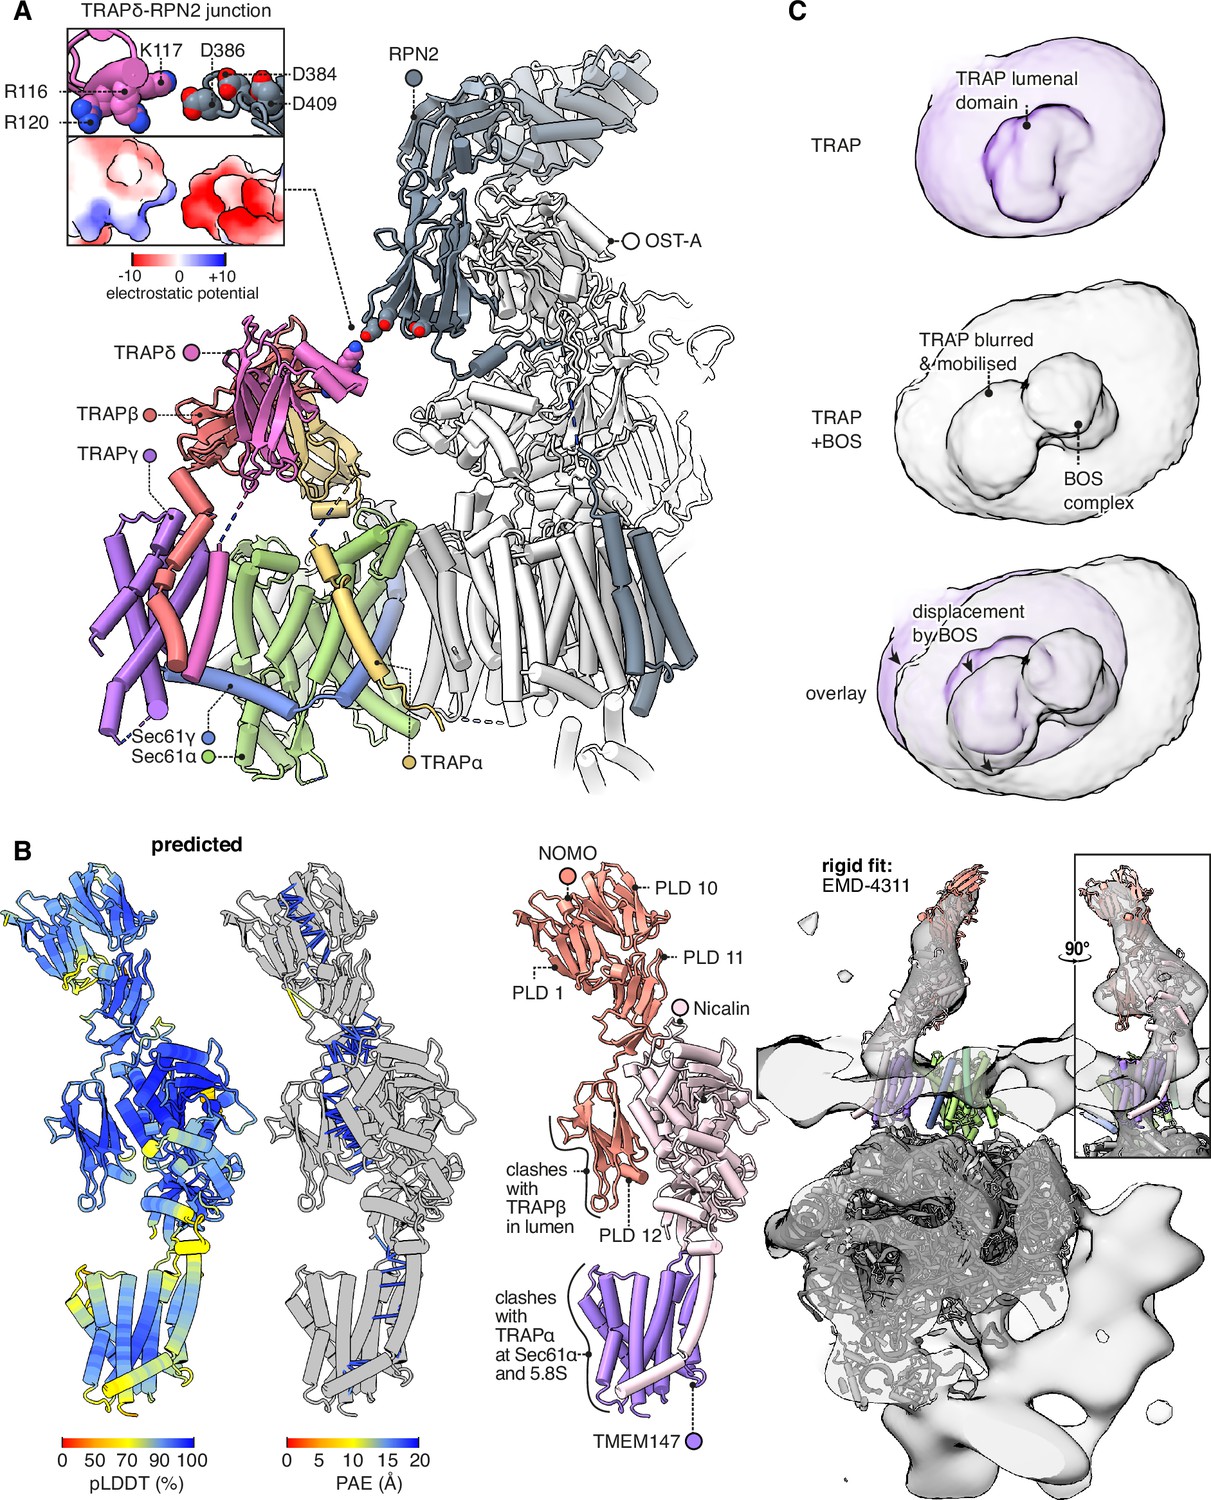
Interactions between the translocon-associated protein (TRAP) complex and other translocon constituents.
(A) Overview of the Sec61-TRAP-OSTA complex (PDB 8B6L; Gemmer et al., 2023b). The individual subunits of OSTA are not labelled or coloured separately, except for Ribophorin II (RPN2). The inset shows how the basic hairpin on TRAPδ is close enough to interact electrostatically with acidic loops on RPN2. The indicated amino acids are highly conserved in both TRAPδ and RPN2. Because the rotameric states of K117 and D386 are uncertain, the rotamers yielding the smallest gap are shown. (B) The predicted structure of the BOS complex is shown in flat lighting at left, and a rigid-body fit to EM density is shown with a semitransparent isosurface at right. PLD stands for prealbumin-like domain. (C) BOS complex destabilises TRAP’s association with the translocon. The densities shown were Gaussian-filtered with a B-factor of 2000. The BOS+TRAP map is the multipass translocon (MPT) map previously reported from this dataset (EMD-25994).
Figure 6—figure supplement 1
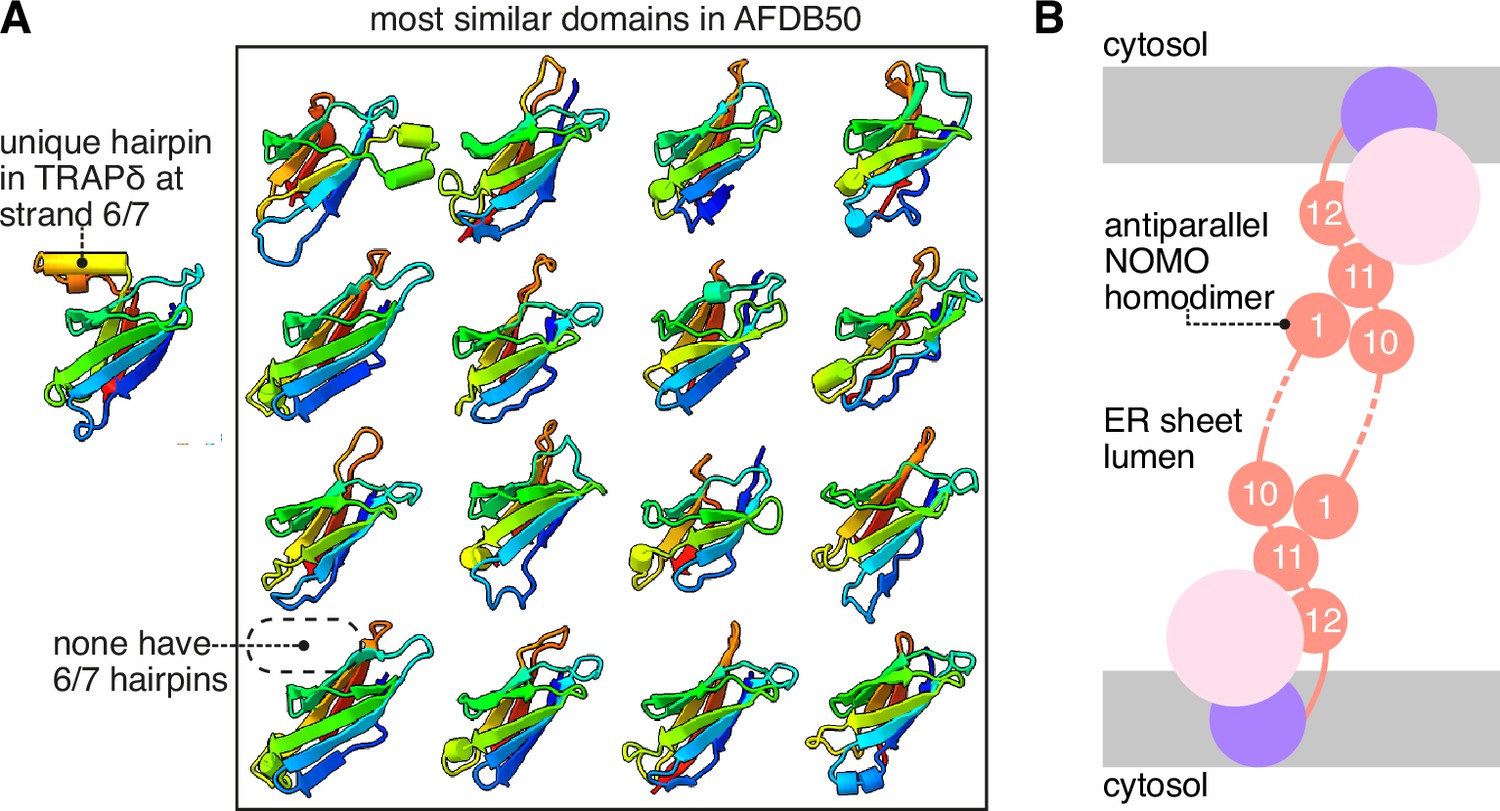
Additional analysis of the translocon-associated protein (TRAP) and BOS complexes.
(A) TRAPδ contains a unique α-hairpin between strands 6 and 7, not found in any of the other most similar domains in the AFDB50. The 16 top heterologous Foldseek hits for the TRAPδ lumenal domain are shown. (B) Schematic model of NOMO prealbumin-like domain 1 (PLD1) and PLD10/11 associating as an antiparallel dimer across the lumen of an endoplasmic reticulum (ER) sheet.
Figure 7
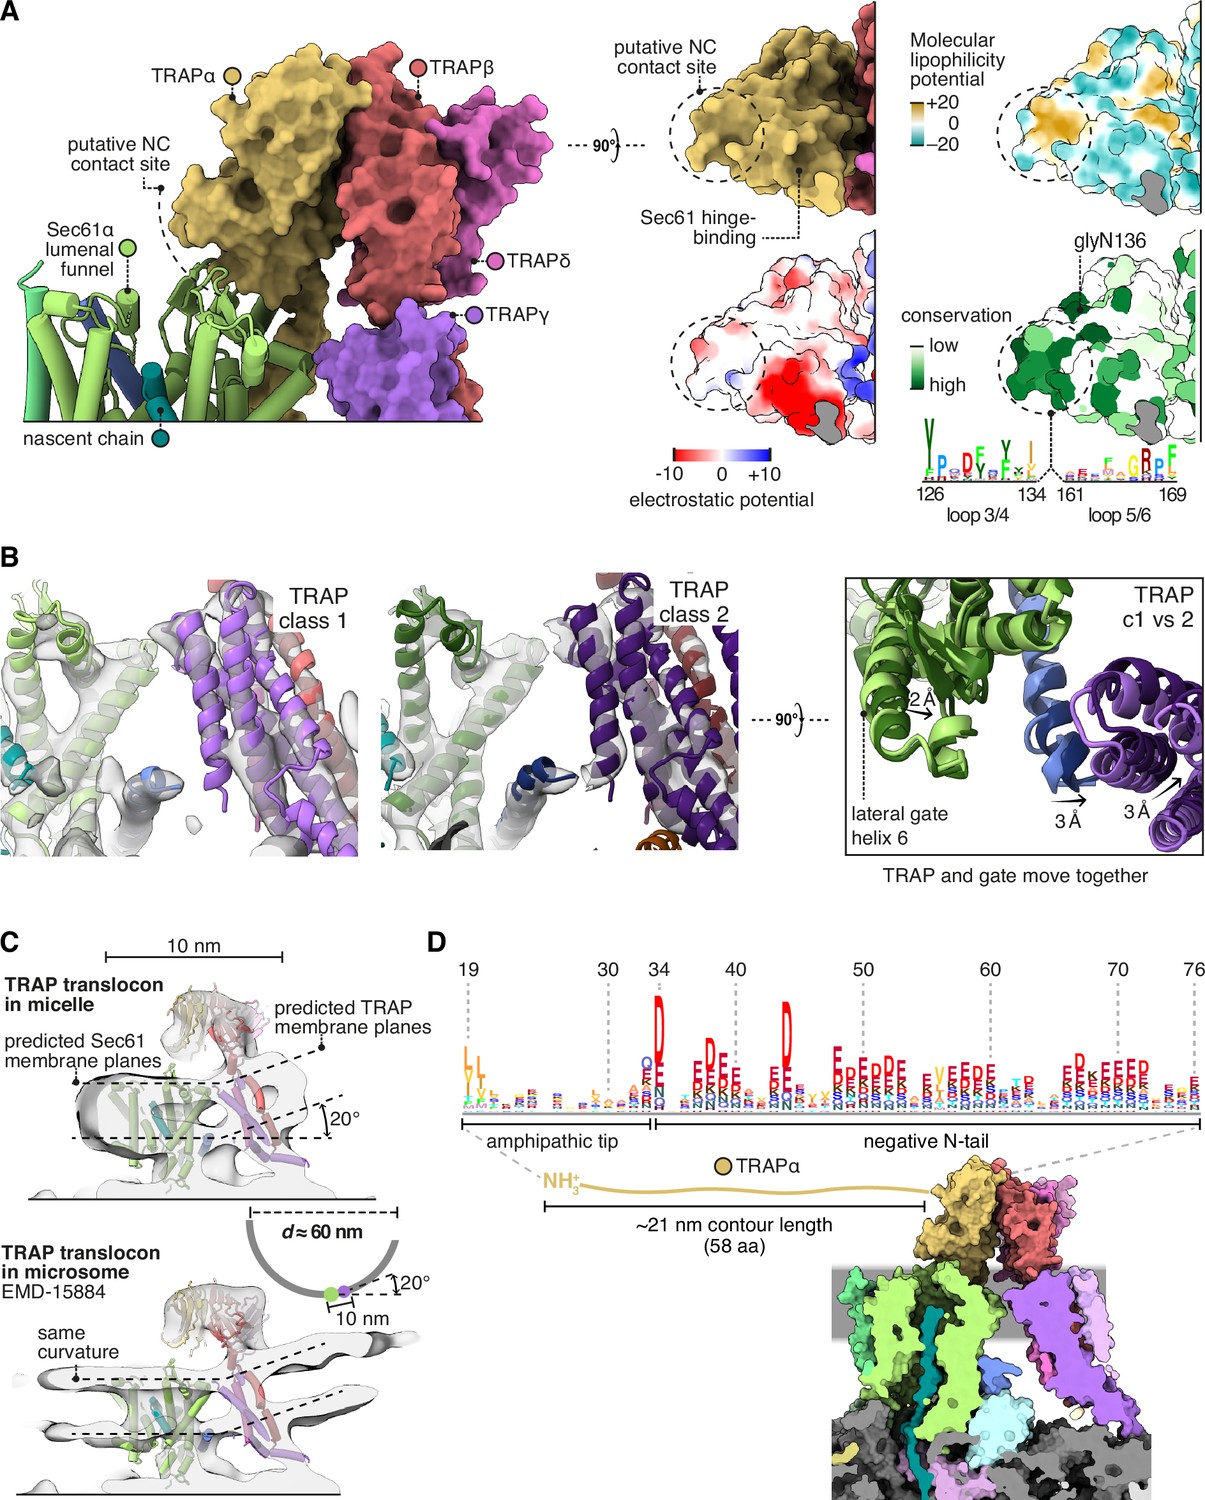
Translocon-associated protein (TRAP) features that may influence Sec61 activity.
(A) The region of TRAPα closest to the lumenal vestibule of Sec61 represents a putative contact site with translocating nascent chains. This region is highly conserved. (B) Image classification separated two slightly shifted TRAP conformations, shown in their respective densities in the left and middle panels. The superposition of the two models shows that this shift in TRAP correlates with a shift in the C-half of Sec61’s lateral gate (helix 6). The helices coloured in blue are Sec61γ, which moves together with TRAPγ (purple). For display, the density maps were lowpass-filtered at 8 Å. (C) Top: The TRAP-Sec61 complex induces curvature in detergent micelles, consistent with the membrane planes predicted by the Orientation of Proteins in Membranes (OPM) server. Bottom: The structure of the TRAP-Sec61 complex in microsome membranes shows the same curvature as observed in detergent micelles. Inset: The radius of curvature induced in the micelle is ~30 nm (diameter 60 nm), which matches that of endoplasmic reticulum (ER) tubules and sheet edges. (D) TRAPα’s N-tail is anionic, amphipathic, and is positioned to interact with Sec61, nascent chains, or other factors. The N-tail is shown to scale. Note the conservation of the amphipathic tip and anionic character. The logo plots in panels (A and D) represent an HMM generated by jackHMMER upon convergence after querying UniProtKB’s metazoan sequences with the human TRAPα sequence. Only signal above background is shown, as rendered by http://skylign.org/.
Figure 8
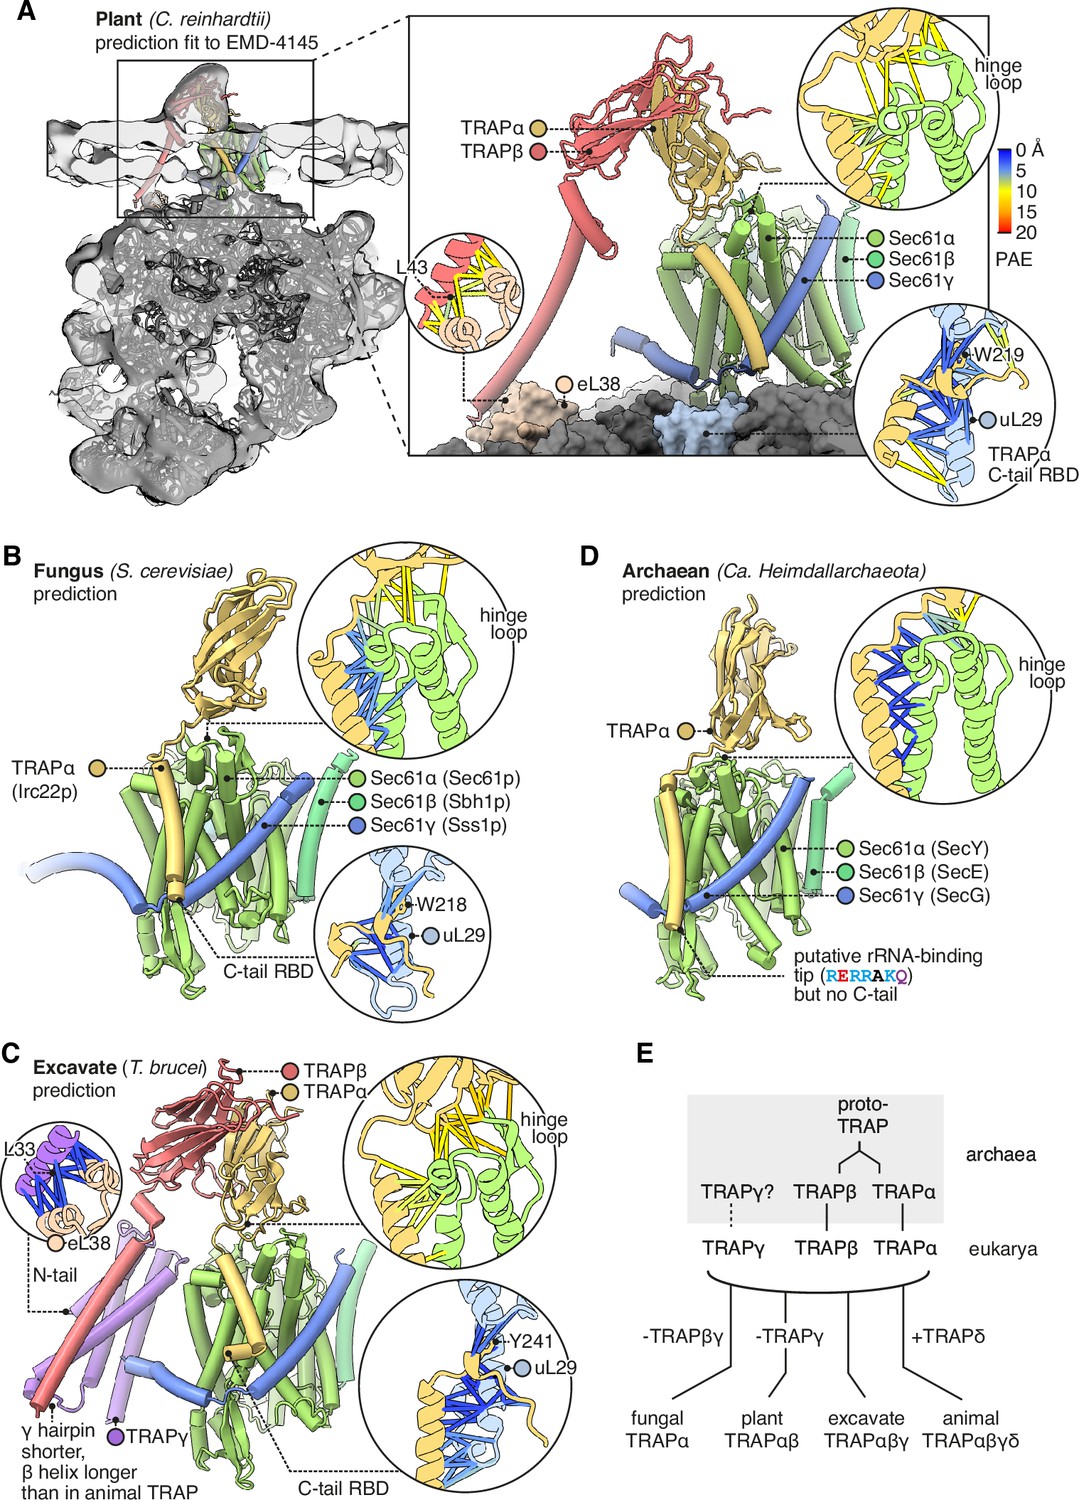
Diversity of translocon-associated protein (TRAP) structures across eukarya and archaea.
(A) Predicted structure of a plant TRAPαβ-Sec61 complex (C. reinhardtii) fitted to a subtomogram average from native membranes (EMD-4145). Insets show predicted aligned errors (PAEs) for the TRAPα-Sec61α interaction and for the separately predicted TRAPα-uL29 and TRAPβ-eL38 interactions. A plant ribosome model is shown for context (PDB 8B2L). (B) Predicted structure of a fungal TRAPα-Sec61 complex (S. cerevisiae). Insets show PAEs for the TRAPα-Sec61α interaction and for the separately predicted TRAPα-uL29 interaction. (C) Predicted structure of an excavate TRAPαβγ-Sec61 complex (T. brucei). Insets show PAEs for the TRAPα-Sec61α interaction and for the separately predicted TRAPα-uL29 and TRAPγ-eL38 interactions. (D) Predicted structure of an archaean TRAPα-SecYEG complex (Ca. Heimdallarchaeota). The inset shows PAEs for the TRAPα-SecY interaction. (E) Schematic representation of the hypothesis that TRAPαβ share a common ancestor and were present in archaea, then inherited by the cenancestral eukaryote alongside TRAPγ. Typical subunit compositions are included alongside the indicated taxa, ignoring further variations that exist within each taxon.
Additional files
-
Supplementary file 1
Data collection, refinement, model, and validation statistics.
- https://cdn.elifesciences.org/articles/95814/elife-95814-supp1-v1.xlsx
-
MDAR checklist
- https://cdn.elifesciences.org/articles/95814/elife-95814-mdarchecklist1-v1.docx
Download links
A two-part list of links to download the article, or parts of the article, in various formats.
Downloads (link to download the article as PDF)
Open citations (links to open the citations from this article in various online reference manager services)
Cite this article (links to download the citations from this article in formats compatible with various reference manager tools)
Structural analysis of the dynamic ribosome-translocon complex
eLife 13:RP95814.
https://doi.org/10.7554/eLife.95814.3


