Bidirectional fear modulation by discrete anterior insular circuits in male mice
- Department of Brain and Cognitive Sciences, Scranton College, Ewha Womans University, Republic of Korea
- Brain Disease Research Institute, Ewha Brain Institute, Ewha Womans University, Republic of Korea
- Department of Basic Medical Science, College of Medicine, Catholic Kwandong University, Republic of Korea
- Institute for Bio-Medical Convergence, International St. Mary’s Hospital, Catholic Kwandong University, Republic of Korea
- Department of Psychology, University of Washington, United States
Figures
Figure 1
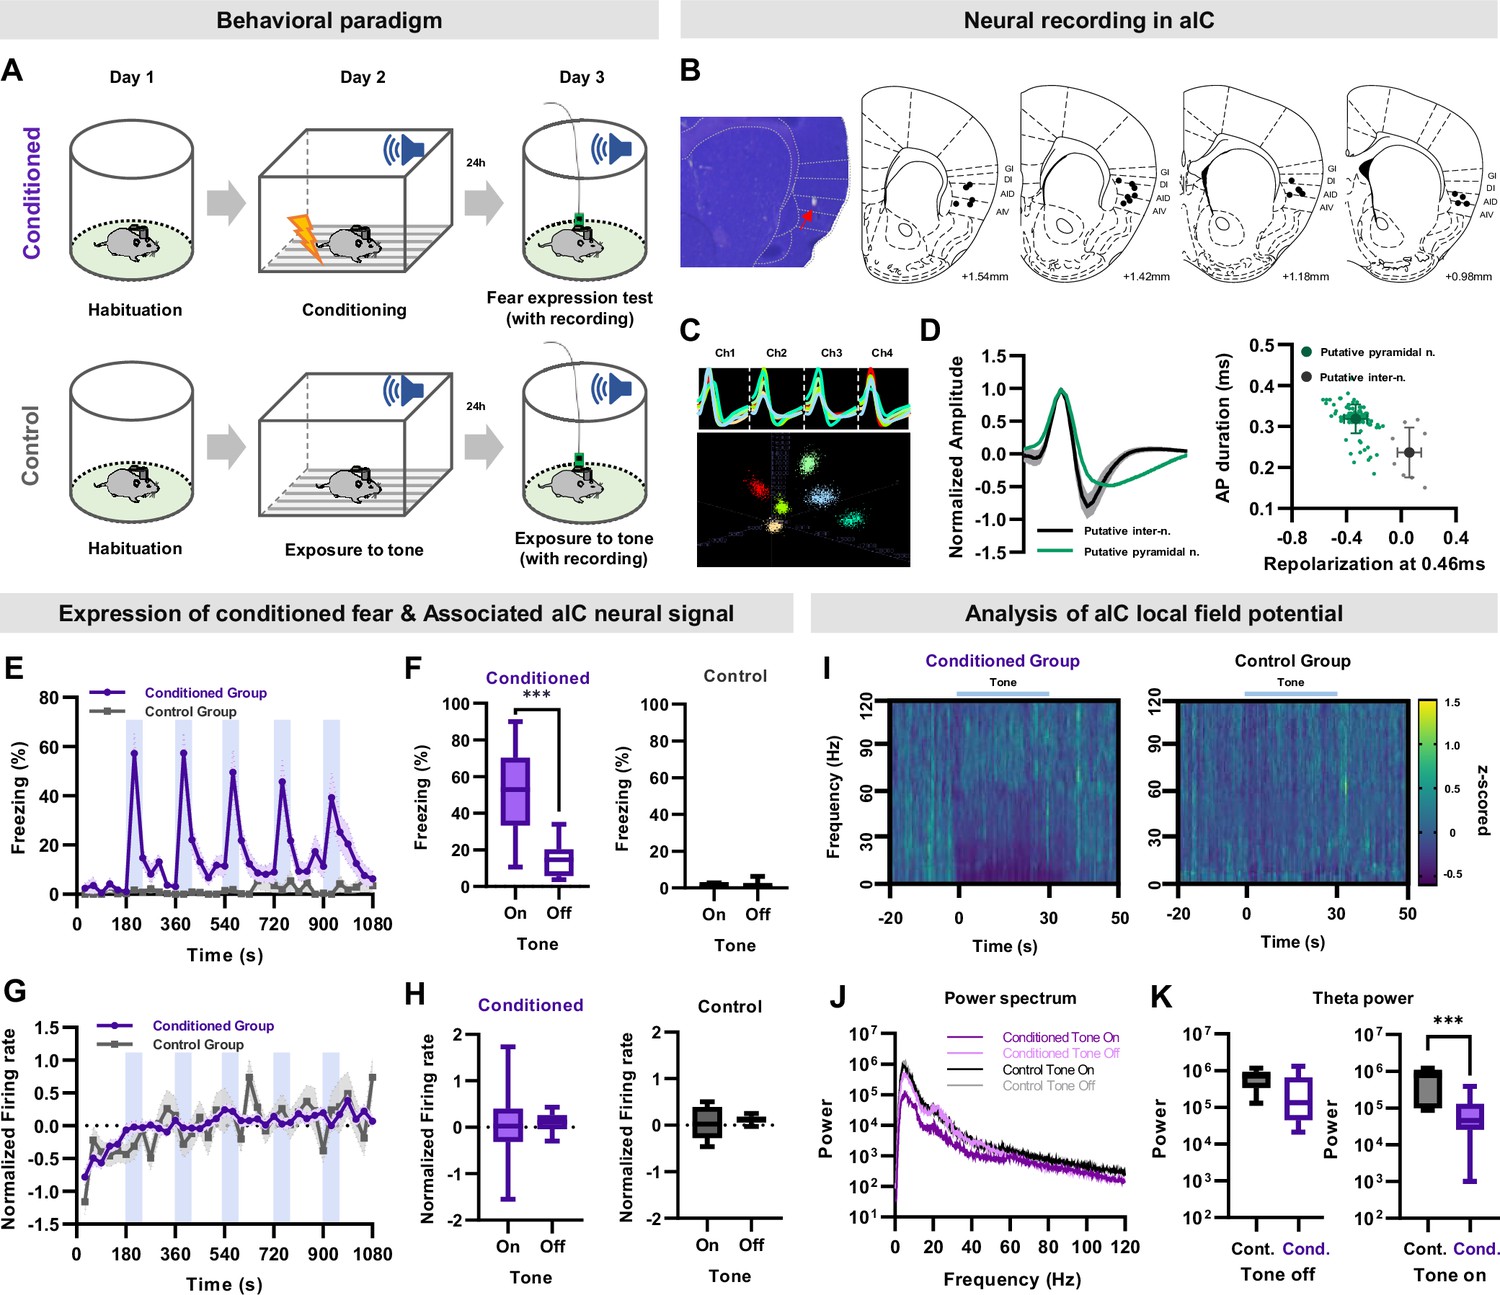
Single unit recording of aIC neurons during conditioned fear expression.
(A) Schematic of the auditory fear conditioning and single unit recording procedures. Neuronal activities and behaviors were simultaneously recorded during the expression of conditioned fear. The control group underwent the same procedures except for fear conditioning. (B) Histological sample showing the tip of a recording electrode, indicated with a red arrow. Brain atlas maps indicating the locations of aIC recording sites used for analysis. The black dots represent the recording site. GI: granular insular cortex, DI: dysgranular insular cortex, AID: dorsal agranular insular cortex, AIV: ventral agranular insular cortex. (C) Sample cluster cutting of neuronal recording acquired from a tetrode. (D) Juxtaposed action potential shape of all recorded neurons (left). Putative pyramidal neurons and interneurons were distinguished based on the shape of the action potential. The plot on the right shows action potential duration and repolarization. Putative pyramidal neurons are represented by green dots, while putative interneurons are represented by gray dots. (E) Mean (± SEM) freezing (fear) behavior of conditioned or control mice during five tone presentations (shaded blue bars). Conditioned N=11, Control N=3 mice. (F) Freezing of conditioned (left) or control (right) mice during five tone-on and tone-off sessions. (G) Mean (± SEM) normalized (z-scored) firing rate of aIC pyramidal neurons simultaneously recorded with freezing (shaded blue bars represent tone presentations). Conditioned N=108 putative pyramidal neurons from 11 mice, Control N=14 putative pyramidal neurons from 3 mice. (H) Firing rate of conditioned (left) or control (right) mice during five tone-on and tone-off sessions. (F and H) Paired sample t-test was used to compare means between tone-on and tone-off sessions in each group . *** p<0.001. (I) Spectrogram of aIC local field potential (LFP) recording of the conditioned and control groups before and during tone presentation. Conditioned N=21 LFP recordings from 11 mice, Control N=7 LFP recordings from 3 mice. (J) Power spectrum of aIC local field potential of the conditioned and control groups. Conditioned N=21 LFP recordings from 11 mice, Control N=7 LFP recordings from 3 mice. (K) Theta power analysis before tone (left) and during tone (right) of the conditioned and control groups. Cond.: conditioned group, Cont.: control group. The Mann–Whitney U test was used to assess the statistical difference between the conditioned and control groups in each session. *** p<0.001.
Figure 2
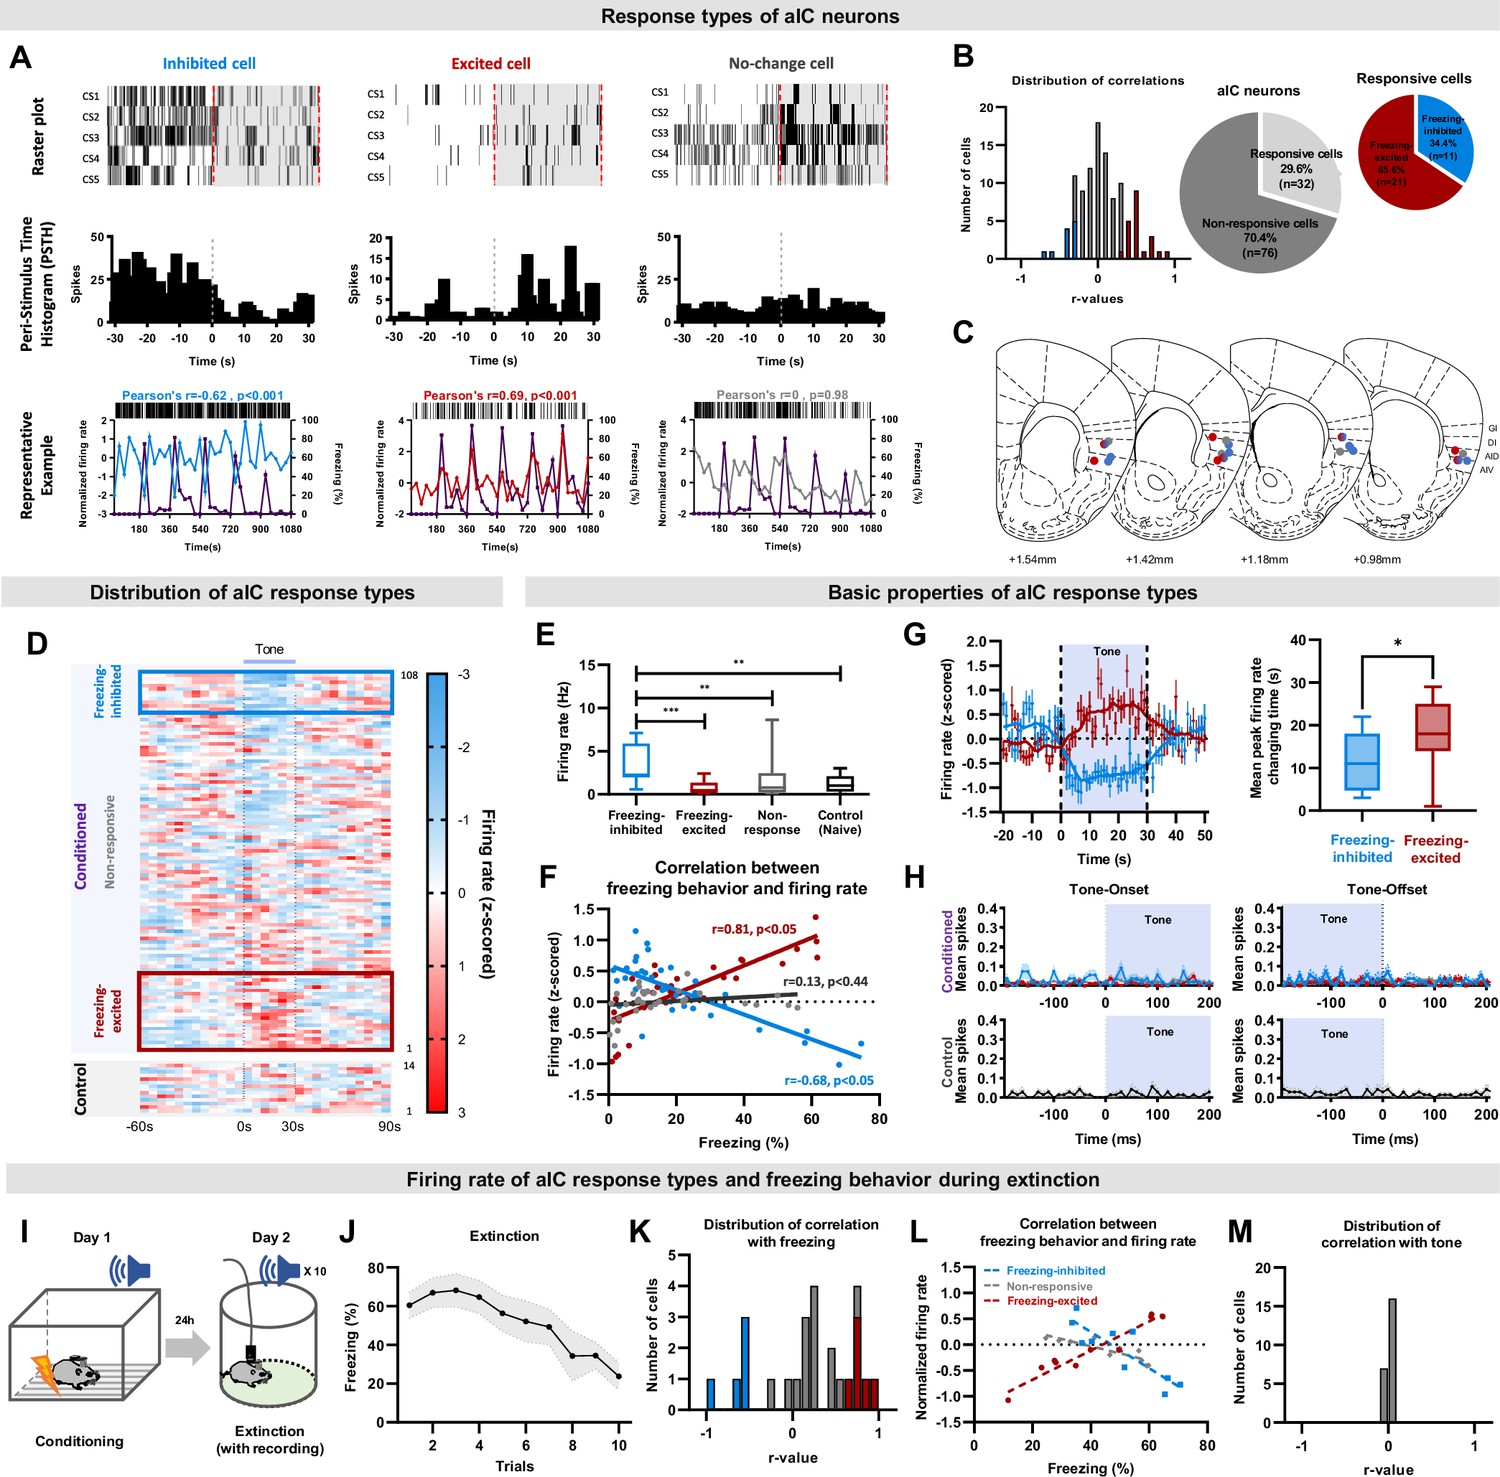
The activity of aIC pyramidal neurons bidirectionally correlates with freezing (fear) behaviors.
(A) Example of aIC neurons that decreased (inhibited-cell, left), increased (excited-cell, center), or did not change (no-change cell, right) their firing rate over five CS presentations (CS1-5). Top row: raster plot, each tick mark indicates when an action potential occurred. Middle row: peri-stimulus time histogram of each cell type over five CS presentations. Bottom row: plot of neuronal activity changes and freezing behavior of each cell type. Blue line: activity of inhibited cell, Red line: activity of excited cell, Gray line: activity of no-change cell, Purple line: freezing behavior. (B) Distribution of Pearson’s correlation coefficient values between freezing behavior and aIC neuronal activities of the fear conditioned group. The red bars represent cells with significant positive correlation (freezing-excited cells), blue bars represent cells with significant negative correlation (freezing-inhibited cells), and gray bars represent cells with no significant correlation (non-responsive) with freezing behavior. Significance was determined at p<0.05. Relative ratio of the non-responsive and responsive (freezing-excited or freezing-inhibited) cell types recorded in the fear conditioned group (right pie chart). (C) Locations of cell-types recorded. Red dot: freezing-excited or freezing-excited/non-responsive cells, blue dot: freezing-inhibited or freezing-inhibited/non-responsive cell, red and blue gradation dot: combination of freezing-excited/freezing-inhibited/non-responsive cells, gray dot: non-responsive cells. (D) Distribution of all recorded aIC neuronal activities (z-scored) before, during, and after CS (tone). presentation. Each line represents the mean response of one cell to five CSs, aligned from the lowest to the highest firing rate change in response to CS. The blue box represents cells classified as freezing-inhibited cells, and the red box represents cells classified as freezing-excited cells. (E) Baseline firing rates of freezing-excited cells (n=21), freezing-inhibited cells (n=11), non-responsive cells (n=76), and control cells (n=14). The Mann-Whitney U test was used to assess statistical differences between responsive types (** p<0.01, *** p<0.001). (F) Pearson correlation analysis for each neuronal response type and freezing behavior. (G) Firing rate changes of freezing-inhibited and freezing-excited cells analyzed in 1 s intervals (left). The box plot shows the difference in time that each cell type takes to reach peak changes. The Mann–Whitney U test was used to assess the statistical difference between the time that freezing-inhibited and freezing-excited cells take to reach peak firing rate change. * p<0.05 (H) Tone onset and offset analysis of the conditioned and the control groups. Blue line: freezing-inhibited, red line: freezing-excited, gray line: non-responsive cells. Mean (± standard deviation) spikes per second. (I) Schematic drawing of the conditioned fear extinction procedure. (J) Freezing (fear) behavior of mice during conditioned fear extinction (ten tone presentations, N=7 mice). Data are presented as Mean (± SEM). (K) Distribution of Pearson’s correlation coefficient values between freezing behavior and aIC neuronal activities. The red bars represent cells with significant positive correlation (freezing-excited cells, n=5 cells), blue bars represent cells with significant negative correlation (freezing-inhibited cells, n=5 cells), and gray bars represent cells with no significant correlation (n=25 cells) with freezing behavior. Significance was determined at p<0.05. (L) Pearson correlation analysis for each neuronal response type and freezing behavior. (M) Distribution of Pearson’s correlation coefficient values between tone and aIC neuronal activities.
Figure 3 with 1 supplement
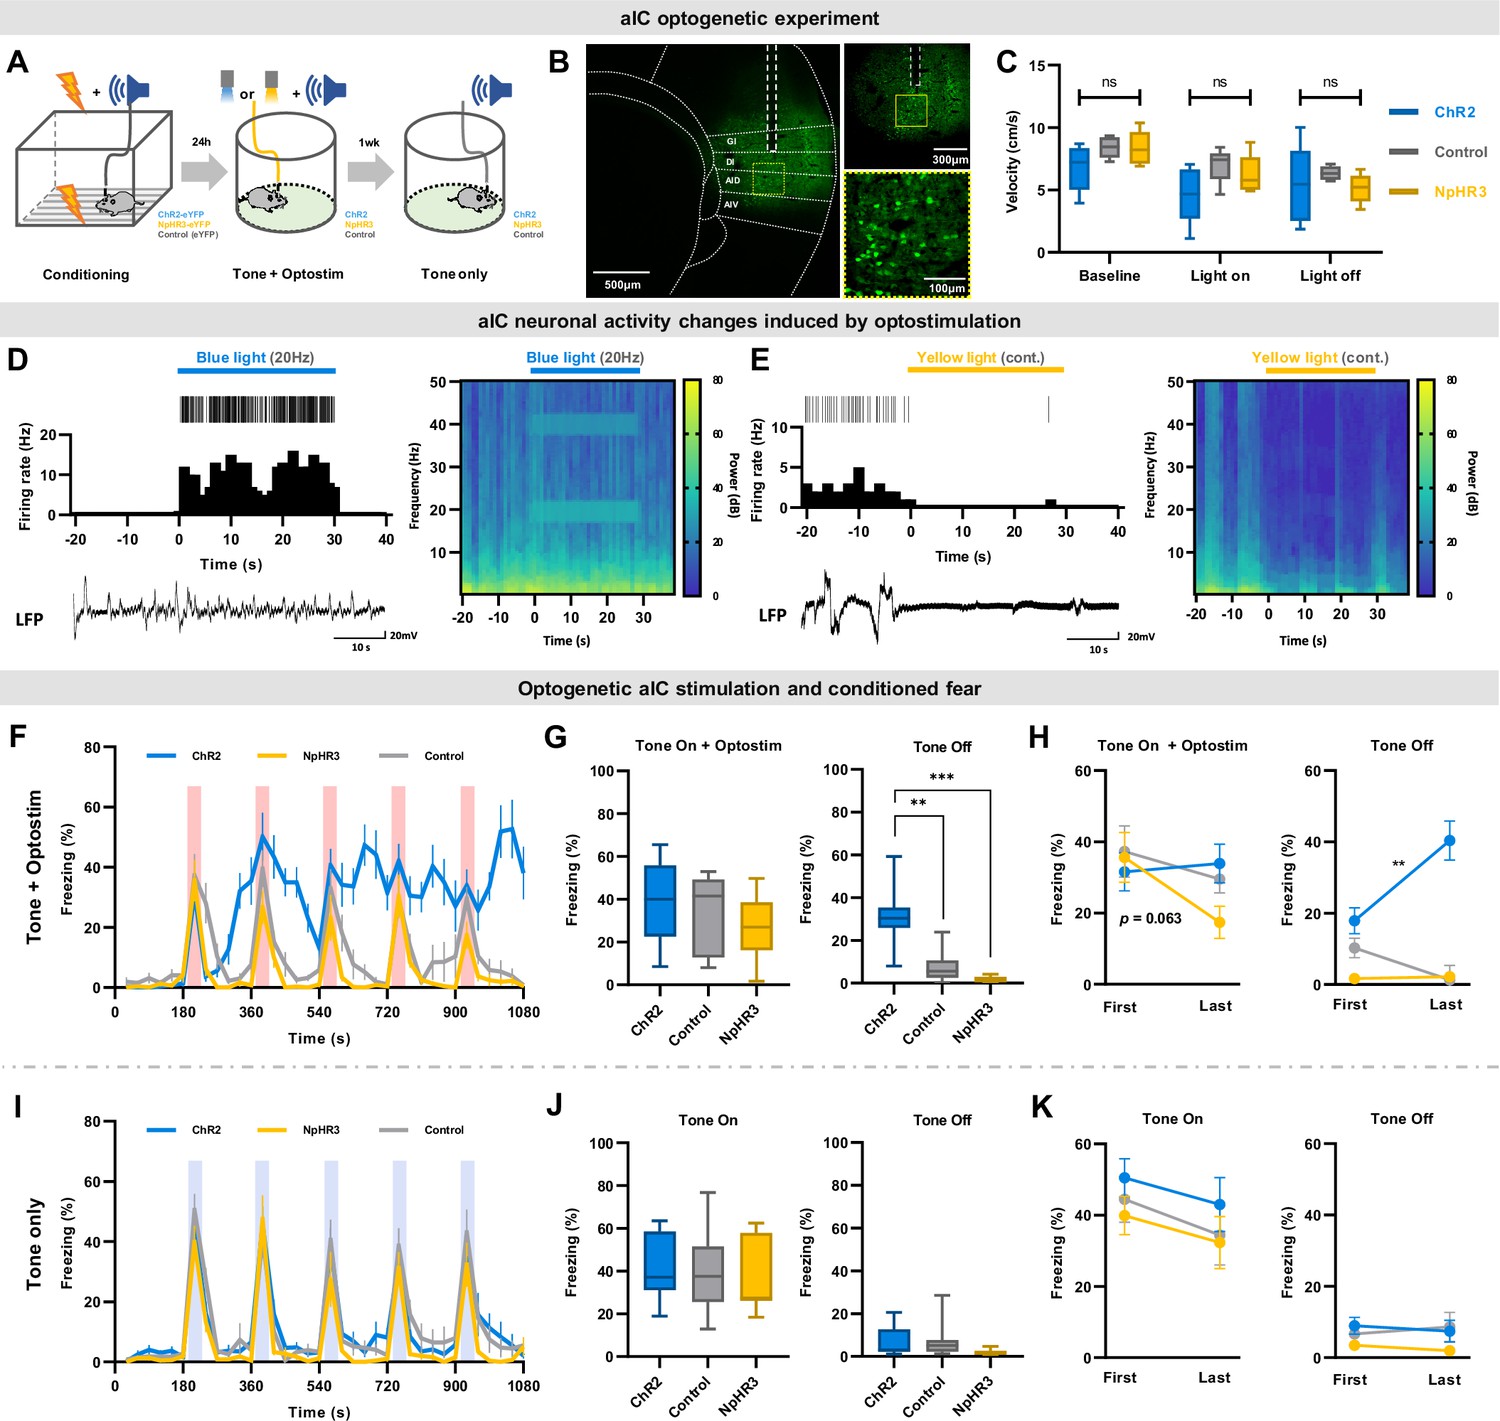
Optogenetic regulation of aIC pyramidal neuron output modulates conditioned fear expression.
(A) Schematic drawing of the experimental protocol. Experimental groups consisted of viral vectors injected for excitation (AAV-CaMKII-ChR2-eYFP), inhibition (AAV-CaMKII-NpHR3-eYFP), and control (AAV-CaMKII-eYFP). (B) Histological sample showing viral expression pattern and optic fiber placement. Dashed white line depicts location of optic fiber placement. Yellow dotted square indicates the ×40 magnified region shown below. (C) Velocity before (baseline), during (light on), and after (light off) optostimulation of the three groups in an open field test (ChR2=13 mice, NpHR3=7 mice, Control=13 mice). (D) Simultaneous single unit and local field potential (LFP) recording during the 20 Hz blue-light activation of ChR2-expressing neurons. Juxtaposed unit activity (each tick indicates an action potential), peri-stimulation time histogram, and LFP (left). Local brain rhythm (frequency) changes induced by blue light stimulation (right). (E) Simultaneous single unit and local field potential (LFP) recording during the continuous (cont.) yellow-light activation of NpHR-expressing neurons. Juxtaposed unit activity (each tick indicates an action potential), peri-stimulation time histogram, and LFP (left). Local brain rhythm (frequency) changes induced by yellow light stimulation (right). (F) Mean (± SEM) freezing behavior of mice during the five CS (tone) and optostimulation delivery. (G) Freezing behavior of the five tone-on with optostimulation and tone-off periods. (Kruskal–Wallis test; **p<0.01, ***p<0.001). (H) Comparison between the first and the last tone +optostimulation and tone-off session freezing behavior among groups (Wilcoxon signed ranks test; **p<0.01). (I) Mean (± SEM) freezing behavior of mice during five CS-only presentations without any optostimulation. (J) Freezing behavior of the five tone-on and tone-off periods. (K) Comparison between the first and the last tone and tone-off session freezing behavior among groups. (F–K) Blue line represents optical excitation (ChR2, N=13 mice), yellow line represents optical inhibition (NpHR3, N=7 mice), and gray line represents control (Control, N=13 mice). (F, G, L, J) The Kruskal–Wallis test was used to test statistical significance of among groups. (H and K) The Wilcoxon signed ranks test was used to compare means of freezing behavior between first and last sessions in each group.
Figure 3—figure supplement 1
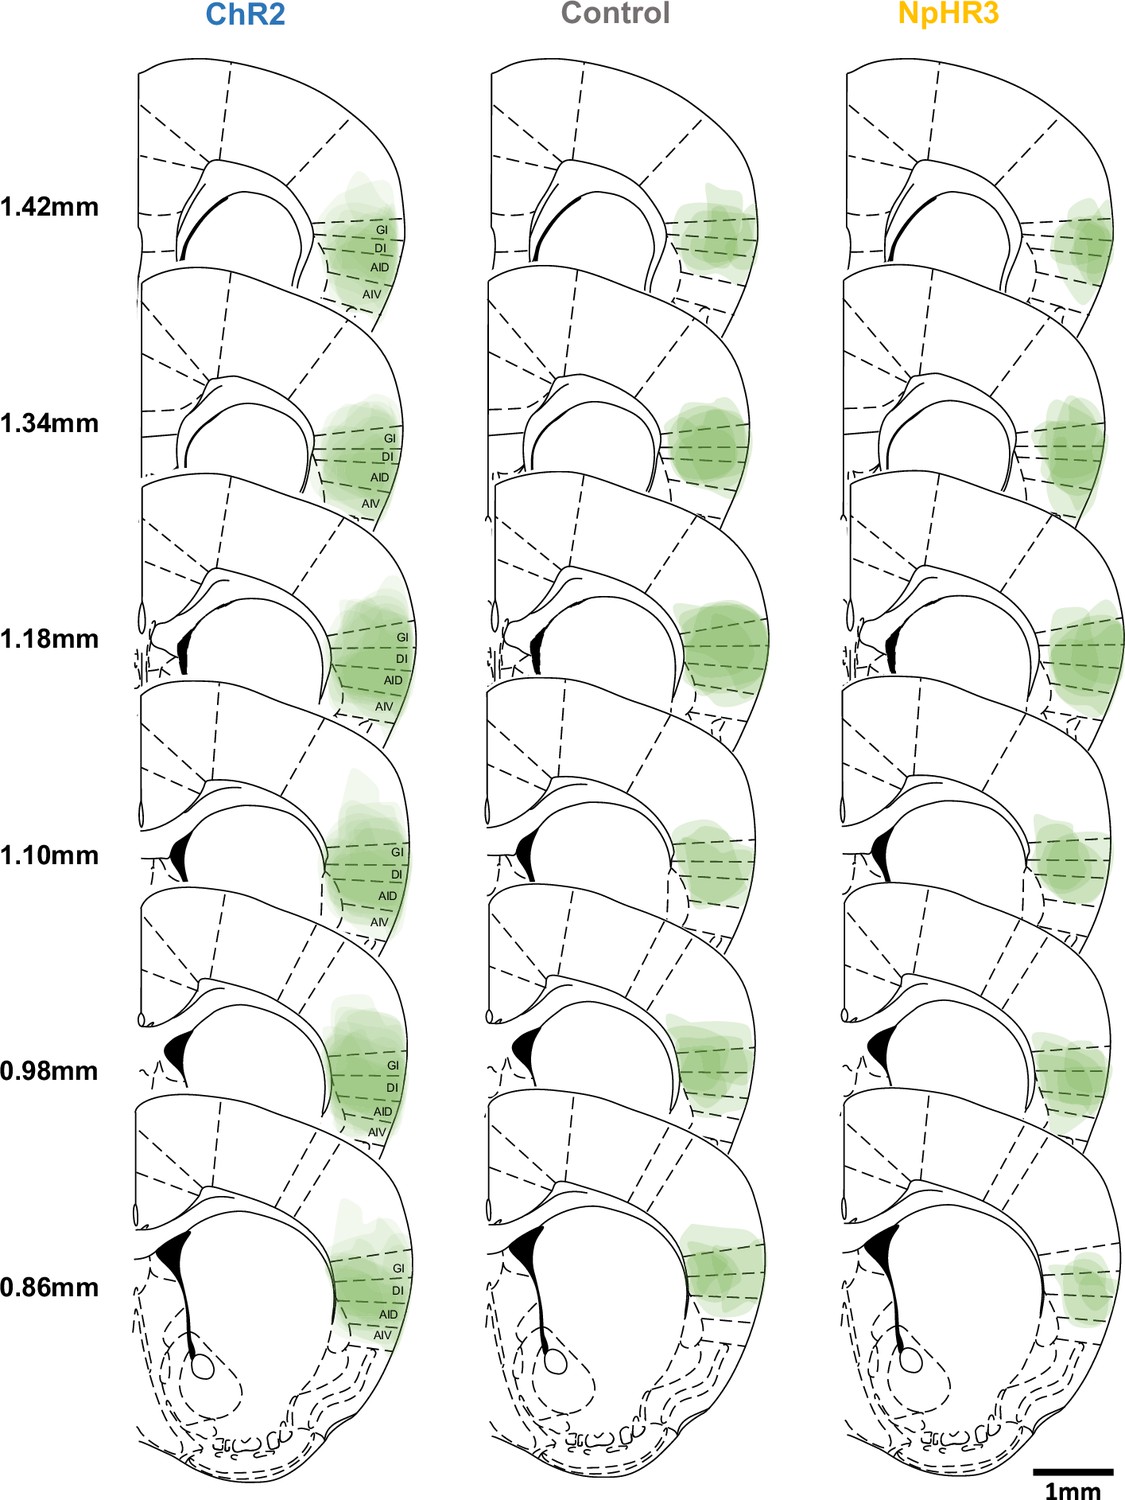
Overlaid viral expression patterns of the excitation (ChR2), control (eYFP), and inhibition (NpHR3) groups in the aIC.
GI: granular insular cortex, DI: dysgranular insular cortex, AID: dorsal agranular insular cortex, AIV: ventral agranular insular cortex.
Figure 4 with 1 supplement
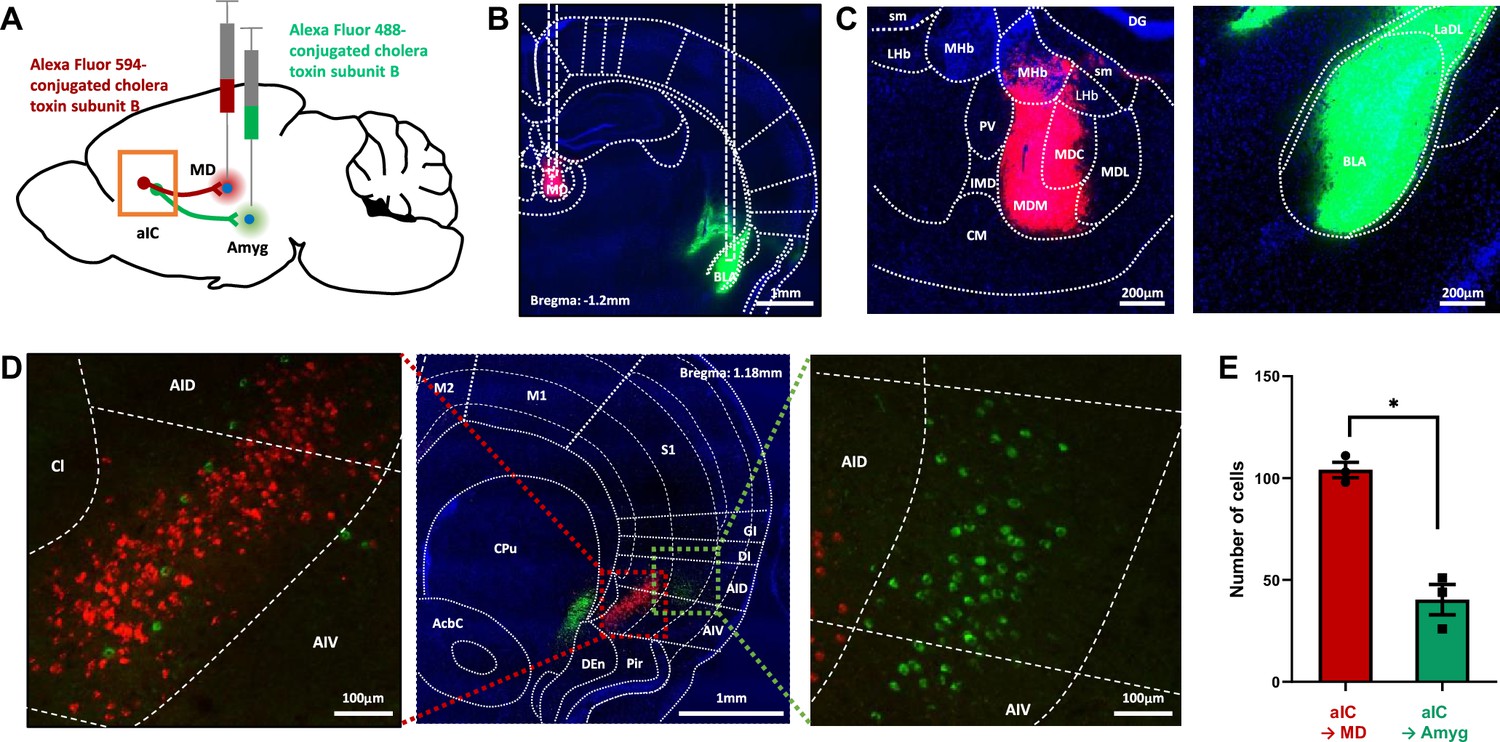
Tracing of aIC neurons that projects to the thalamus or the amygdala.
(A) Schematic drawing of cholera toxin B (CTB) retrograde tracers injected into the amygdala (green) and thalamus (red). (B) Image showing the injection sites. (C) High-resolution of the panel b image. sm: stria medullaris of the thalamus, LHb: lateral habenular nucleus, MHb: medial habenular nucleus, DG: dentate gyrus, PV: paraventricular thalamic nucleus, IMD: intermediodorsal thalamic nucleus, MDM: mediodorsal thalamic nucleus, medial part, MDC: mediodorsal thalamic nucleus, central part, MDL: mediodorsal thalamic nucleus, lateral part, CM: central medial thalamic nucleus, LaDL: lateral amygdaloid nucleus, dorsolateral part, and BLA: basolateral amygdaloid nucleus, anterior part. (D) Sample image of neurons in the aIC that either project to the thalamus (red) or the amygdala (green). A high-resolution image of the thalamus-projecting aIC neurons is shown on the left, and that of the amygdala-projecting aIC neurons is shown on the right. M2: secondary motor cortex, M1: primary motor cortex, S1: primary somatosensory cortex, GI: granular insular cortex, DI: dysgranular insular cortex, AID: agranular insular cortex, dorsal part, AIV: agranular insular cortex, ventral part, Pir: piriform cortex, Den: dorsal endopiriform nucleus, CPu: caudate putamen (striatum), and AcbC: accumbens nucleus, core. (E) The number of aIC neurons that were labeled to either project to the thalamus (Alexa fluor 594, n=3 sections per mice, N=3 mice) or the amygdala (Alexa fluor 488, n=3 sections per mice, N=3 mice). Data are presented as mean ± SEM. The Mann-Whitney U test was used to assess statistical difference (* p<0.05).
Figure 4—figure supplement 1
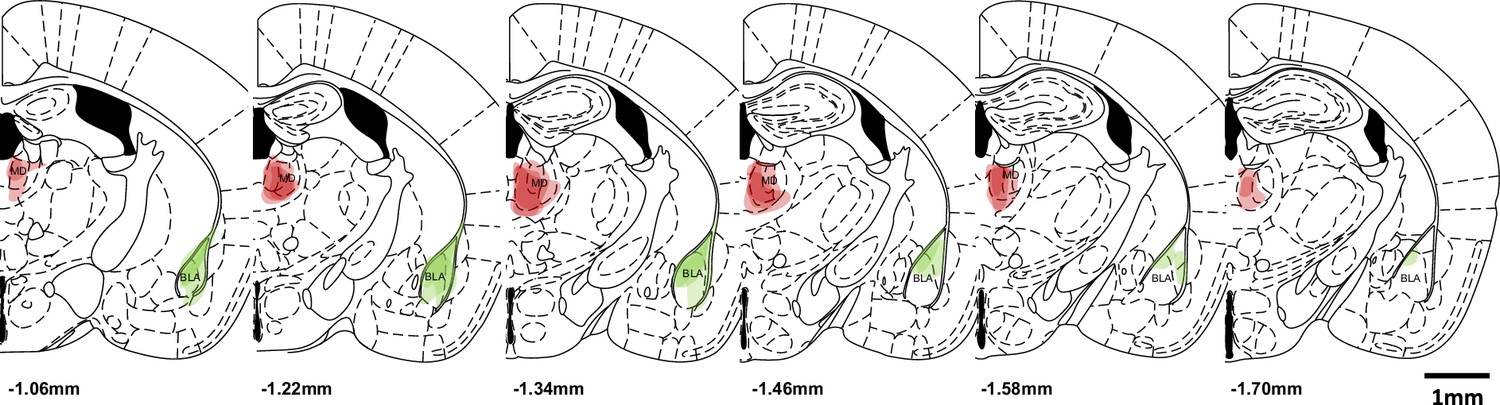
Overlaid tracer expression patterns of all samples at the injection sites (MD: mediodorsal thalamus and BLA: basolateral amygdala).
Figure 5 with 1 supplement
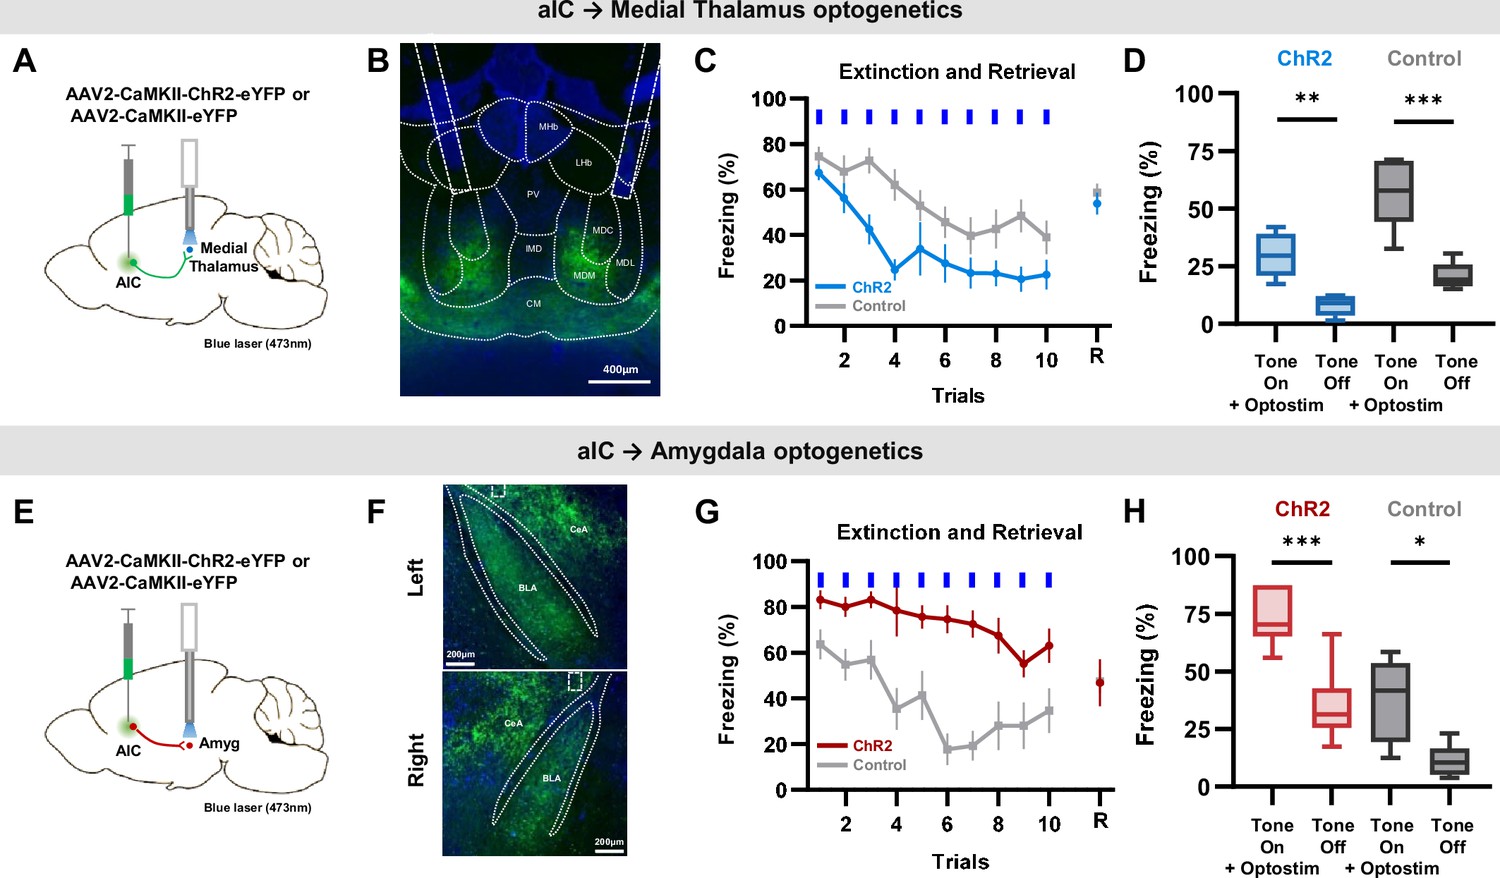
Specific optogenetic activation of aIC projection to the medial thalamus or the amygdala bidirectionally regulate conditioned fear expression.
(A) Schematic drawing of the adeno-associated virus (AAV) injection and optostimulation sites. Viral vectors for opsin expression (AAV-CaMKII-ChR2-eYFP) or control (AAV-CaMKII-eYFP) were bilaterally injected in the aIC, and bilateral optostimulation was delivered in the mid-thalamic region. (B) Example expression pattern of aIC projection terminals in the thalamic region and the location of bilateral optic fiber placement outlined by dashed lines. LHb: lateral habenular nucleus, MHb: medial habenular nucleus, PV: paraventricular thalamic nucleus, IMD: intermediodorsal thalamic nucleus, MDM: mediodorsal thalamic nucleus, medial part, MDC: mediodorsal thalamic. nucleus, central part, MDL: mediodorsal thalamic nucleus, lateral part, CM: central medial thalamic nucleus. (C) Mean (± SEM) freezing behavior of mice expressing ChR2 (N=12) or control (eYFP, N=8) induced by optostimulation of aIC projection terminating in the thalamus to repeated CS (tone). Blue bars indicate when tone and optostimulation were delivered. Last point indicates freezing behavior when tone was delivered without optostimulation 24 hr after the extinction protocol (retrieval). (D) Freezing behavior during the ‘Tone on +optostim’ and ‘Tone off’ of the aIC thalamus ChR2 and control groups. (E) Schematic drawing of AAV injection and optostimulation sites. Viral vectors for opsin expression (AAV-CaMKII-ChR2-eYFP) or control (AAV-CaMKII-eYFP) were bilaterally injected in the aIC, and bilateral optostimulation was delivered in the anterior-amygdala region. (F) Example expression pattern of aIC projection terminals in the amygdala and location of bilateral optic fiber placement outlined by dashed lines. CeA: central nucleus of the amygdala, BLA: basolateral amygdaloid nucleus, anterior part. (G) Mean (± SEM) freezing behaviors of mice expressing ChR2 (N=6) or control (eYFP, N=6) induced by optostimulation of aIC projection terminating in the amygdala to repeated CS (tone). Blue bars indicate when tone and optostimulation were delivered. Last point indicates freezing behavior when tone was delivered without optostimulation 24 hr after the extinction protocol (retrieval). (H) Freezing behavior during the ‘Tone on +optostim’ and ‘Tone off’ of the aIC-amygdala ChR2 and control groups. (C and G) Two-way repeated measure ANOVAs were performed to compare freezing behavior between groups. (D and H) Two-way ANOVA with Bonferroni post hoc was used to compare the effect of ‘Tone on +optostim’ and ‘Tone off’ as well as the difference between the ChR2 and control groups. There was a statistically significant group effect (ChR2 vs control; Medial Thalamus: p<0.001, Amygdala: p<0.001) and light effect (Tone on +optostim vs Tone off; Medial Thalamus: p<0.001, Amygdala: p<0.001), but no interaction effect between group and light (Medial Thalamus: p=0.128, Amygdala: p=0.311). Paired t-test was used to compare means of ‘Tone on +optostim’ and ‘Tone off’ in each group. (*p<0.05, **p<0.01, ***p<0.001).
Figure 5—figure supplement 1
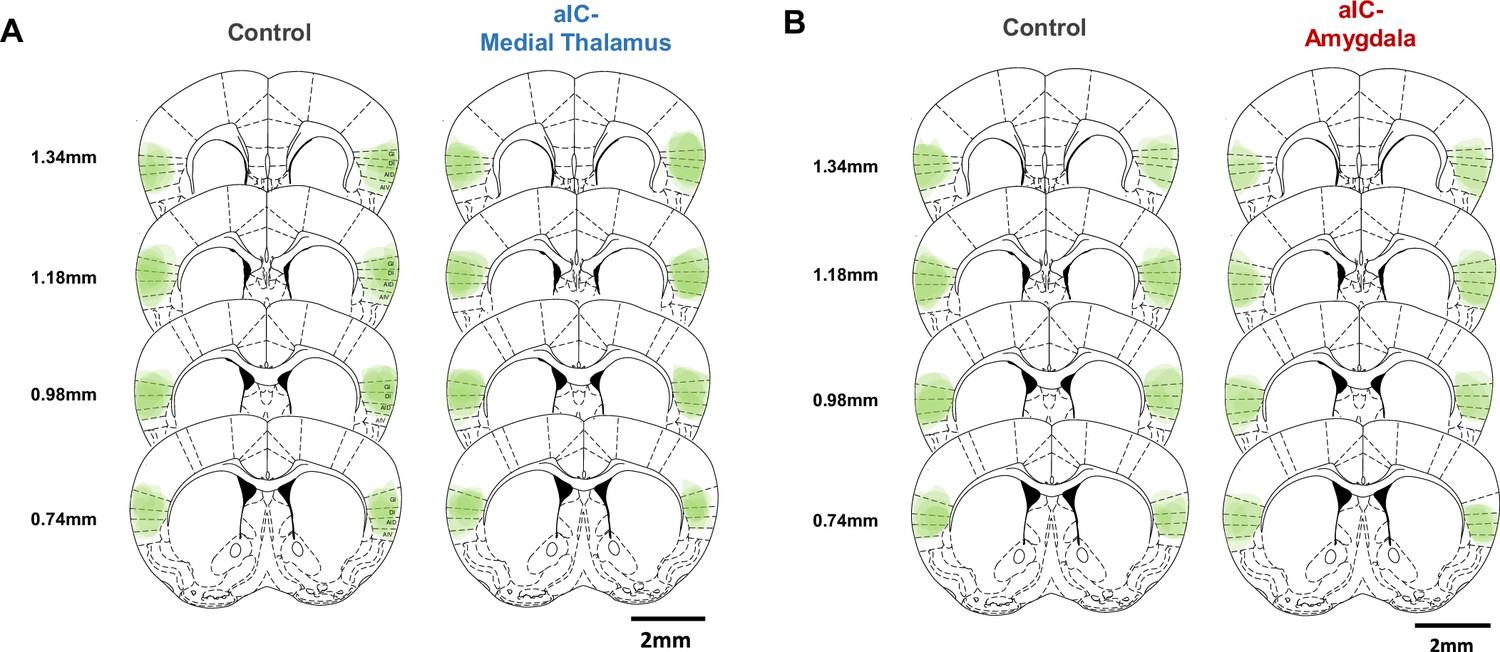
Overlaid opsin expression patterns in the anterior insular cortex of the different experimental groups.
(A) Overlaid viral expression patterns in the aIC of the control and aIC-medial thalamus groups. (B) Overlaid viral expression patterns in the aIC of the control and aIC-amygdala groups. GI: granular insular cortex, DI: dysgranular insular cortex, AID: dorsal agranular insular cortex, AIV: ventral agranular insular cortex.
Author response image 1

Additional files
Download links
A two-part list of links to download the article, or parts of the article, in various formats.
Downloads (link to download the article as PDF)
Open citations (links to open the citations from this article in various online reference manager services)
Cite this article (links to download the citations from this article in formats compatible with various reference manager tools)
Bidirectional fear modulation by discrete anterior insular circuits in male mice
eLife 13:RP95821.
https://doi.org/10.7554/eLife.95821.3


