Root-specific theanine metabolism and regulation at the single-cell level in tea plants (Camellia sinensis)
- State Key Laboratory of Tea Plant Biology and Utilization, Anhui Agricultural University, China
- Department of Plant Biology, College of Biological Sciences, University of California, Davis, United States
Figures
Figure 1 with 1 supplement
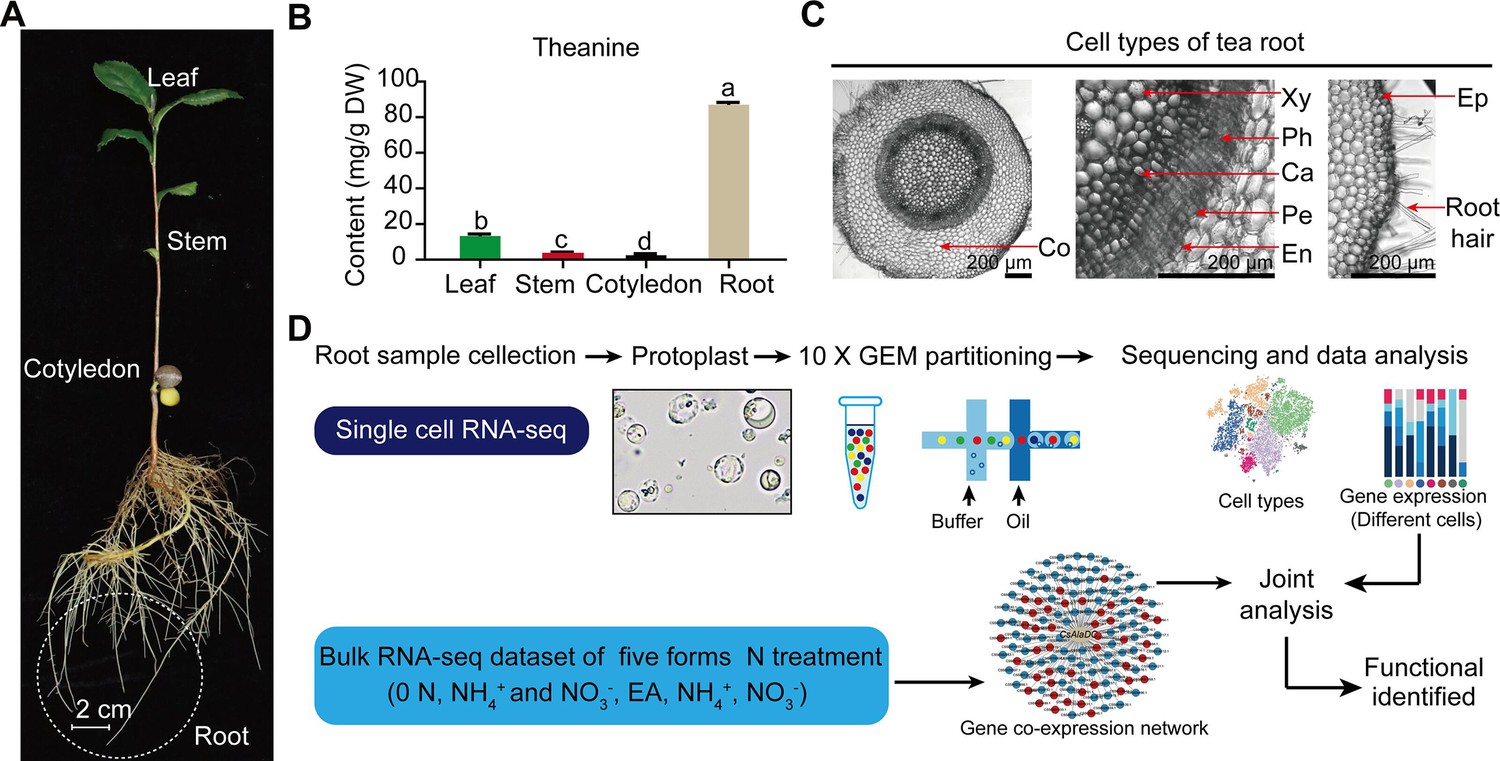
Process employed for single-cell RNA sequencing (scRNA-seq) of tea plant roots.
(A) Tea seedlings were used for theanine detection and scRNA-seq. Tea plant roots (~2.0 cm in length from the root tip) were harvested and used for scRNA-seq. (B) Theanine contents of leaf, stem, cotyledon, and root. (C) Cross section of tea plant roots (from the root tip back ~2.0 cm). Co, cortex; Xy, xylem; Ph, phloem; Ca, cambium; Pe, pericycle; En, endodermis; EP, epidermis. Scale bar = 200 μm. (D) Flow chart of scRNA-seq analyses.
Figure 1—figure supplement 1
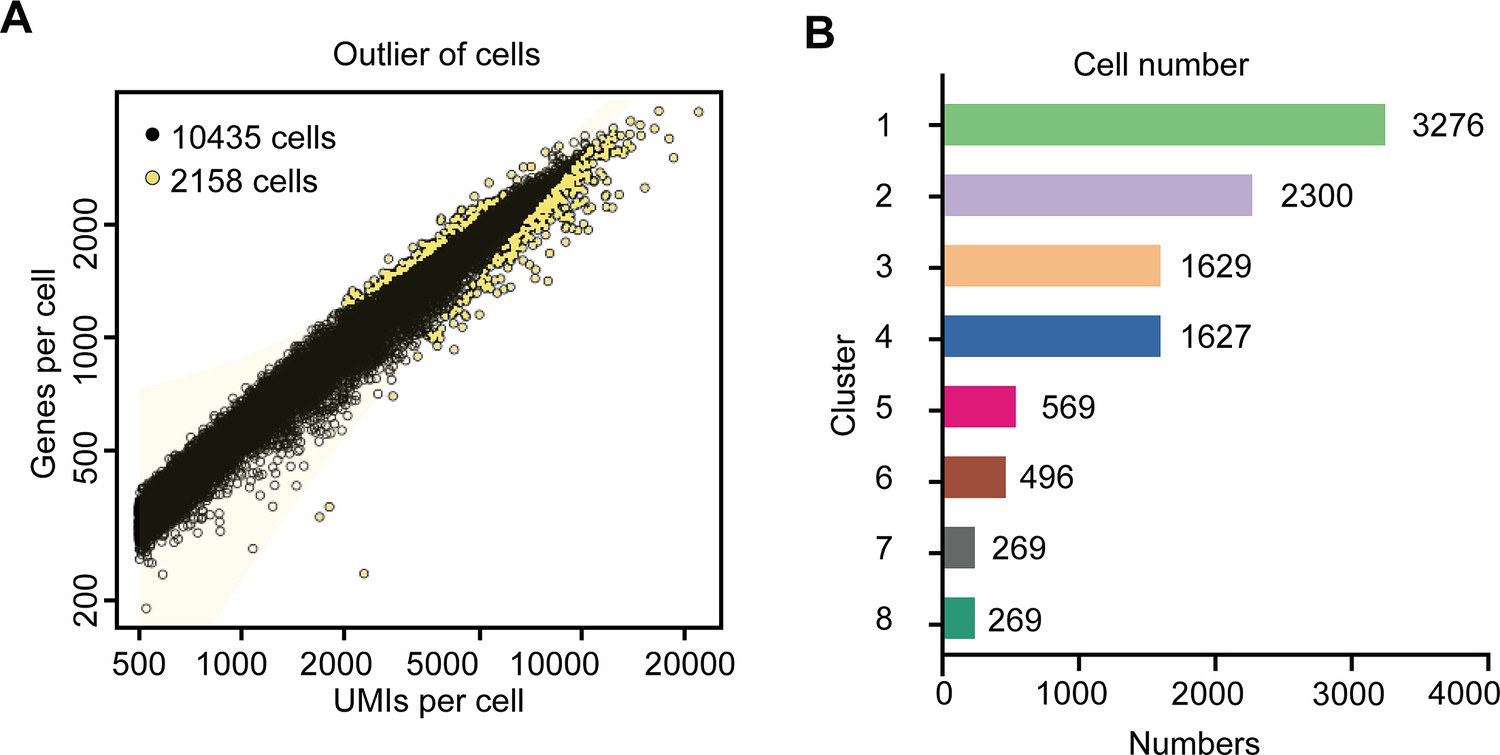
Summary of the tea plant root single-cell RNA sequencing (scRNA-seq) data.
(A) Filter delocalized cell maps fitted to generalized linear models. The horizontal axis is the unique molecular identifiers (UMI) number in each cell, and the vertical axis is the gene number in each cell. According to the linear relationship between the UMI and genes per cell data, the distribution model is fitted. The yellow points represent delocalized cells, which will be removed in the follow-up analysis. (B) The cell number in each cell cluster based on the tea plant root scRNA-seq data.
Figure 2 with 5 supplements
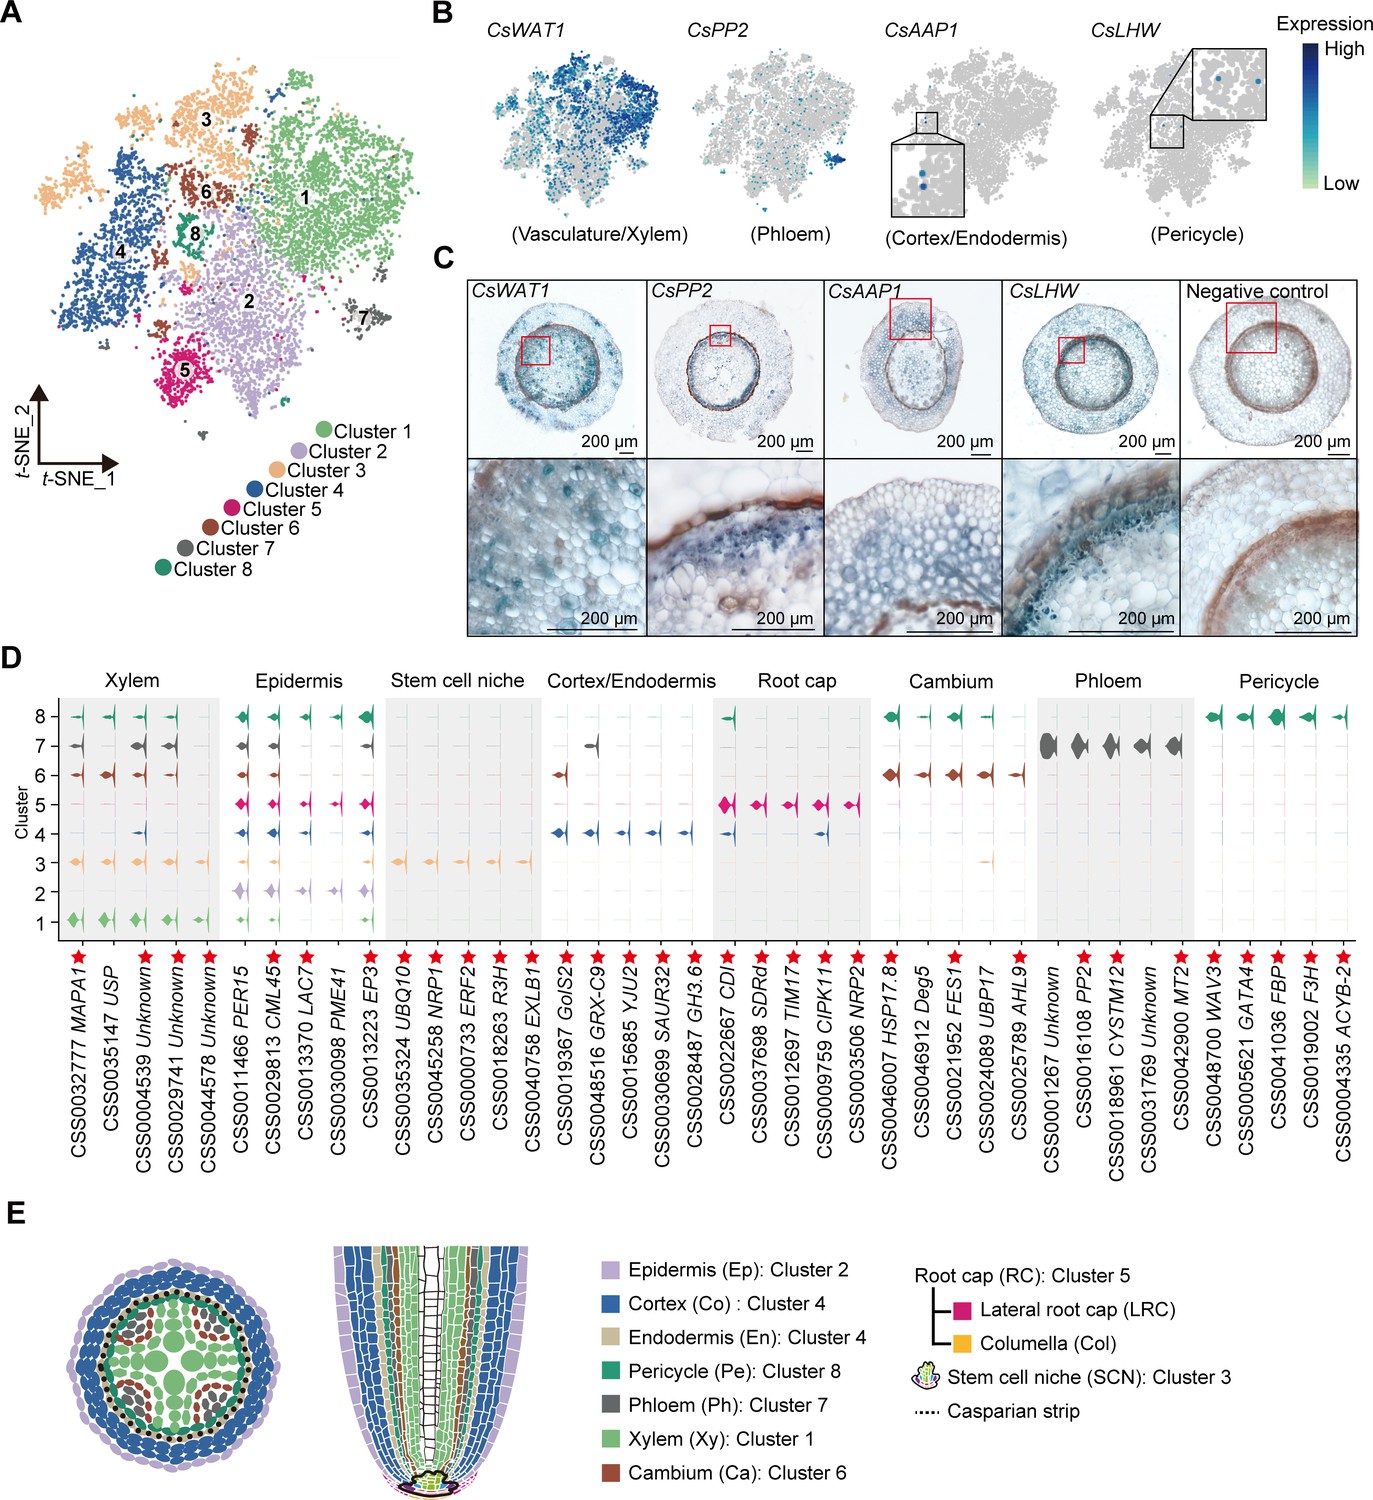
Annotation of cell clusters based on single-cell RNA sequencing (scRNA-seq) analysis of tea plant roots.
(A) t-Distributed stochastic neighborhood embedding (t-SNE) visualization plot of 10,435 tea plant root cells showed that they were grouped into eight cell clusters. Each dot denoted a single cell. (B) t-SNE visualization of cell-type marker genes of root cells. Color bar indicates gene expression level. (C) In situ reverse transcription polymerase chain reaction (In situ RT-PCR) of CsWAT1, CsPP2, CsAAP1, and CsLHW. The blue areas of sliced tissue represent regions where genes are expressed. The red box represents the magnified areas of root sections. Scale bar = 200 μm. (D) Violin plot showed the expression patterns for the top 5 marker genes of each cell cluster. The height of violin represents the gene expression level, and the width represents the proportion of cells expressing in the cluster. Asterisks represent homologous Arabidopsis thaliana marker genes that can be found in PlantscRNAdb. (E) Schematic of the tea plant root anatomy, cell types, and their associated clusters.
Figure 2—figure supplement 1
Cell cluster annotation.
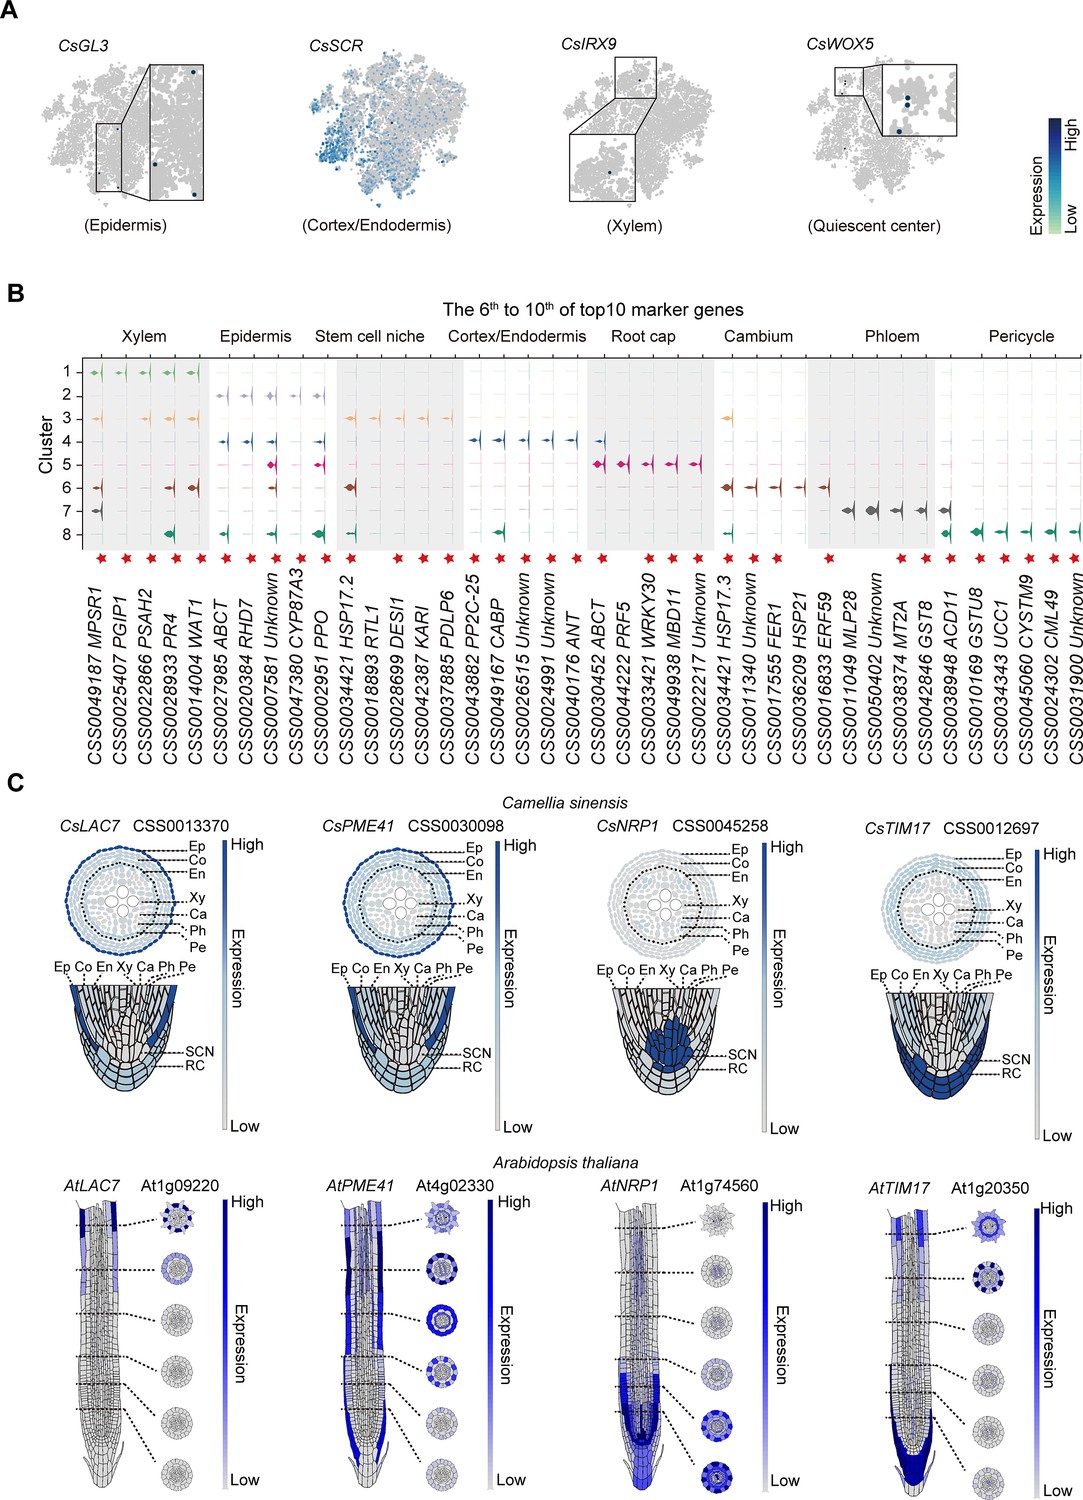
(A) t-Distributed stochastic neighborhood embedding (t-SNE) visualization of cell-type marker genes (CsGL3, CsSCR, CsIRX9, and CsWOX5) of root cells. Color bar indicated gene expression level. (B) Violin plot showing expression patterns of 6th to 10th in the top10 differential marker genes of each cell cluster. The height and width of the violin represent the gene expression level and the proportion of cells expressing in the cluster, respectively. Asterisks represent homologous marker genes that are present in PlantscRNAdb. (C) The tissue-located heatmap of LAC7, PME41, NRP1, and TIM17. The color bar illustrated gene expression level for the single-cell RNA sequencing (scRNA-seq) data. The Arabidopsis thaliana data and pictures were generated from the Root Cell Atlas (https://rootcellatlas.org/).
Figure 2—figure supplement 2
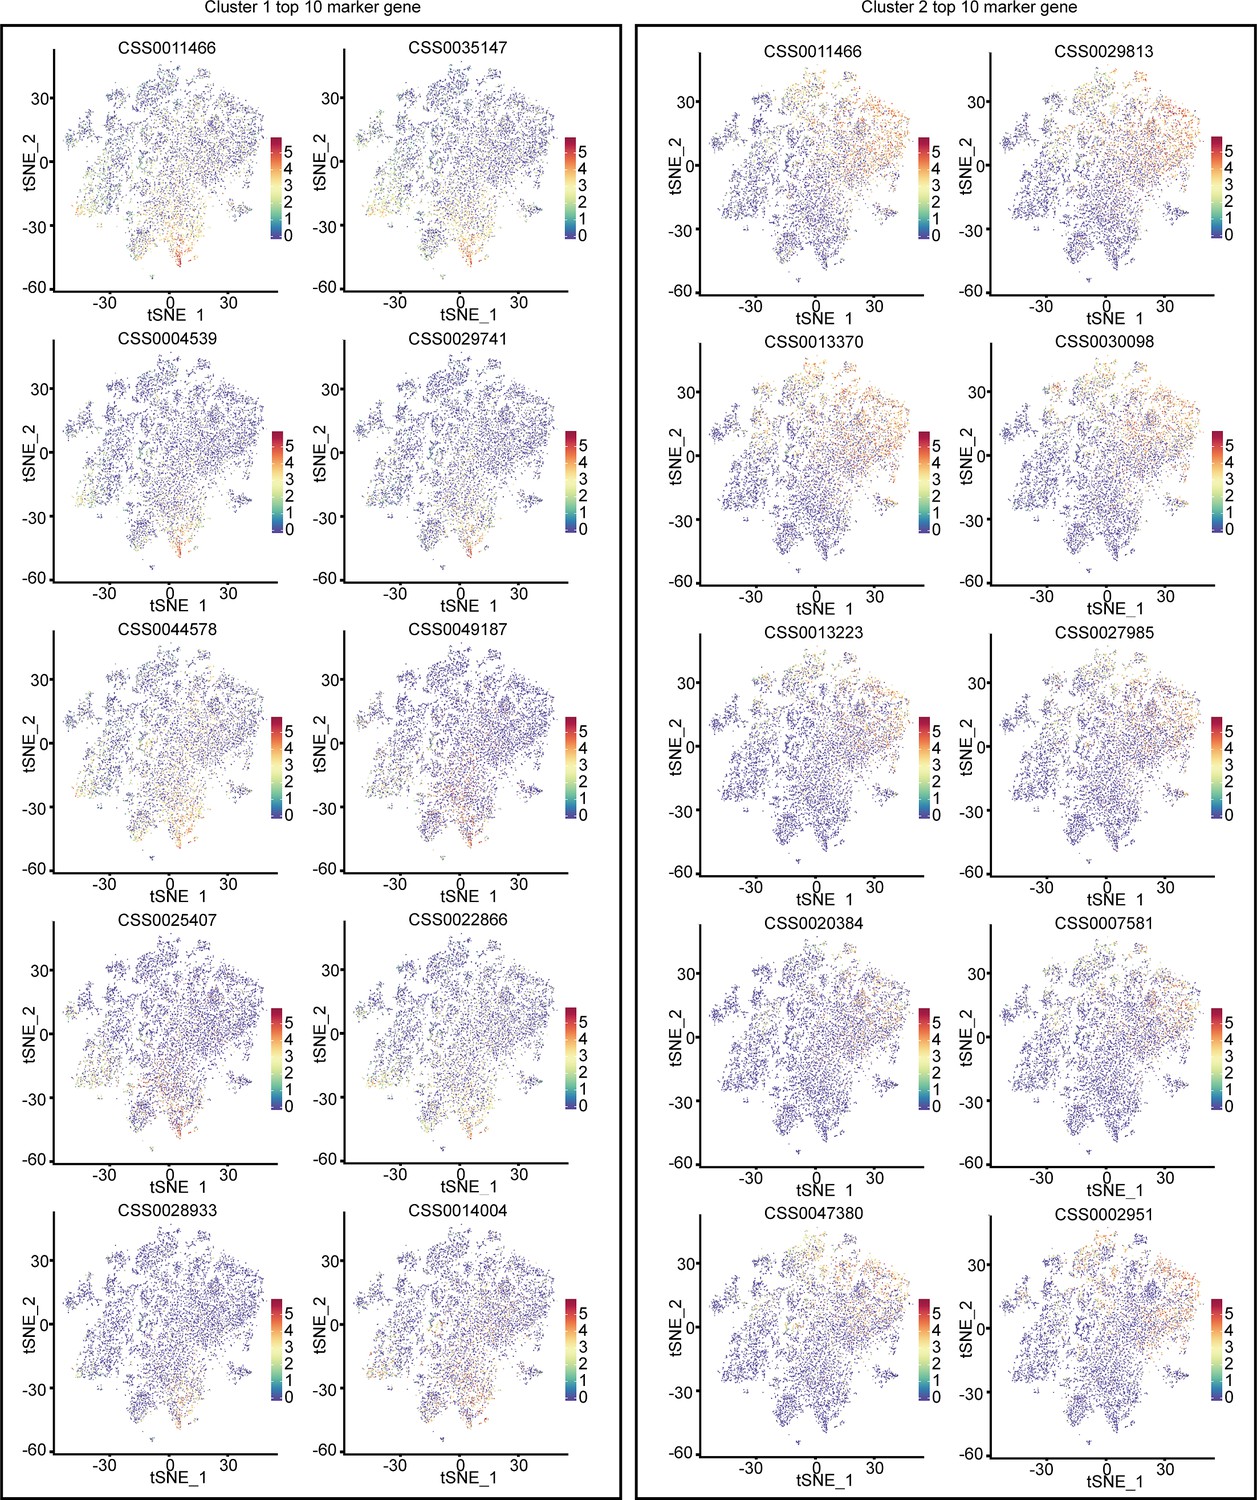
t-Distributed stochastic neighborhood embedding (t-SNE) visualization of Clusters 1 and 2 top 10 marker genes.
t-SNE plots show the transcript accumulation of the Clusters 1 and 2 top 10 marker genes in individual cells. Color intensity indicates the relative transcript level for the indicated gene in each cell.
Figure 2—figure supplement 3
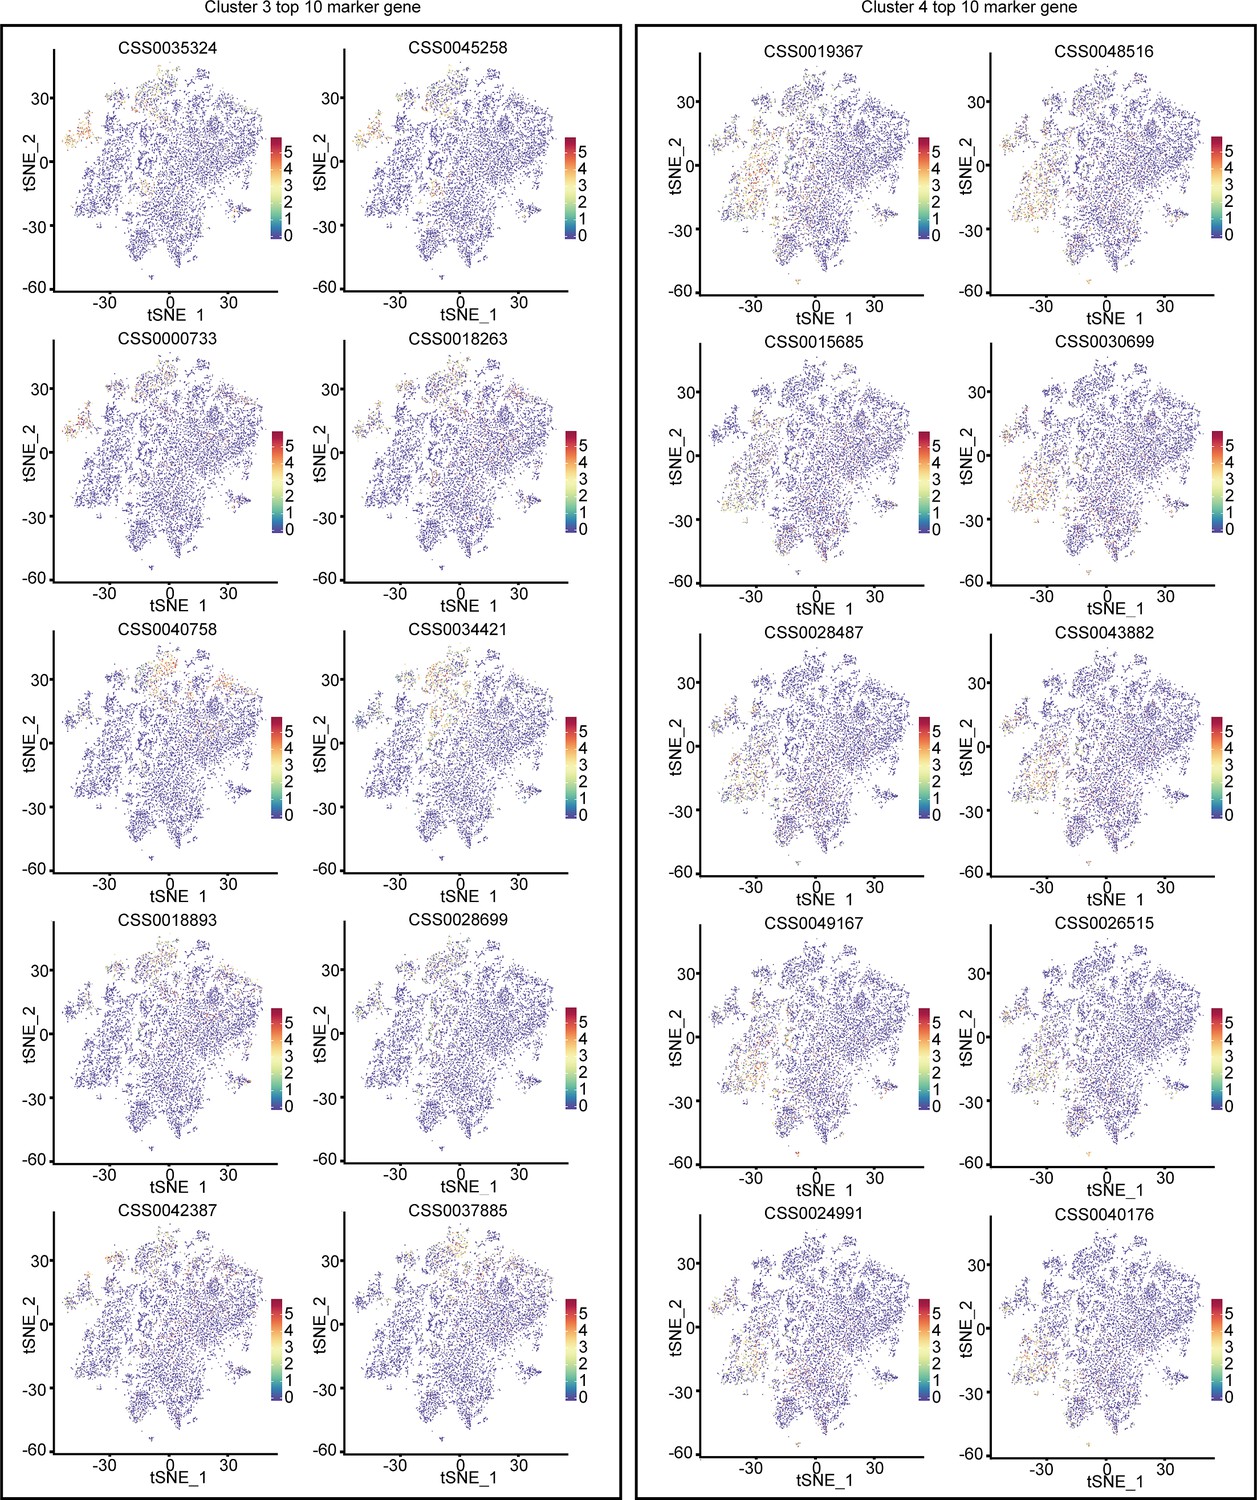
t-Distributed stochastic neighborhood embedding (t-SNE) visualization of Clusters 3 and 4 top 10 marker genes.
t-SNE plots show the transcript accumulation of the Clusters 3 and 4 top 10 marker genes in individual cells. Color intensity indicates the relative transcript level for the indicated gene in each cell.
Figure 2—figure supplement 4
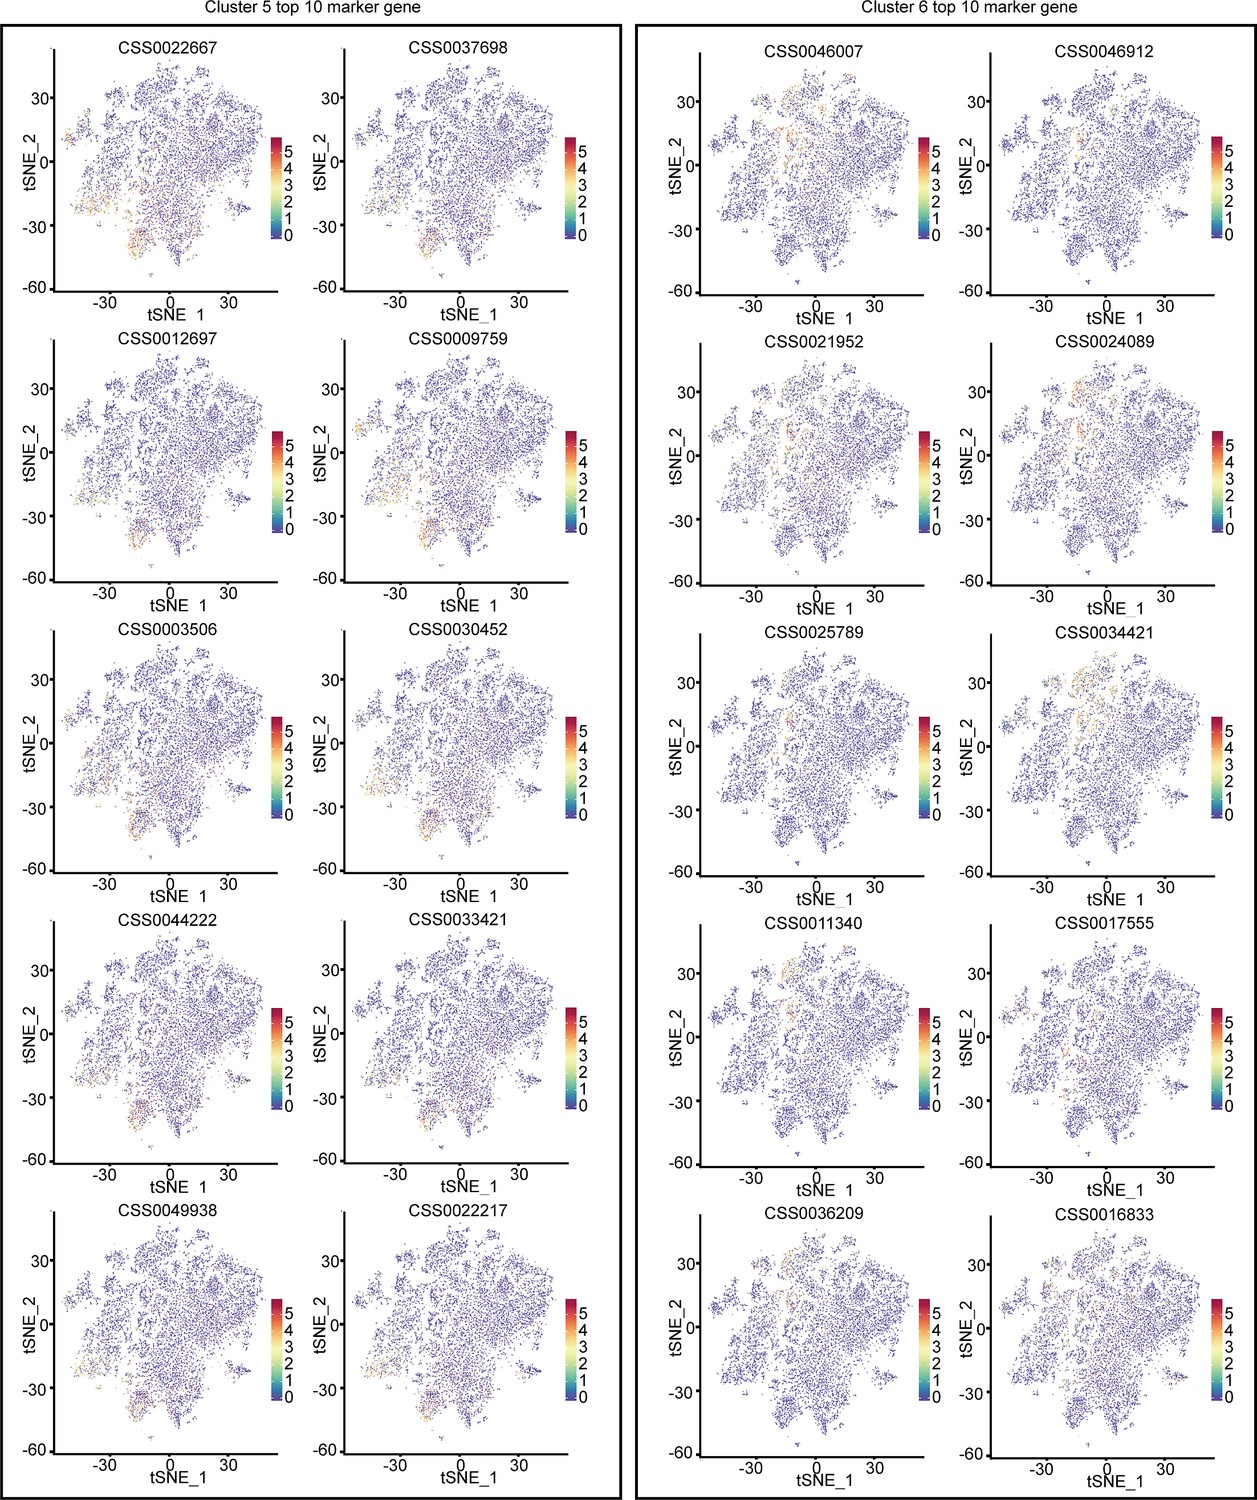
t-Distributed stochastic neighborhood embedding (t-SNE) visualization of Clusters 5 and 6 top 10 marker genes.
t-SNE plots show the transcript accumulation of the Clusters 5 and 6 top 10 marker genes in individual cells. Color intensity indicates the relative transcript level for the indicated gene in each cell.
Figure 2—figure supplement 5
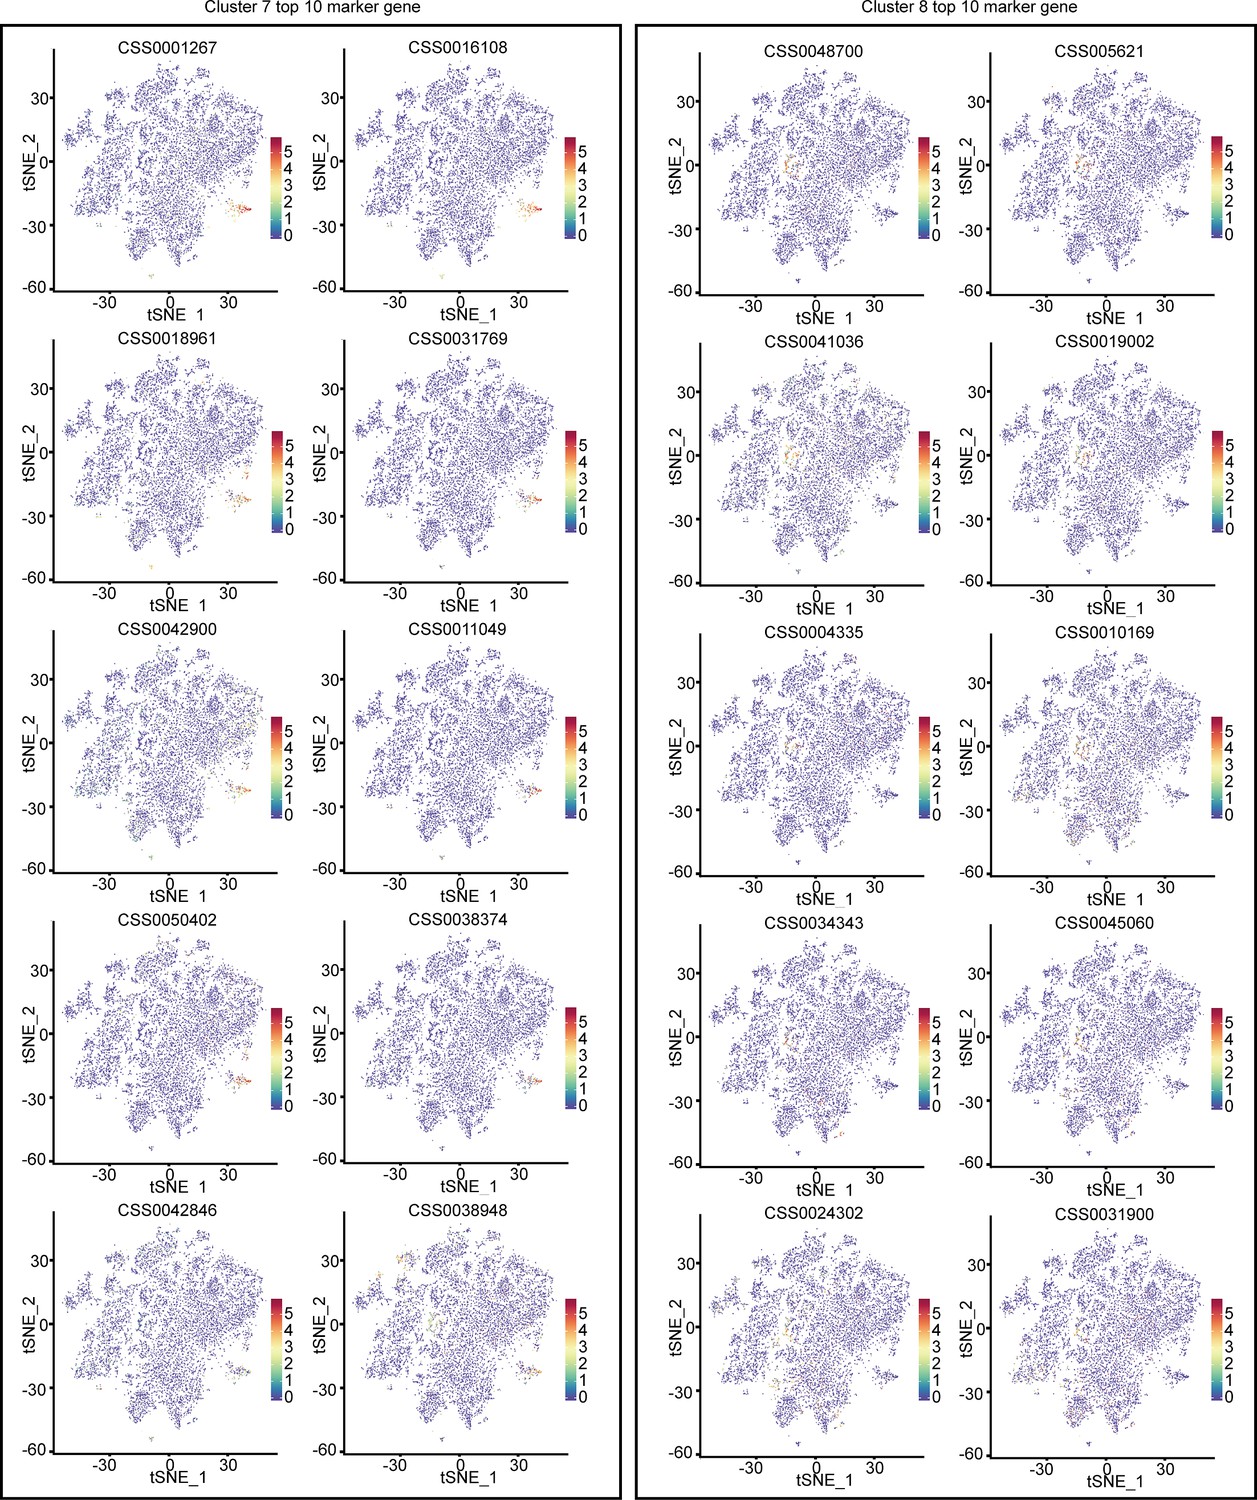
t-Distributed stochastic neighborhood embedding (t-SNE) visualization of Clusters 7 and 8 top 10 marker genes.
t-SNE plots show the transcript accumulation of the Clusters 7 and 8 top 10 marker genes in individual cells. Color intensity indicates the relative transcript level for the indicated gene in each cell.
Figure 3 with 1 supplement
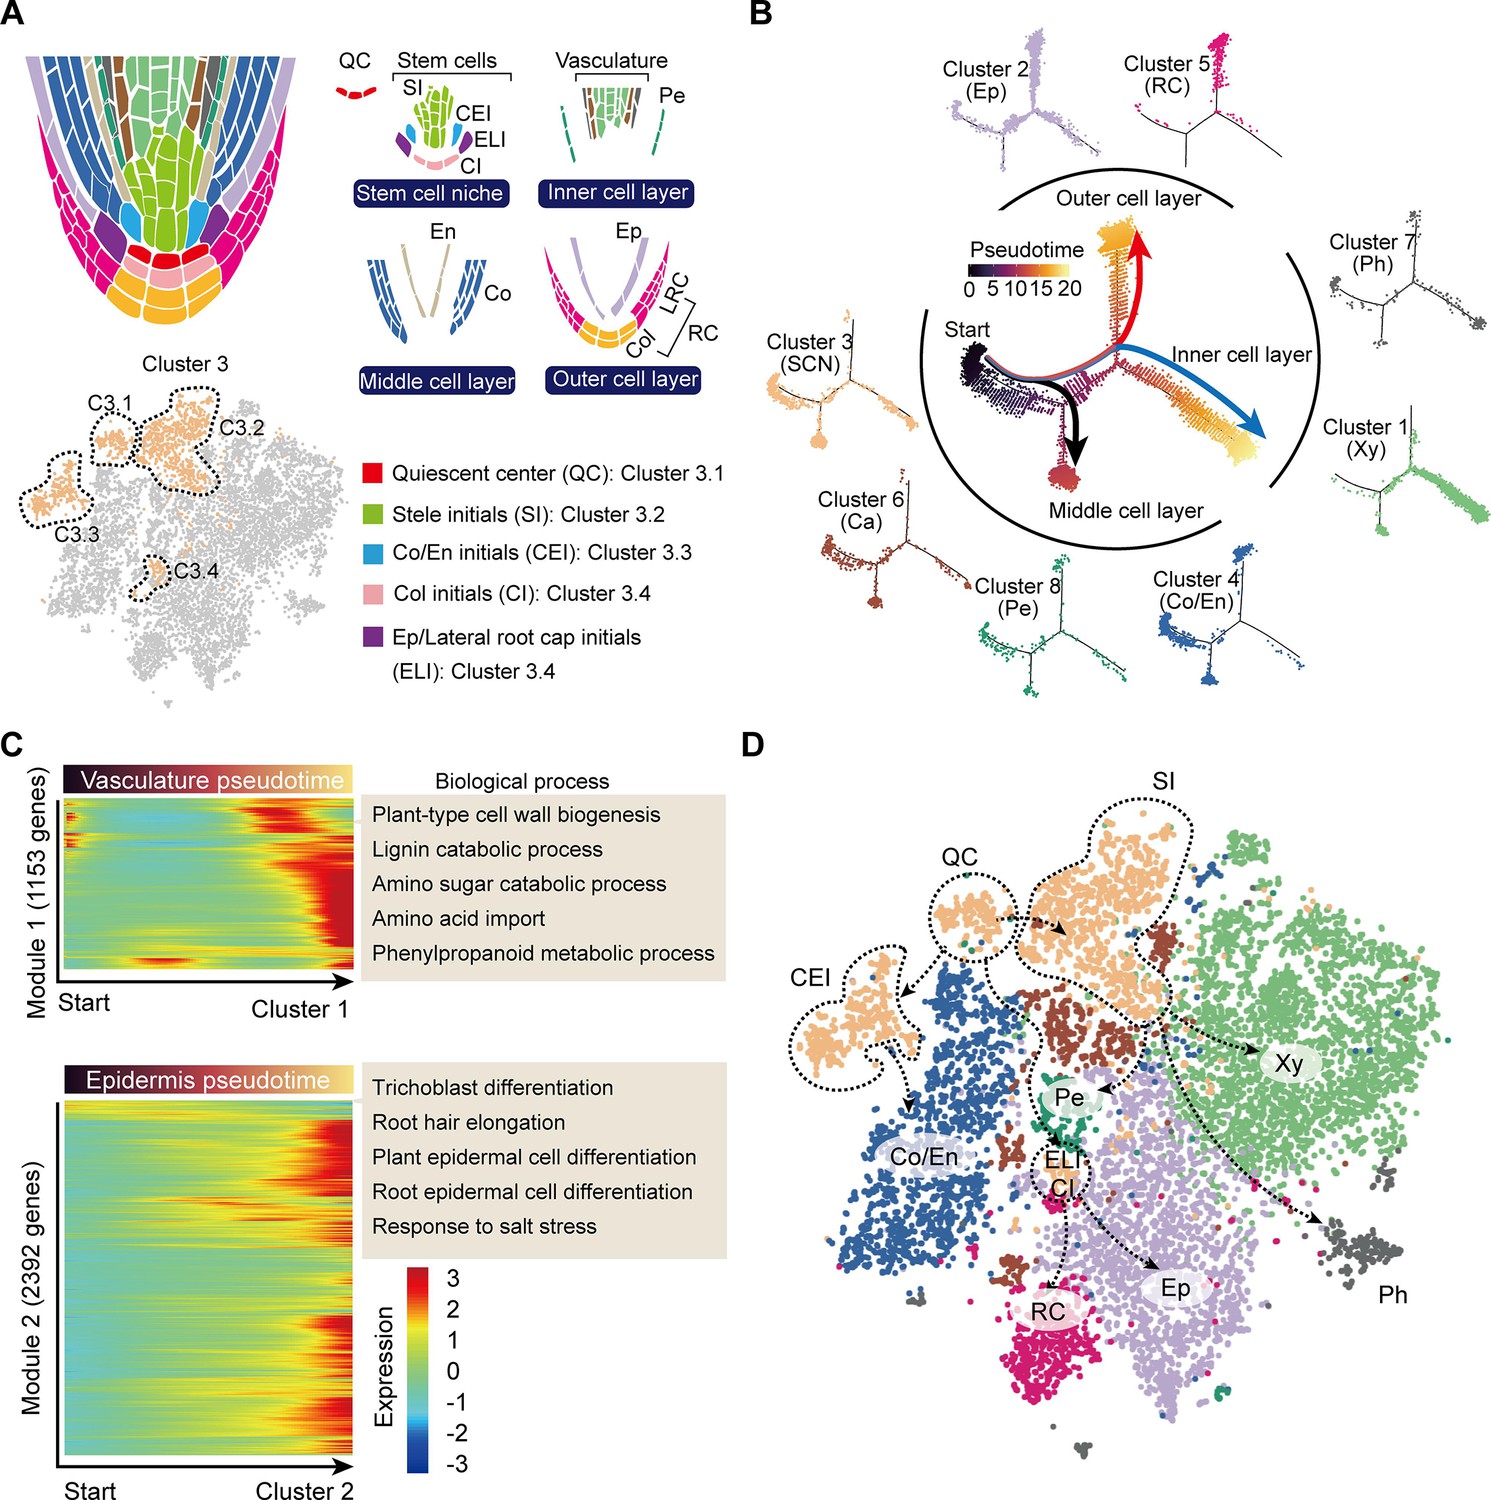
Trajectory of root cell differentiation in the tea plant root.
(A) Schematic representation of root meristem organization (in median longitudinal section). t-Distributed stochastic neighborhood embedding (t-SNE) visualization and cell-type annotation of Cluster 3 (bottom). (B) Simulation of the successive differentiation trajectory of the stem cell niche (SCN) over pseudo-time. Each dot denotes a unique cell. Pseudo-time analysis of all 10,435 tea plant root cells (center), and the detailed distribution of eight cell clusters along pseudo-time trajectory (outer). Colors of the dots represent the pseudo-time score. Red and blue lines mark major differentiation trajectories, black lines mark minor differentiation trajectories. (C) Heatmap illustrating the expression patterns of differential genes, along the pseudo-time trajectory, during cell differentiation of the vasculature and epidermis. Each row represents one gene. Color bars indicate the relative expression levels. Biological processes are given on the right. (D) Proposed tea plant roots cell differentiation trajectories for cell clusters shown on the t-SNE visualization plots. Dotted arrows represent assumed cell differentiation routes.
Figure 3—figure supplement 1
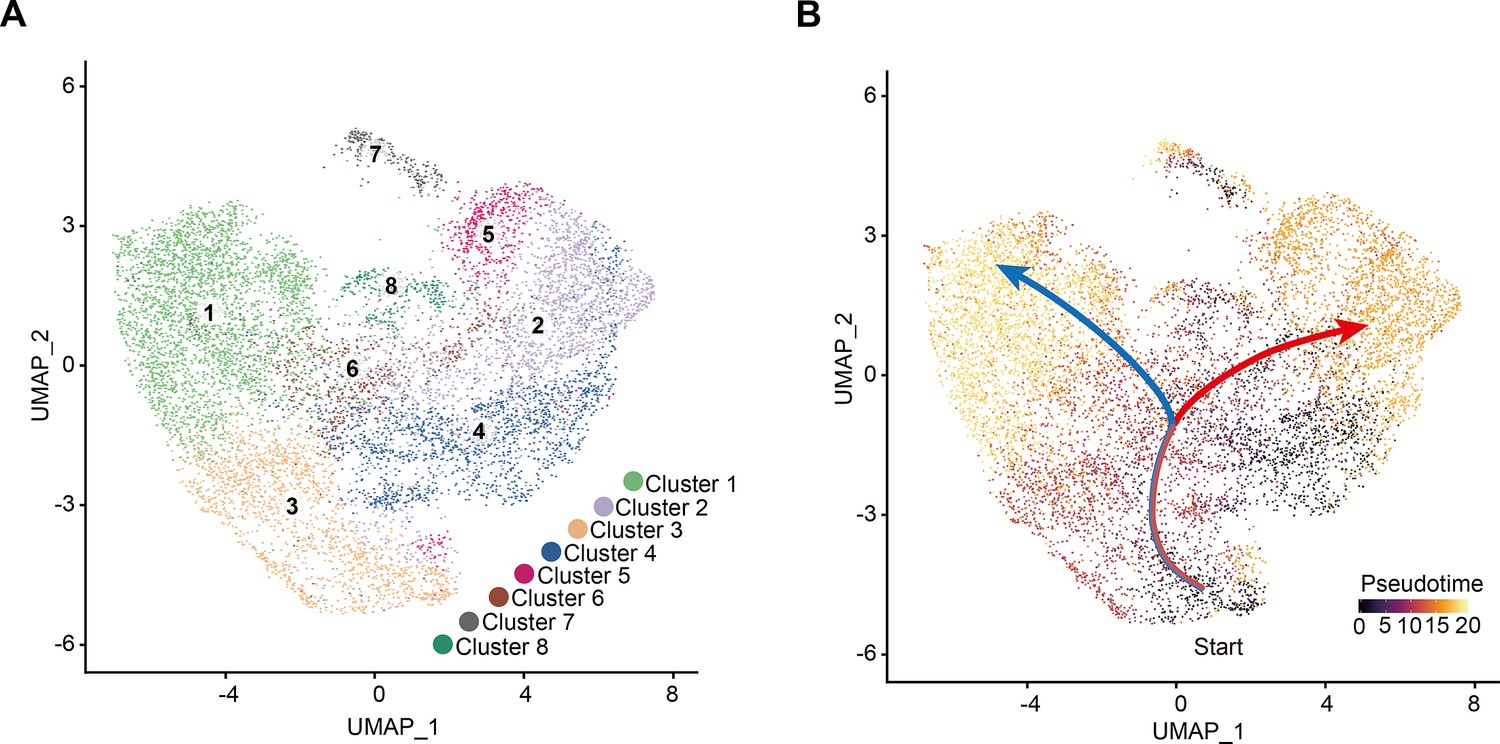
Uniform manifold approximation and projection (UMAP) visualization of eight clusters and differentiation trajectory atop the UMAP.
(A) UMAP visualization plot of 10,435 tea plant root cells. Each dot denoted a single cell. (B) Simulation of the successive differentiation trajectory of tea plant root cells over pseudo-time. Colors of the dots represent the pseudo-time score. Red and blue lines mark major differentiation trajectories.
Figure 4
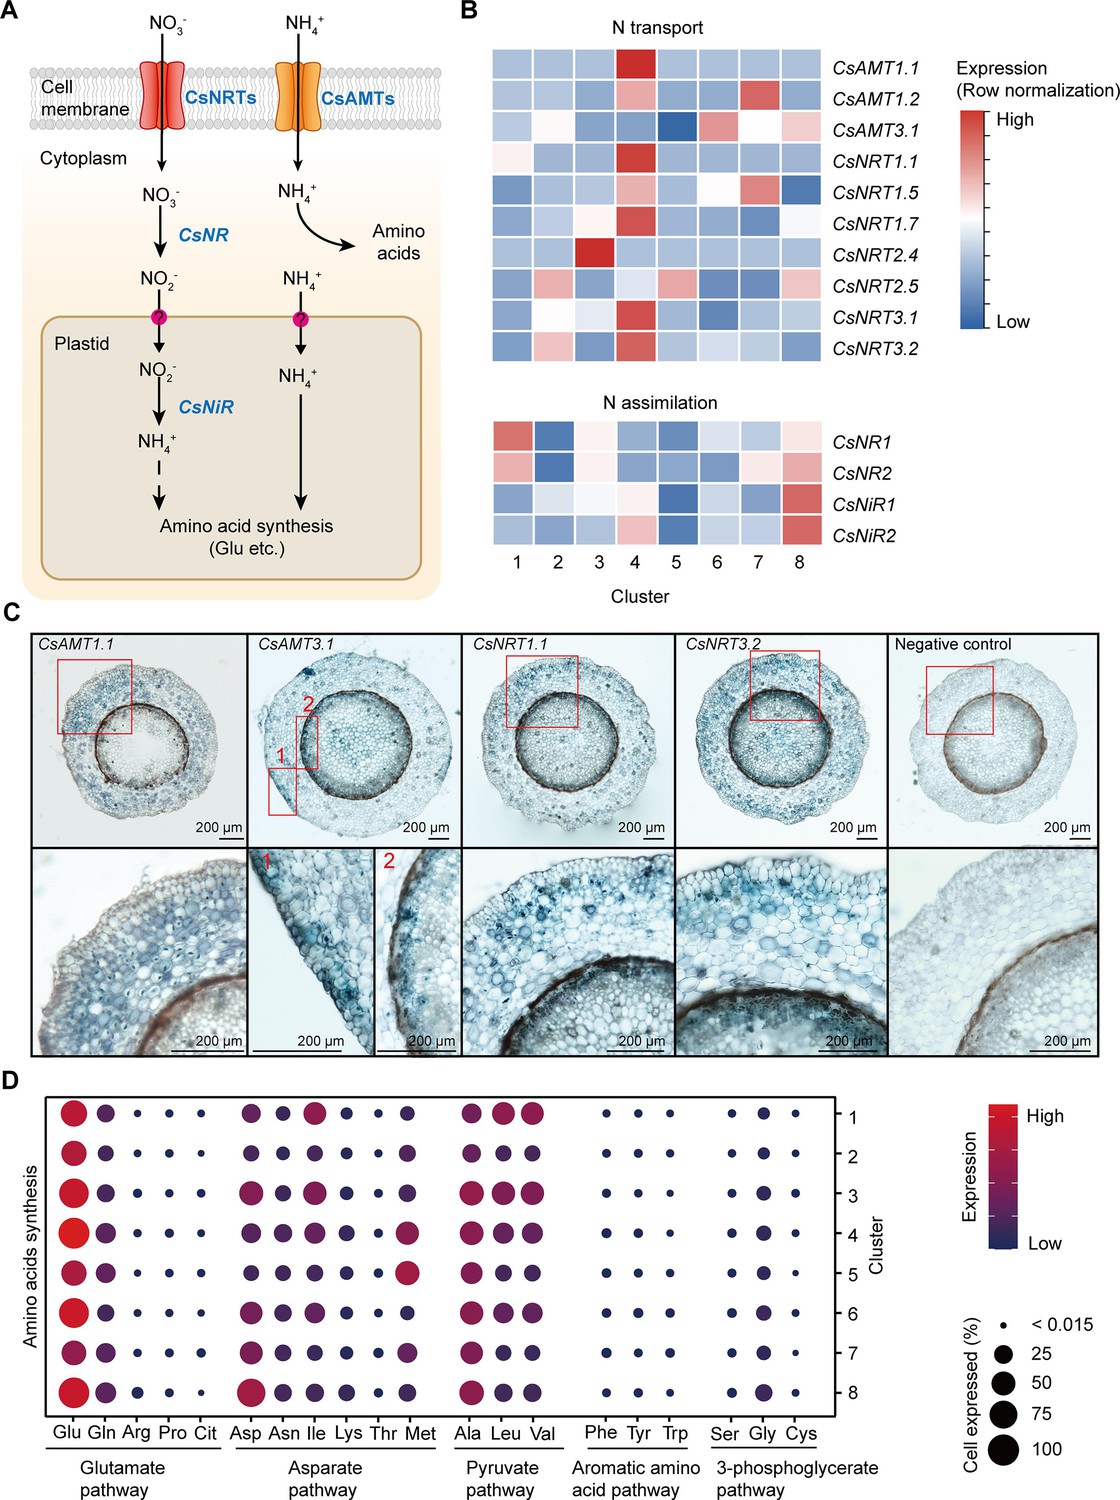
Cell heterogeneity of nitrogen (N) transport and assimilation in tea plant roots.
(A) Schematic of N transport and metabolism pathway in tea plant roots. Membrane-located transporter NRTs and AMTs uptake nitrate and ammonium into root cells, respectively, and subsequently NO3− is assimilated into NH4+ and then metabolized into various amino acids. (B) Heatmap shows cell cluster expression patterns of N transport and assimilation genes in tea plant roots. Row normalization for gene expression according to ‘normalized’ mode. (C) In situ RT-PCR of CsAMT1.1, CsAMT3.1, CsNRT1.1, and CsNRT3.2. The blue areas of sectioned tissues represent regions where genes are expressed. The red boxes represent the magnified areas of root sections shown on the right. Scale bar = 200 μm. (D) Expression of amino acid synthesis pathway genes in different cell clusters. Color bars indicate the expression levels of amino acid synthesis pathway genes. Dot size indicates the percentage of amino acid synthesis genes expressed in a cell cluster.
Figure 5 with 1 supplement
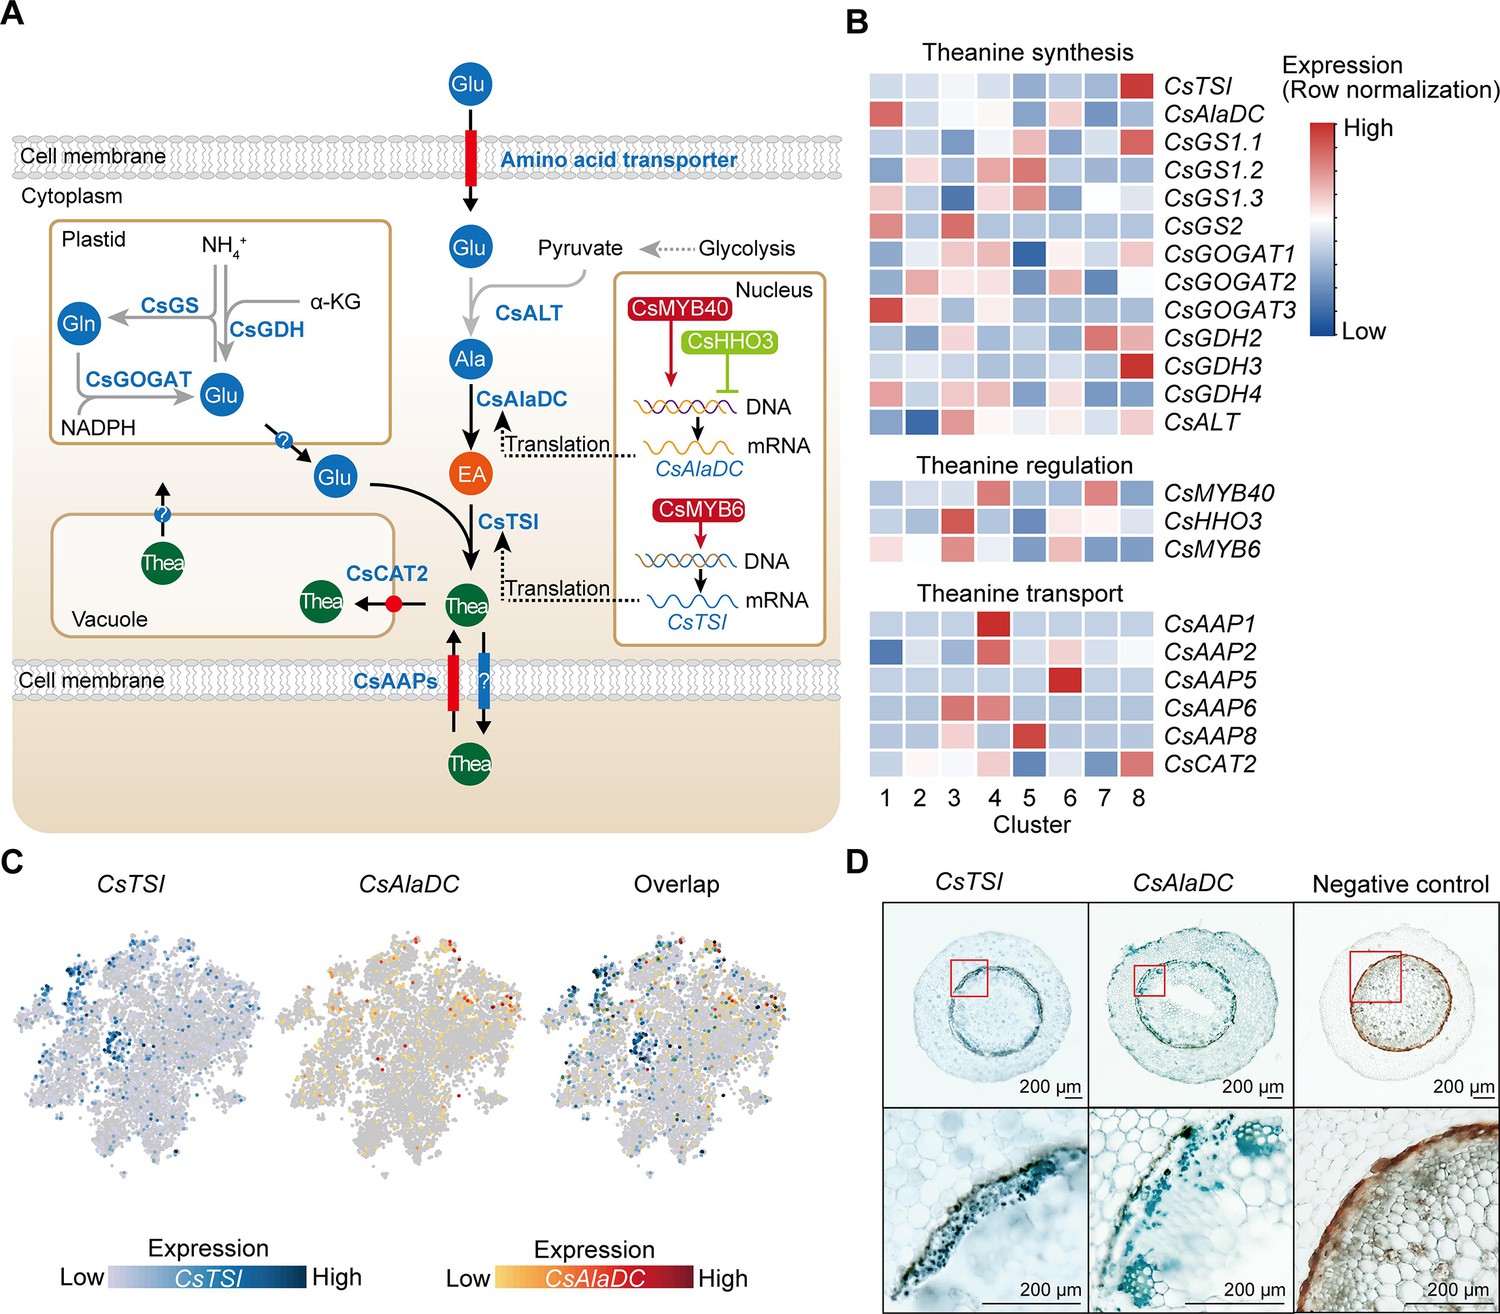
Cell heterogeneity of theanine synthesis, transport, and regulation in tea plant roots.
(A) Model of the putative theanine synthesis, transport, and regulation in tea plant root cells. Black full lines represent unique metabolic processes in tea plants; gray full lines represent common metabolic pathways in plants; dotted lines indicate the multi-step process. (B) Heatmap for cell cluster expression patterns of genes encoding theanine transporters CsAAPs, key enzymes, and transcription factors in the theanine metabolic pathway. Gene expression is presented in ‘normalized’ mode. (C) t-Distributed stochastic neighborhood embedding (t-SNE) visualization of CsTSI, CsAlaDC, and their overlap map. Blue color bar indicates CsTSI expression level, red color bar indicates CsAlaDC expression level in single-cell RNA sequencing (scRNA-seq). (D) Tissue localization of CsTSI and CsAlaDC using in situ RT-PCR. Blue signal indicates gene expression in cells. The red boxes represent magnified areas of root sections shown below. Scale bar = 200 μm.
Figure 5—figure supplement 1
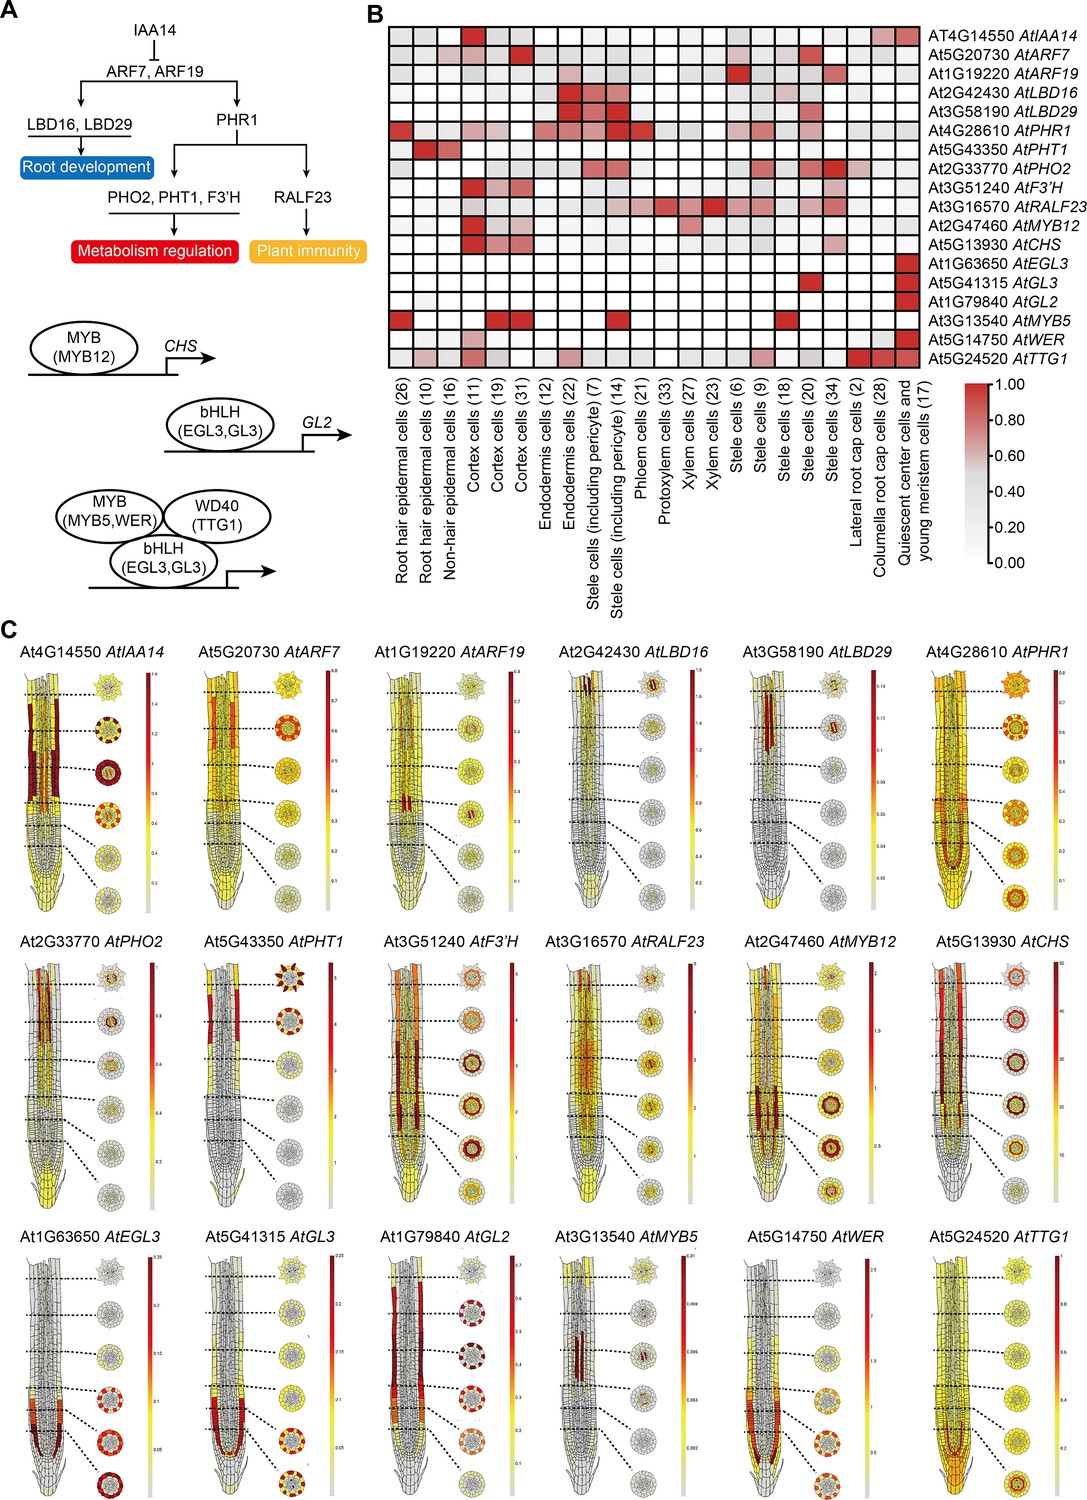
Cell cluster assay of regulators and target genes based on published Arabidopsis thaliana data.
(A) Schematic diagram of reported gene regulatory relationships. A hierarchical regulatory network with IAA14 as the upstream regulator (top). MYB–bHLH–WD40 (MBW) complex regulates downstream gene (bottom). Heatmap (B) and tissue-located heatmap (C) for cell cluster expression patterns of genes which were showed in schematic diagram of (A). The single-cell RNA sequencing (scRNA-seq) data of Arabidopsis thaliana root were obtained from publicly available data (Ryu et al., 2019; Wendrich et al., 2020; Zhang et al., 2019; Denyer et al., 2019; Jean-Baptiste et al., 2019; Shulse et al., 2019; Shahan et al., 2022) and database (Root Cell Atlas, https://rootcellatlas.org/; BAR, https://bar.utoronto.ca/#GeneExpressionAndProteinTools). The pictures of (C) were generated from Root Cell Atlas web with slight modification.
Figure 6
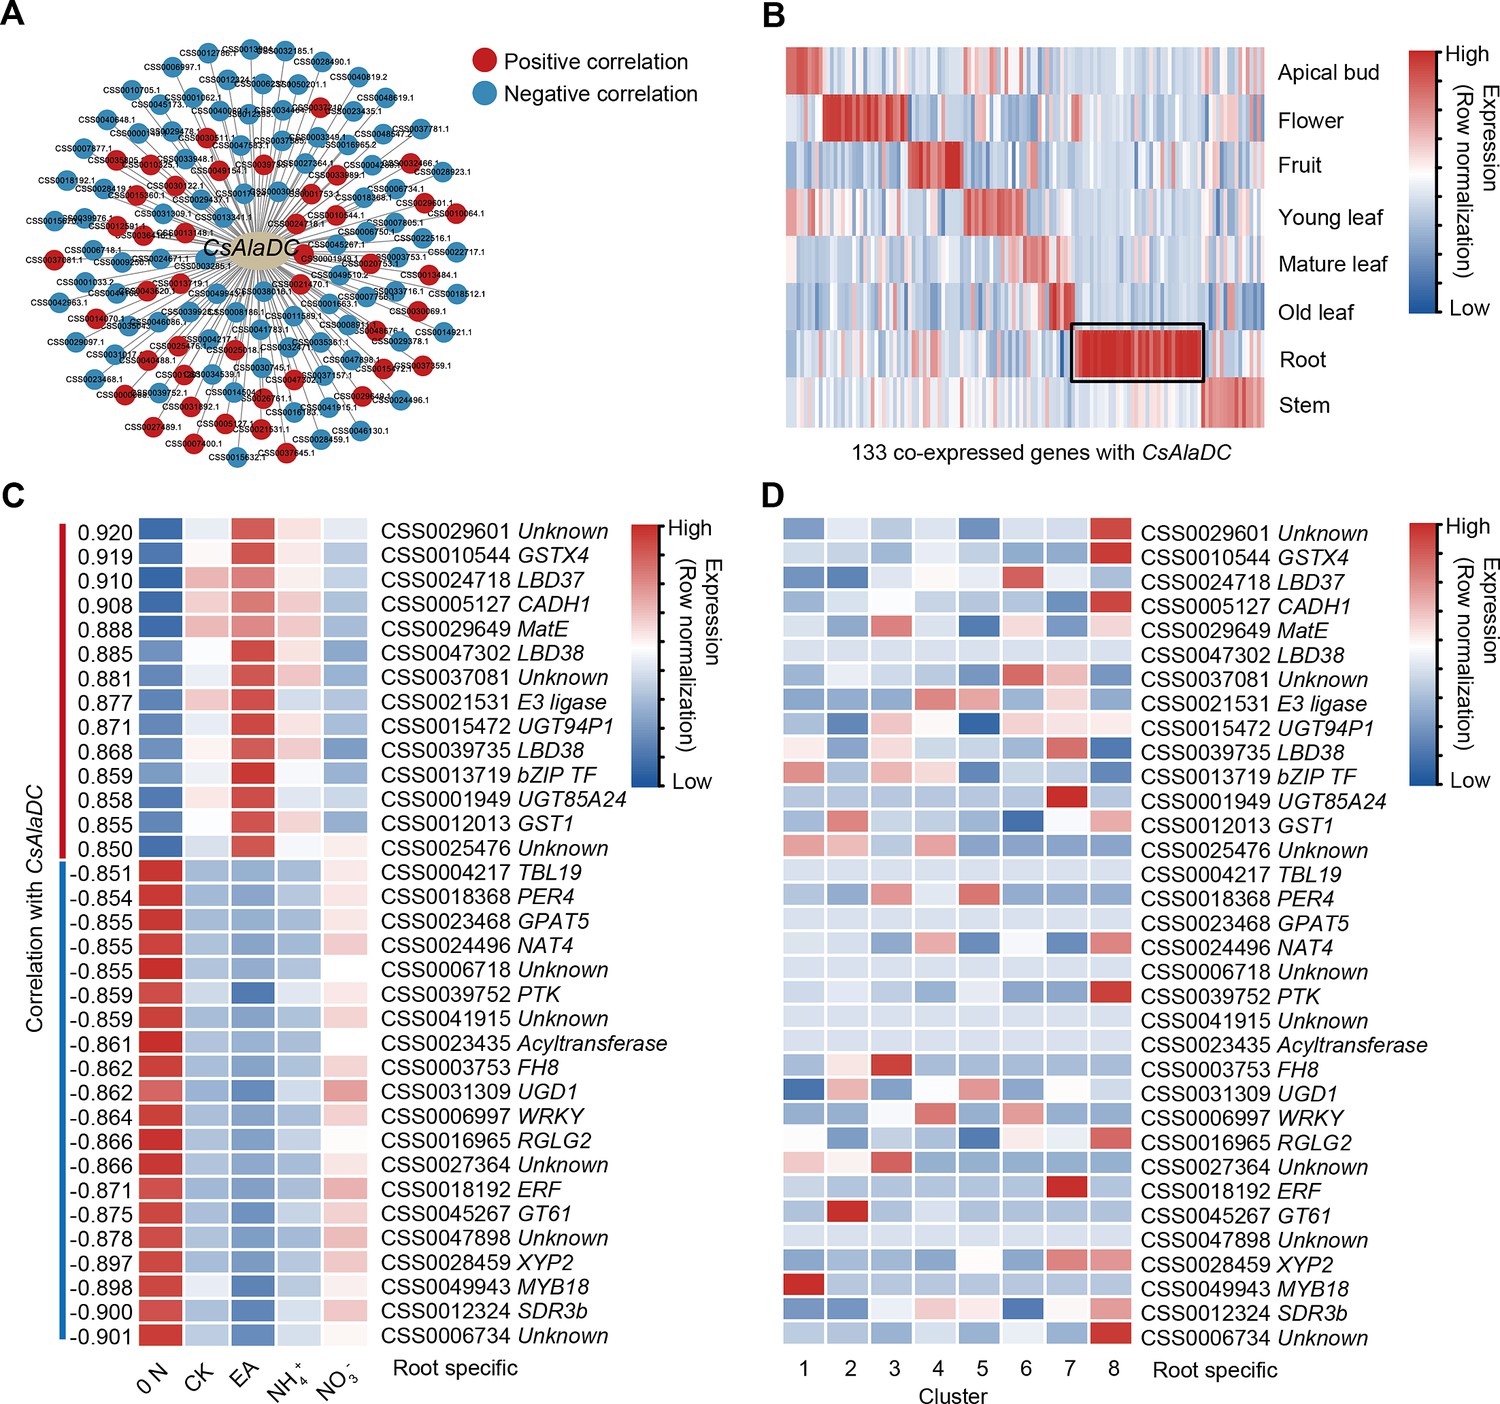
A gene co-expression network predicted key regulators of CsAlaDC.
(A) Using bulk RNA-seq data, a gene co-expression network was generated for CsAlaDC (|correlation coefficient| ≥ 0.85 and p-value ≤0.05). Red and blue dots represent differential genes positively and negatively correlated with CsAlaDC, respectively. Bulk RNA-seq data are from different types of N treatment of tea plant roots (Yang et al., 2020). (B) Heatmap showing expression of co-expressed genes with CsAlaDC in eight tea plant tissues. The black arrows denote root-specific co-expressed (RSCE) genes. (C) Heatmap showing the expression pattern for RSCE genes under different types of N treatment (0 N, CK, EA, NH4+ and NO3−). Correlation between RSCE genes and CsAlaDC is shown on the heatmap at left. (D) Heatmap showing the expression level of RSCE genes in each cell cluster. (B–D) Row normalization of gene expression is according to the ‘normalized’ mode.
Figure 7 with 2 supplements
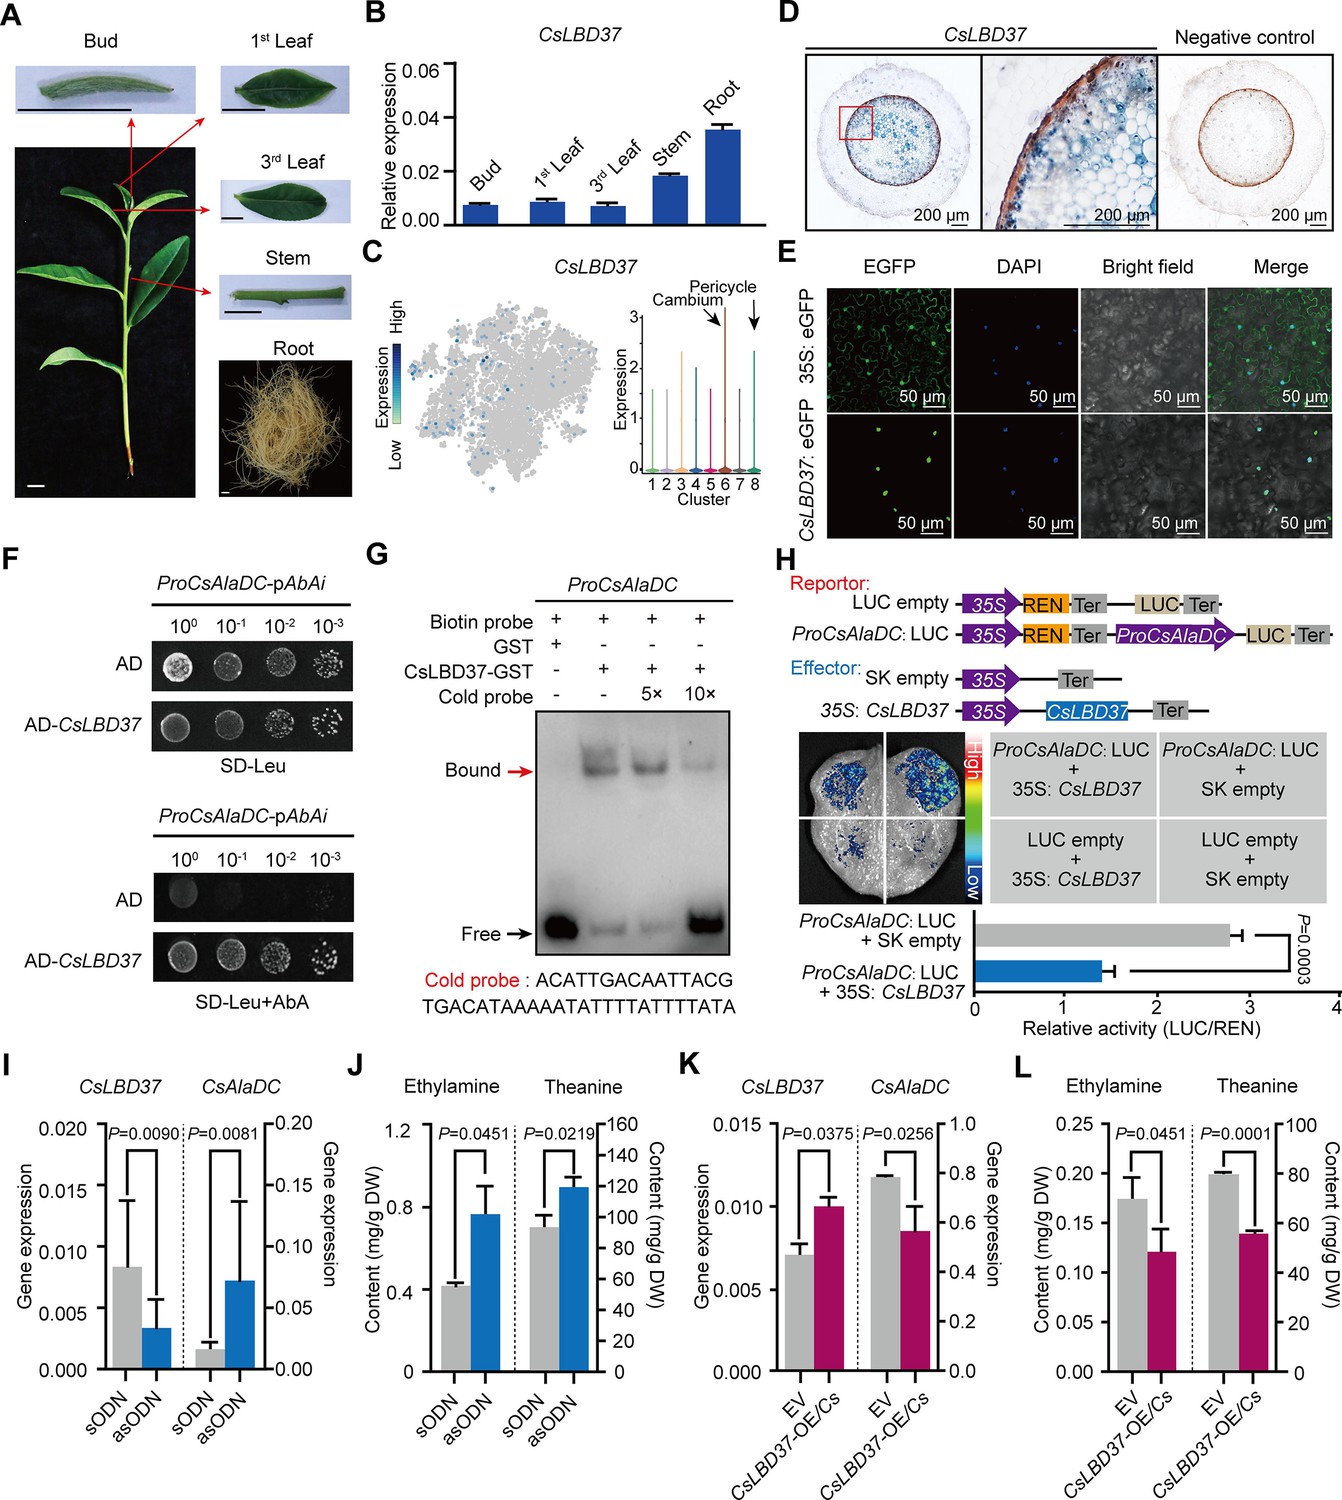
Theanine synthesis regulated by the transcription factor CsLBD37.
(A) Schematic representation of the tea plant tissues used for gene detection. (B) Relative expression of CsLBD37 in different tea plants tissues. (C) The t-distributed stochastic neighborhood embedding (t-SNE) visualization graph shows expression levels of CsLBD37 in various cell clusters. (D) Cell specificity of CsLBD37 expression in tea plant roots; blue signal represents location of gene expression. Scale bar = 200 μm. (E) Subcellular localization of CsLBD37; green fluorescence signal represents protein localization. Scale bar=50 μm. (F) The binding of CsLBD37 to the CsAlaDC promoter, tested by yeast one-hybrid (Y1H) assay. (G) Electrophoretic mobility shift assay (EMSA) showing the association of CsLBD37 with the CsAlaDC promoter. The red arrow points to the binding position. (H) A schematic of the effector and reportor constructs for transcriptional activity of the CsAlaDC promoter (top). LCI assays in tobacco leaves show that the CsAlaDC promoter can interact with CsLBD37. The color bar indicates the range of luminescence intensity (mid). The LUC/REN values represent relative activity of CsLBD37 on CsAlaDC expression. Data represent the means ± SD of three biological replicates (n=3). Significant difference was evaluated by two-tailed Student’s t-test analysis (bottom). (I–L) CsLBD37 gene silencing and overexpression in tea plant roots. Data represent the means ± SD of three biological replicates (n=3). Significant difference was determined by Welch’s t-test. The expression level of CsLBD37 and CsAlaDC in gene silenced (I) and overexpression plants (K). Ethylamine and theanine contents in gene silenced (J) and overexpression plants (L). sODN, sense oligo nucleotides; asODN, antisense oligonucleotides, silenced CsLBD37 in tea plant root by asODN methods; EV, empty vector; CsLBD37-OE/Cs, CsLBD37 overexpression in transgenic hairy root system.
-
Figure 7—source data 1
PDF file containing original images of gels for Figure 7G, indicating the relevant bands and treatments.
- https://cdn.elifesciences.org/articles/95891/elife-95891-fig7-data1-v2.pdf
-
Figure 7—source data 2
Original files for images of gels displayed in Figure 7G.
- https://cdn.elifesciences.org/articles/95891/elife-95891-fig7-data2-v2.tif
Figure 7—figure supplement 1
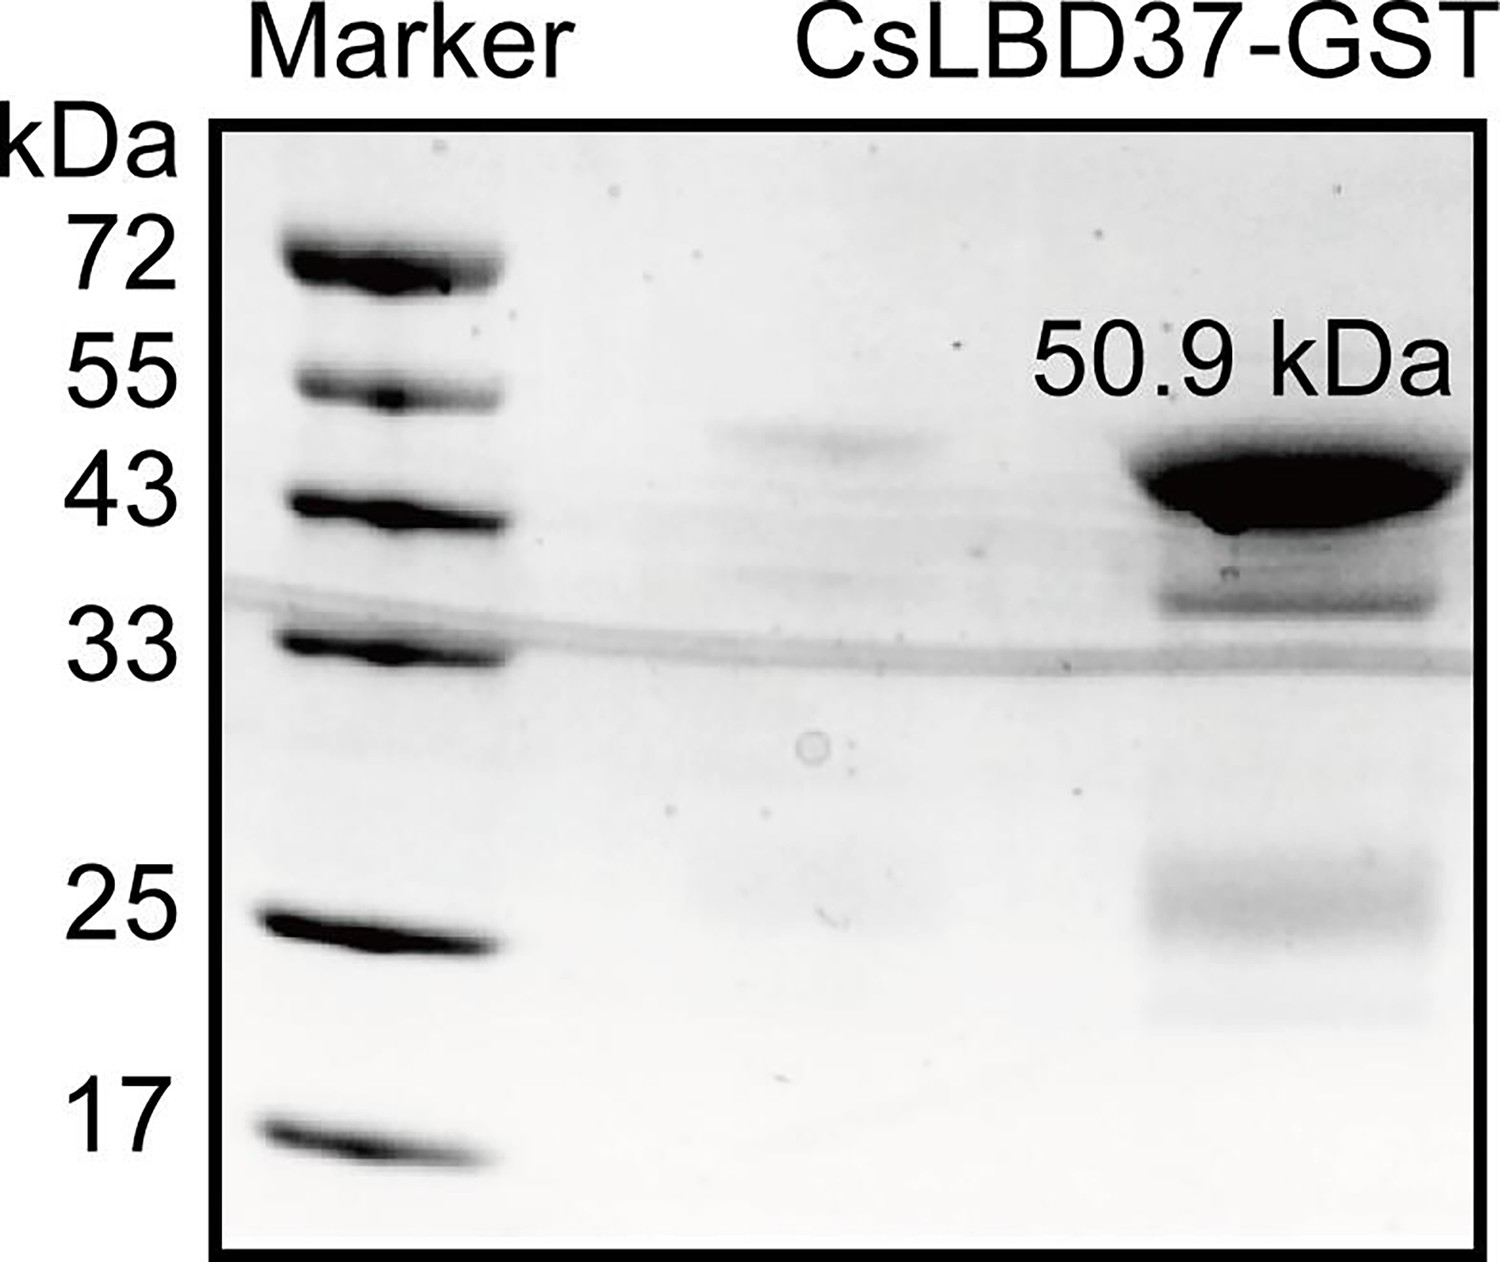
Protein purification of CsLBD37.
Protein purification of CsLBD37. The CsLBD37-GST fusion protein has a molecular weight of 50.9 kDa (i.e., 24.9 + 26 kDa).
-
Figure 7—figure supplement 1—source data 1
PDF file containing original images of gels for Figure 7—figure supplement 1, indicating the relevant bands and treatments.
- https://cdn.elifesciences.org/articles/95891/elife-95891-fig7-figsupp1-data1-v2.pdf
-
Figure 7—figure supplement 1—source data 2
Original files for images of gels displayed in Figure 7—figure supplement 1.
- https://cdn.elifesciences.org/articles/95891/elife-95891-fig7-figsupp1-data2-v2.tif
Figure 7—figure supplement 2
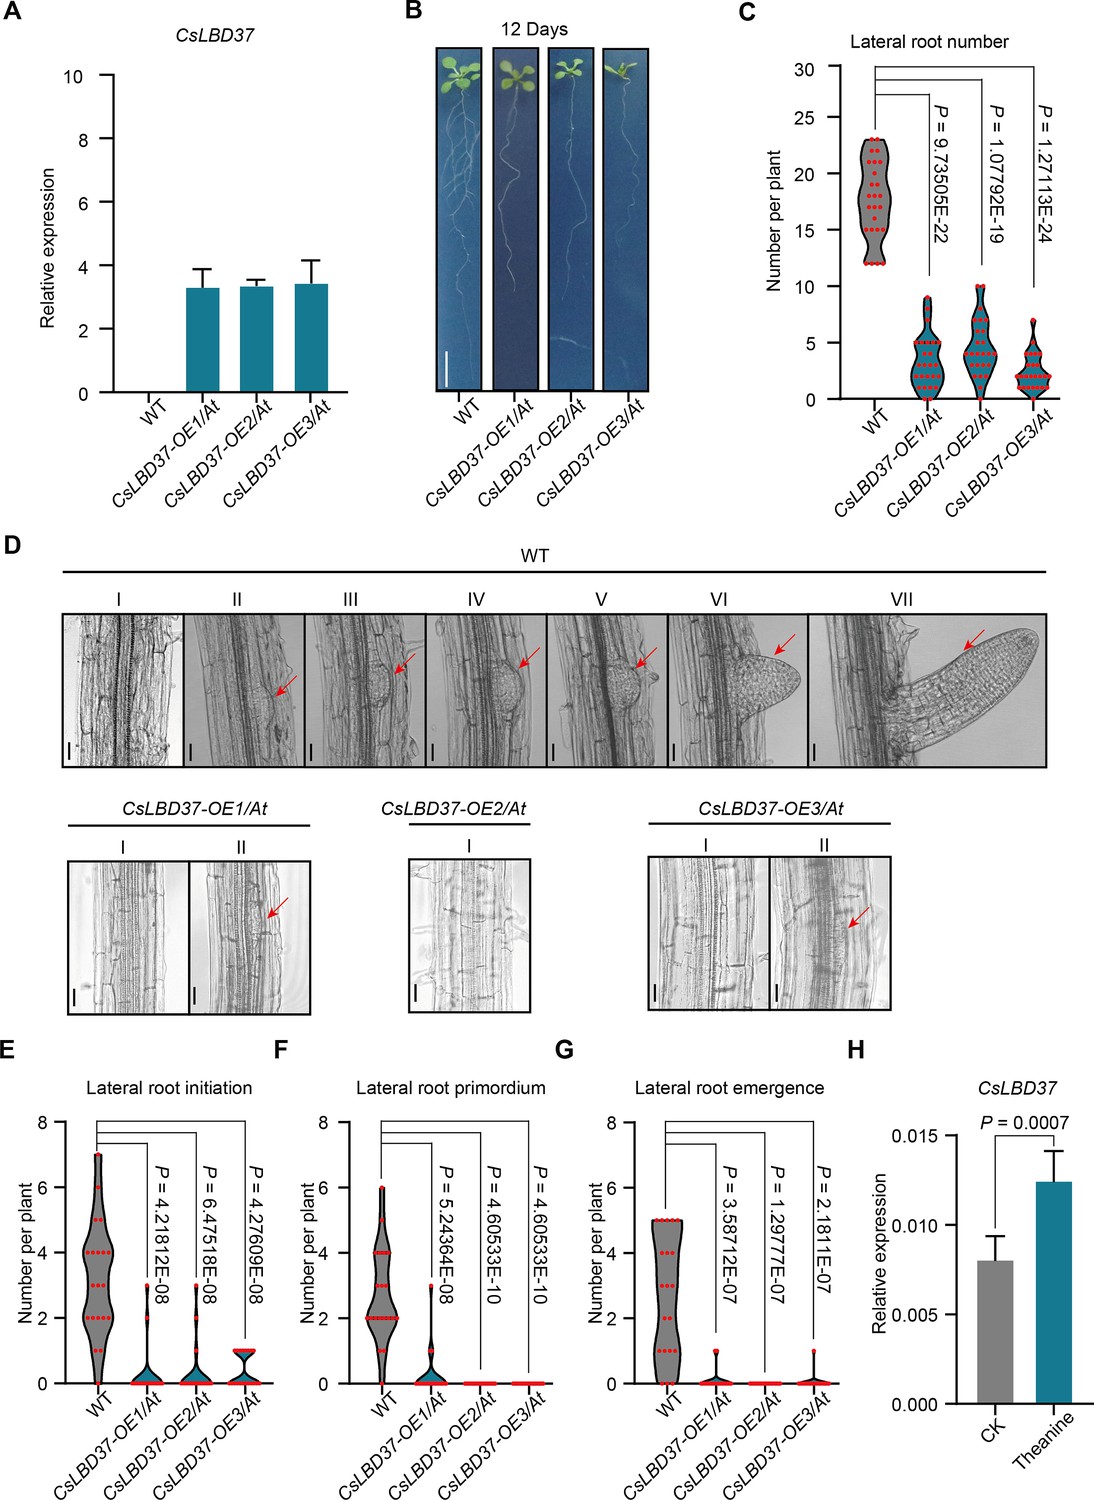
Overexpression of CsLBD37 in Arabidopsis inhibited lateral root development.
(A) Quantitative RT-PCR (qRT-PCR) assay for CsLBD37 transcriptional level in three transgenic Arabidopsis lines (CsLBD37-OE1/At, CsLBD37-OE2/At, and CsLBD37-OE3/At) and wild-type Arabidopsis (WT) plants. (B, C) The plant phenotypes of CsLBD37 transgenic Arabidopsis lines and WT grown in MS medium for 12 days. Scale bar = 1 cm. (C) Lateral root number, each line contained 25 independent biological replicates. (D–G) Microscopy-based lateral root developmental phenotypes of CsLBD37 transgenic Arabidopsis lines and WT, 5 days post germination. Scale bar = 25 μm in (D). Lateral root initiation number (E); lateral root primordium number (F), and lateral root emergence number (G), each line contained 20 independent biological replicates. (H) qRT-PCR assay for CsLBD37 expression level in tea seedlings grown under control (CK) or 1 mM theanine treatment (Theanine). Data represent the means ± SD of six biological replicates (n = 6). (C, E–H) Significant differences were determined by two-sided Student’s t-test.
Figure 8
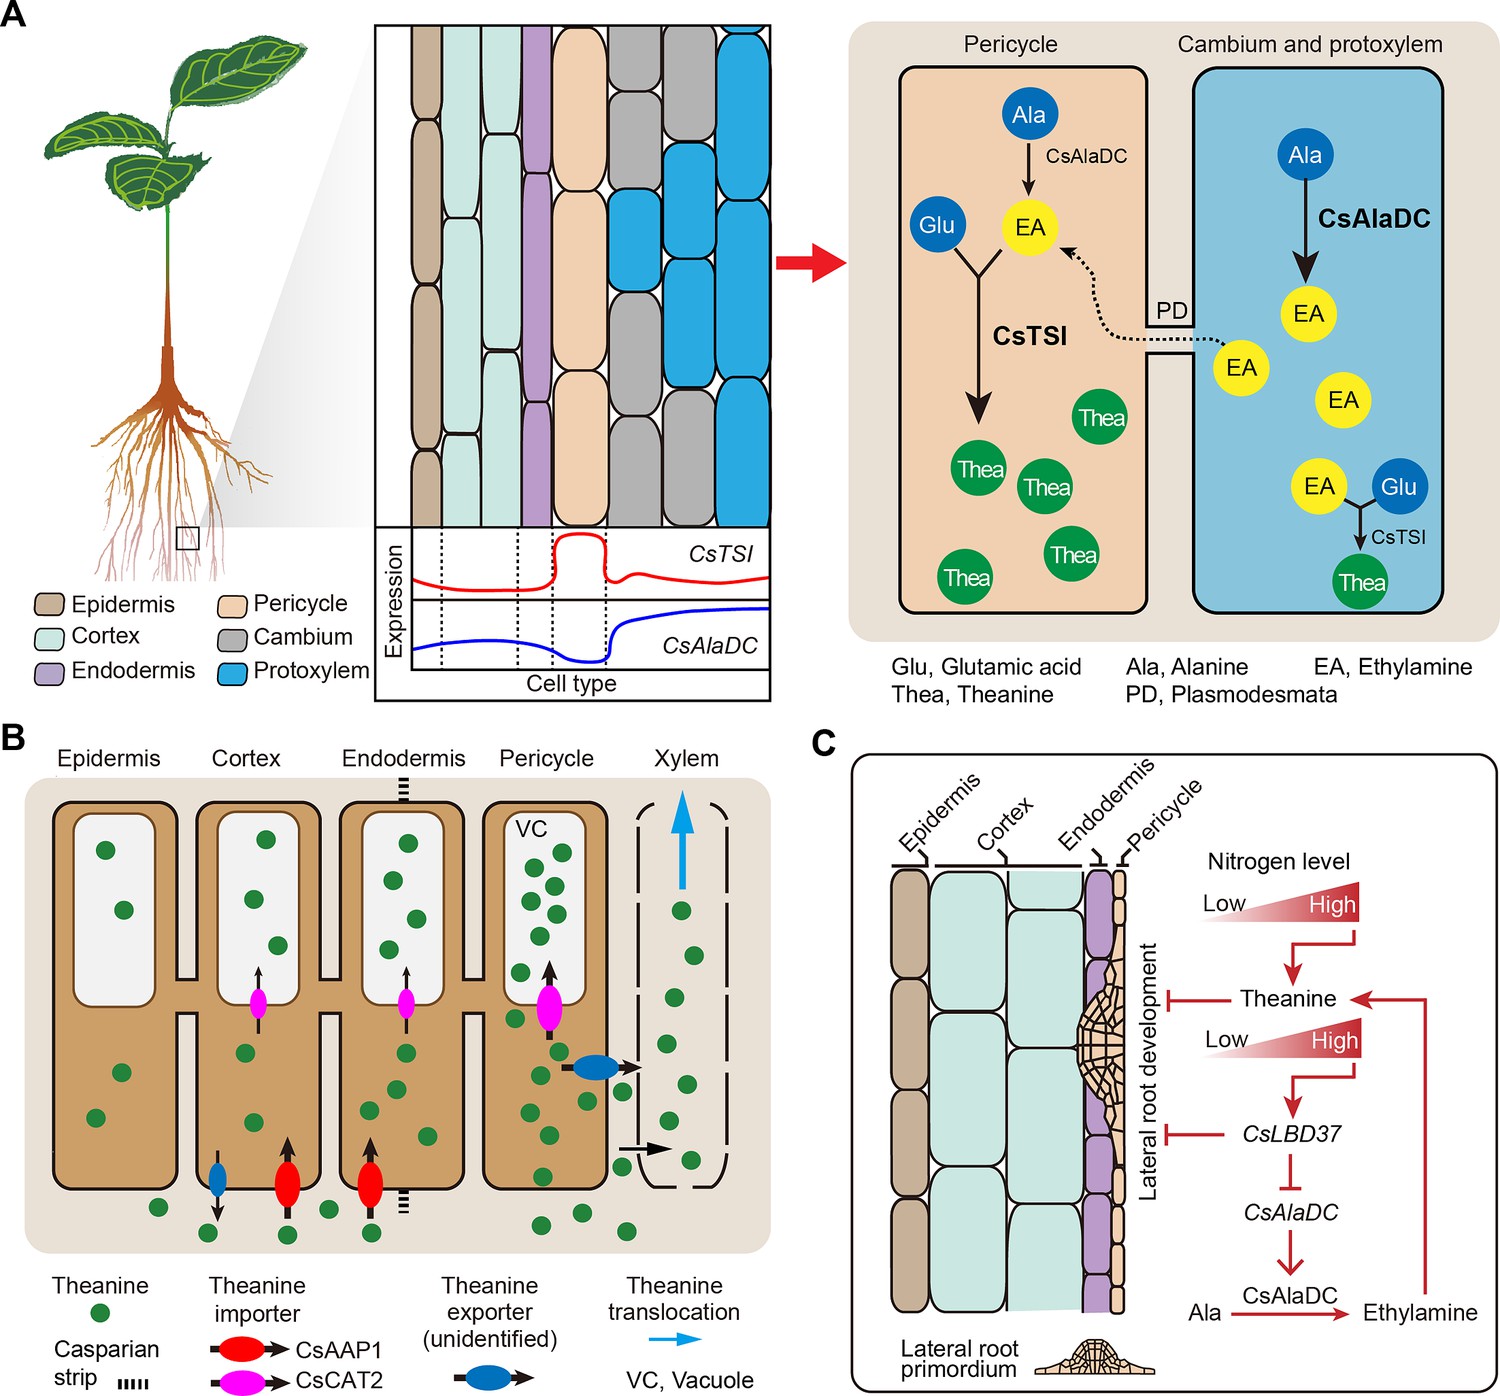
Proposed model for theanine biosynthesis, transport, and regulation at single-cell resolution.
(A) Multicellular compartmentation of theanine biosynthesis. The high expression of CsTSI in pericycle cells suggests theanine is mainly synthesized in pericycle cells. CsAlaDC is highly expressed in cambium and protoxylem cells, suggesting that ethylamine (EA) is mainly synthesized in these cells. Thus, EA may move from cambium and protoxylem cells into pericycle cells, where it is a substrate for theanine biosynthesis. (B) In tea plant roots, CsAAP1 likely mediates in theanine retrieval from apoplast for its transport into cortical/endodermal cells. CsCAT2 imports theanine into vacuoles, especially in pericycle cells, which are the main cells for theanine biosynthesis. Theanine is exported, by an unidentified theanine exporter, from pericycle cells into the apoplastic pathway for entry into the xylem. (C) CsLBD37 co-regulates theanine biosynthesis and lateral root development. Increasing levels of nitrogen (N) promote theanine biosynthesis and accumulation. High accumulation of theanine and N induces CsLBD37 expression. CsLBD37 inhibits CsAlaDC expression to reduce ethylamine synthesis, which finetunes theanine biosynthesis in feedback loop. Besides, CsLBD37 is expressed in pericycle cells and also inhibits lateral root development. It is reported that apoplastic theanine can negatively regulate lateral root development, under high nitrogen levels (Chen et al., 2023). Therefore, CsLBD37 may also be involved in theanine-regulated lateral root development.
Additional files
-
MDAR checklist
- https://cdn.elifesciences.org/articles/95891/elife-95891-mdarchecklist1-v2.docx
-
Supplementary file 1
QC of scRNA-seq.
- https://cdn.elifesciences.org/articles/95891/elife-95891-supp1-v2.xlsx
-
Supplementary file 2
Gene expression of scRNA-seq.
- https://cdn.elifesciences.org/articles/95891/elife-95891-supp2-v2.xlsx
-
Supplementary file 3
Top 10 marker gene of cell cluster.
- https://cdn.elifesciences.org/articles/95891/elife-95891-supp3-v2.xlsx
-
Supplementary file 4
Pseudotime heatmap gene module.
- https://cdn.elifesciences.org/articles/95891/elife-95891-supp4-v2.xlsx
-
Supplementary file 5
Nitrogen assimilation and amino acid synthesis.
- https://cdn.elifesciences.org/articles/95891/elife-95891-supp5-v2.xlsx
-
Supplementary file 6
Theanine synthesis and transport.
- https://cdn.elifesciences.org/articles/95891/elife-95891-supp6-v2.xlsx
-
Supplementary file 7
Gene expression of five nitrogen forms treatment.
- https://cdn.elifesciences.org/articles/95891/elife-95891-supp7-v2.xlsx
-
Supplementary file 8
Co-expression analysis of CsAlaDC and other genes.
- https://cdn.elifesciences.org/articles/95891/elife-95891-supp8-v2.xlsx
-
Supplementary file 9
Primer list of this study.
- https://cdn.elifesciences.org/articles/95891/elife-95891-supp9-v2.xlsx
Download links
A two-part list of links to download the article, or parts of the article, in various formats.
Downloads (link to download the article as PDF)
Open citations (links to open the citations from this article in various online reference manager services)
Cite this article (links to download the citations from this article in formats compatible with various reference manager tools)
Root-specific theanine metabolism and regulation at the single-cell level in tea plants (Camellia sinensis)
eLife 13:RP95891.
https://doi.org/10.7554/eLife.95891.3


