ASAR lncRNAs control DNA replication timing through interactions with multiple hnRNP/RNA binding proteins
- Department of Chemical Physiology and Biochemistry,Oregon Health & Science University, United States
- Department of Molecular and Medical Genetics, Oregon Health & Science University, United States
- Stanford Cancer Institute, United States
- Cancer Early Detection Advanced Research Center, Knight Cancer Institute, Oregon Health & Science University, United States
Figures
Figure 1 with 1 supplement
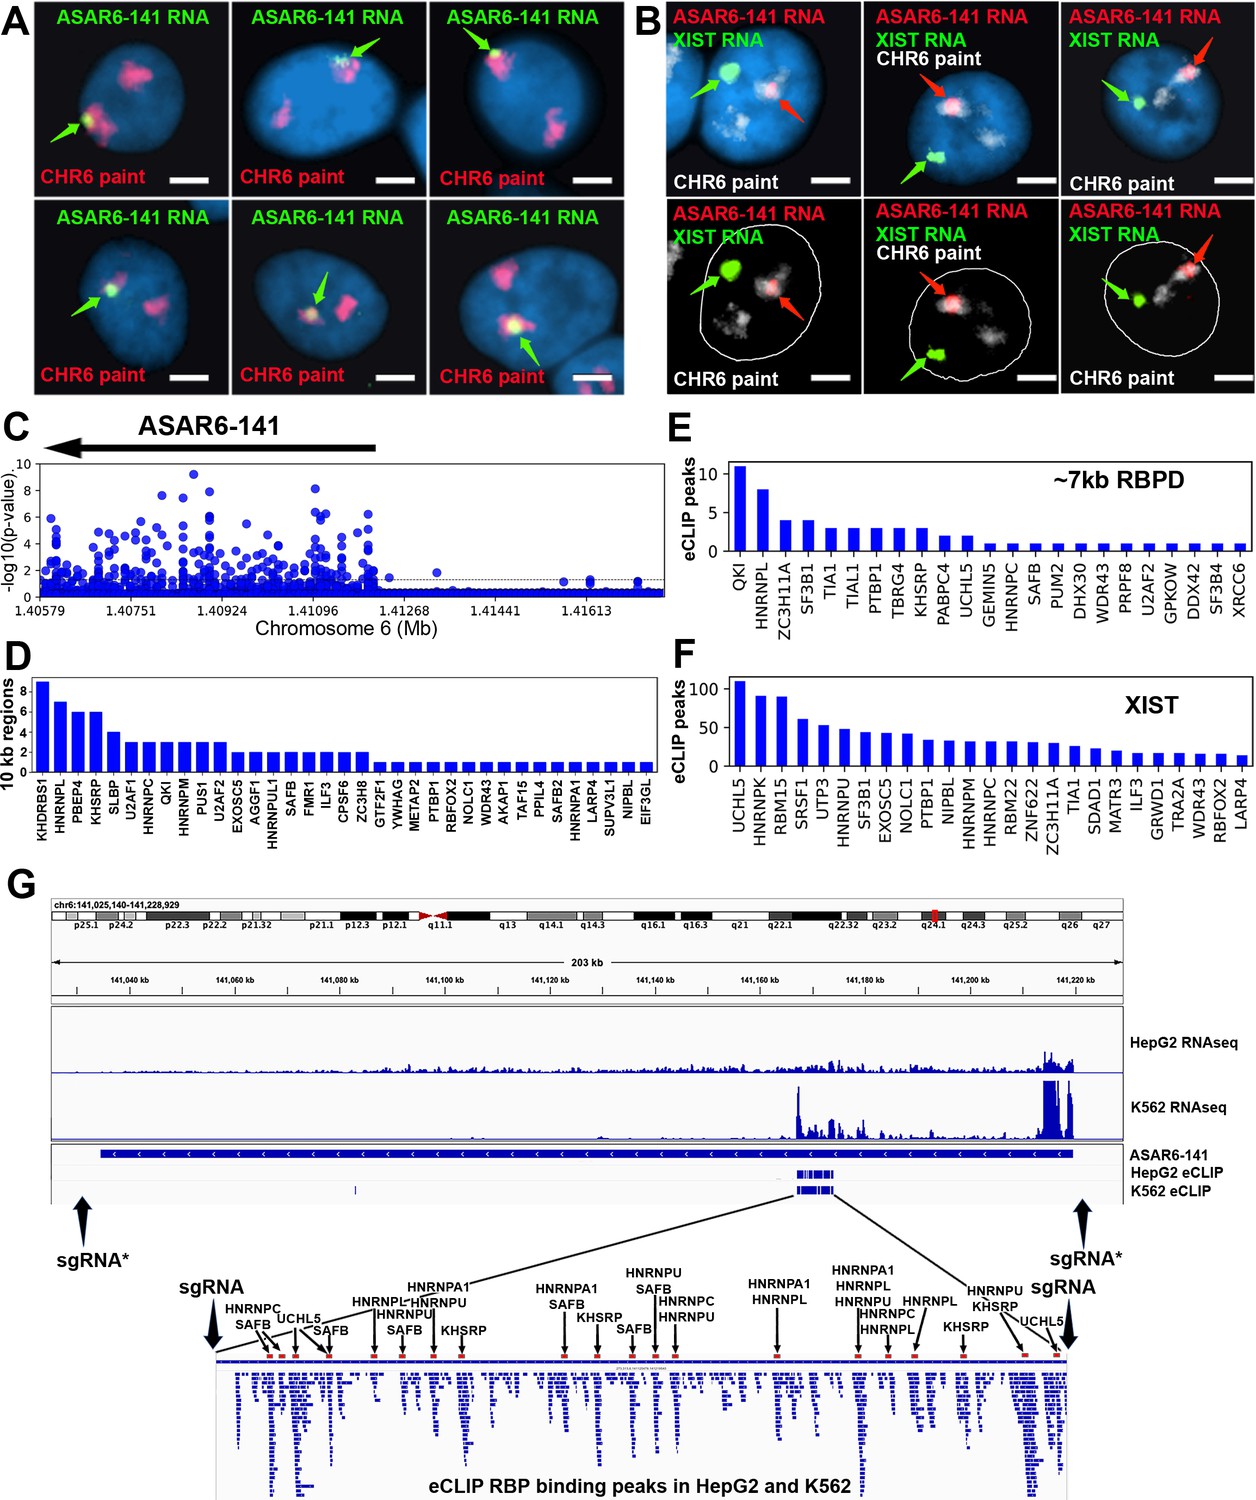
RNA binding proteins interact with an ~7 kb domain within ASAR6-141 RNA.
(A) RNA-DNA FISH images of ASAR6-141 expression in six individual HTD114 cells. ASAR6-141 RNA (green; green arrows) and chromosome 6 DNA (chromosome paint, red), and DNA was stained with DAPI. (B) RNA-DNA FISH of ASAR6-141 RNA (red, red arrows), CHR6 DNA (chromosome paint, white), and XIST RNA (green, green arrows) visualized within individual GM12878 cells, top and bottom panels represent the same three cells with the nuclear outline drawn in white. (C) RNA-protein interaction data (eCLIP from ENCODE) for 120 RBPs expressed in K562 cells for the genomic region that contains ASAR6-141, and ~200 kb of upstream non-transcribed DNA (chromosome 6 140.8 mb-141.6 mb). Each point represents the FDR-corrected p-value of the z-score of log2-ratio between eCLiP vs control for each RBP within a 10 kb sliding window. (D) Number of 10 kb regions with significant enrichments of eCLiP reads vs control within ASAR6-141. (E) Histogram of eCLiP peaks count per RBP within ASAR6-141 7 kb RBPD. (F) Histogram of eCLiP peaks count per RBP within lncRNA XIST. (G) Genome browser view of ASAR6-141 with RNA-seq expression and eCLiP peaks shown in K562 and HepG2. The zoomed in view shows the ~7 kb RBPD with the location of the peaks of eCLIP reads that map within the region (see Figure 1—source data 1). The eCLIP peaks for the RBPs used in the shRNA knockdown experiments are indicated and highlighted with arrows and red bars. The location of sgRNAs are shown with arrows (see Figure 1—source data 3), and the asterisks mark the sgRNAs from Heskett et al., 2020.
-
Figure 1—source data 1
The location of significant peaks of eCLIP reads that map within ASAR and XIST genes.
- https://cdn.elifesciences.org/articles/95898/elife-95898-fig1-data1-v1.xlsx
-
Figure 1—source data 2
eCLIP reads for 120 RBPs in 10 kb windows within ASARs.
- https://cdn.elifesciences.org/articles/95898/elife-95898-fig1-data2-v1.xlsx
-
Figure 1—source data 3
Fosmids, BACs, and primers.
- https://cdn.elifesciences.org/articles/95898/elife-95898-fig1-data3-v1.xlsx
Figure 1—figure supplement 1
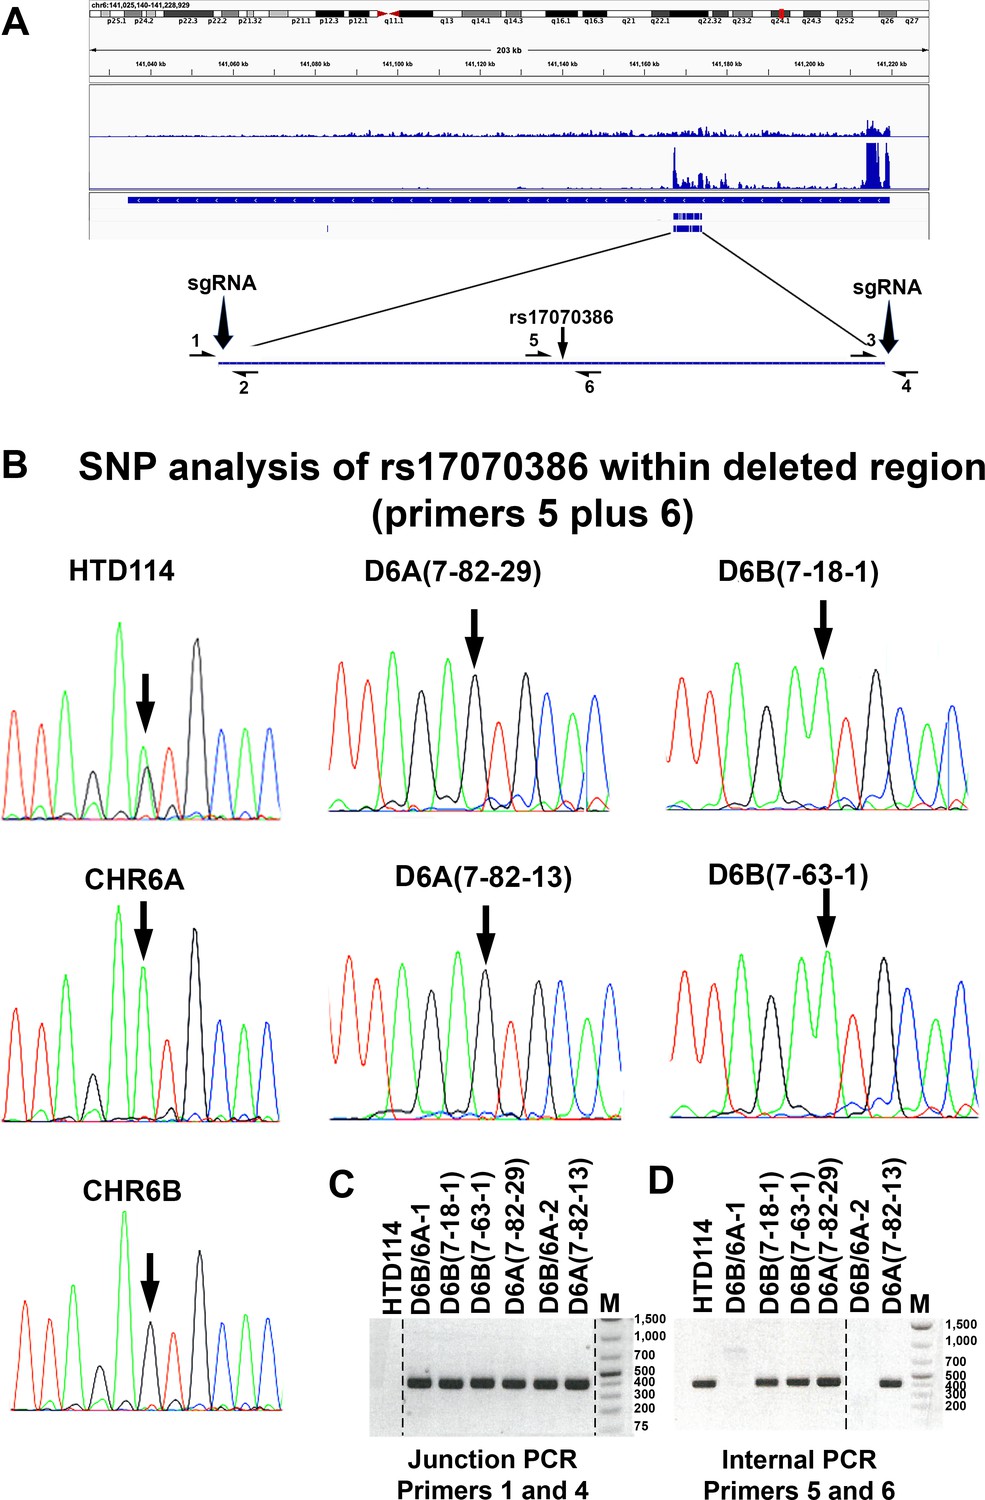
CRISPR/Cas9 deletion of the ~7 kb RBPD.
(A) Integrative Genomics Viewer view showing the genomic location of ASAR6-141. The genomic locations of RNAseq and eCLIP reads from HepG2 and K562 (from ENCODE) are shown. The zoomed in view shows the ~7 kb RBPD with the location where all of the peaks of eCLIP reads map within the region (see Figure 1—source data 1). The location of sgRNAs that flank the ~7 kb RBPD are shown. The location of PCR primers (1-6) and the heterozygous SNP rs17070386 are also shown (see Figure 1—source data 3). (B) Sanger sequencing traces on PCR products generated from genomic DNA using primers 5 and 6 (see Figure 1—source data 3). In previous studies we generated mouse monochromosomal hybrid cells containing the two chromosome 6 homologs from HTD114 (Stoffregen et al., 2011), and sequencing traces from these two hybrids, contain either chromosome 6 A (CHR6A) or chromosome 6B (CHR6B) are shown below the HTD114 panel. Sequencing traces from PCR products generated from 4 heterozygous deletions, two with CHR6A deletions {D6A(7-82-29) and D6A(7-82-13)} and two with CHR6B deletions {D6B(7-18-1) and D6B(7-63-1)} are shown. (C) Junction PCR (primers 1 and 4) on genomic DNA isolated from heterozygous {D6A(7-82-29), D6A(7-82-13), D6B(7-18-1) and D6B(7-63-1)} or homozygous deletions {D6B/6 A-1 and D6B/6 A-2} are shown. Parental HTD114 DNA was used as control. Size markers are in base pairs. (D) Internal PCR products (primers 5 and 6) on genomic DNA isolated from heterozygous {D6A(7-82-29), D6A(7-82-13), D6B(7-18-1) and D6B(7-63-1)} or homozygous deletions {D6B/6 A-1 and D6B/6 A-2} are shown. Parental HTD114 DNA was used as control. Size markers are in base pairs.
-
Figure 1—figure supplement 1—source data 1
Original image file of PCR products shown in Figure 1—figure supplement 1C.
Figure 1-figure supplement 1C, the original image file of the PCR products shown in panel C. Figure 1-figure supplement 1C (labels), the original image file for panel C with labels and regions of the image used are marked by the black boxes. Figure 1-figure supplement 1D, the original image file of the PCR products shown in panel D. Figure 1-figure supplement 1D (labels), the original image file for panel D with labels and regions of the image used are marked by the black boxes.
- https://cdn.elifesciences.org/articles/95898/elife-95898-fig1-figsupp1-data1-v1.zip
Figure 2 with 1 supplement
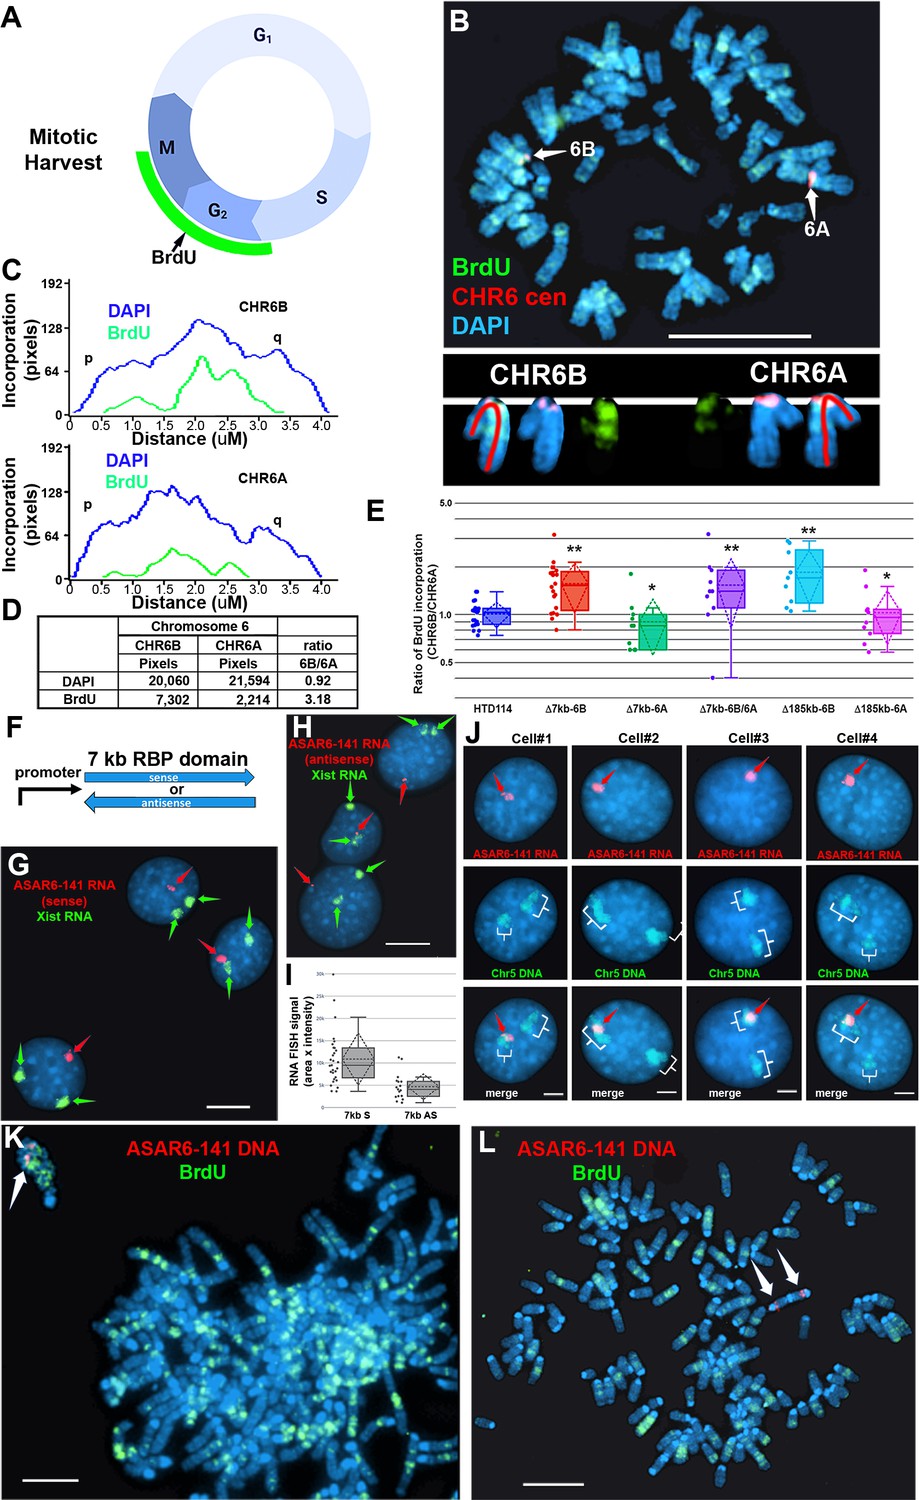
Replication timing in cells with ASAR6−141~7 kb RBPD deletion or ectopic integration.
(A) Schematic illustration of the BrdU terminal label protocol (Smith and Thayer, 2012). Cells were treated with BrdU (green) for 5 hr and then harvested for mitotic cells. (B) BrdU incorporation in HTD114 cells containing a heterozygous deletion of the ~7 kb RBPD. Cells containing a deletion of the ~7 kb RBPD from the expressed allele of ASAR6-141 were exposed to BrdU, harvested for mitotic cells, and subjected to DNA FISH using a chromosome 6 centromeric probe (red; B). The larger centromere resides on the chromosome 6 with the silent ASAR6-141 allele (CHR6A), and the smaller centromere resides on the chromosome 6 with the expressed ASAR6-141 allele (CHR6B). DNA was stained with DAPI (blue). (C and D) DAPI staining and BrdU incorporation were quantified by calculating the number of pixels (area x intensity) and displayed as a ratio of BrdU incorporation in CHR6B divided by the BrdU incorporation in CHR6A. (E) Quantification of BrdU incorporation in multiple cells with heterozygous (Δ7kb-6B, expressed allele; or Δ7kb-6A, silent allele) or homozygous (Δ7kb-6B/6 A) deletions of the ~7 kb RBPD. Also shown is the quantification of BrdU incorporation in heterozygous deletions of the entire ~185 kb ASAR6-141 gene from chromosome 6B (Δ185-6B) or 6 A (Δ185–6 A) (Heskett et al., 2020). Box plots indicate mean (solid line), standard deviation (dotted line), 25th, 75th percentile (box) and 5th and 95th percentile (whiskers) and individual cells (single points). p Values were calculated using the Kruskal-Wallis test (Kruskal, 1964). Values for a minimum of 10 individual cells are shown as dots. **p=0.00027 and *p=0.03. (F) Schematic view of the ~7 kb RBPD in both the sense and antisense orientation. The promoter used to drive expression is from ASAR6 9. (G and H) Two color RNA FISH assay for expression of the ~7 kb RBPD transgenes. Individual clones were screened for RNA expressed from the ASAR6-141 (~7 kb RBPD) transgenes (red, arrows), and RNA hybridization using an Xist probe (green, arrows) was used as positive control. (G and H) represent examples of cells containing the sense and antisense transgenes, respectively. (I) Quantitation of the size (pixels = area x intensity) of the RNA FISH signals expressed from the 7 kb sense (7 kb S) or antisense (7 kb AS) transgenes are shown. Box plots indicate mean (solid line), standard deviation (dotted line), 25th, 75th percentile (box) and 5th and 95th percentile (whiskers) and a minimul of 10 individual cells (single points) are shown. p Value of 0.006 was calculated using the Kruskal-Wallis test (Kruskal, 1964). Values for individual cells are shown as dots. (J) RNA from the ~7 kb RBPD remains localized to mouse chromosomes. RNA-DNA FISH using the ~7 kb RBPD as RNA FISH probe (red, arrows), plus a mouse chromosome 5 paint to detect chromosome 5 DNA (green, brackets). (K) Cells containing the sense ~7 kb RBPD transgene integrated into mouse chromosome 5 were exposed to BrdU (green), harvested for mitotic cells, and subjected to DNA FISH using the ~7 kb RBPD (red, arrows). Note that the chromosome that contains the transgene shows delayed mitotic condensation and more BrdU incorporation than any other chromosome within the same cell. (L) Cells containing the antisense ~7 kb RBPD transgene integrated into a mouse chromosome were exposed to BrdU (green), harvested for mitotic cells, and subjected to DNA FISH using the ~7 kb RBPD (red). Note that the chromosome that contains the transgene shows normal mitotic condensation and only a small amount of BrdU incorporation. Scale bars are 10 µM (B, G, H) 5 µM (K, L) and 2 µM (J).
Figure 2—figure supplement 1
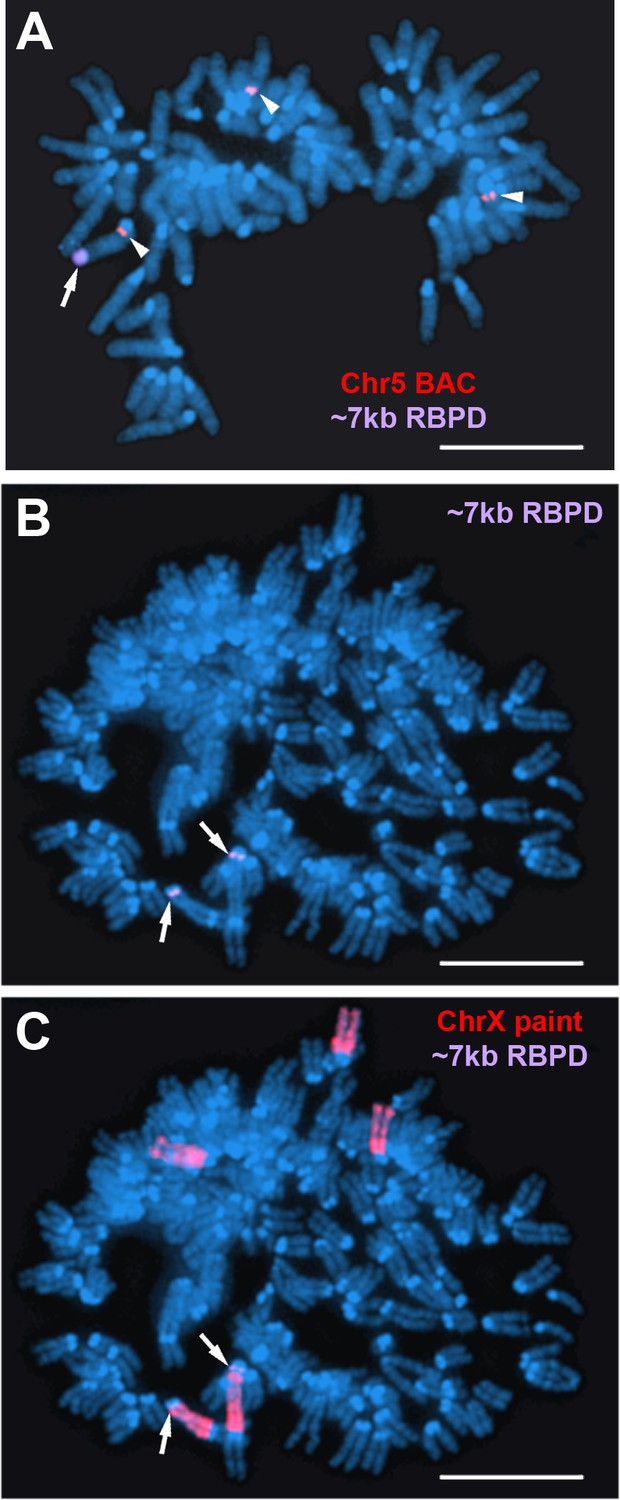
Identification of mouse chromosomes containing the ~7 kb RBPD transgenes.
(A) DNA FISH on mouse chromosomes from clone ~7 kb(+)A5. Mitotic spread showing DNA FISH using the ~7 kb RBPD (magenta; arrow) and a mouse chromosome 5 BAC (RP24-107D17; red; arrowheads). (B and C) DNA FISH on mouse chromosomes from clone ~7 kb(+)X1. Mitotic spread showing DNA FISH using the ~7 kb RBPD (magenta; arrows) and a mouse X chromosome paint (red). Scale bars are 10uM.
Figure 3 with 2 supplements
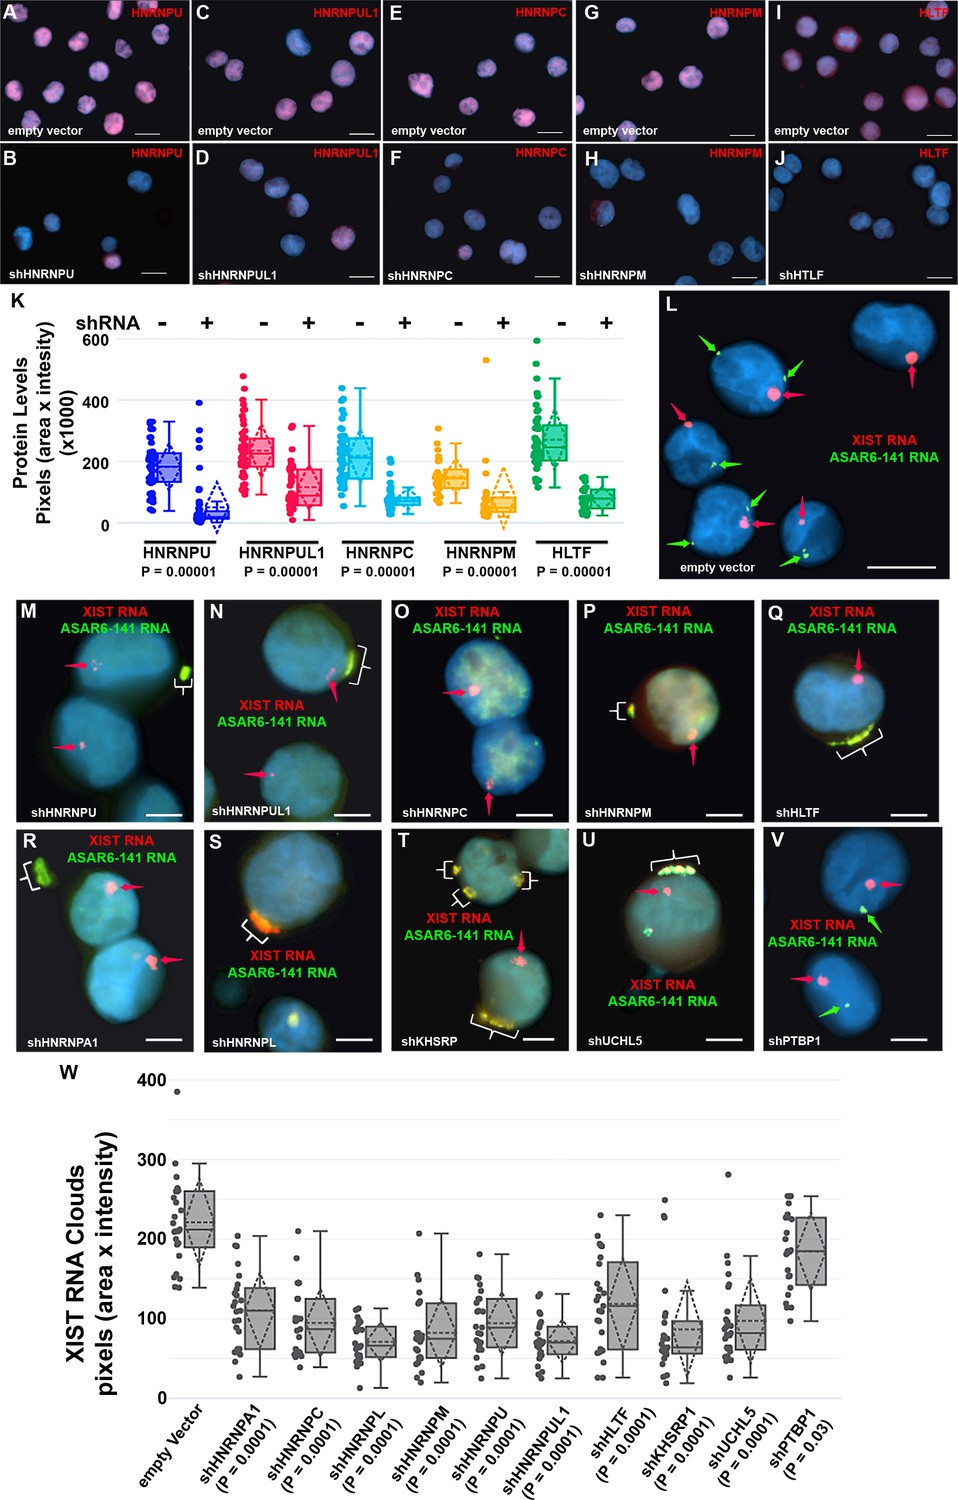
Depletion of RBPs results in disruption of the chromosome territory localization of ASAR6-141 RNA.
(A–J) shRNA mediated depletion of RBPs. K562 cells were transfected with empty vector (A, C, E, G, and I) or vectors expressing shRNAs directed against HNRNPU (B), HNRNPUL1 (D), HNRNPC (F), HNRNPM (H), or HLTF (J). (K) Cells were stained with the appropriate antibodies and quantitation of each RBP was determined in >25 individual cells. Box plots indicate mean (solid line), standard deviation (dotted line), 25th, 75th percentile (box), 5th and 95th percentile (whiskers), and individual cells (single points) are indicated. p Values were calculated using the Kruskal-Wallis test (Kruskal, 1964). (L–V) RNA-DNA FISH for ASAR6-141 (green) and XIST (red) RNA. K562 cells were transfected with empty vector (L) or vectors expressing shRNAs against HNRNPU (M), HNRNPUL1 (N), HNRNPC (O), HNRNPM (P), HLTF (Q), HNRNPA1 (R), HNRNPL (S), KHSRP (T), UCHL5 (U), or PTBP1 (V). The red arrows mark the RNA FISH signals for XIST. The brackets mark cytoplasmic regions that hybridized to both RNA FISH probes. DNA was stained with DAPI, and Bars are 10 µM (A–J and L) or 5 uM (M–V).(W) Quantitation of the XIST RNA FISH signals. K562 cells transfected and processed for RNA FISH as in L-V were analyzed for quantitation of XIST RNA cloud size (pixels: area X intensity) in >25 individual cells. Box plots indicate mean (solid line), standard deviation (dotted line), 25th, 75th percentile (box), 5th and 95th percentile (whiskers) and individual cells (single points). p Values were calculated using the Kruskal-Wallis test (Kruskal, 1964).
Figure 3—figure supplement 1
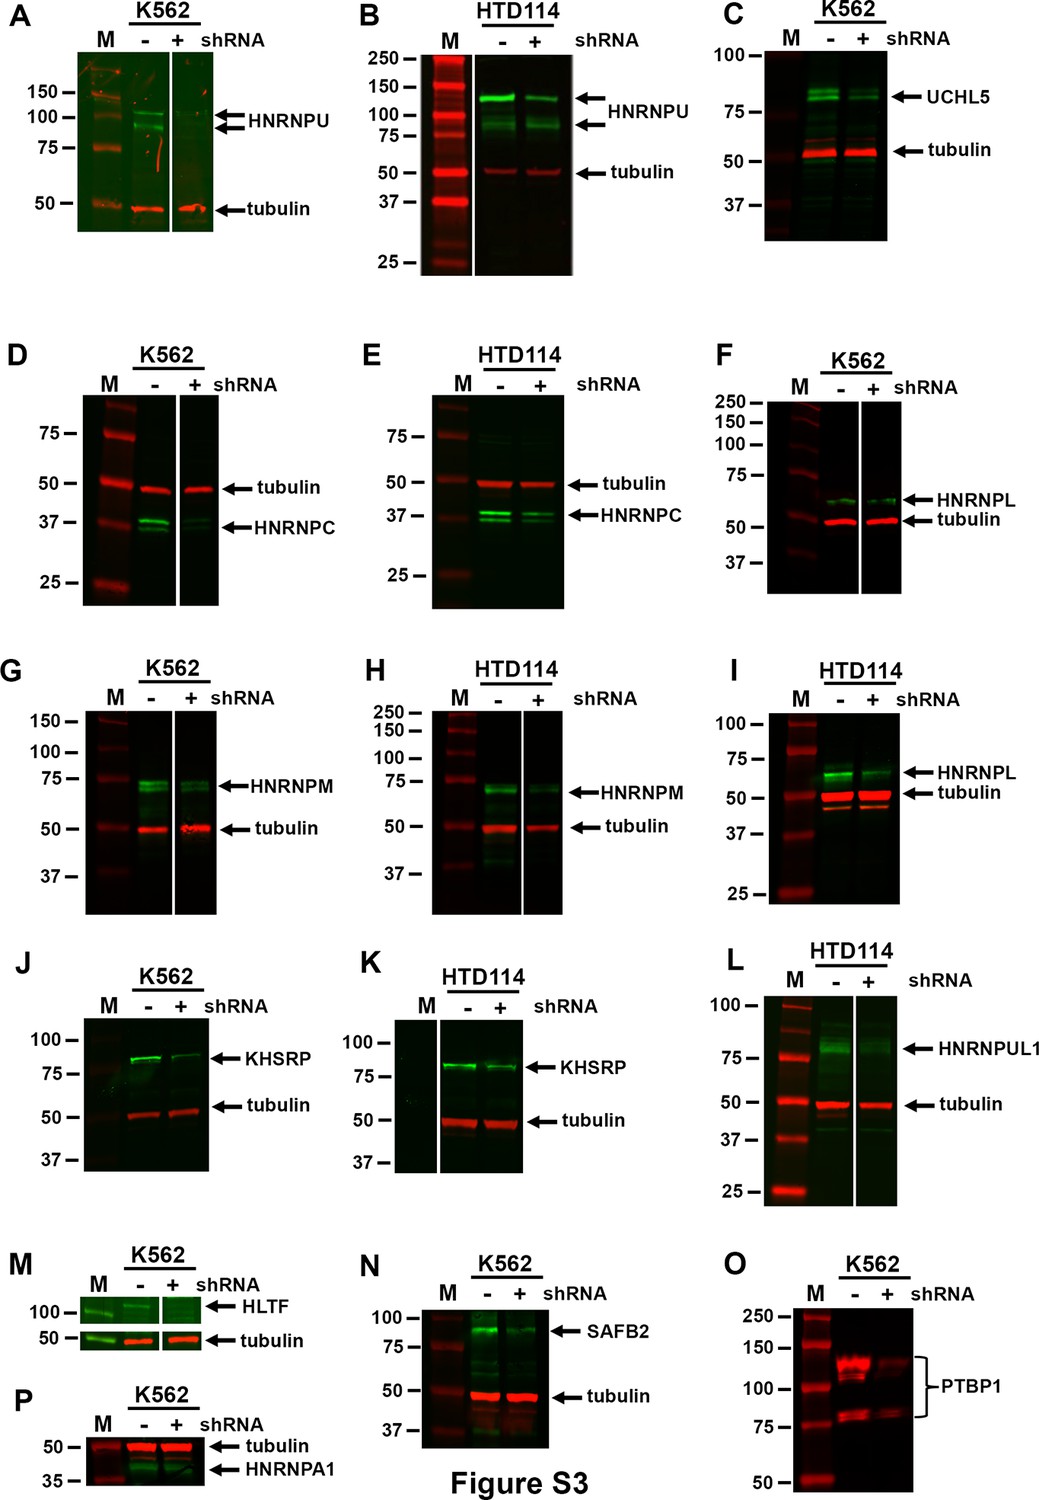
RBP protein levels in cells expressing shRNAs.
K562 or HTD114 cells were transfected with empty vector (-) or shRNA against RBPs and cell extracts were processed for western blots using antibodies (Key Resource Table) as indicated: (A and B) HNRNPU (green); (C) UCHL5 (green); (D and E) HNRNPC (green); (F and I) HNRNPL (green); (G and H) HNRNPM (green); (J and K) KHSRP (green); (L) HNRNPUL1 (green); (M) HLTF (green); (N) SAFB2 (green); (O) PTBP1 (red); or (P) HNRNPA1 (green). Tubulin (red) was used as loading control, and size markers are indicated.
-
Figure 3—figure supplement 1—source data 1
Original image files for the western blots.
Figure 3-figure supplement 1A, the original image file for the western blot with HNRNPU (green) and tubulin (red) antibodies on K562 cells with and without shRNA against HNRNPU. Figure 3-figure supplement 1A (labels), the same image as above showing labels for the location of HNRNPU and tubulin, and the region of the image used is highlighted in white. Molecular weight standards are shown in red. Figure 3-figure supplement 1B, the original image file for the western blot with HNRNPU (green) and tubulin (red) antibodies on HTD114 cells with and without shRNA against HNRNPU. Figure 3-figure supplement 1B (labels), the same image as above showing labels for the location of HNRNPU and tubulin, and the region of the image used is highlighted in white. Molecular weight standards are shown in red. Figure 3—figure supplement 1C, the original image file for the western blot with UCHL5 (green) and tubulin (red) antibodies on K562 cells with and without shRNA against UCHL5. Figure 3-figure supplement 1C (labels), the same image as above showing labels for the location of UCHL5 and tubulin, and the region of the image used is highlighted in white. Molecular weight standards are shown in red. Figure 3-figure supplement 1D, the original image file for the western blot with HNRNPC (green) and tubulin (red) antibodies on K562 cells with and without shRNA against HNRNPC. Figure 3-figure supplement 1C (labels), the same image as above showing labels for the location of HNRNPC and tubulin, and the region of the image used is highlighted in white. Molecular weight standards are shown in red. Figure 3—figure supplement 1E, the original image file for the western blot with HNRNPC (green) and tubulin (red) antibodies on HTD114 cells with and without shRNA against HNRNPC. Figure 3-figure supplement 1E (labels), the same image as above showing labels for the location of HNRNPC and tubulin, and the region of the image used is highlighted in white. Molecular weight standards are shown in red. Figure 3-figure supplement 1F, the original image file for the western blot with HNRNPL (green) and tubulin (red) antibodies on K562 cells with and without shRNA against HNRNPL. Figure 3—figure supplement 1F (labels), the same image as above showing labels for the location of HNRNPL and tubulin, and the region of the image used is highlighted in white. Molecular weight standards are shown in red. Figure 3-figure supplement 1G, the original image file for the western blot with HNRNPM (green) and tubulin (red) antibodies on K562 cells with and without shRNA against HNRNPM. Figure 3-figure supplement 1G (labels), the same image as above showing labels for the location of HNRNPM and tubulin, and the region of the image used is highlighted in white. Molecular weight standards are shown in red. Figure 3-figure supplement 1H, the original image file for the western blot with HNRNPM (green) and tubulin (red) antibodies on HTD114 cells with and without shRNA against HNRNPM. Figure 3-figure supplement 1H (labels), the same image as above showing labels for the location of HNRNPM and tubulin, and the region of the image used is highlighted in white. Molecular weight standards are shown in red. Figure 3-figure supplement 1I, the original image file for the western blot with HNRNPL (green) and tubulin (red) antibodies on HTD114 cells with and without shRNA against HNRNPL. Figure 3-figure supplement 1I (labels), the same image as above showing labels for the location of HNRNPL and tubulin, and the region of the image used is highlighted in white. Molecular weight standards are shown in red. Figure 3-figure supplement 1J, the original image file for the western blot with KHSRP (green) and tubulin (red) antibodies on K562 cells with and without shRNA against KHSRP. Figure 3-figure supplement 1J (labels), the same image as above showing labels for the location of KHSRP and tubulin, and the region of the image used is highlighted in white. Molecular weight standards are shown in red. Figure 3-figure supplement 1K, the original image file for the western blot with KHSRP (green) and tubulin (red) antibodies on HTD114 cells with and without shRNA against KHSRP. Figure 3-figure supplement 1K (labels), the same image as above showing labels for the location of KHSRP and tubulin, and the region of the image used is highlighted in white. Molecular weight standards are shown in red. Figure 3-figure supplement 1L, the original image file for the western blot with HNRNPUL1 (green) and tubulin (red) antibodies on HTD114 cells with and without shRNA against HNRNPUL1. Figure 3-figure supplement 1L (labels), the same image as above showing labels for the location of HNRNPUL1 and tubulin, and the region of the image used is highlighted in white. Molecular weight standards are shown in red. Figure 3-figure supplement 1M, the original image file for the western blot with HLTF (green) and tubulin (red) antibodies on K562 cells with and without shRNA against HLTF. Figure 3-figure supplement 1M (labels), the same image as above showing labels for the location of HLTF and tubulin, and the region of the image used is highlighted in white. Molecular weight standards are shown in red. Figure 3-figure supplement 1N, the original image file for the western blot with SAFB2 (green) and tubulin (red) antibodies on K562 cells with and without shRNA against SAFB2. Figure 3-figure supplement 1N (labels), the same image as above showing labels for the location of SAFB2 and tubulin, and the region of the image used is highlighted in white. Molecular weight standards are shown in red. Figure 3-figure supplement 1O, the original image file for the western blot with PTBP1 (red) antibody on K562 cells with and without shRNA against PTBP1. Figure 3-figure supplement 1O (labels), the same image as above showing labels for the location of PTBP1, and the region of the image used is highlighted in white. Molecular weight standards are shown in red. Figure 3-figure supplement 1P, the original image file for the western blot with HNRNPA1 (green) and tubulin (red) antibodies on K562 cells with and without shRNA against HNRNPA1. Figure 3-figure supplement 1P (labels), the same image as above showing labels for the location of HNRNPA1 and tubulin, and the region of the image used is highlighted in white. Molecular weight standards are shown in red.
- https://cdn.elifesciences.org/articles/95898/elife-95898-fig3-figsupp1-data1-v1.zip
Figure 3—figure supplement 2
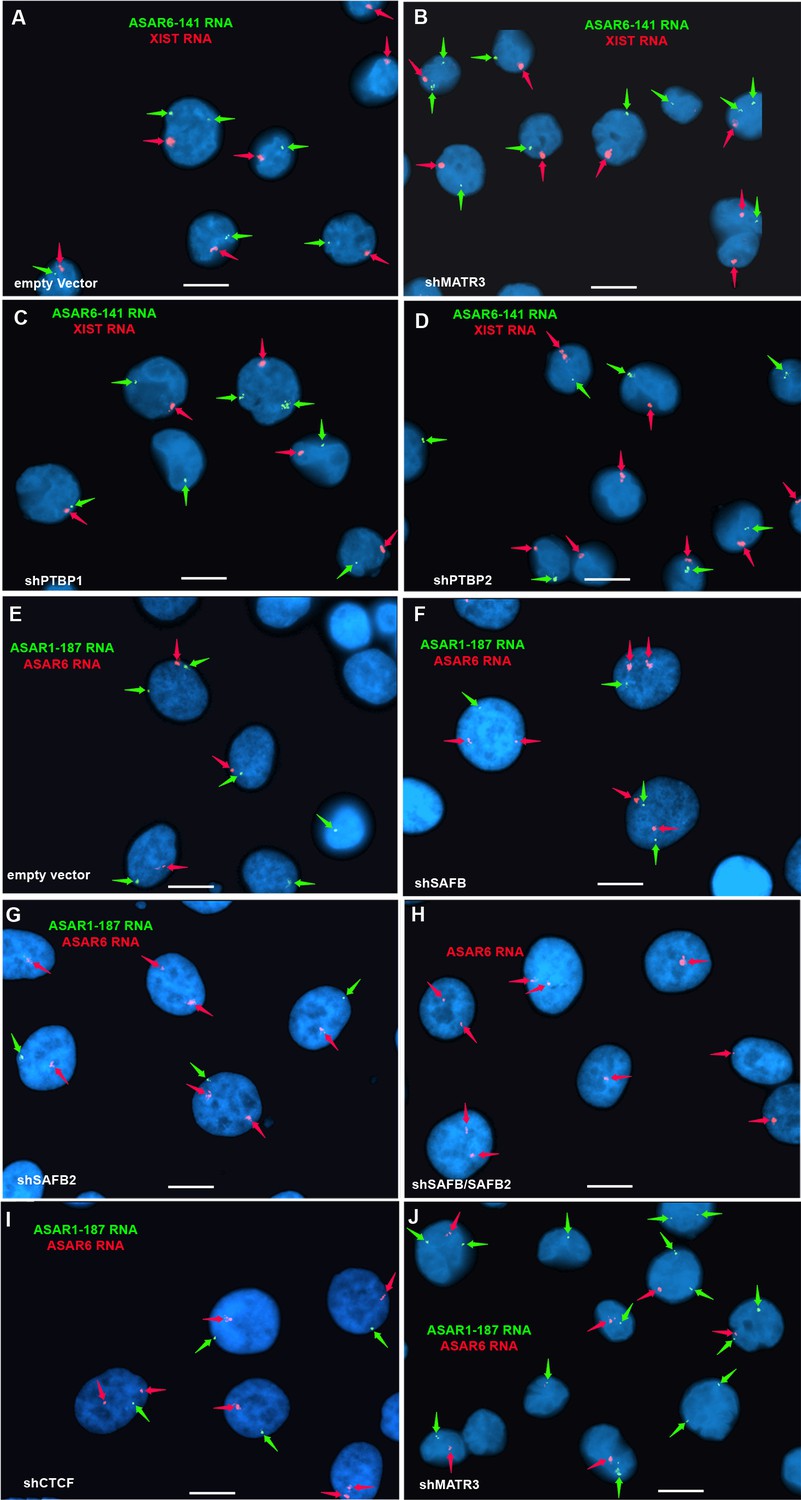
RNA FISH on cells transfected with shRNAs that did not disrupt ASAR localization.
(A–D) K562 cells were transfected with empty vector (A) or shRNA expression vectors for MATR3 (B), PTBP1 (C), or PTBP2 (D). Cells were processed for RNA FISH using probes for ASAR6-141 (green; arrows) or XIST (red; arrows). (E–J) HTD114 cells were transfected with empty vector (E) or shRNA expression vectors for SAFB (F), SAFB2 (G), SAFB plus SAFB2 (H), CTCF (assayed for only ASAR6 RNA) (I), or MATR3 (J). DNA was stained with DAPI, and scale bars are 10 µM.
Figure 4
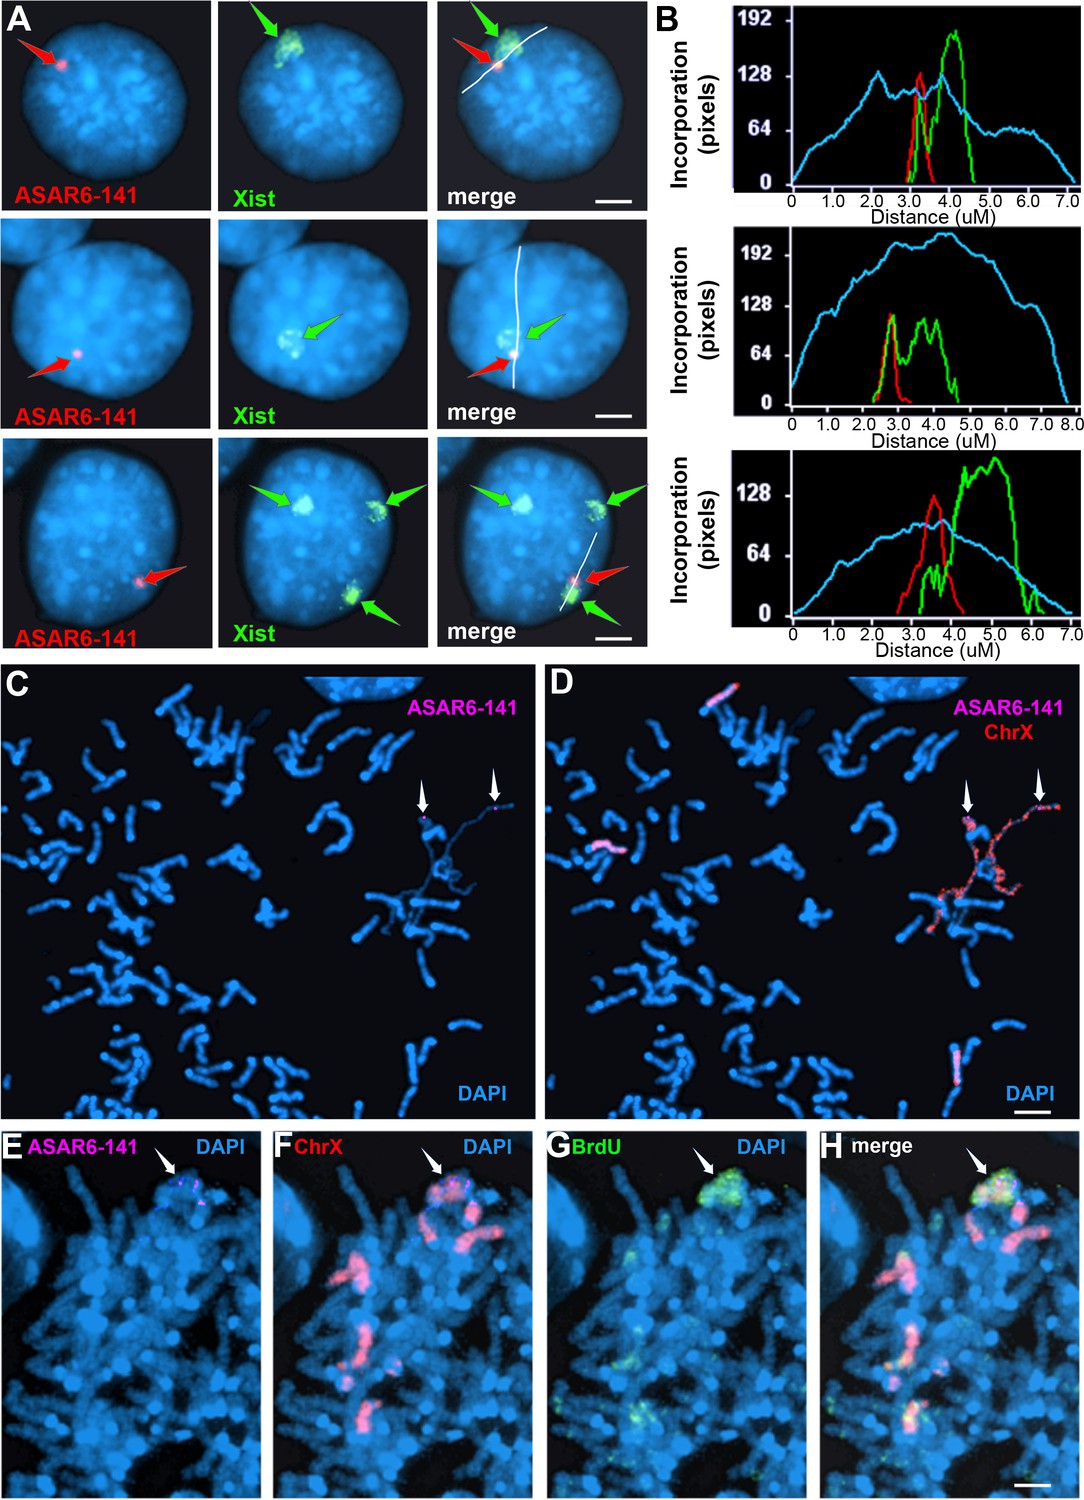
Ectopic integration of the ASAR6−141~7 kb RBPD transgene into an inactive X chromosome.
(A) Two color RNA FISH assay for expression of the sense ~7 kb RBPD transgene plus Xist RNA. Examples of three different cells showing colocalization of the ASAR RNA and Xist RNA. Individual cells were processed for expression of the sense strand ~7 kb RBPD transgene (left panels, red, arrow) in combination with RNA FISH for Xist (middle panels, green, arrow). The right panels show the merged images. The white lines show the path for the pixel intensity profiles used for panel B. (B) Pixel intensity profiles across the Xist RNA hybridization domain showing enhanced signal intensity over the ~7 kb RBPD RNA hybridization domain. (C and D) Delayed mitotic chromosome condensation of the X chromosome that contains the ~7 kb RBPD transgene. An example of a mitotic spread processed for DNA FISH using the ~7 kb RBPD as probe (magenta, panel C) plus a mouse X chromosome paint (red, panel D). The arrows mark the location of the transgene hybridization signal. (E–H) Cells containing the ~7 kb RBPD transgene integrated into the mouse X chromosome were exposed to BrdU (G, green), harvested for mitotic cells, and subjected to DNA FISH using the ~7 kb RBPD (E, magenta) plus a mouse X chromosome paint (F, red). The merged images are shown in panel H. Scale bars are 2 µM.
Figure 5 with 1 supplement
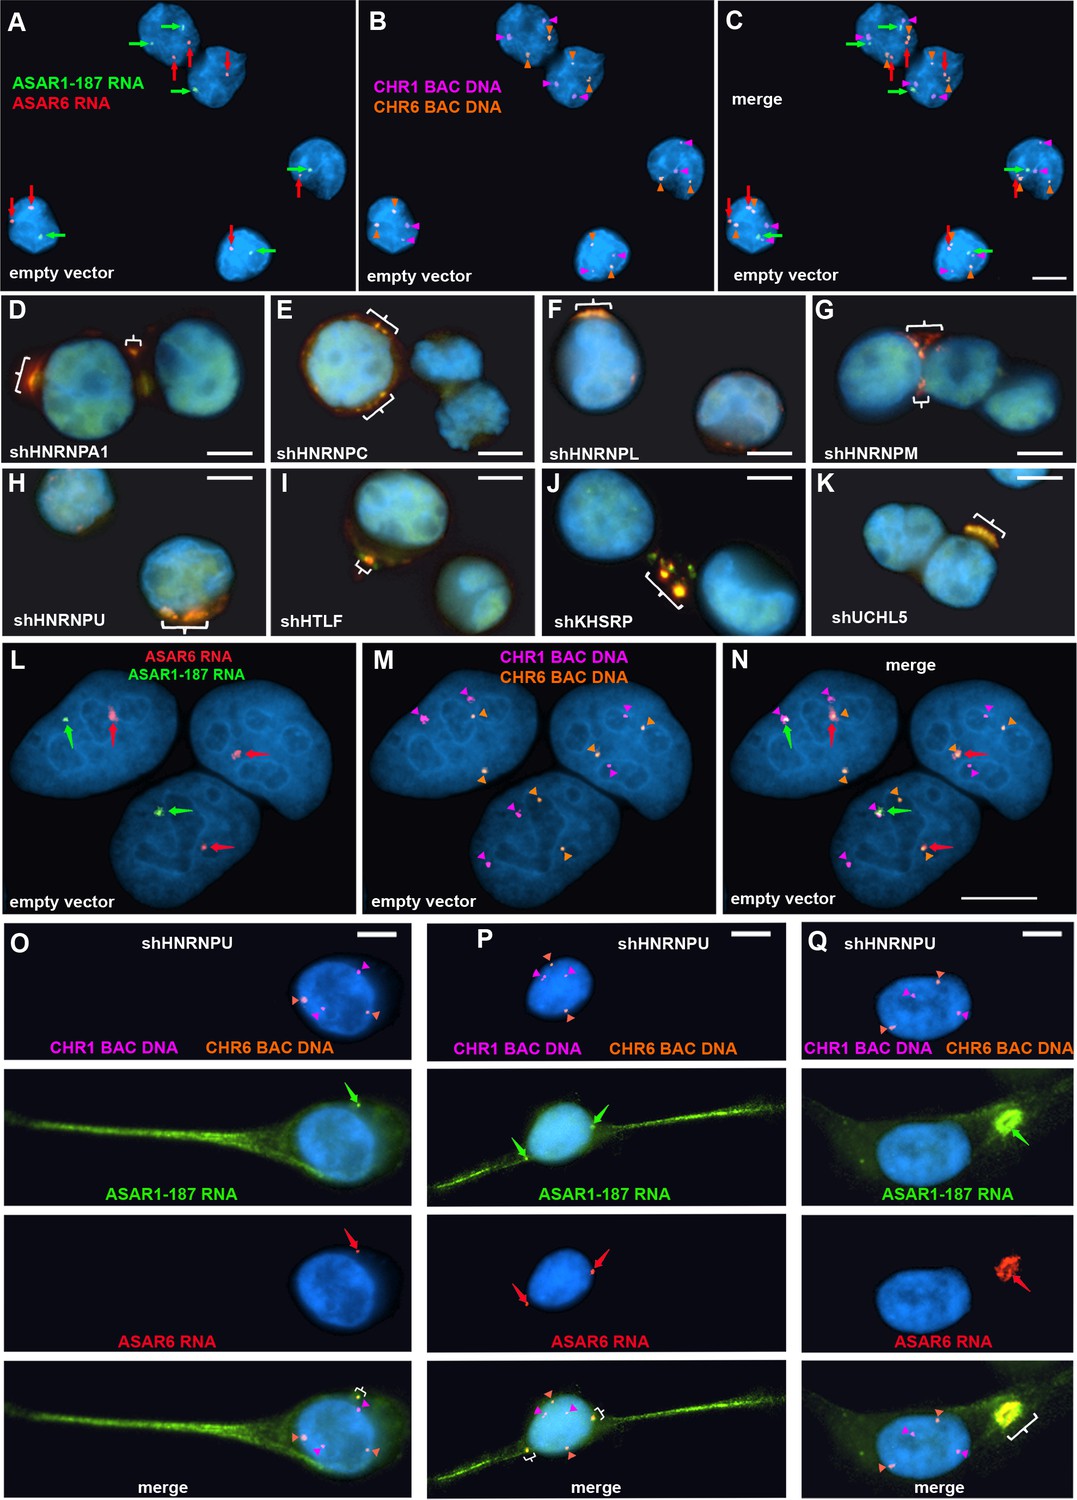
Depletion of RBPs results in disruption of the chromosome territory localization of ASAR RNAs.
shRNA-mediated depletion of RBPs in K562 cells (A–K) or HTD114 cells (L–Q). Cells were transfected with empty vector (A–C and L–N) or vectors expressing shRNAs directed against HNRNPA1 (D), HNRNPC (E), HNRNPL (F), HNRNPM (G), HNRNPU (H, and O-Q), HLTF (I), KHSRP (J), or UCHL5 (K). Cells were processed for RNA FISH with probes for ASAR6 (red, arrows) and ASAR1-187 (green, arrows). Cells were also processed for DNA FISH using BAC DNA to detect chromosome 1 (CHR1 BAC DNA, magenta) and chromosome 6 (CHR6 BAC DNA, orange; A–C and L–Q). Arrows mark the sites of RNA FISH hybridization and arrowheads mark the sites of DNA hybridization. RNA-DNA FISH for ASAR1-187 (RNA in green, arrows; DNA in magenta and arrowheads), ASAR6 (RNA in red, arrows; DNA in orange and arrowheads). The brackets mark the cytoplasmic regions that hybridized to both RNA FISH probes. DNA was stained with DAPI, and scale bars are 10 µM.
Figure 5—figure supplement 1
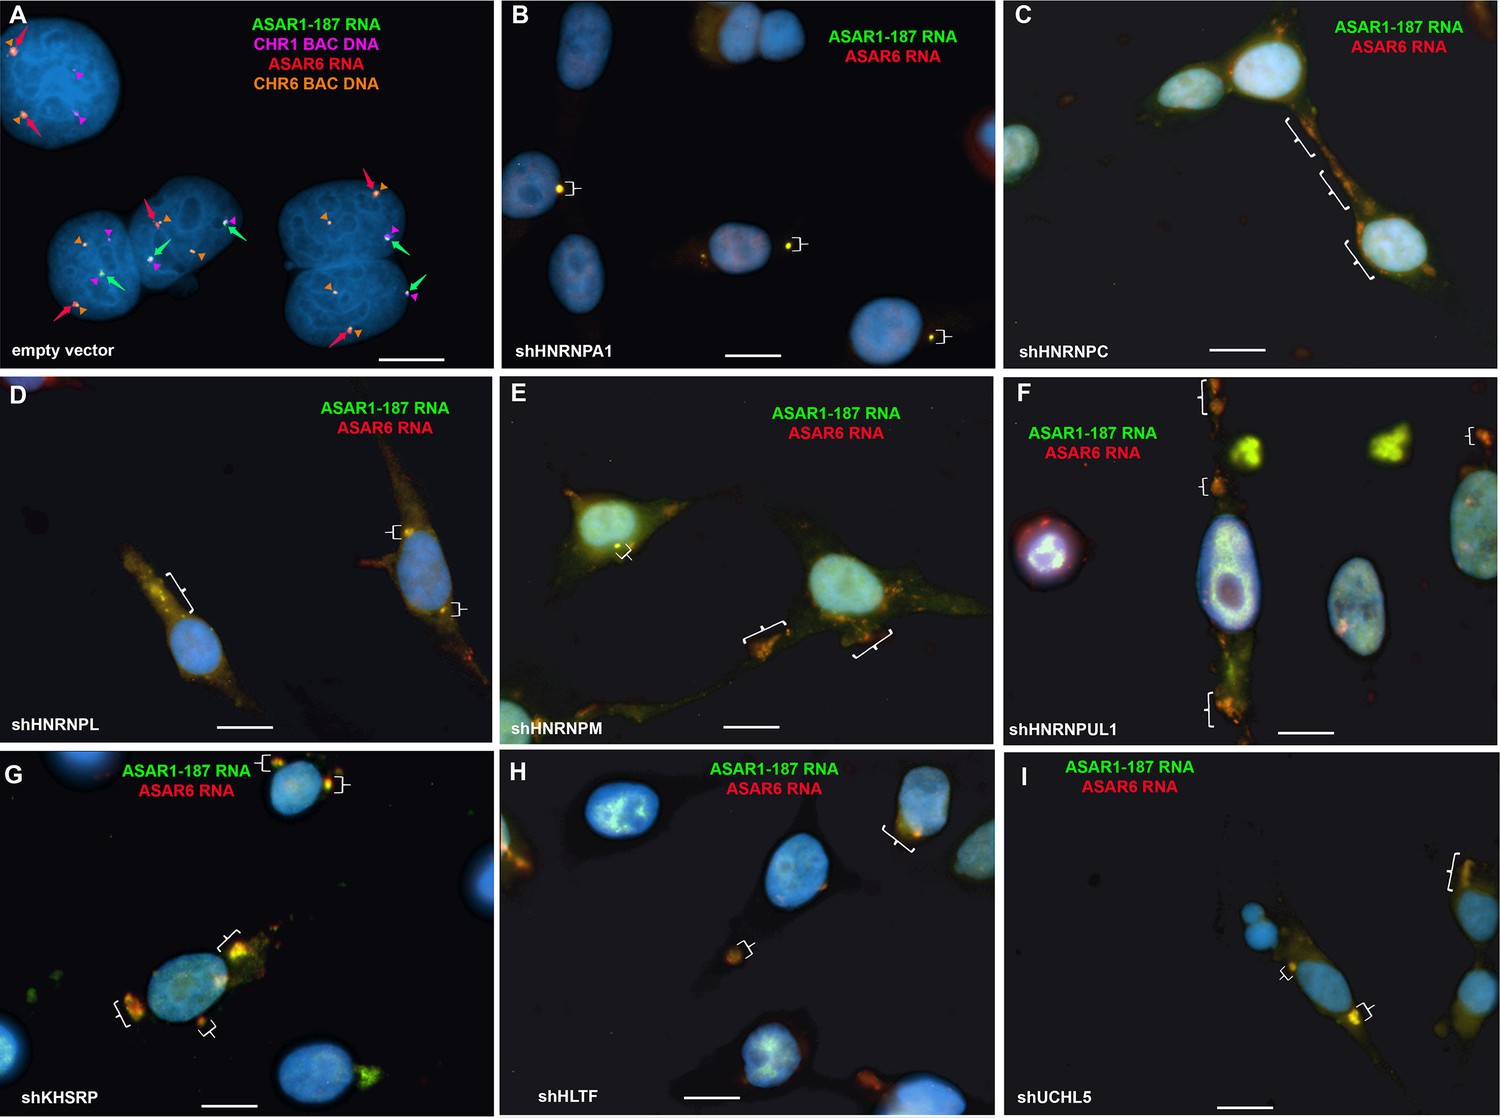
Disruption of the chromosome territory localization of ASAR1-187 and ASAR6 RNAs following shRNA depletion of RBPs.
HTD114 cells were transfected with empty vector (A) or shRNA expression vectors for HNRNPA1 (B), HNRNPC (C), HNRNPL (D), HNRNPM (E), HNRNPUL1 (F), KHSRP (G), HLTF (H), or UCHL5 (I). Cells were processed for RNA FISH using Fosmid probes (see Figure 1—source data 3) for ASAR1-187 (green, arrow) and ASAR6 (red, arrow). (A) DNA FISH hybridization signals for chromosome 1 (CHR1 BAC DNA; magenta) and chromosome 6 (CHR6 BAC DNA; orange) are indicated by arrowheads. The brackets mark cytoplasmic regions that hybridized to both ASAR RNA FISH probes. DNA was stained with DAPI, and scale bars are 10 µM.
Figure 6 with 2 supplements
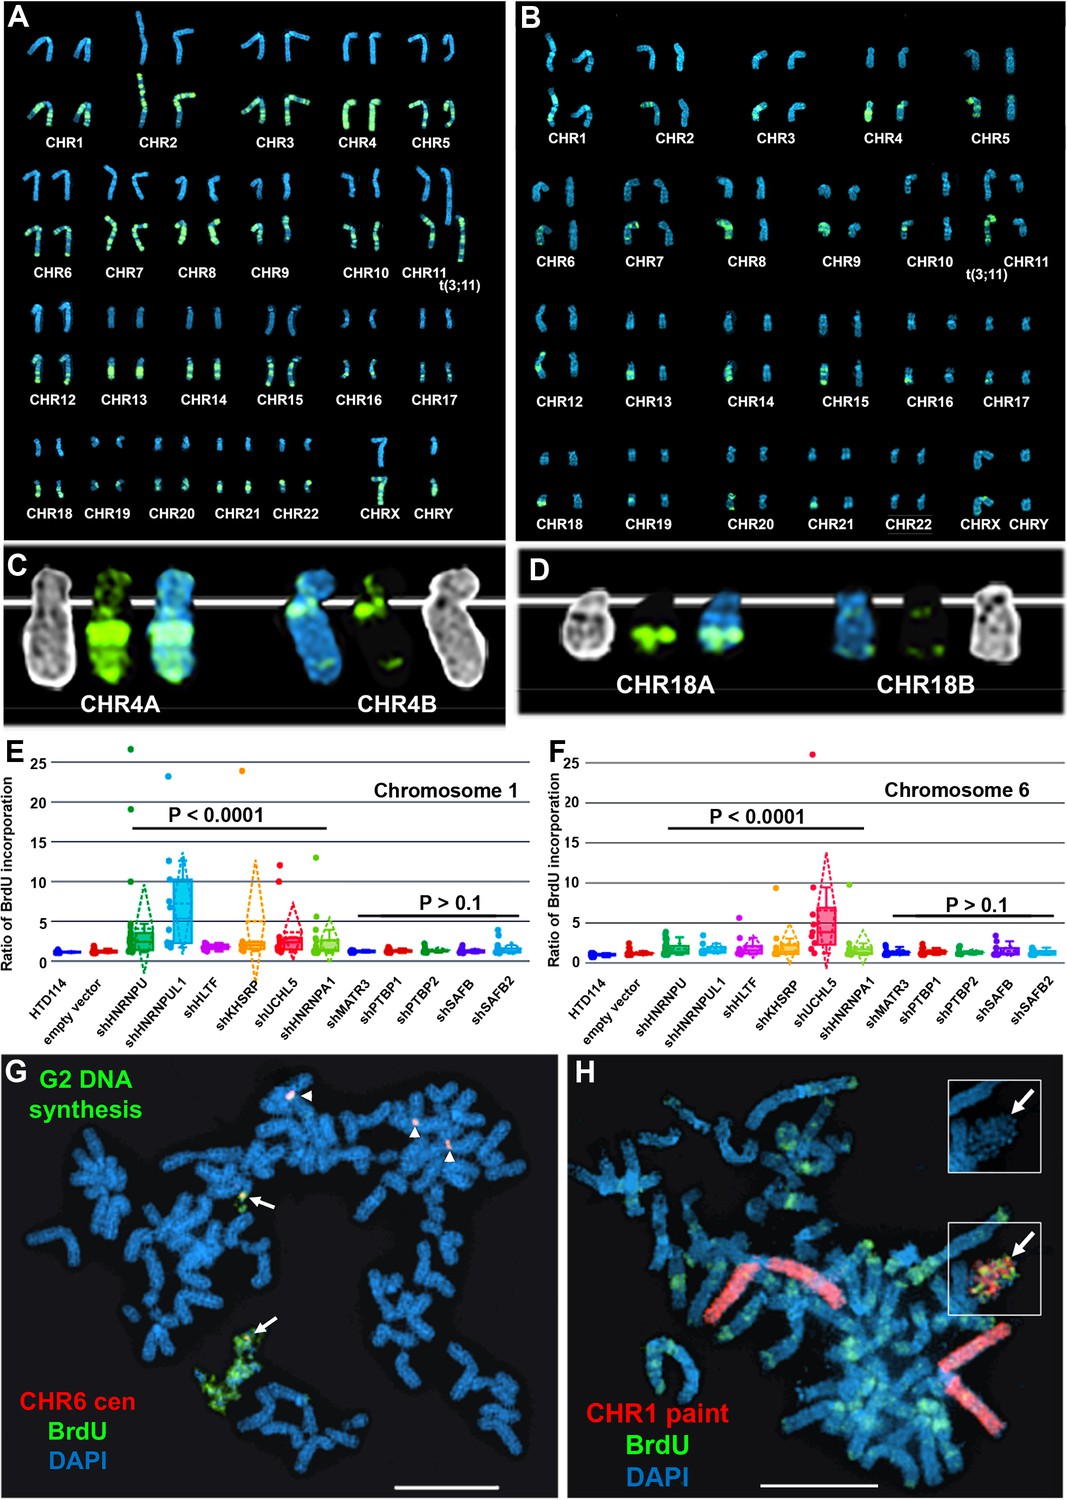
Depletion of RBPs results in asynchronous replication on autosome pairs.
(A) BrdU incorporation in parental HTD114 cells. Cells were exposed to BrdU for five hours and processed for BrdU incorporation using an antibody against BrdU. This panel represents chromosomes from multiple mitotic spreads showing representative BrdU incorporation in chromosome pairs. Both homologs of autosome pair were captured from the same mitotic cell, and each pair displays a typical BrdU incorporation pattern that is consistent with synchronous replication timing. (B) HTD114 cells were transfected with the HNRNPU shRNA expression vector, exposed to BrdU for five hours, and processed for BrdU incorporation. This panel represents chromosomes from multiple mitotic spreads showing representative BrdU incorporation in pairs of autosomes. Both homologs of autosome pairs were captured from the same mitotic cell, and each pair displays a differential BrdU incorporation pattern that is consistent with asynchronous replication timing. (C) Shows two chromosome 4 homologs (CHR4A and CHR4B) side by side. (D) Shows the BrdU incorporation in chromosome 18 homologs (CHR18A and CHR18B). For each chromosome pair the inverted DAPI staining (black and white), BrdU incorporation (green), and DAPI staining (blue) are shown. (E and F) Quantification of BrdU incorporation in multiple cells depleted for HNRNPU, HNRNPUL1, HTLF, KHSRP, UCHL5, HNRNPA1, MATR3, PTBP1, PTBP2, SAFB, and SAFB2. Box plots indicate mean (solid line), standard deviation (dotted line), 25th, 75th percentile (box), 5th and 95th percentile (whiskers) and a minimum of 10 individual cells (single points) are indicated. p Values were calculated using the Kruskal-Wallis test (Kruskal, 1964). (G) DRT/DMC on chromosome 6 following HNRNPU depletion. HTD114 cells were transfected with the HNRNPU shRNA expression vector, exposed to BrdU for 5 hr, harvested for mitotic cells, and processed for BrdU incorporation (green) and DNA FISH using a chromosome 6 centromeric probe (red). (H) DRT/DMC on chromosome 1 following UCHL5 depletion. HTD114 cells were transfected with the UCHL5 shRNA expression vector, exposed to BrdU for 5 hr, harvested for mitotic cells, and processed for BrdU incorporation (green) and DNA FISH using a chromosome 1 paint as probe (red). The arrow marks the chromosome 1 with DRT/DMC, and the inset shows only the DAPI staining of the chromosome 1 highlighting the DMC.
Figure 6—figure supplement 1
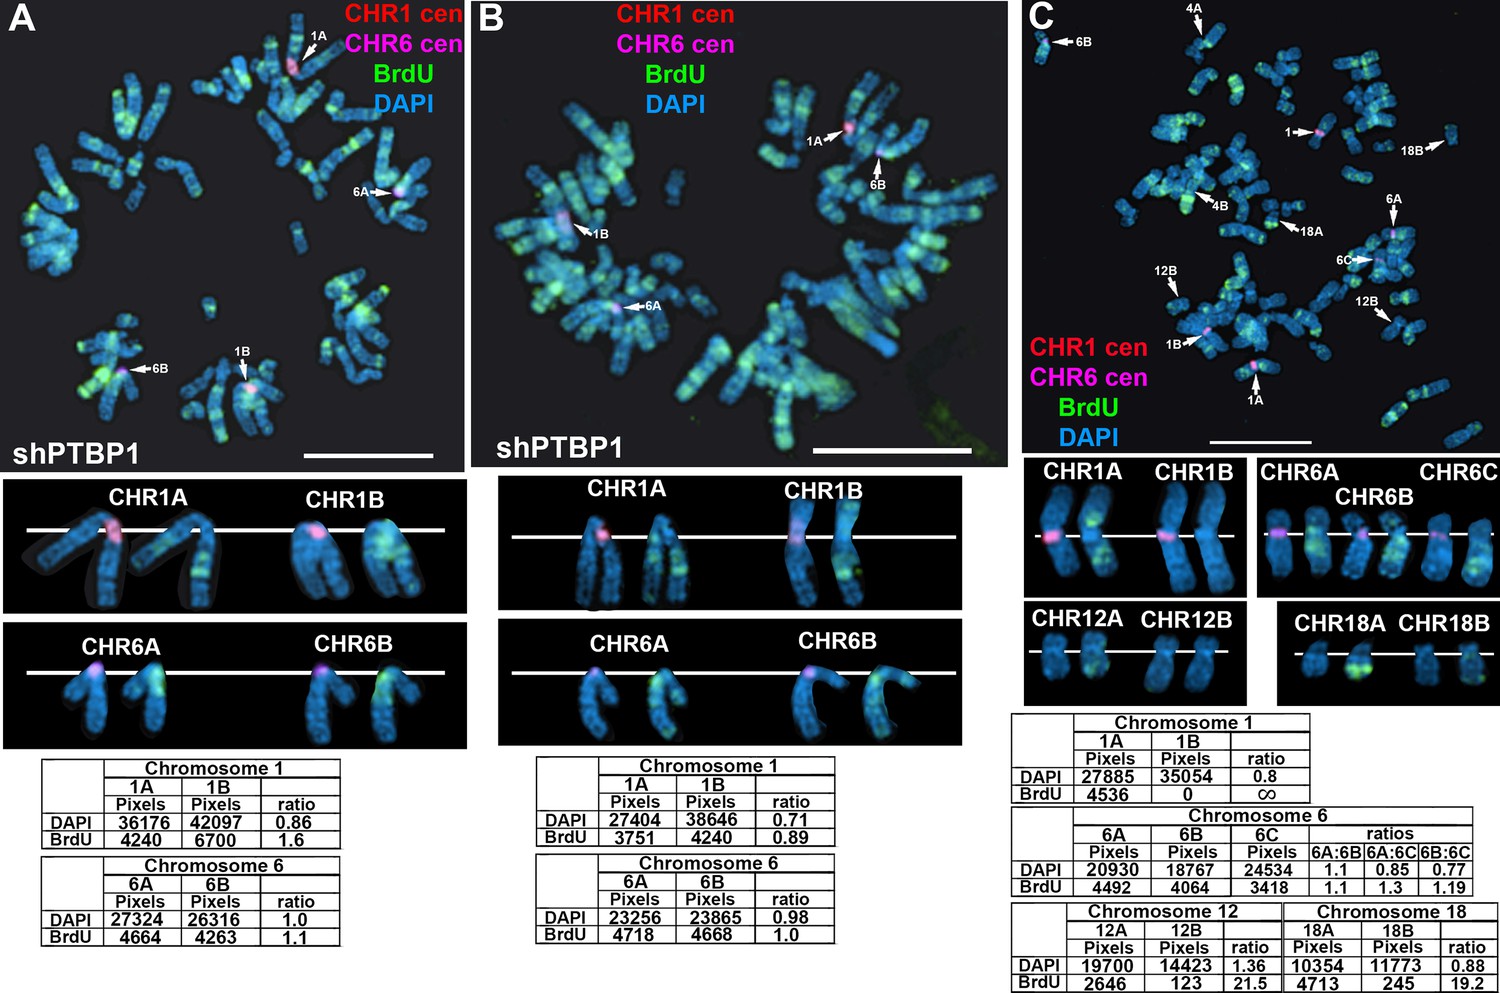
Replication timing in cells transfected with shRNA expression vectors.
(A and B) HTD114 cells were transfected with PTBP1 shRNA expression vector, exposed to BrdU for 5 hr, harvested for mitotic cells, and processed for BrdU incorporation (green) and DNA FISH using a chromosome 1 (A, red) or 6 (B, magenta) centromeric probe. Cells were exposed to BrdU for five hours, processed for BrdU incorporation using an antibody against BrdU. The ratio of BrdU incorporation in chromosome 1 and chromosome 6 homologs are shown in the bottom panels of A and B, respectively. (C) HTD114 cells were transfected with shRNA expression vector for HNRNPU, exposed to BrdU for 5 hr, harvested for mitotic cells, and processed for BrdU incorporation (green) and DNA FISH using centromeric probes for chromosome 1 (red) or 6 (magenta). The ratio of BrdU incorporation in chromosome homologs for 1, 6, 12, and 18 are shown in the bottom panels. DNA was stained with DAPI, and scale bars are 10 µM.
Figure 6—figure supplement 2
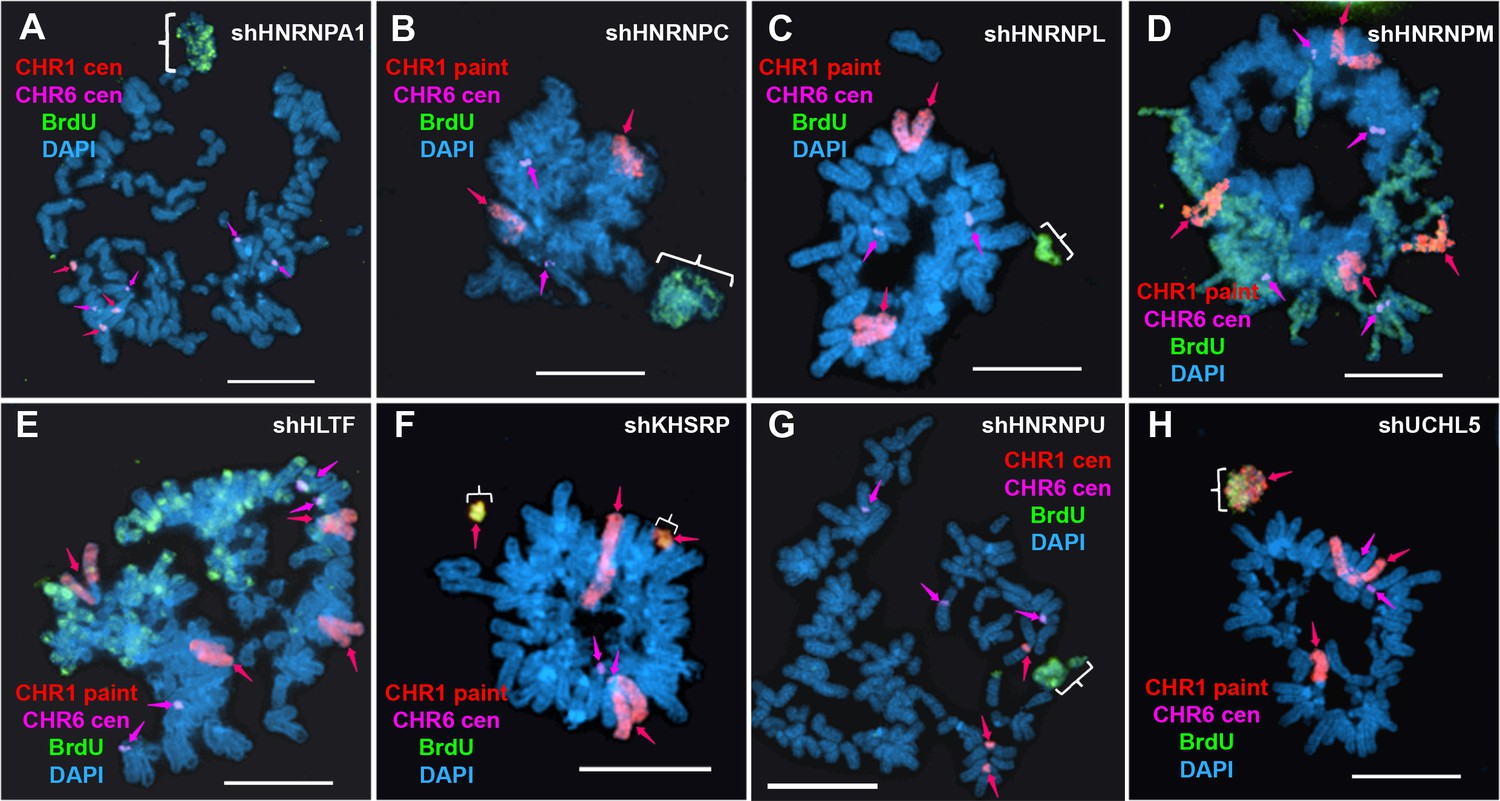
Replication timing alterations in shRNA depleted cells.
HTD114 cells were transfected with shRNA expression vectors for HNRNPA1 (A), HNRNPC (B), HNRNPL (C), HNRNPM (D), HLTF (E), KHSRP (F), HNRNPU (G), or UCHL5 (H), exposed to BrdU for 5 hr, harvested for mitotic cells, and processed for BrdU incorporation (green) and DNA FISH using a chromosome 1 centromeric probe (A and G; red, arrows) or chromosome 1 paint (B, C, D, E, F and H; red, arrows) plus a chromosome 6 centromeric probe (A-H; magenta, arrows). The brackets mark chromosomes with DRT/DMC. DNA was stained with DAPI, and scale bars are 10 µM.
Figure 7
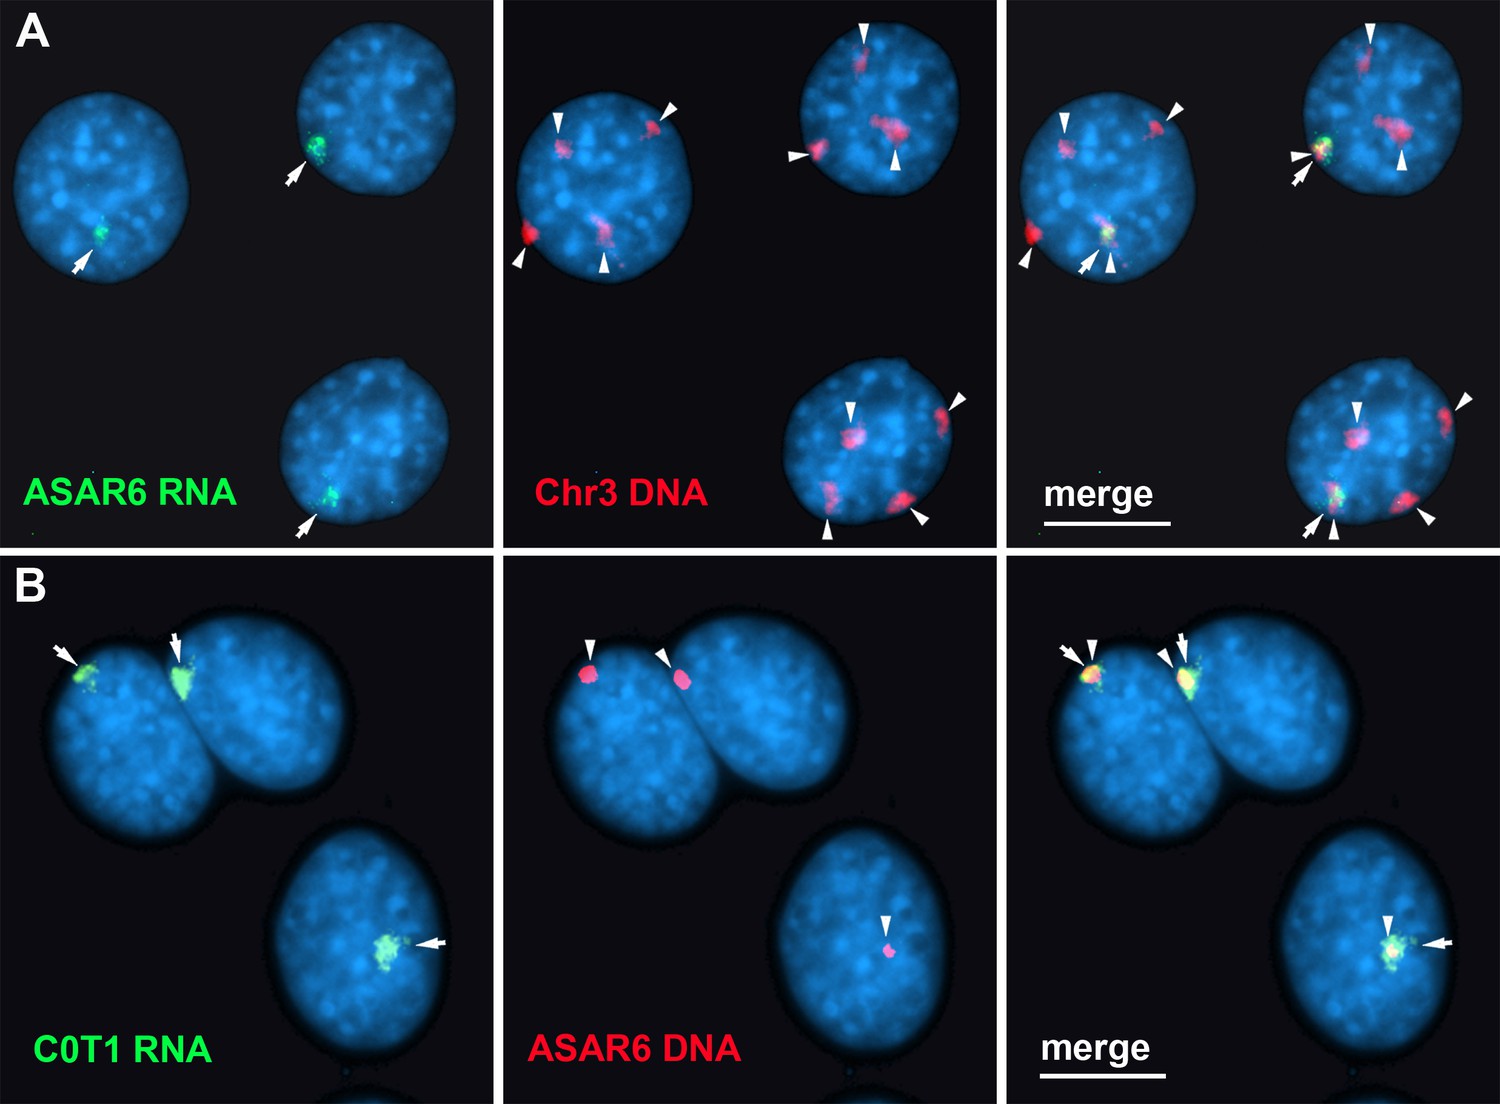
Human C0T-1 DNA detects ASAR6 RNA.
(A and B) RNA-DNA FISH on mouse cells containing an ASAR6 BAC transgene integrated into mouse chromosome 3 Donley et al., 2013. (A) RNA-DNA FISH using an ASAR6 fosmid probe to detect ASAR6 RNA (green; arrows) plus a mouse chromosome 3 paint probe to detect DNA (red; arrowheads). (B) RNA-DNA FISH using human C0T-1 DNA to detect RNA (green; arrows) plus the ASAR6 BAC (red arrowheads) to detect DNA.
Tables
Key resources table
| Reagent type (species) or resource | Designation | Source or reference | Identifiers | Additional information |
|---|---|---|---|---|
| Antibody | Anti-HLTF (rabbit polyclonal) | Sigma | RRID:AB_1857263 | 1:1000 |
| Antibody | Anti-HNRNPA1 (rabbit polyclonal) | Sigma | HPA004276 | 1:500 |
| Antibody | Anti-HNRNPC (rabbit polyclonal) | Sigma | RRID:AB_2681335 | 1:1000 |
| Antibody | Anti-HNRNPL (rabbit polyclonal) | Sigma | RRID:AB_2681588 | 1:500 |
| Antibody | Anti-HNRNPM (rabbit polyclonal) | Sigma | RRID:AB_1850879 | 1:2000 |
| Antibody | Anti-HNRNPU (rabbit polyclonal) | Sigma | RRID:AB_2683796 | 1:500 |
| Antibody | Anti-HNRNPUL1 (rabbit polyclonal) | Sigma | RRID:AB_2679616 | 1:1000 |
| Antibody | Anti-KHDRBS1 (rabbit polyclonal) | Sigma | RRID:AB_2681417 | 1:500 |
| Antibody | Anti-KHSRP (rabbit polyclonal) | Sigma | RRID:AB_10601582 | 1:500 |
| Antibody | Anti-PTPB1 (mouse monoclonal) | Invitrogen | RRID:AB_2533082 | 1:250 |
| Antibody | Anti-SAFB (rabbit polyclonal) | Sigma | RRID:AB_1850622 | 1:500 |
| Antibody | Anti-SAFB2 (rabbit polyclonal) | Sigma | RRID:AB_2681266 | 1:500 |
| Antibody | Anti-UCHL5 (rabbit polyclonal) | Sigma | RRID:AB_1858585 | 1:2000 |
| Antibody | Anti-alpha-tubulin (mouse monoclonal) | Sigma | RRID:AB_2617116 | 1:10,000 |
| Antibody | Anti-BrdU FITC (mouse monoclonal) | Roche | RRID:AB_11042627 | 50 µg/ml |
| Antibody | Anti-mouse IgG, Dylight 680 (goat polyclonal) | Invitrogen | RRID:AB_1965956 | 1:10,000 |
| Antibody | Anti-mouse IgG, Dylight 650 (goat polyclonal) | Thermo Fisher | RRID:AB_10942301 | 1:10,000 |
| Antibody | Anti-rabbit IgG, Dylight 800 (goat polyclonal) | Thermo Fisher | RRID:AB_2556775 | 1:10,000 |
| Antibody | Anti-rabbit IgG, Alexa Fluor Pus 405 (goat polyclonal) | Invitrogen | RRID:AB_2890548 | 1:100 |
| Antibody | Anti-goat IgG, Alexa Fluor 594 (rat monoclonal) | Invitrogen | RRID:AB_2536080 | 1:100 |
| Recombinant DNA reagent | shRNA:HLTF (plasmid) | Sigma | TRCN0000272562 | |
| Recombinant DNA reagent | shRNA:HNRNPA1 (plasmid) | Sigma | TRCN0000006586 | |
| Recombinant DNA reagent | shRNA:HNRNPC (plasmid) | Sigma | TRCN0000006644 | |
| Recombinant DNA reagent | shRNA:HNRNPL (plasmid) | Sigma | TRCN0000017246 | |
| Recombinant DNA reagent | shRNA:HNRNPM (plasmid) | Sigma | TRCN0000314949 | |
| Recombinant DNA reagent | shRNA:HNRNPU (plasmid) | Sigma | TRCN0000350256 | |
| Recombinant DNA reagent | shRNA:HNRNPUL1 (plasmid) | Sigma | TRCN0000074732 | |
| Recombinant DNA reagent | shRNA:KHDRBS1 (plasmid) | Sigma | TRCN0000428104 | |
| Recombinant DNA reagent | shRNA:KHDRBS1 (plasmid) | Sigma | TRCN0000428752 | |
| Recombinant DNA reagent | shRNA:KHSRP (plasmid) | Sigma | TRCN0000013256 | |
| Recombinant DNA reagent | shRNA:PTBP1 (plasmid) | Sigma | TRCN0000231420 | |
| Recombinant DNA reagent | shRNA:SAFB (plasmid) | Sigma | TRCN000022099 | |
| Recombinant DNA reagent | shRNA:SAFB2 (plasmid) | Sigma | TRCN0000075057 | |
| Recombinant DNA reagent | shRNA:UCHL5 (plasmid) | Sigma | TRCN0000234907 |
Additional files
Download links
A two-part list of links to download the article, or parts of the article, in various formats.
Downloads (link to download the article as PDF)
Open citations (links to open the citations from this article in various online reference manager services)
Cite this article (links to download the citations from this article in formats compatible with various reference manager tools)
ASAR lncRNAs control DNA replication timing through interactions with multiple hnRNP/RNA binding proteins
eLife 13:RP95898.
https://doi.org/10.7554/eLife.95898.3


