Tribbles1 is host protective during in vivo mycobacterial infection
- The Bateson Centre, School of Medicine and Population Health, Faculty of Health, University of Sheffield, United Kingdom
- Division of Infection & Immunity, University College London, United Kingdom
Figures
Figure 1
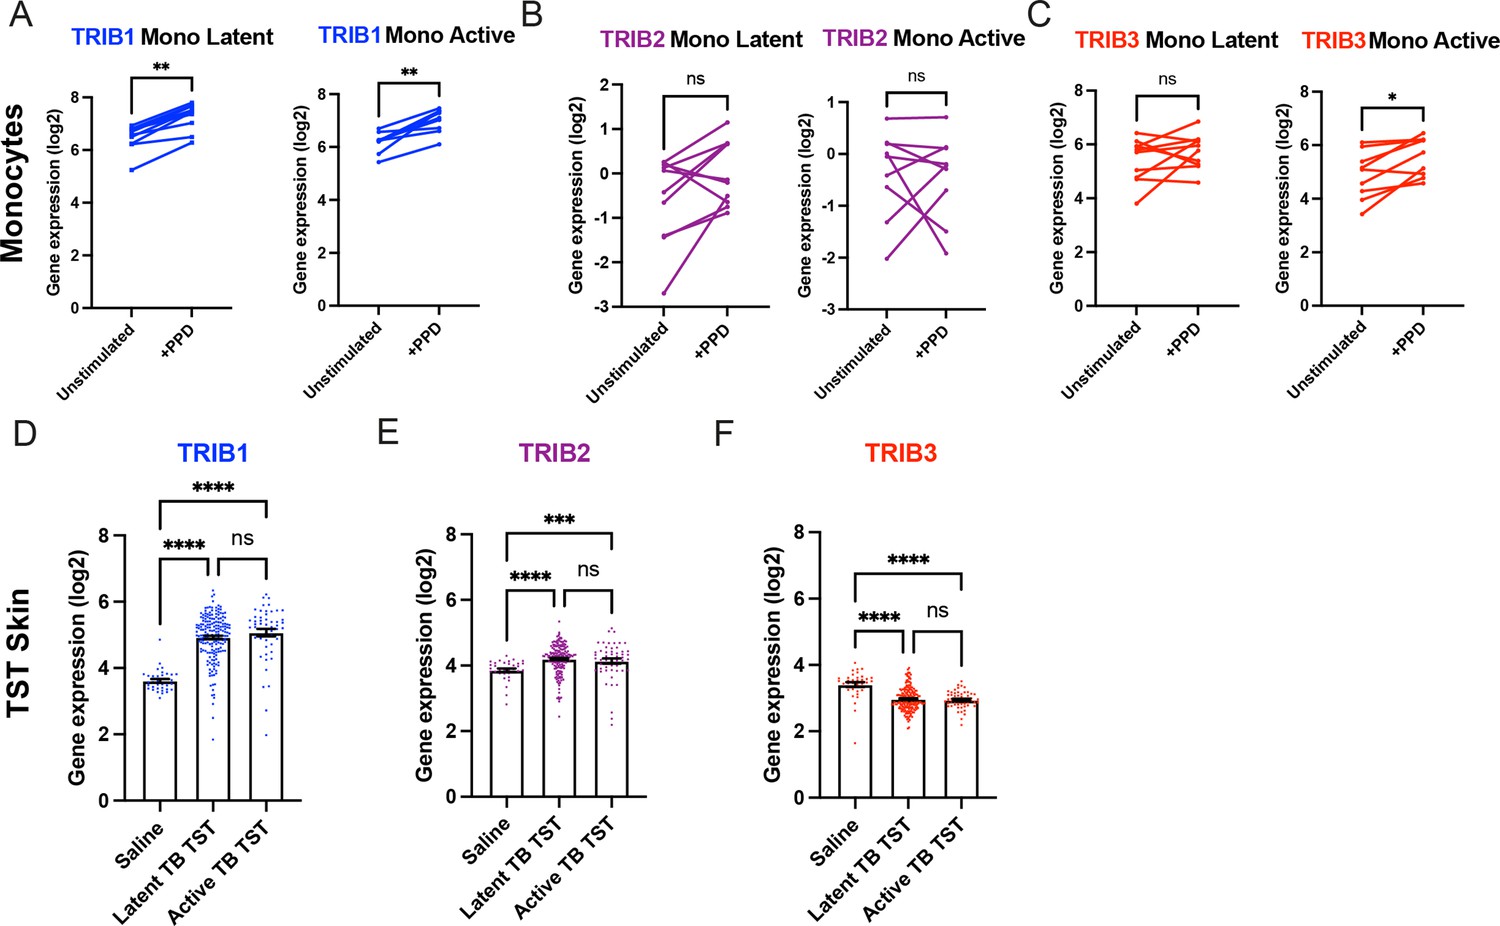
Expression of TRIB1 in human monocytes and tissues is elevated after mycobacterial antigen stimulation.
(A–C) Expression of TRIB1, TRIB2, and TRIB3 transcripts in human CD14+ monocytes in patients with active or latent TB before and after 4 hr of Mtb protein derivative (PPD) stimulation in vitro. Each paired data point represents one individual, with active or latent TB (n = 9 and n = 7, respectively). Statistical significance determined by paired Wilcoxon tests. p values shown are: *p < 0.05 and **p < 0.01. (D–F) Expression of TRIB1, TRIB2, and TRIB3 within in saline injected human skin and from biopsies of the site of a tuberculin skin test (TST) in patients with active or latent TB. Each point represents one individual with bars for each group representing mean gene expression. n = 48 and 191 individuals with active or latent TB, respectively. Statistical significance determined via Kruskal–Wallis with multiple comparisons. p values shown are: ***p < 0.001 and ****p < 0.0001.
-
Figure 1—source data 1
Numerical data for the graph of Figure 1A, left panel.
- https://cdn.elifesciences.org/articles/95980/elife-95980-fig1-data1-v1.zip
-
Figure 1—source data 2
Numerical data for the graph of Figure 1A, right panel.
- https://cdn.elifesciences.org/articles/95980/elife-95980-fig1-data2-v1.zip
-
Figure 1—source data 3
Numerical data for the graph of Figure 1B, left panel.
- https://cdn.elifesciences.org/articles/95980/elife-95980-fig1-data3-v1.zip
-
Figure 1—source data 4
Numerical data for the graph of Figure 1B, right panel.
- https://cdn.elifesciences.org/articles/95980/elife-95980-fig1-data4-v1.zip
-
Figure 1—source data 5
Numerical data for the graph of Figure 1C, left panel.
- https://cdn.elifesciences.org/articles/95980/elife-95980-fig1-data5-v1.zip
-
Figure 1—source data 6
Numerical data for the graph of Figure 1C, right panel.
- https://cdn.elifesciences.org/articles/95980/elife-95980-fig1-data6-v1.zip
-
Figure 1—source data 7
Numerical data for the graph of Figure 1D.
- https://cdn.elifesciences.org/articles/95980/elife-95980-fig1-data7-v1.zip
-
Figure 1—source data 8
Numerical data for the graph of Figure 1E.
- https://cdn.elifesciences.org/articles/95980/elife-95980-fig1-data8-v1.zip
-
Figure 1—source data 9
Numerical data for the graph of Figure 1F.
- https://cdn.elifesciences.org/articles/95980/elife-95980-fig1-data9-v1.zip
Figure 2
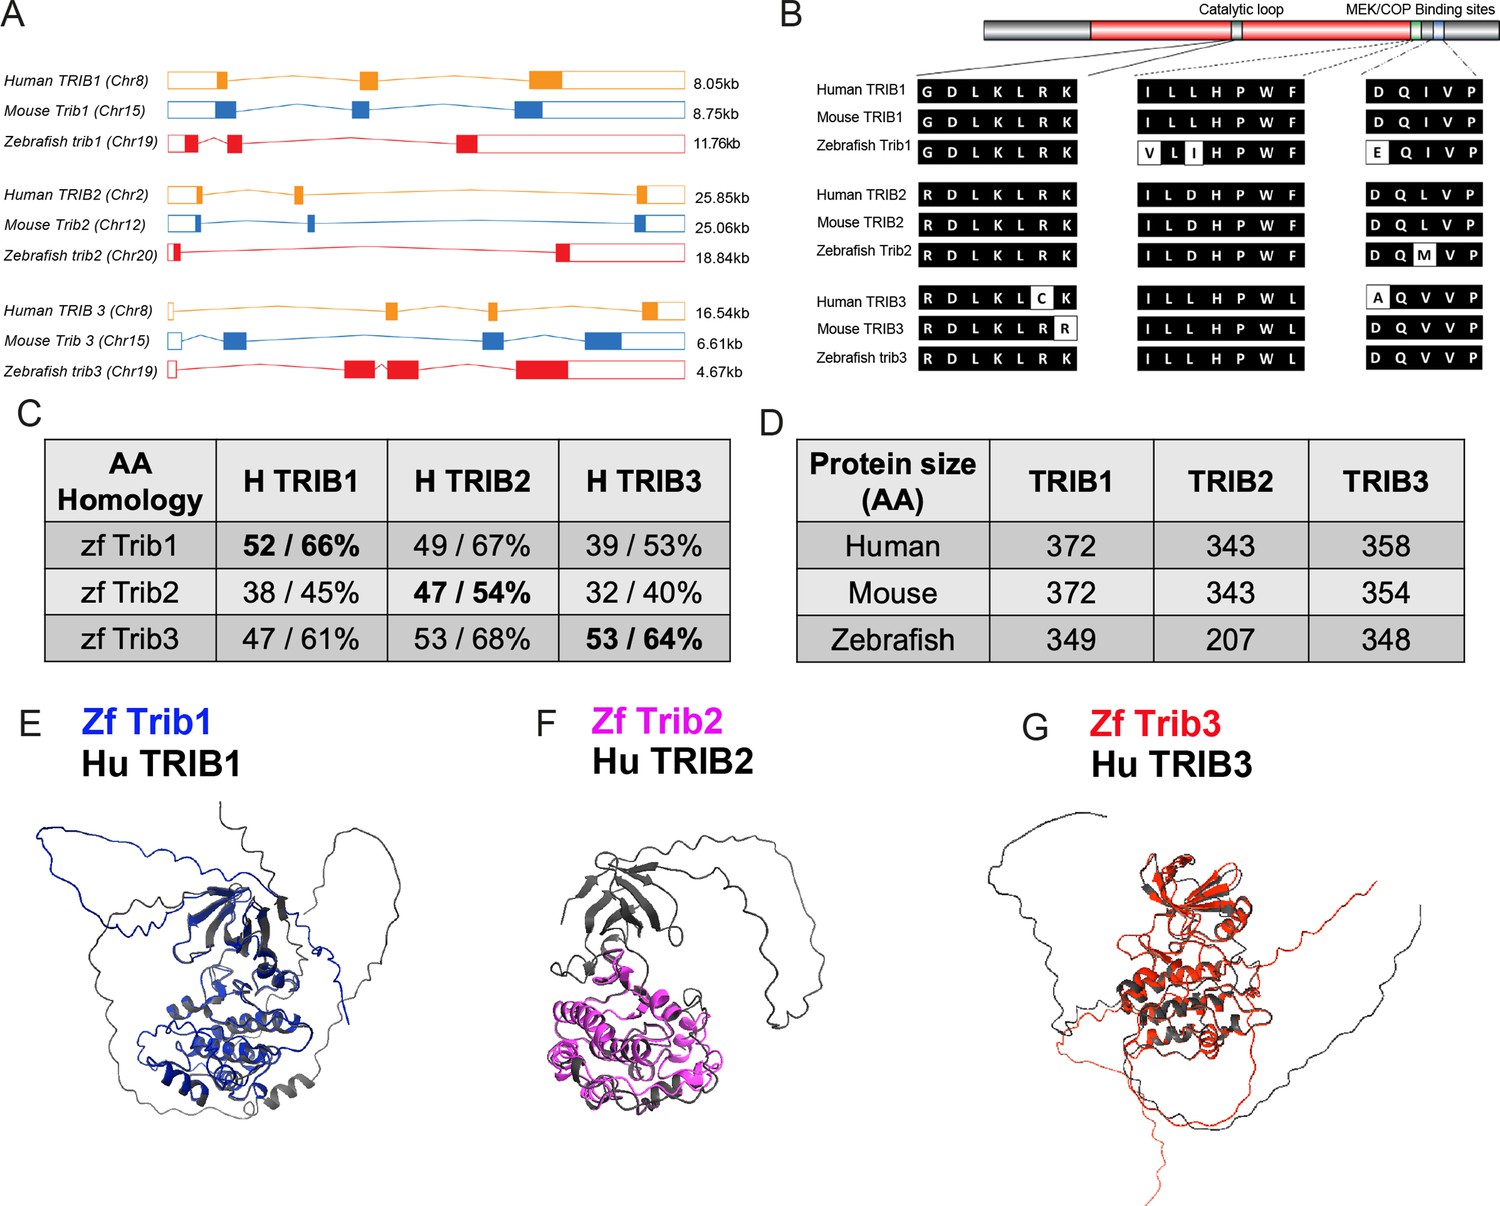
Zebrafish Tribbles share homology with their human and mice counterparts.
(A) The gene organisation of human (orange) TRIB1, mouse (blue) Trib1, and zebrafish (red). Exon maps produced from Ensembl database. Chromosome number location (chr) and transcript sizes in kilobases (kb) are shown. (B) Comparison of the three catalytic domains of Tribbles; the pseudokinase catalytic loop and mitogen-activated protein kinase kinase (MEK)/constitutive photomorphogenic 1 (COP1) bind sites, reveals high homology between species. (C) NCBI BLAST Global align revealed a high amino acid (AA) homology between zebrafish (zf) and human Tribbles protein sequences. Values described are positives/identities. (D) Protein sizes of the first and largest protein-coding transcript of each gene are depicted in the number of AA, values obtained from Ensembl and Uniprot databases. (E–G) Protein overlays of predicted structures (AlphaFold DB) of zebrafish (coloured) and human (black) sequences.
-
Figure 2—source data 1
ChimeraX (CXS) file for Figure 2E.
- https://cdn.elifesciences.org/articles/95980/elife-95980-fig2-data1-v1.zip
-
Figure 2—source data 2
ChimeraX (CXS) file for Figure 2F.
- https://cdn.elifesciences.org/articles/95980/elife-95980-fig2-data2-v1.zip
-
Figure 2—source data 3
ChimeraX (CXS) file for Figure 2G.
- https://cdn.elifesciences.org/articles/95980/elife-95980-fig2-data3-v1.zip
Figure 3
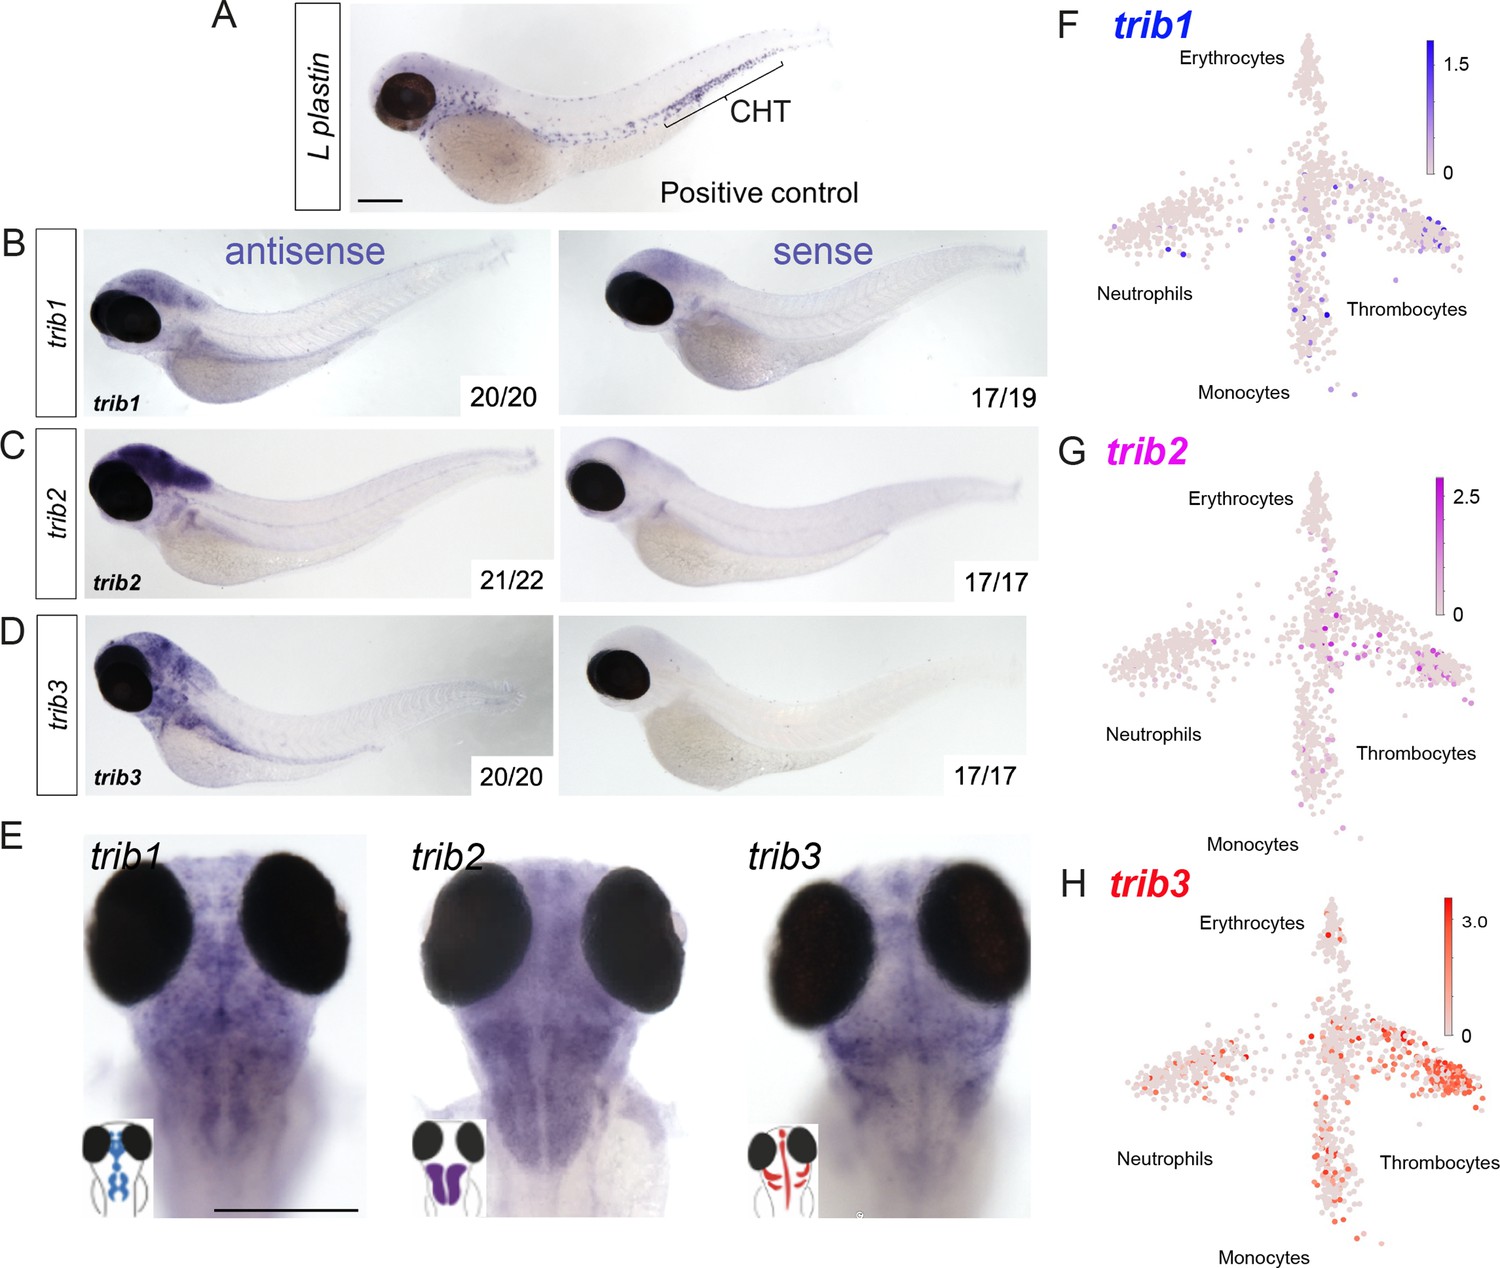
Expression of zebrafish tribbles are located in the brain in larvae and in immune cell subpopulations in adults.
(A) Whole-mount in situ hybridisation of the pan-leukocyte marker L-plastin was used as a positive control to stain leukocytes, present predominantly in the caudal hematopoietic tissue (CHT). Scale bar = 200 µm. (B) Representative images of antisense and sense (control) whole-mount in situ hybridisation of tribbles1. Numbers correspond to number of fish with depictured pattern out of total fish imaged. N = 19–20 fish. (C) Antisense and sense (control) whole-mount in situ hybridisation of tribbles2. N = 17–22 fish. (D) Antisense and sense (control) whole-mount in situ hybridisation of tribbles3. N = 17–20 fish. (E) Magnified dorsal views (×8 magnification) showing distinct expression of each trib isoform in the brain (representative images from each group shown). Scale bar = 200 µm. (F–H) Gene expression of adult zebrafish leukocytes determined using the Zebrafish Blood Atlas (Athanasiadis et al., 2017). Each point represents a separate scRNAseq sample (cell); replicates performed across multiple zebrafish wildtype and transgenic strains. Each arm of schematic indicates a separate blood cell population (labelled). Deeper colour indicates higher expression (log10 scale bars described for each gene).
Figure 4 with 3 supplements
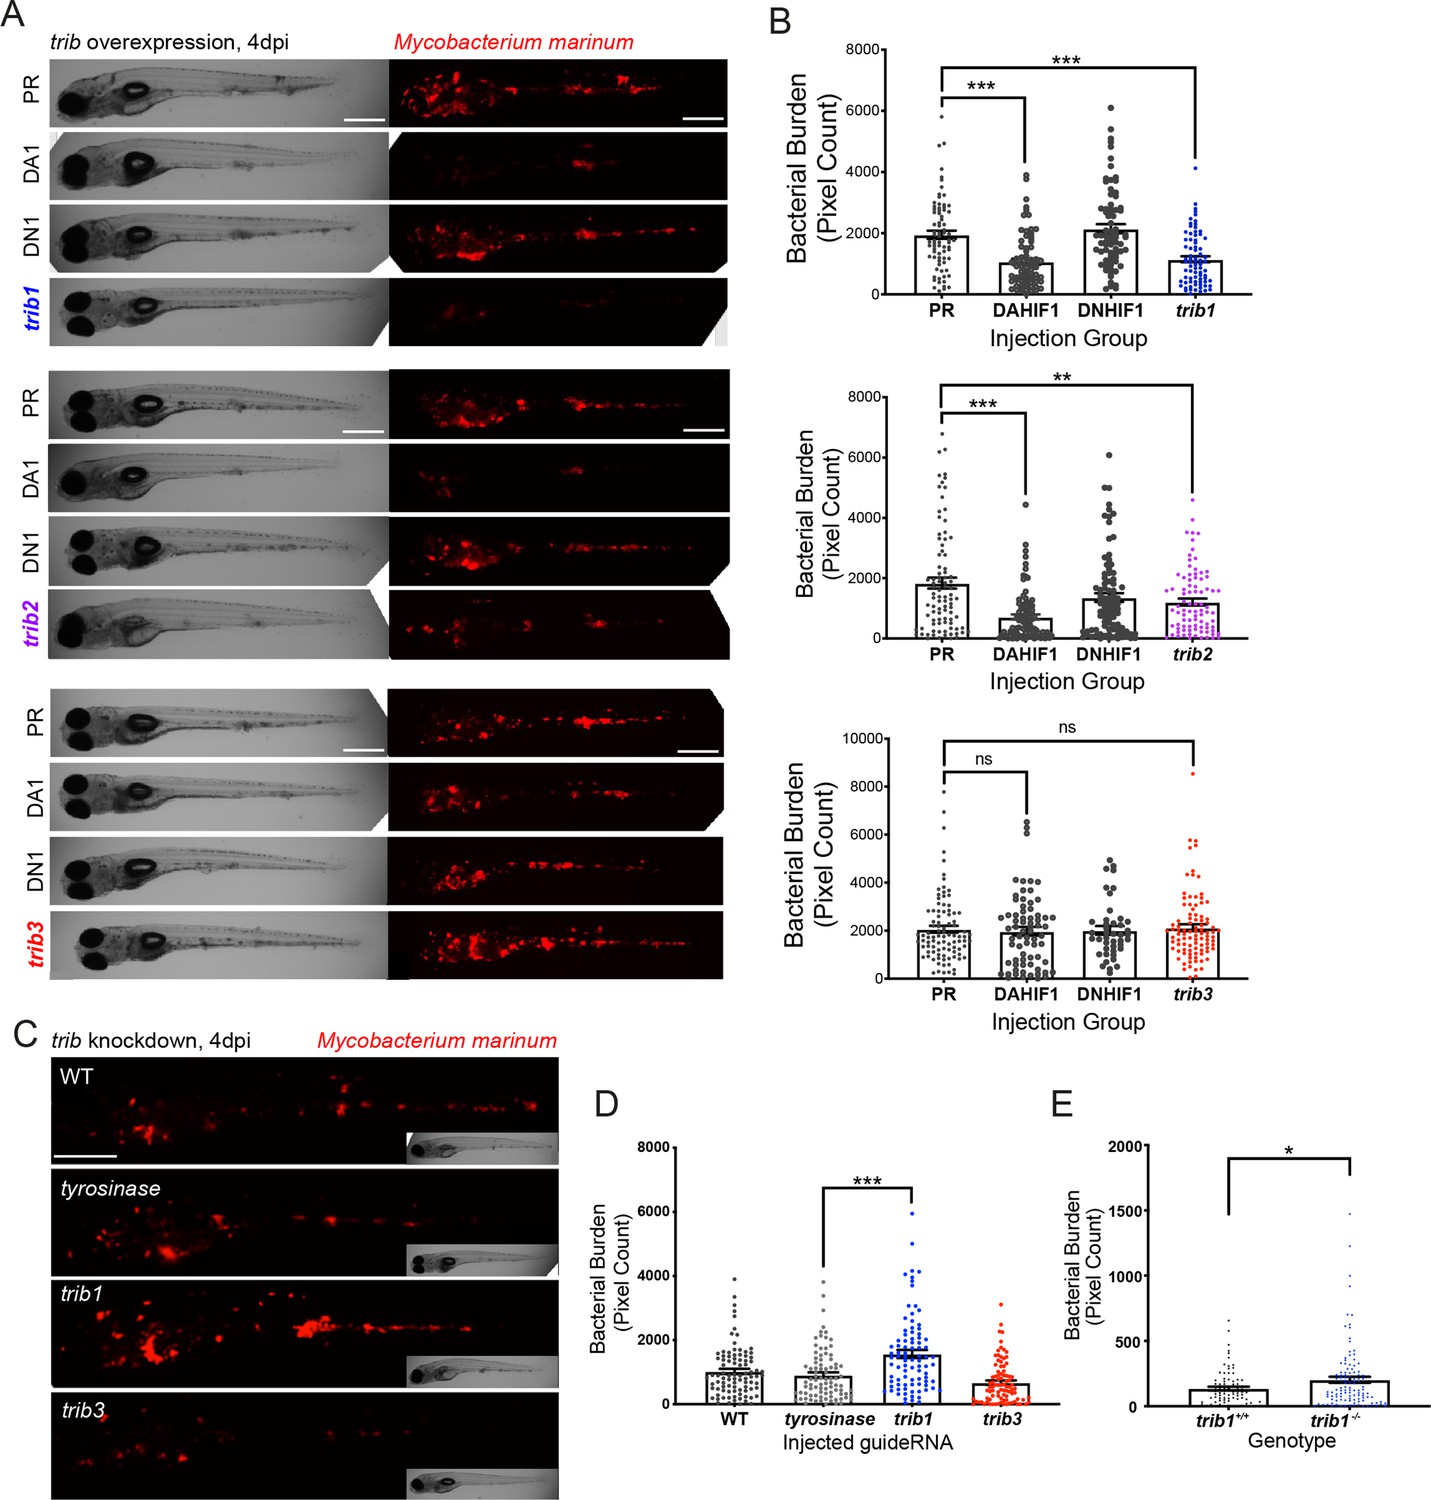
trib1 overexpression is host protective against Mm infection.
(A) Stereo-fluorescence micrographs of Mm mCherry infected 4 dpi larvae after injection at the single-cell stage with dominant active hif-1α (DA1), dominant negative hif-1α (DN1), trib1, trib2, trib3 RNAs and phenol red (PR) as a negative vehicle control. DA1 and DN1 are RNA controls with DA1 having previously been shown to reduce infection levels (Elks et al., 2013). Scale bar = 200 µm. (B) Bacterial burden of larvae shown in (A). Data shown are mean ± standard error of the mean (SEM), n = 76–77 in trib1, n = 86–89 in trib2, and n = 43–95 in trib3, accumulated from three independent experiments for each trib gene. Statistical significance determined via one-way analysis of variance (ANOVA) with Bonferroni’s multiple comparisons. p values shown are: **p < 0.01 and ***p < 0.001. (C) Stereo-fluorescence micrographs of Mm mCherry infected 4 dpi larvae after injection with tyrosinase (control), trib1 and trib3 CRISPR guides (CRISPants). Scale bar = 200 µm. (D) Bacterial burden of larvae shown in (C). Data shown are mean ± SEM, n = 87–90 fish accumulated from three independent experiments. Statistical significance determined via one-way ANOVA with Bonferroni’s multiple comparisons. p values shown are: ***p < 0.001. (E) Bacterial burden of trib1−/− stable knockout larvae compared to wildtype (trib1+/+) siblings. Data shown are mean ± SEM, n = 82–114 fish accumulated from four independent experiments. Statistical significance determined via an unpaired t-test. p values shown are: *p < 0.05.
-
Figure 4—source data 1
Numerical data for the graph of Figure 4B trib1.
- https://cdn.elifesciences.org/articles/95980/elife-95980-fig4-data1-v1.zip
-
Figure 4—source data 2
Numerical data for the graph of Figure 4B trib2.
- https://cdn.elifesciences.org/articles/95980/elife-95980-fig4-data2-v1.zip
-
Figure 4—source data 3
Numerical data for the graph of Figure 4B trib2.
- https://cdn.elifesciences.org/articles/95980/elife-95980-fig4-data3-v1.zip
-
Figure 4—source data 4
Numerical data for the graph of Figure 4D.
- https://cdn.elifesciences.org/articles/95980/elife-95980-fig4-data4-v1.zip
-
Figure 4—source data 5
Numerical data for the graph of Figure 4E.
- https://cdn.elifesciences.org/articles/95980/elife-95980-fig4-data5-v1.zip
Figure 4—figure supplement 1
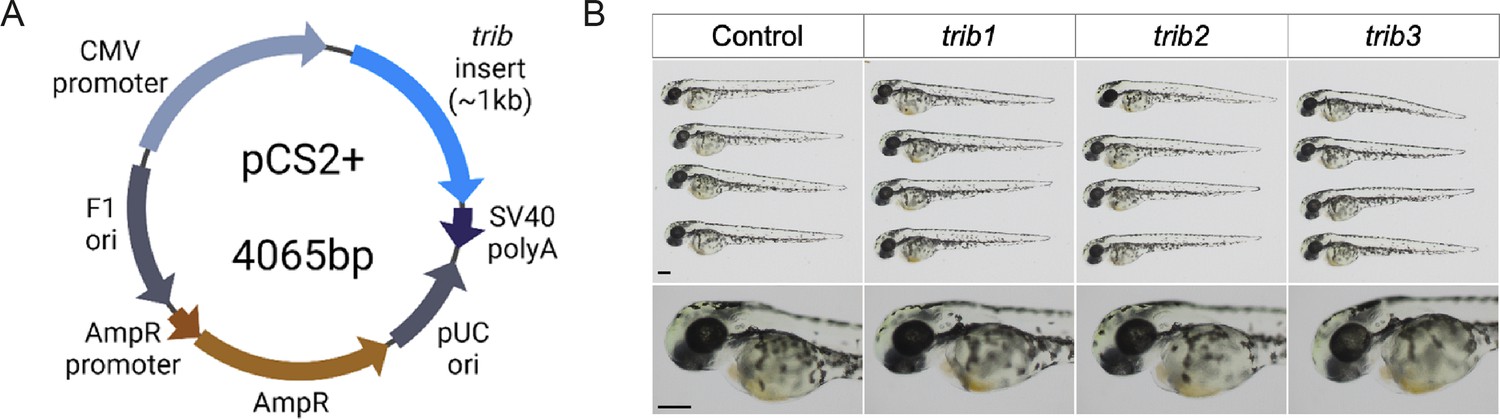
tribbles RNA overexpression caused no observable developmental defects.
(A) cDNA sequences of zebrafish trib isoforms (trib1, trib2, and trib3) were cloned into the expression plasmid pCS2+. (B) mRNA of trib isoforms (100 ng/μl) was synthesised from pCS2+ plasmids and 1 nl was injected into one-cell stage zebrafish embryos, which resulted in healthy development. Larvae imaged at 2 dpf using stereoscope at ×4 magnification (head images at ×8 magnification). Scale bars = 100 µM.
Figure 4—figure supplement 2
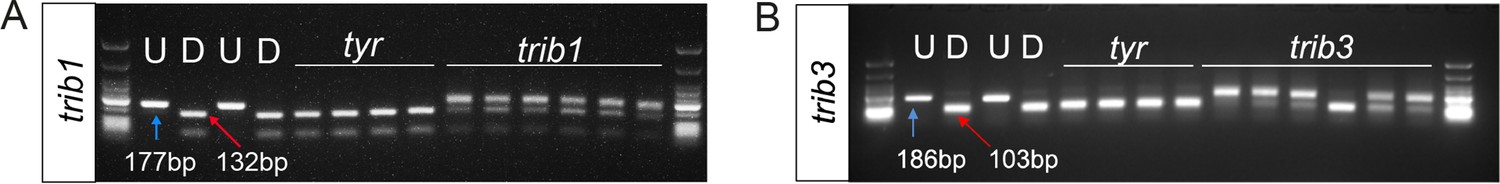
CRISPR guide RNAs against trib1 and trib3 efficiently disrupt a restriction digest site.
(A) Electrophoresis gel of larvae injected with trib1 guide RNA with a SacII restriction digest. The undigested DNA band, obtained using the polymerase chain reaction (PCR), is 177 bp and the successfully digested band is 132 bp. Two uninjected fish were used as controls without (U) and with (D) digestion. Four tyrosinase (tyr) control guide injected larvae had conserved SacII sites while 6/6 trib1 larvae did not digest with SacII indicating a genomic disruption at the CRISPR PAM site. First and last lanes of gel images contain Low Molecular Weight DNA Ladder (New England Biolabs, N3233) for reference. (B) Electrophoresis gel of larvae injected with trib3 guide RNA with a MwoI restriction digest. The undigested PCR band is 186 bp and the successfully digested band is 103 bp. Two uninjected fish were used as controls without (U) and with (D) digestion. Four tyrosinase (tyr) guide injected larvae had conserved MwoI sites while 5/6 trib3 larvae did not digest with MwoI indicating a genomic disruption at the CRISPR PAM site. First and last lanes of gel images contain NEB Low Molecular Weight ladder for reference.
-
Figure 4—figure supplement 2—source data 1
Raw unedited gel image of Figure 4—figure supplement 2A.
- https://cdn.elifesciences.org/articles/95980/elife-95980-fig4-figsupp2-data1-v1.pdf
-
Figure 4—figure supplement 2—source data 2
PDF containing Figure 4—figure supplement 2A and the original gel image with highlighted bands and samples labels.
- https://cdn.elifesciences.org/articles/95980/elife-95980-fig4-figsupp2-data2-v1.pdf
-
Figure 4—figure supplement 2—source data 3
Raw unedited gel image of Figure 4—figure supplement 2B.
- https://cdn.elifesciences.org/articles/95980/elife-95980-fig4-figsupp2-data3-v1.pdf
-
Figure 4—figure supplement 2—source data 4
PDF containing Figure 4—figure supplement 2B and the original gel image with highlighted bands and samples labels.
- https://cdn.elifesciences.org/articles/95980/elife-95980-fig4-figsupp2-data4-v1.pdf
Figure 4—figure supplement 3
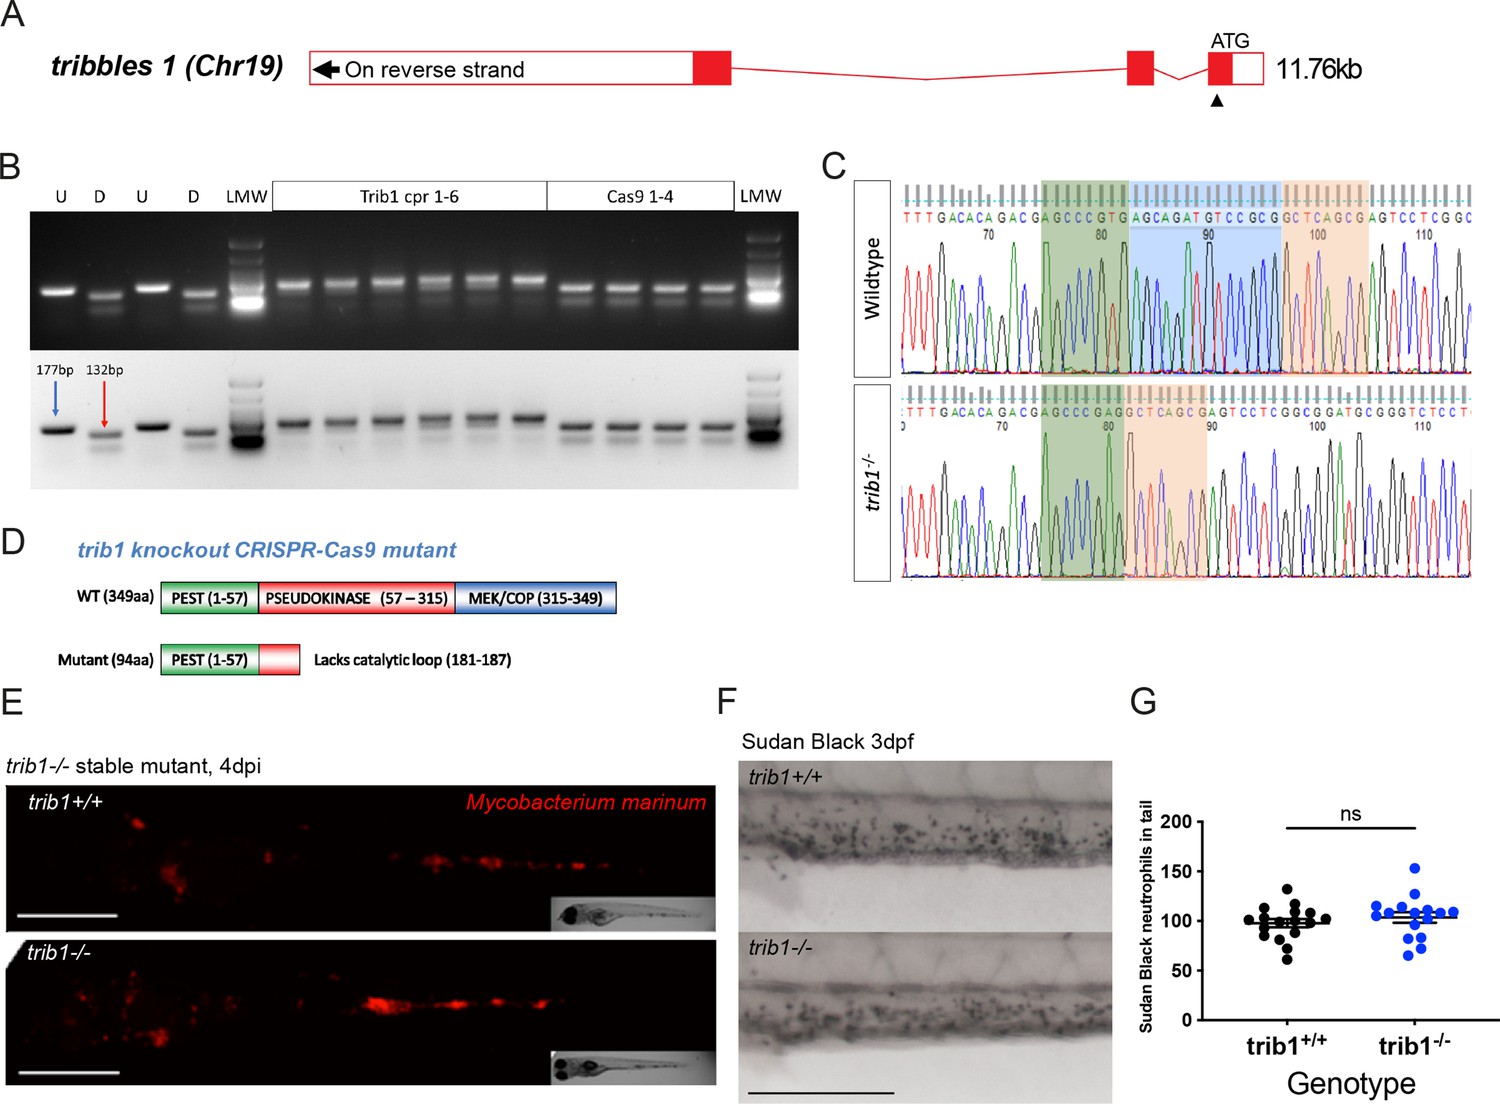
Generation of a tribbles1 stable mutant line.
(A) Schematic of zebrafish trib1 gene exons, with arrowhead showing location of CRISPR guide RNA PAM site in exon 1. (B) Electrophoresis gel of larvae injected with trib1 guide RNA with a SacII restriction digest. The undigested PCR band is 177 bp and the successfully digested band is 132 bp. Two uninjected fish were used as controls without (U) and with (D) digestion. Four cas9 only injected larvae had conserved SacII sites while 6/6 trib1 larvae did not digest with SacII indicating a genomic disruption at the CRISPR PAM site. LMW = NEB Low Molecular Weight ladder for reference. (C) Sequencing trace of a trib1−/− mutant versus a wildtype sibling, demonstrating a 14-bp deletion (loss of AGCAGATGTCCGCG). (D) Schematic showing predicted truncated protein (Δ94aa) caused by trib1−/− mutation compared to the wildtype protein. (E) Stereo-fluorescence micrographs of Mm mCherry infected 4 dpi trib1−/− mutant and wildtype (trib1+/+) sibling larvae. Scale bar = 200 µM. (F) Sudan Black staining of neutrophils in 3 dpf trib1−/− mutant and wildtype (trib1+/+) sibling larvae. Scale bar = 200 µM. (G) Number of Sudan Black-positive neutrophils in the tail of 3 dpf trib1−/− mutant and wildtype (trib1+/+) sibling larvae. Data shown are mean ± standard error of the mean (SEM), n = 16–17 fish accumulated from two independent experiments. Statistical significance (no significance, ns) determined via an unpaired t-test.
-
Figure 4—figure supplement 3—source data 1
Raw unedited gel image of Figure 4—figure supplement 3B.
- https://cdn.elifesciences.org/articles/95980/elife-95980-fig4-figsupp3-data1-v1.pdf
-
Figure 4—figure supplement 3—source data 2
PDF containing Figure 4—figure supplement 3B and the original gel image with highlighted bands and samples labels.
- https://cdn.elifesciences.org/articles/95980/elife-95980-fig4-figsupp3-data2-v1.pdf
-
Figure 4—figure supplement 3—source data 3
Numerical data for the graph of Figure 4—figure supplement 3G.
- https://cdn.elifesciences.org/articles/95980/elife-95980-fig4-figsupp3-data3-v1.csv
Figure 5
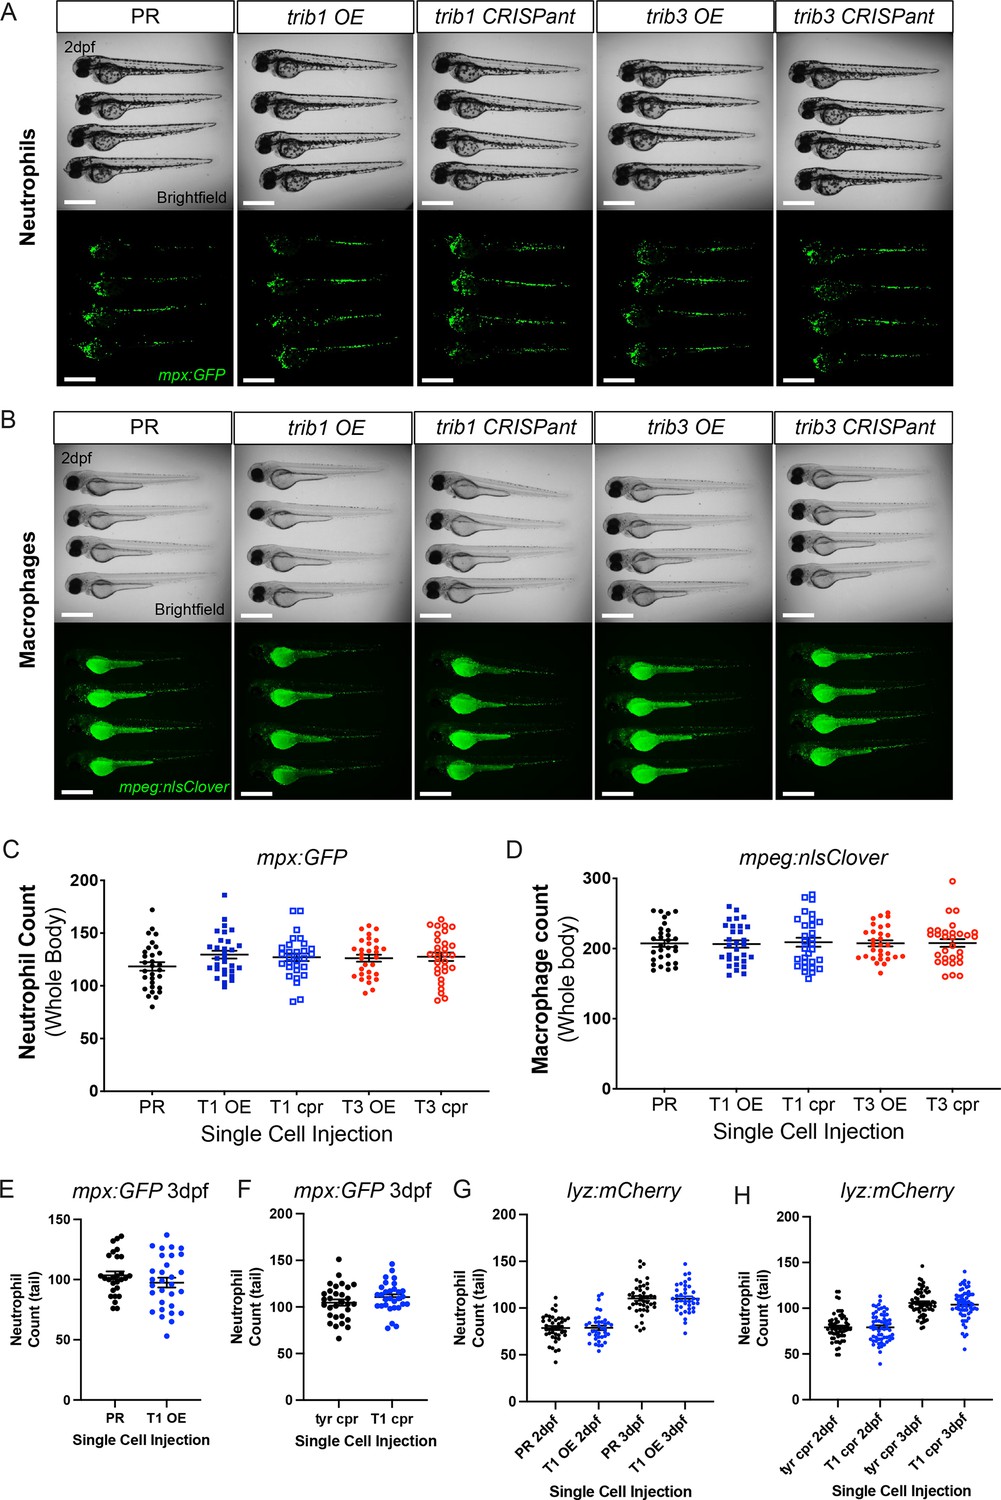
trib manipulation does not affect leukocyte number in zebrafish larvae.
(A) Example brightfield and fluorescent micrographs of neutrophils (Tg(mpx:GFP)i114) in four 2 dpf larvae injected at the one-cell stage with either phenol red (PR), trib1 RNA overexpression (OE), trib1 CRISPant, trib3 RNA overexpression (OE), or trib3 CRISPant. Scale bars = 200 µM. (B) Example brightfield and fluorescent micrographs of macrophages (Tg(mpeg:nlsclover)sh436) in four 2 dpf larvae injected at the one-cell stage with either PR, trib1 RNA overexpression (OE), trib1 CRISPant, trib3 RNA overexpression (OE), or trib3 CRISPant. Scale bars = 200 µM. (C) Wholebody neutrophil numbers (Tg(mpx:GFP)i114) in 2 dpf larvae injected at the one-cell stage with either PR, trib1 RNA overexpression (T1 OE), trib1 CRISPant (T1 cpr), trib3 RNA overexpression (T3 OE), or trib3 CRISPant (T3 cpr). Data shown are mean ± standard error of the mean (SEM), n = 30 fish per group. (D) Wholebody macrophage numbers (Tg(mpeg:nlsclover)sh436) in 2 dpf larvae injected at the one-cell stage with either PR, trib1 RNA overexpression (T1 OE), trib1 CRISPant (T1 cpr), trib3 RNA overexpression (T3 OE), or trib3 CRISPant (T3 cpr). Data shown are mean ± SEM, n = 30 fish per group. (E) Total tail neutrophil numbers (Tg(mpx:GFP)i114) in 3 dpf larvae injected at the one-cell stage with either PR or trib1 RNA overexpression (T1 OE). Data shown are mean ± SEM, n = 30 fish per group. (F) Total tail neutrophil numbers (Tg(mpx:GFP)i114) in 3 dpf larvae injected at the one-cell stage with either tyrosinase control CRISPant (tyr cpr) or trib1 CRISPant (T1 cpr). Data shown are mean ± SEM, n = 30 fish per group. (G) Total tail neutrophil numbers (Tg(lyz: nfsB.mCherry)sh260) in 2 and 3 dpf larvae injected at the one-cell stage with either PR or trib1 RNA overexpression (T1 OE). Data shown are mean ± SEM, n = 37–42 fish per group. (H) Total tail neutrophil numbers (Tg(lyz: nfsB.mCherry)sh260) in 2 and 3 dpf larvae injected at the one-cell stage with either tyrosinase control CRISPant (tyr cpr) or trib1 CRISPant (T1 cpr). Data shown are mean ± SEM, n = 60 fish per group.
-
Figure 5—source data 1
Numerical data for the graph of Figure 5C.
- https://cdn.elifesciences.org/articles/95980/elife-95980-fig5-data1-v1.zip
-
Figure 5—source data 2
Numerical data for the graph of Figure 5D.
- https://cdn.elifesciences.org/articles/95980/elife-95980-fig5-data2-v1.zip
-
Figure 5—source data 3
Numerical data for the graph of Figure 5E.
- https://cdn.elifesciences.org/articles/95980/elife-95980-fig5-data3-v1.zip
-
Figure 5—source data 4
Numerical data for the graph of Figure 5F.
- https://cdn.elifesciences.org/articles/95980/elife-95980-fig5-data4-v1.zip
-
Figure 5—source data 5
Numerical data for the graph of Figure 5G.
- https://cdn.elifesciences.org/articles/95980/elife-95980-fig5-data5-v1.zip
-
Figure 5—source data 6
Numerical data for the graph of Figure 5H.
- https://cdn.elifesciences.org/articles/95980/elife-95980-fig5-data6-v1.zip
Figure 6
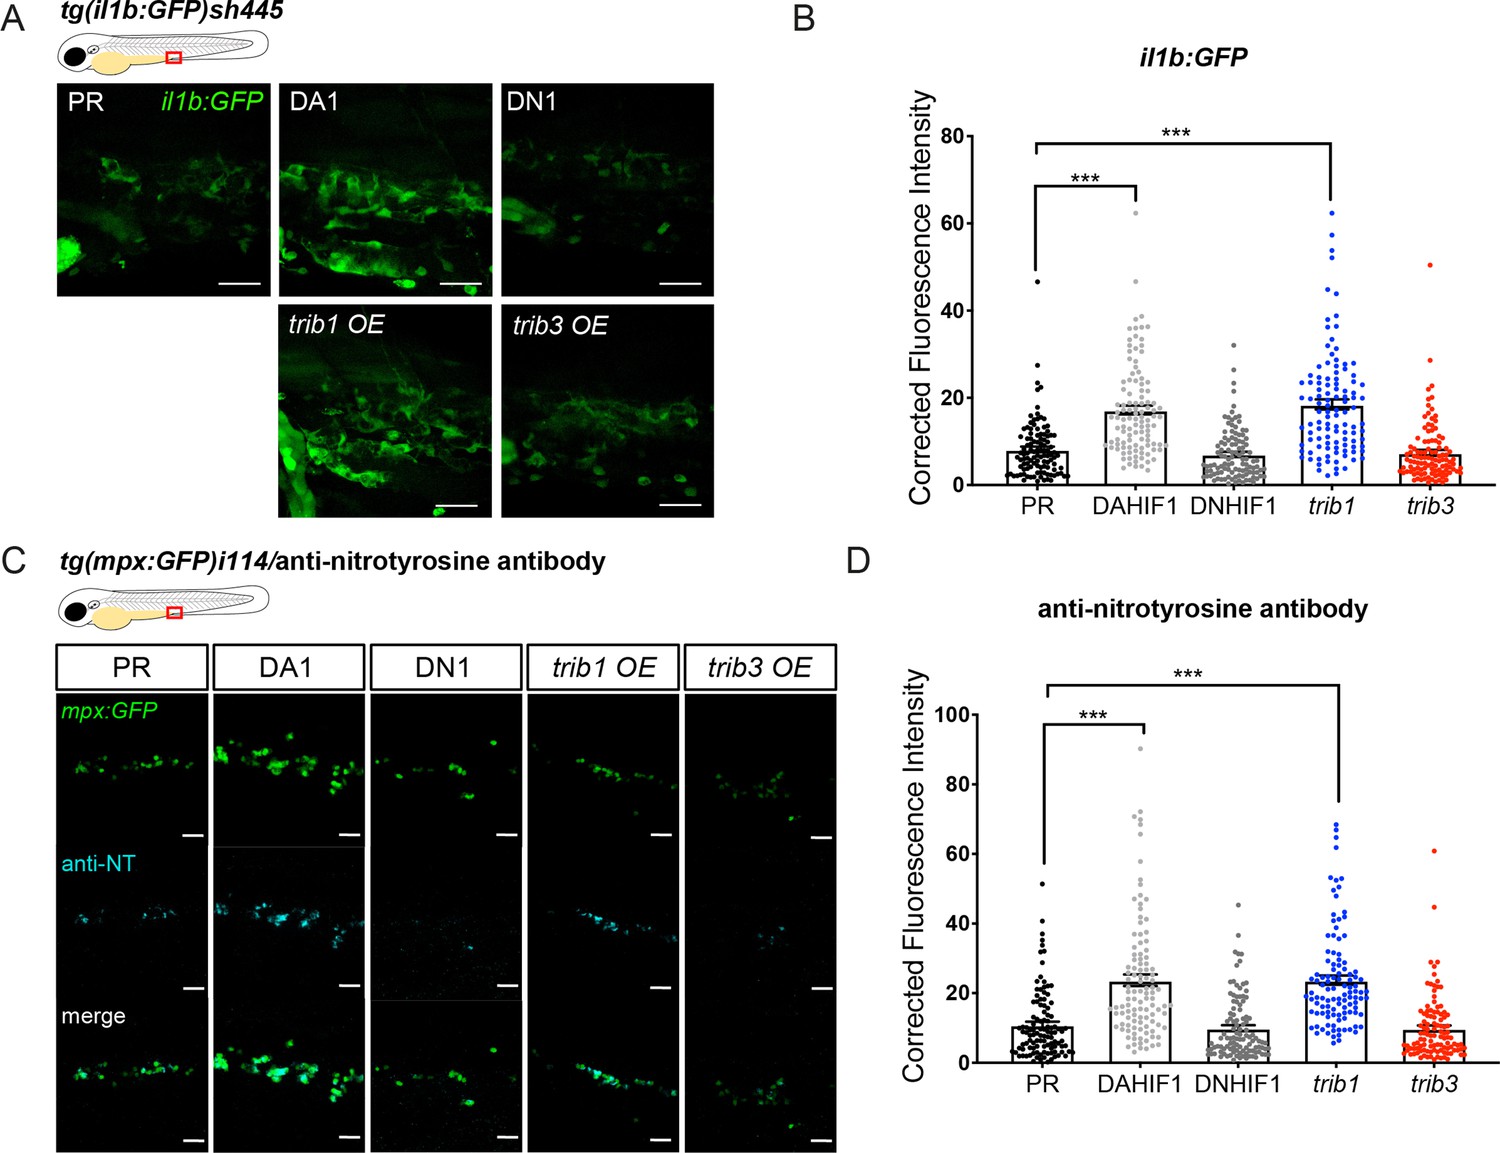
trib1 overexpression increases production of proinflammatory il-1β and nitrotyrosine in the absence of infection.
(A) Fluorescent confocal micrographs of 2 dpf caudal vein region of TgBAC(il-1β:eGFP)sh445 transgenic larvae. il-1β:GFP expression was detected by GFP levels. Larvae were injected at the one-cell stage with dominant negative (DN) or dominant active (DA) Hif-1α or phenol red (PR) controls and trib1 and trib3 test RNAs. Scale bars = 25 μm. (B) Corrected fluorescence intensity levels of il-1β:GFP confocal z-stacks in uninfected larvae at 2 dpf of data shown in (A). Dominant active Hif-1α (DA1) controls and trib1 fish had significantly increased il-1β:GFP levels in the absence of Mm bacterial challenge compared to PR and dominant negative Hif-1α (DN1) injected controls and trib3 RNA injected embryos. Data shown are mean ± standard error of the mean (SEM), n = 108 cells from 18 embryos accumulated from 3 independent experiments. Statistical significance was determined using one-way analysis of variance (ANOVA) with Bonferroni’s multiple comparisons post hoc test. p values shown are: ***p < 0.001. (C) Fluorescence confocal z-stacks of the caudal vein region of 2 dpf mpx:GFP larvae (neutrophils) immune labelled with anti-nitrotyrosine (cyan) in the absence of Mm infection. Larvae were injected at the one-cell stage with dominant negative (DN) or dominant active (DA) Hif-1α or PR controls and trib1 and trib3 test RNAs. Scale bars = 25 μm. (D) Corrected fluorescence intensity levels of anti-nitrotyrosine antibody confocal z-stacks shown in (C). Data shown are mean ± SEM, n = 108 cells from 18 embryos accumulated from 3 independent experiments. Statistical significance was determined using one-way ANOVA with Bonferroni’s multiple comparisons post hoc test. p values shown are: ***p < 0.001.
-
Figure 6—source data 1
Numerical data for the graph of Figure 6B.
- https://cdn.elifesciences.org/articles/95980/elife-95980-fig6-data1-v1.zip
-
Figure 6—source data 2
Numerical data for the graph of Figure 6D.
- https://cdn.elifesciences.org/articles/95980/elife-95980-fig6-data2-v1.zip
Figure 7
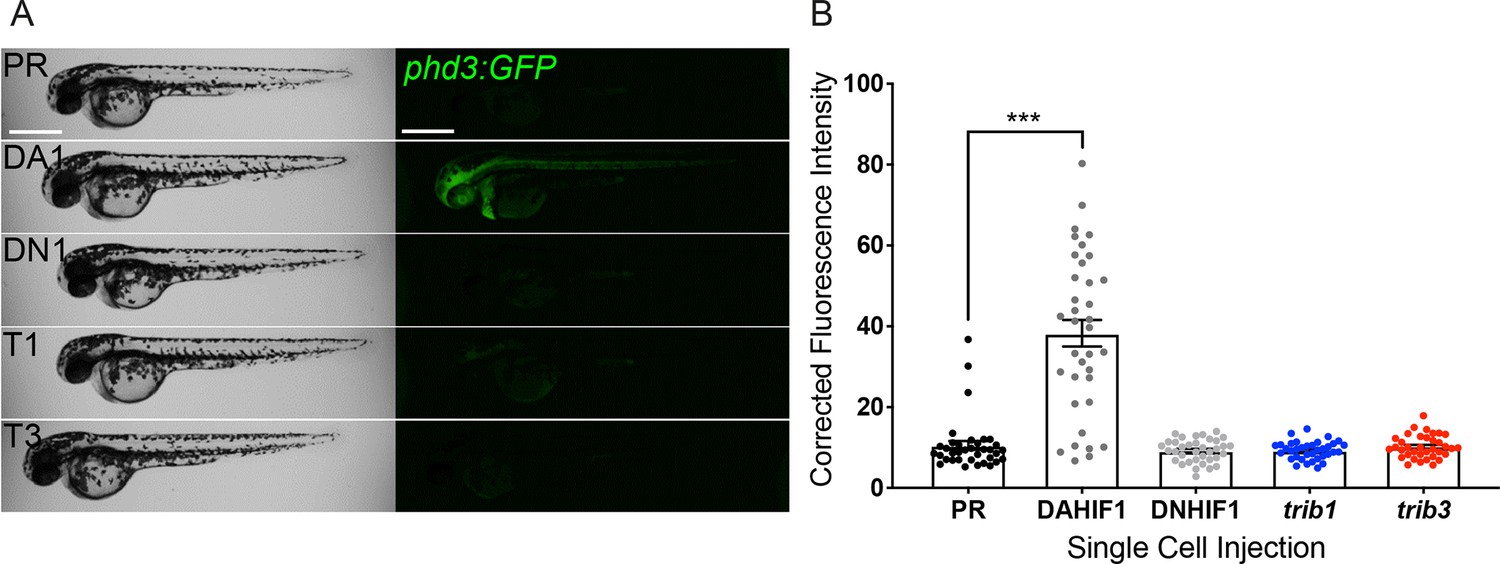
trib1 and trib3 overexpression do not induce expression of the Hif reporter phd3:GFP.
(A) Stereo-fluorescence micrographs of 2 dpf phd3:GFP larvae injected with phenol red (PR), dominant active hif-1α (DA1) and dominant negative Hif-1α (DN1) RNA controls alongside trib1 (T1) and trib3 (T3) RNA. Scale bars = 200 µM. (B) Corrected fluorescence intensity levels of phd3:GFP (Hif reporter) larvae shown in (A). Data shown are mean ± standard error of the mean (SEM), n = 30 embryos accumulated from three independent experiments. Statistical significance determined through one-way analysis of variance (ANOVA) with multiple comparisons. p values shown are: ***p < 0.001.
Figure 8 with 1 supplement
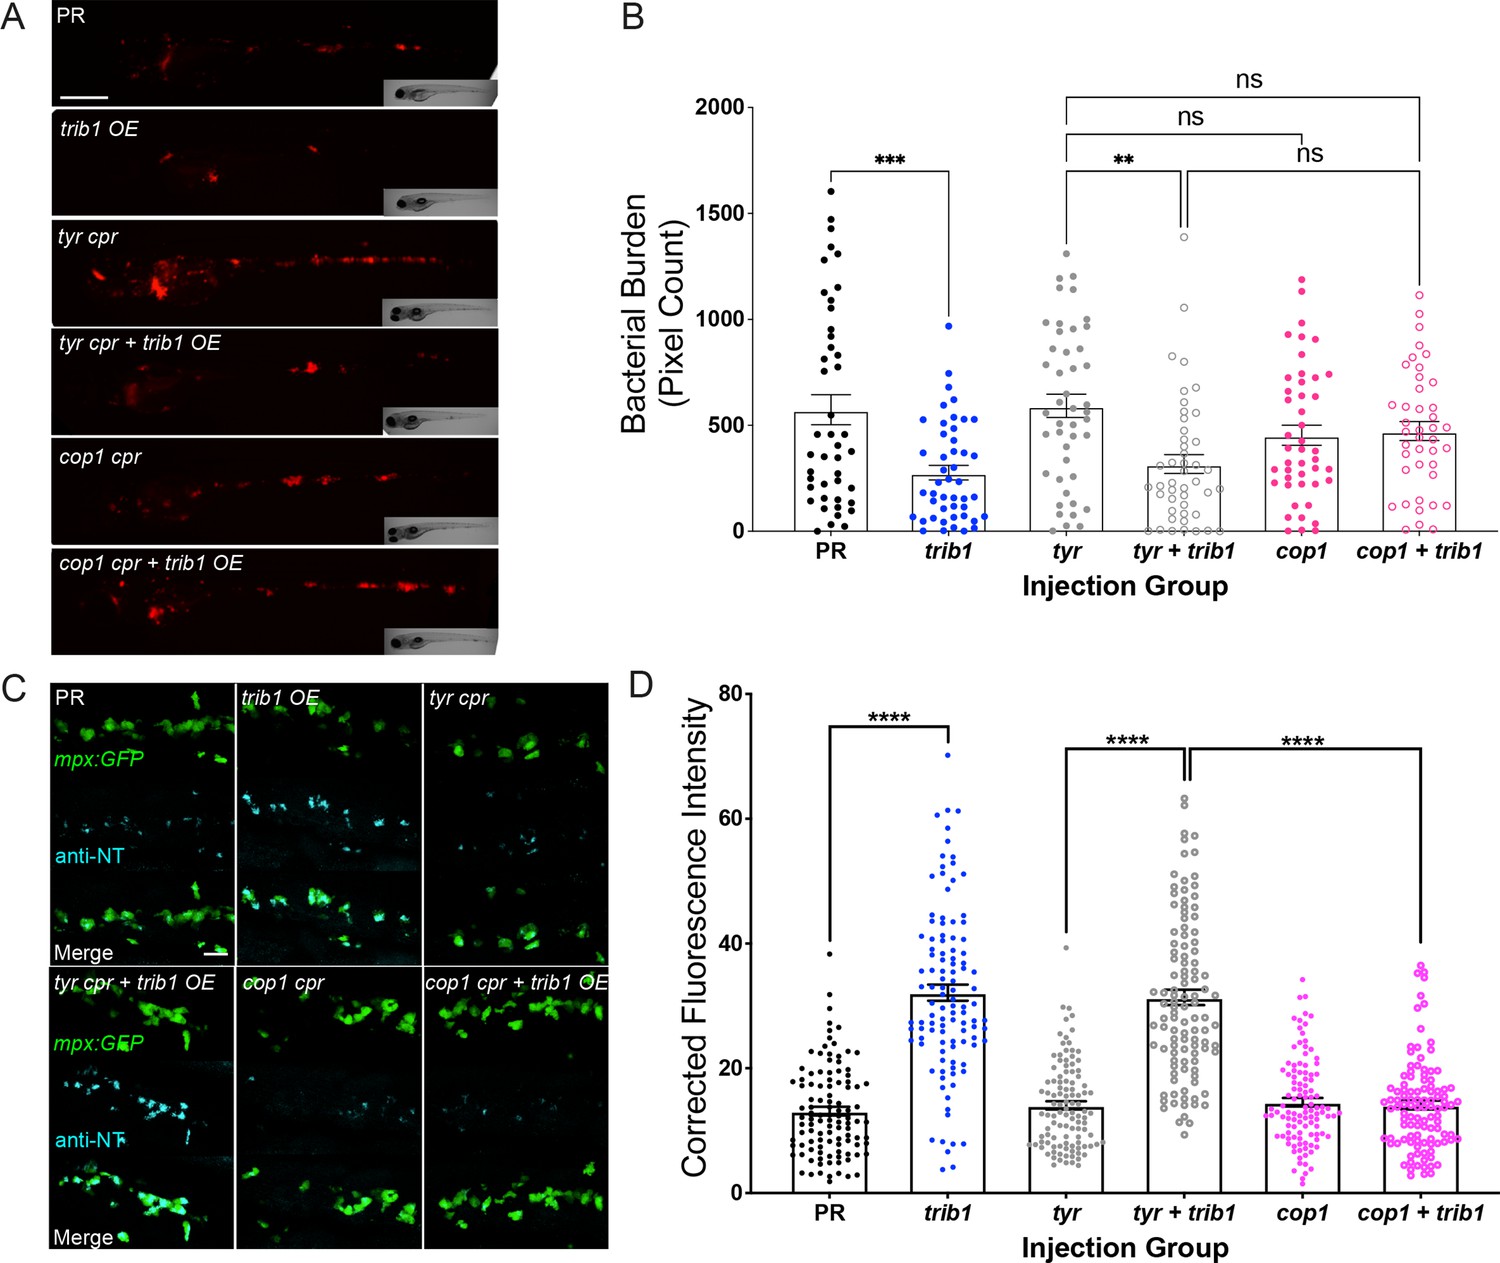
The host-protective effect of trib1 overexpression requires cop1.
(A) Stereo-fluorescence micrographs of Mm mCherry infected 4 dpi larvae after injection with trib1 RNA (overexpression, OE) and cop1 guide RNA (CRISPants, cpr) using phenol red (PR, vehicle) and tyrosinase (tyr cpr, unrelated guide RNA) CRISPants as negative controls. Scale bar = 200 µM. (B) Bacterial burden of larvae shown in (A). Data shown are mean ± standard error of the mean (SEM), n = 71–76 accumulated from three independent experiments. Statistical significance determined via one-way analysis of variance (ANOVA) with Bonferroni’s multiple comparisons. p values shown are: **p < 0.01 and ***p < 0.001. (C) Fluorescence confocal z-stacks of the caudal vein region of 2 dpf mpx:GFP larvae (neutrophils) immune labelled with anti-nitrotyrosine (cyan) in the absence of Mm infection. Larvae were injected at the one-cell stage with trib1 RNA (overexpression, OE) and cop1 guide RNA (CRISPants, cpr) using PR (vehicle) and tyrosinase (unrelated guide RNA) CRISPants as negative controls. Scale bar = 30 μm. (D) Corrected fluorescence intensity levels of anti-nitrotyrosine antibody confocal z-stacks shown in (C). Data shown are mean ± SEM, n = 108 cells from 18 embryos accumulated from three independent experiments. Statistical significance was determined using one-way ANOVA with Bonferroni’s multiple comparisons post hoc test. p values shown are: ****p < 0.0001.
-
Figure 8—source data 1
Numerical data for the graph of Figure 8B.
- https://cdn.elifesciences.org/articles/95980/elife-95980-fig8-data1-v1.zip
-
Figure 8—source data 2
Numerical data for the graph of Figure 8D.
- https://cdn.elifesciences.org/articles/95980/elife-95980-fig8-data2-v1.zip
Figure 8—figure supplement 1
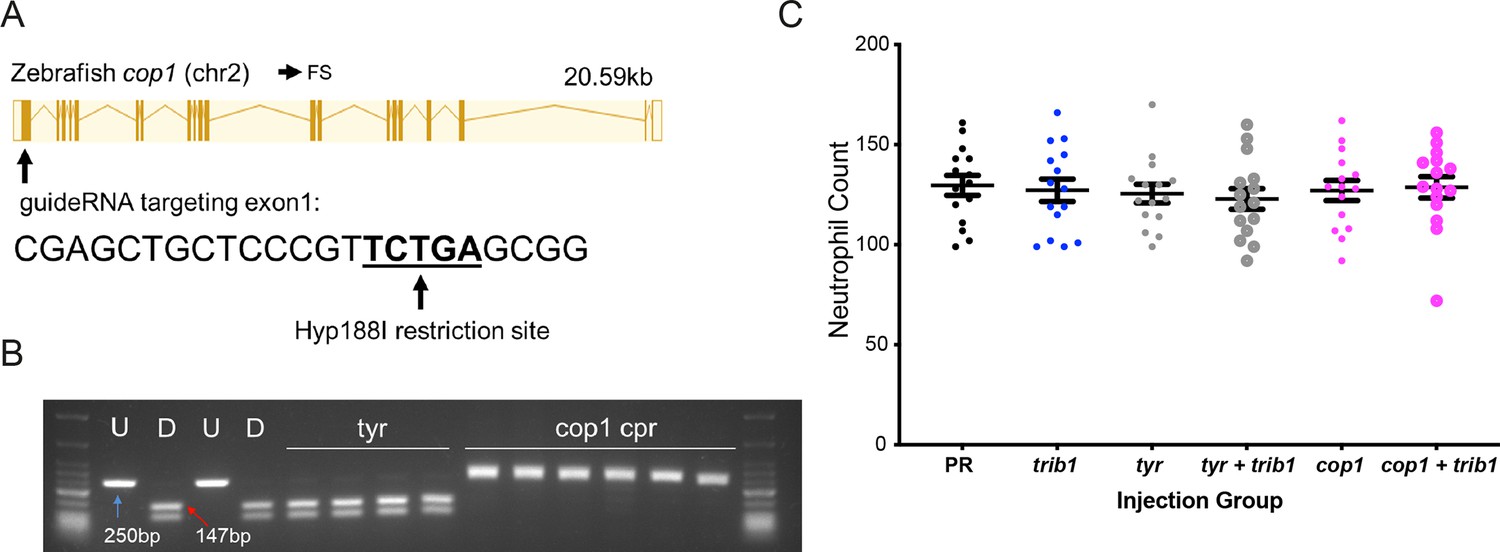
An efficient CRISPR–Cas9 guide RNA was generated for the zebrafish cop1 gene.
(A) The zebrafish cop1 gene (ENSDARG00000079329) has one coding transcript which was used as a basis for CRISPR–Cas9 guide design. Exon map and gene information obtained from Ensembl database. The web tool ChopChop was used to design a cop1 guide RNA with suitable restriction enzyme bind site (black line). PAM cut site (NGG) denoted with blue line. (B) Electrophoresis gel of larvae injected with cop1 guide RNA (cpr) with a Hyp188I restriction digest. The undigested PCR band is 250 bp and the successfully digested band is 147 bp. Two uninjected fish were used as controls without (U) and with (D) digestion. Four tyrosinase (tyr) guide injected larvae had conserved SacII sites while 6/6 cop1 larvae did not digest with Hyp188I indicating a genomic disruption at the CRISPR PAM site. First and last lanes of gel images contain NEB Low Molecular Weight ladder for reference. (C) Wholebody Tg(mpx:GFP)i114 neutrophil numbers in 2 dpf larvae injected at the one-cell stage with either phenol red (PR), trib1 RNA overexpression (trib1), tyrosinase CRISPant (tyr), trib1 and tyrosinase CRISPant (tyr + trib1), cop1 CRISPant (cop1), or cop1 and trib1 CRISPant (cop1 + trib1). Data shown are mean ± standard error of the mean (SEM), n = 15 fish per group.
-
Figure 8—figure supplement 1—source data 1
Raw unedited gel image of Figure 8—figure supplement 1B.
- https://cdn.elifesciences.org/articles/95980/elife-95980-fig8-figsupp1-data1-v1.pdf
-
Figure 8—figure supplement 1—source data 2
PDF containing Figure 8—figure supplement 1B and the original gel image with highlighted bands and samples labels.
- https://cdn.elifesciences.org/articles/95980/elife-95980-fig8-figsupp1-data2-v1.pdf
-
Figure 8—figure supplement 1—source data 3
Numerical data for the graph of Figure 8—figure supplement 1C.
- https://cdn.elifesciences.org/articles/95980/elife-95980-fig8-figsupp1-data3-v1.csv
Tables
Key resources table
| Reagent type (species) or resource | Designation | Source or reference | Identifiers | Additional information |
|---|---|---|---|---|
| Gene (Danio rerio) | TgBAC(mpx:EGFP)i114 | Elks et al., 2011 | i114Tg RRID: ZFIN_ZDB-ALT-070118-2 | Transgenic |
| Gene (Danio rerio) | Tg(lyz:nfsβ-mCherry)sh260 | Buchan et al., 2019 | sh260Tg RRID: ZFIN_ ZDB-ALT-190925–14 | Transgenic |
| Gene (Danio rerio) | Tg(mpeg:nlsclover) | Bernut et al., 2019 | sh436Tg RRID: ZFIN_ZDB-ALT-191219-4 | Transgenic |
| Gene (Danio rerio) | Tg(mpeg1:mCherryCAAX) | Bojarczuk et al., 2016 | sh378Tg RRID: ZFIN_ZDB-ALT-160414–5 | Transgenic |
| Gene (Danio rerio) | Tg(phd3:GFP) | Santhakumar et al., 2012 | sh144Tg RRID: ZFIN_ZDB-ALT-120925-1 | Transgenic |
| Gene (Danio rerio) | TgBAC(il-1β:GFP) | Ogryzko et al., 2019 | Sh445Tg RRID: ZFIN_ZDB-ALT-190307-8 | Transgenic |
| Gene (Danio rerio) | trib1sh628/sh628 CRISPR mutant | This paper | sh628 | CRISPR mutant |
| Genetic reagent (Danio rerio) | trib1 CRISPR–Cas9 guide RNA | This paper | trib1 CRISPR | AGCCCGTGAGCAGATGTCCGCGG |
| Genetic reagent (Danio rerio) | trib3 CRISPR–Cas9 guide RNA | This paper | trib3 CRISPR | TCAACTCGCTTCAGTCGCAGTGG |
| Genetic reagent (Danio rerio) | cop1 CRISPR–Cas9 guide RNA | This paper | cop1 CRISPR | CGAGCTGCTCCCGTTCTGAGCGG |
| Sequence-based reagent | trib1_fw | This paper | PCR primer | TACGGGCATTTCACTTTCGG |
| Sequence-based reagent | trib1_rev | This paper | PCR primer | GTGAGGATCCCAGGAGACC |
| Sequence-based reagent | trib3_fw | This paper | PCR primer | ACCTGTTCAATCTTGTTGTCACA |
| Sequence-based reagent | trib3_rev | This paper | PCR primer | GGAAGGAGGCTGACTGAGTC |
| Sequence-based reagent | cop1_fw | This paper | PCR primer | TTCAATTATGTCAAGCACTCGG |
| Sequence-based reagent | cop1_rev | This paper | PCR primer | CAAGGGTCTTTTCCTGCTTAAA |
| Sequence-based reagent | trib1cloning_fw | This paper | PCR primer | TACGGGCATTTCACTTTCGG |
| Sequence-based reagent | trib1cloning_rev | This paper | PCR primer | CAGTCCTTAAACCCGACACG |
| Sequence-based reagent | trib2cloning_fw | This paper | PCR primer | CACCATGAACATACAGAGATCCAG |
| Sequence-based reagent | trib2cloning_rev | This paper | PCR primer | TTGCTACATCACTCAACGCC |
| Sequence-based reagent | trib3cloning_fw | This paper | PCR primer | CAACTAAGTGCGCCTGTAGT |
| Sequence-based reagent | trib3cloning_rev | This paper | PCR primer | TGCCCTTGAACTCTGCATAC |
| Genetic reagent (Danio rerio) | tyrosinase CRISPR-Cas9 guide RNA | Isles et al., 2019 | tyr CRISPR | GGACTGGAGGACTTCTGGGG(AGG) |
| Strain, strain background (Mycobacterium marinum) | Mycobacterium marinum strain M (ATCC #BAA-535), containing the pSMT3-mCherry vector | van der Sar et al., 2009 | Mycobacterium marinum strain M ATCC #BAA-535 | Transgenic |
| Antibody | Anti-nitrotyrosine antibody (rabbit polyclonal) | Merck | 06–284; Merck Millipore | (1:200) |
| Antibody | Anti-rabbit Alexa Fluor 633-conjugated secondary antibody (goat polyclonal) | A-21071; ThermoFisher | (1:500) | |
| Commercial assay, kit | DIG RNA Labeling Kit (SP6/T7) | Roche | 11175025910; Roche, Merck | |
| Commercial assay, kit | mMessageMachine SP6 Transcription Kit | Invitrogen | AM1340; Invitrogen | |
| Commercial assay, kit | QIAquick Gel Extraction Kit | QIAGEN | 28704; QIAGEN | |
| Commercial assay, kit | Zero Blunt TOPO PCR Cloning Kit | Invitrogen | K280002; Invitrogen | |
| Software, algorithm | BASiCz | Blood atlas of single cells in zebrafish | https://www.sanger.ac.uk/tool/basicz/ | |
| Software, algorithm | ChopChop | ChopChop | http://chopchop.cbu.uib.no/ | |
| Software, algorithm | Primer3 | ELIXIR | https://primer3.ut.ee/ | |
| Software, algorithm | LASX | Leica Microsystems | https://www.leica-microsystems.com/products/microscope-software/p/leica-las-x-ls/downloads/ | |
| Software, algorithm | AlphaFold DB | Deepmind/EMBL-EBI | https://alphafold.ebi.ac.uk/ | |
| Software, algorithm | ChimeraX | UCSF | https://www.cgl.ucsf.edu/chimerax/ | |
| Software, algorithm | Prism 10 | Graphpad | https://www.graphpad.com/ |
Table 1
Summary of CRISPR-Cas9 guideRNAs, relevant primers and restriction enzymes used for genotyping.
| Gene | guideRNA (5’–3’) | F primer (5’–3’) | R primer (5’–3’) | Enzyme |
|---|---|---|---|---|
| trib1 | AGCCCGTGAGCAGATGTCCGCGG | TACGGGCATTTCACTTTCGG | GTGAGGATCCCAGGAGACC | SacII |
| trib3 | TCAACTCGCTTCAGTCGCAGTGG | ACCTGTTCAATCTTGTTGTCACA | GGAAGGAGGCTGACTGAGTC | Mwol |
| cop1 | CGAGCTGCTCCCGTTCTGAGCGG | TTCAATTATGTCAAGCACTCGG | CAAGGGTCTTTTCCTGCTTAAA | Hyp188I |
Additional files
Download links
A two-part list of links to download the article, or parts of the article, in various formats.
Downloads (link to download the article as PDF)
Open citations (links to open the citations from this article in various online reference manager services)
Cite this article (links to download the citations from this article in formats compatible with various reference manager tools)
Tribbles1 is host protective during in vivo mycobacterial infection
eLife 13:e95980.
https://doi.org/10.7554/eLife.95980


